Article

Analyzing Public Opinions Regarding Virtual Tourism in the Context of COVID-19: Unidirectional vs. 360-Degree Videos

by
Hoc Huynh Thai
1,2,†,
Petr Silhavy
1,*,†,
Sandeep Kumar Dey
3,4,†,
Sinh Duc Hoang
3,5,†,
Zdenka Prokopova
1,† and
Radek Silhavy
1,†
1
Faculty of Applied Informatics, Tomas Bata University in Zlin, Nad Stranemi 4511, 76001 Zlin, Czech Republic
2
Faculty of Information Technology, School of Engineering and Technology, Van Lang University, Ho Chi Minh City 700000, Vietnam
3
Faculty of Management and Economics, Tomas Bata University in Zlin, 76001 Zlin, Czech Republic
4
Czech Mathematical Society Matematický ústav AV ČR, v.v.i., Žitná 609/25, 11000 Praha 1, Czech Republic
5
Department of Economics Finance, Ho Chi Minh City University of Foreign Languages Information Technology, Ho Chi Minh City 700000, Vietnam
*
Author to whom correspondence should be addressed.
These authors contributed equally to this work.
Information 2023, 14(1), 11; https://doi.org/10.3390/info14010011
Submission received: 6 November 2022 / Revised: 15 December 2022 / Accepted: 19 December 2022 / Published: 26 December 2022
(This article belongs to the Special Issue Techniques and Data Analysis in Cultural Heritage)

Abstract

:
Over the last few years, more and more people have been using YouTube videos to experience virtual reality travel. Many individuals utilize comments to voice their ideas or criticize a subject on YouTube. The number of replies to 360-degree and unidirectional videos is enormous and might differ between the two kinds of videos. This presents the problem of efficiently evaluating user opinions with respect to which type of video will be more appealing to viewers, positive comments, or interest. This paper aims to study SentiStrength-SE and SenticNet7 techniques for sentiment analysis. The findings demonstrate that the sentiment analysis obtained from SenticNet7 outperforms that from SentiStrength-SE. It is revealed through the sentiment analysis that sentiment disparity among the viewers of 360-degree and unidirectional videos is low and insignificant. Furthermore, the study shows that unidirectional videos garnered the most traffic during COVID-19 induced global travel bans. The study elaborates on the capacity of unidirectional videos on travel and the implications for industry and academia. The second aim of this paper also employs a Convolutional Neural Network and Random Forest for sentiment analysis of YouTube viewers’ comments, where the sentiment analysis output by SenticNet7 is used as actual values. Cross-validation with 10-folds is employed in the proposed models. The findings demonstrate that the max-voting technique outperforms compared with an individual fold.

1. Introduction

Information science and information technology are closely connected to tourism. In 2014, Pedrana claimed that information technology had supported the tourism revolution by altering conventional tourism and product experiences, culminating in a virtual tourism model [1]. The basic foundation for virtual tourism is the natural tourist landscape. By creating an online environment, people might be able to enjoy immersive travel while staying at home, and the Internet or virtual technology will surpass the appeal of physical discovery [2,3,4,5].
Even though the online travel industry has received much attention as a new kind of tourist industry, there are still some disagreements over people’s views and opinions of this model. According to Dale, 2016; Julia Lekgau, Harilal and Feni, 2021; Yang et al., 2022 [6,7,8], virtual tourism has developed a new tourist model with several benefits, for example, recreating the initial chronological arrival of a destination and preserving intangible heritage. It may make tourism more accessible to travelers with physical disabilities, financial constraints, or limited time [9,10]. Opposers dispute the claim that visitors might not have an outstanding virtual adventure because all experiences must engage with the surrounding world to be entirely inspired [5,11]. Some heritage destination administrators are also afraid that the online adventures may jeopardize the factual validity of the place and will refuse to use them.
Even though the virtual travel industry has been available for more than a dozen years, most travellers are still unaware of it and have many comments; some might have positive comments, while others may have negative or neutral comments. In the prior literature, the authors [12] observed that virtual travel problems were centred on non-crisis and ordinary scenarios and recommended investigations to inspect the prospects of virtual tourism during and after crisis settings. Kim et al. argue that virtual travel is a viable option when access to the actual world is restricted [11]. What is the proper perception of viewers toward virtual travel in a crisis? It is still challenging to provide a definitive response. Importantly, elucidating the popular understanding of virtual travel will give additional perspectives and create possible recommendations for the long-term growth of virtual travel.
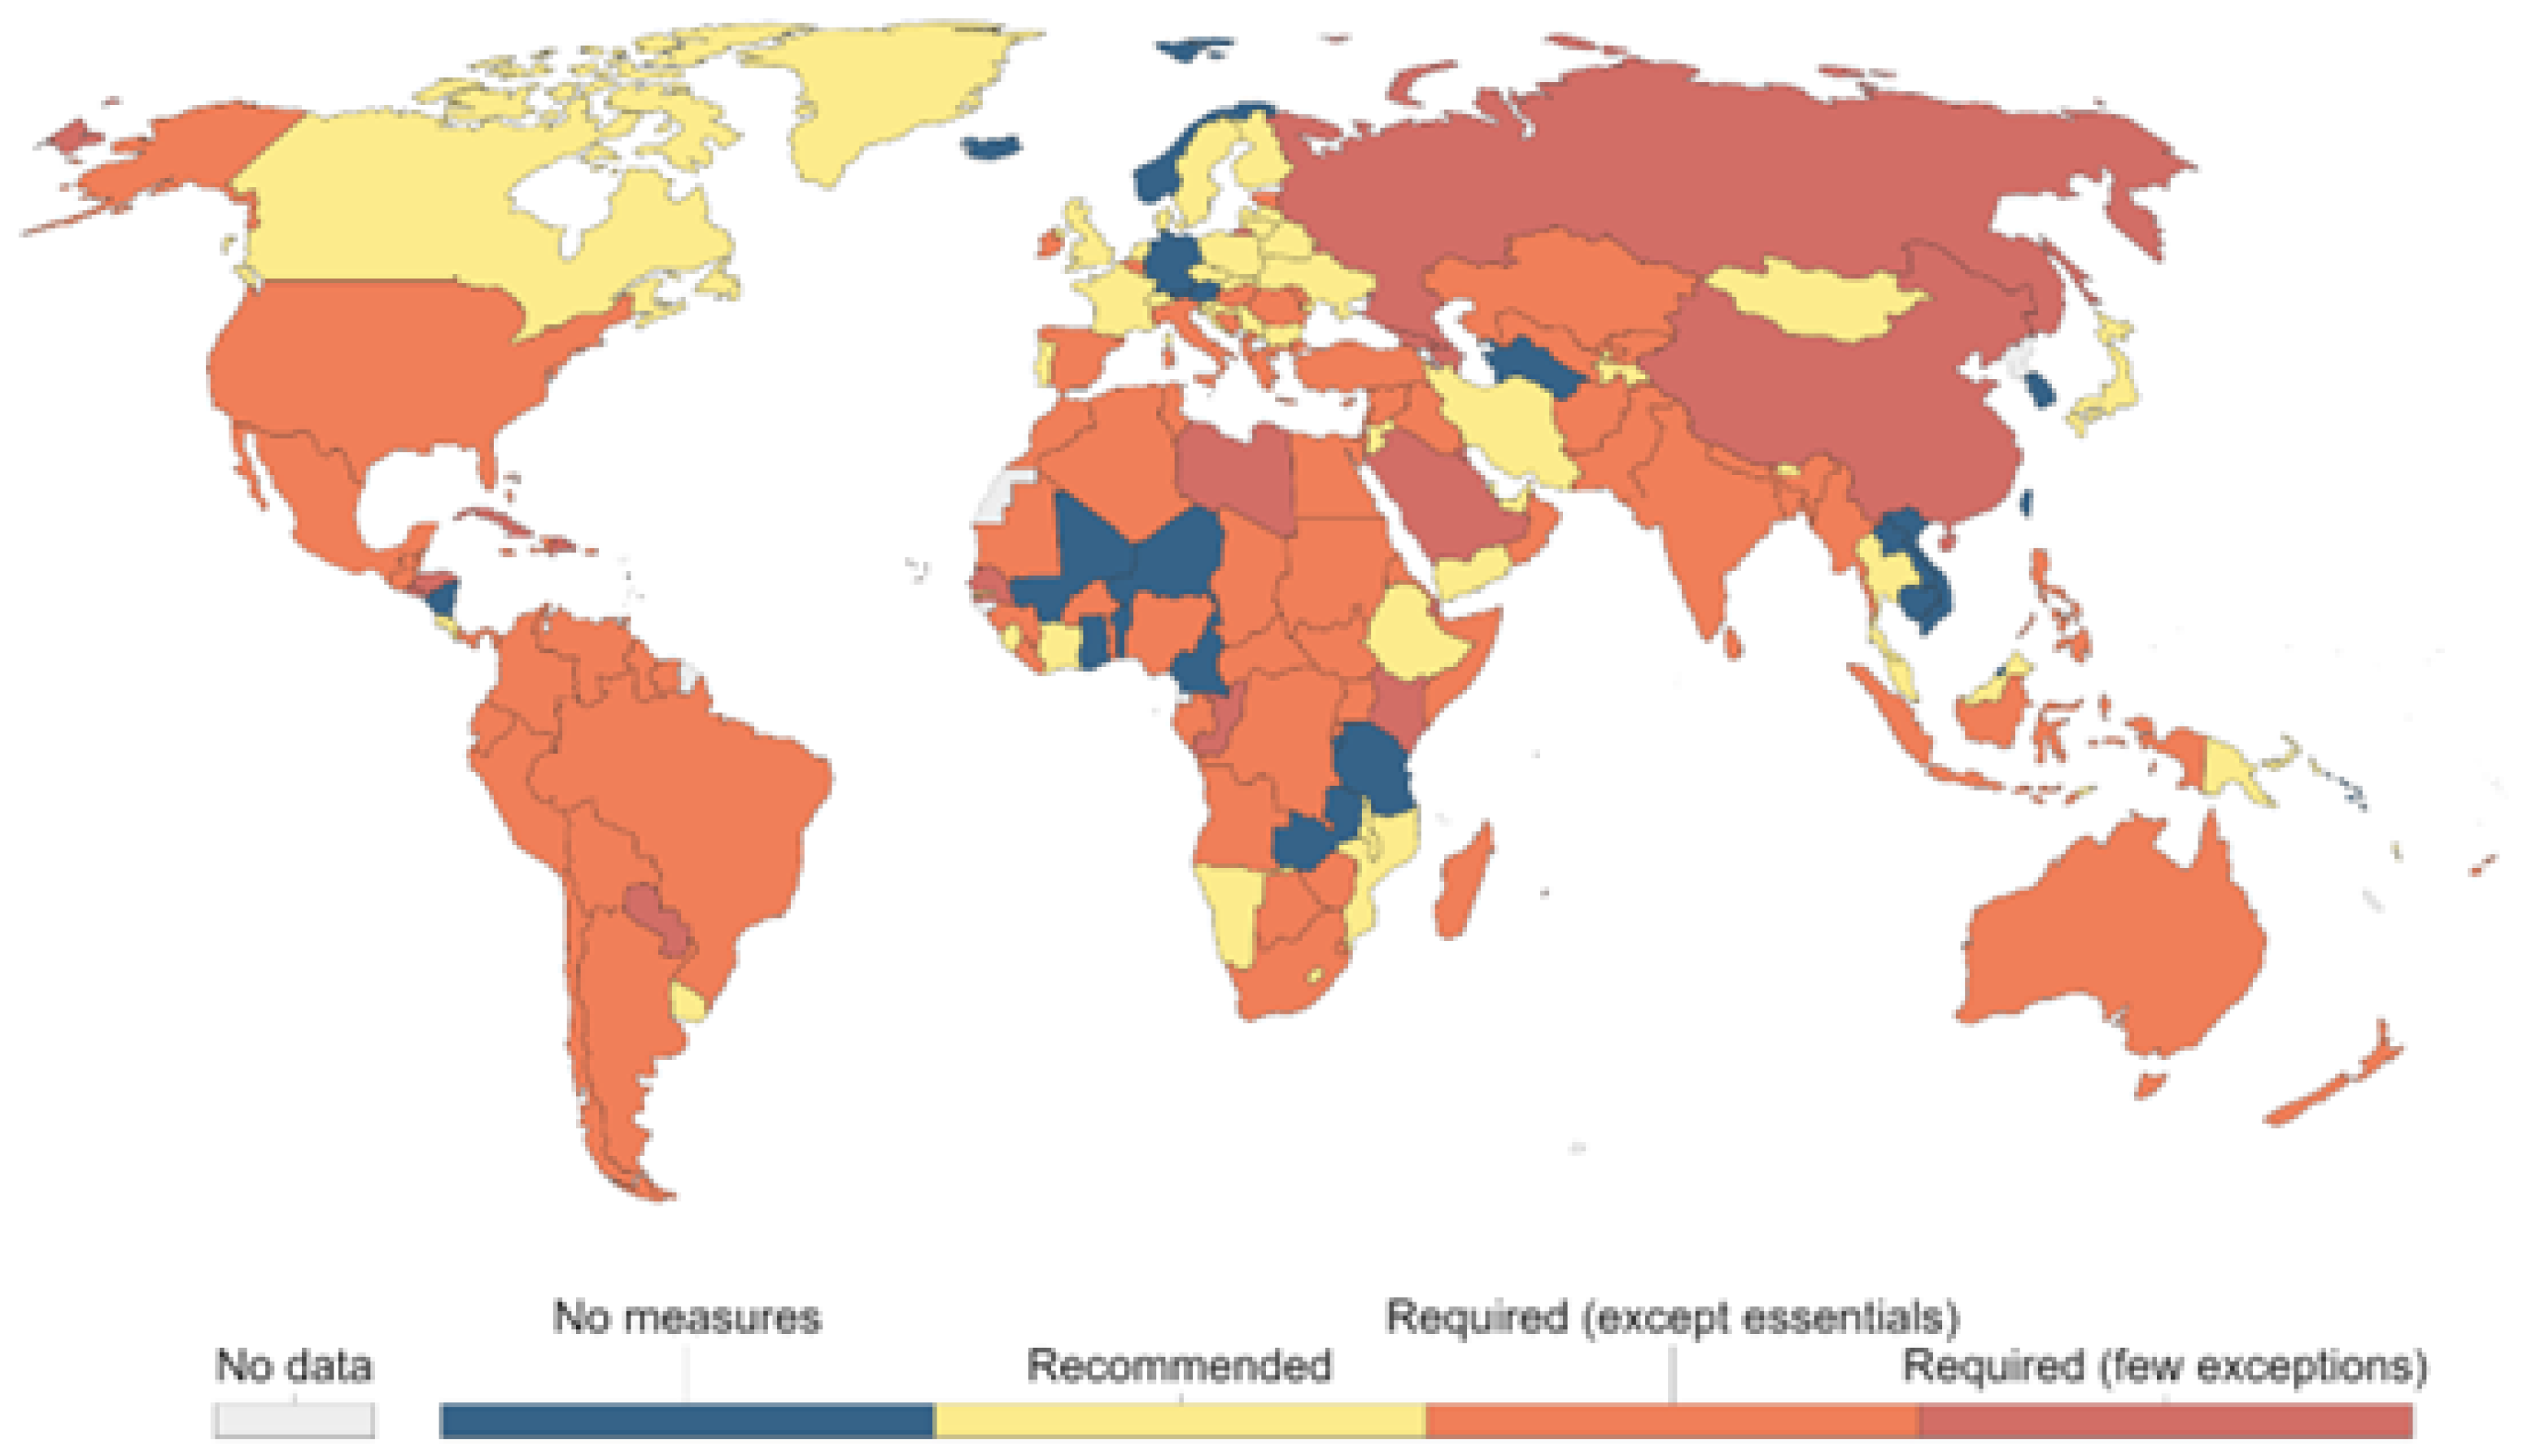
Since the beginning of COVID-19, worldwide financial and social growth has suffered significantly. COVID-19, in contrast to previous pandemics, has a more extended incubation duration and less frequent signs, and it disperses more rapidly and widely [13]. Avoiding the public and movement is an effective strategy for minimizing transmission of the COVID-19 pandice. In just several months, the approach of the international tourist strategy transitioned from unrestricted travel to limited tourism [14]. Most nations have implemented travel bans [13]. According to OurWorld in Data [15], the highest possible travel ban density might have been around May 2020, as shown in Figure 1 and Figure 2.
Youtube is the largest video platform in the world [16]. It produces millions of metadata in audio–video content that enables researchers to operate NLP and investigate opinions and sentiments [17]. The analysis of feedback in the form of comments left by viewers on Youtube channels is an essential source of unstructured data for further research [18,19]. Additionally, Youtube is a dedicated video-sharing platform that amasses a significant amount of data that can be channeled to study the sentiments of individuals (also known as opinion mining) towards a product or phenomenon [20].
Comments from Youtube videos have been historically studied to mine individuals’ opinions regarding trending topics [21]. Dubovi and Tabak (2020) in their study involving knowledge co-creation from Youtube videos revealed that “comments went beyond information sharing to argumentative negotiation, reaching a higher level of knowledge construction” [22]. They have further added that Youtube comments provide an informal setting for science discussions. Yu, Wen, and Yang (2020) extracted comments from Youtube videos to explore the visitation intention of individuals wth respect to suicide tourism [23]. Their study reveals that unobserved social proclivities can be revealed from mining Youtube video comments. Similarly, Raja Chakravarthi et al. (2021) examined Youtube comments to identify hate/violent speech against the lesbian, gay, bisexual, transgender, and queer community [24]. Compared to content from other content sharing platforms such as Snapchat, Instagram, and Imgur, content from Youtube is more generationally diverse and far-reaching [24]. Furthermore, comments from Youtube videos have been investigated to understand a plethora of sociocultural processes and societal norms such as cyberbullying of overweight people [25], anti-NATO sentiment [26], ethnic insults [27], and misogyny [28]. The antecedents presented herewith provide substantial empirical merit to the current study’s authors to adopt Youtube commentaries as their preferred medium of analysis.
This study investigates public opinions regarding virtual tourism in the context of COVID-19 via watching YouTube [5]. The percentage of viewers who watch 360-degree videos vs. unidirectional movies was measured. We also summarized the frequency of watching videos during the peak of COVID-19 compared with other periods. Such problems have not yet been addressed and must thus be investigated further.
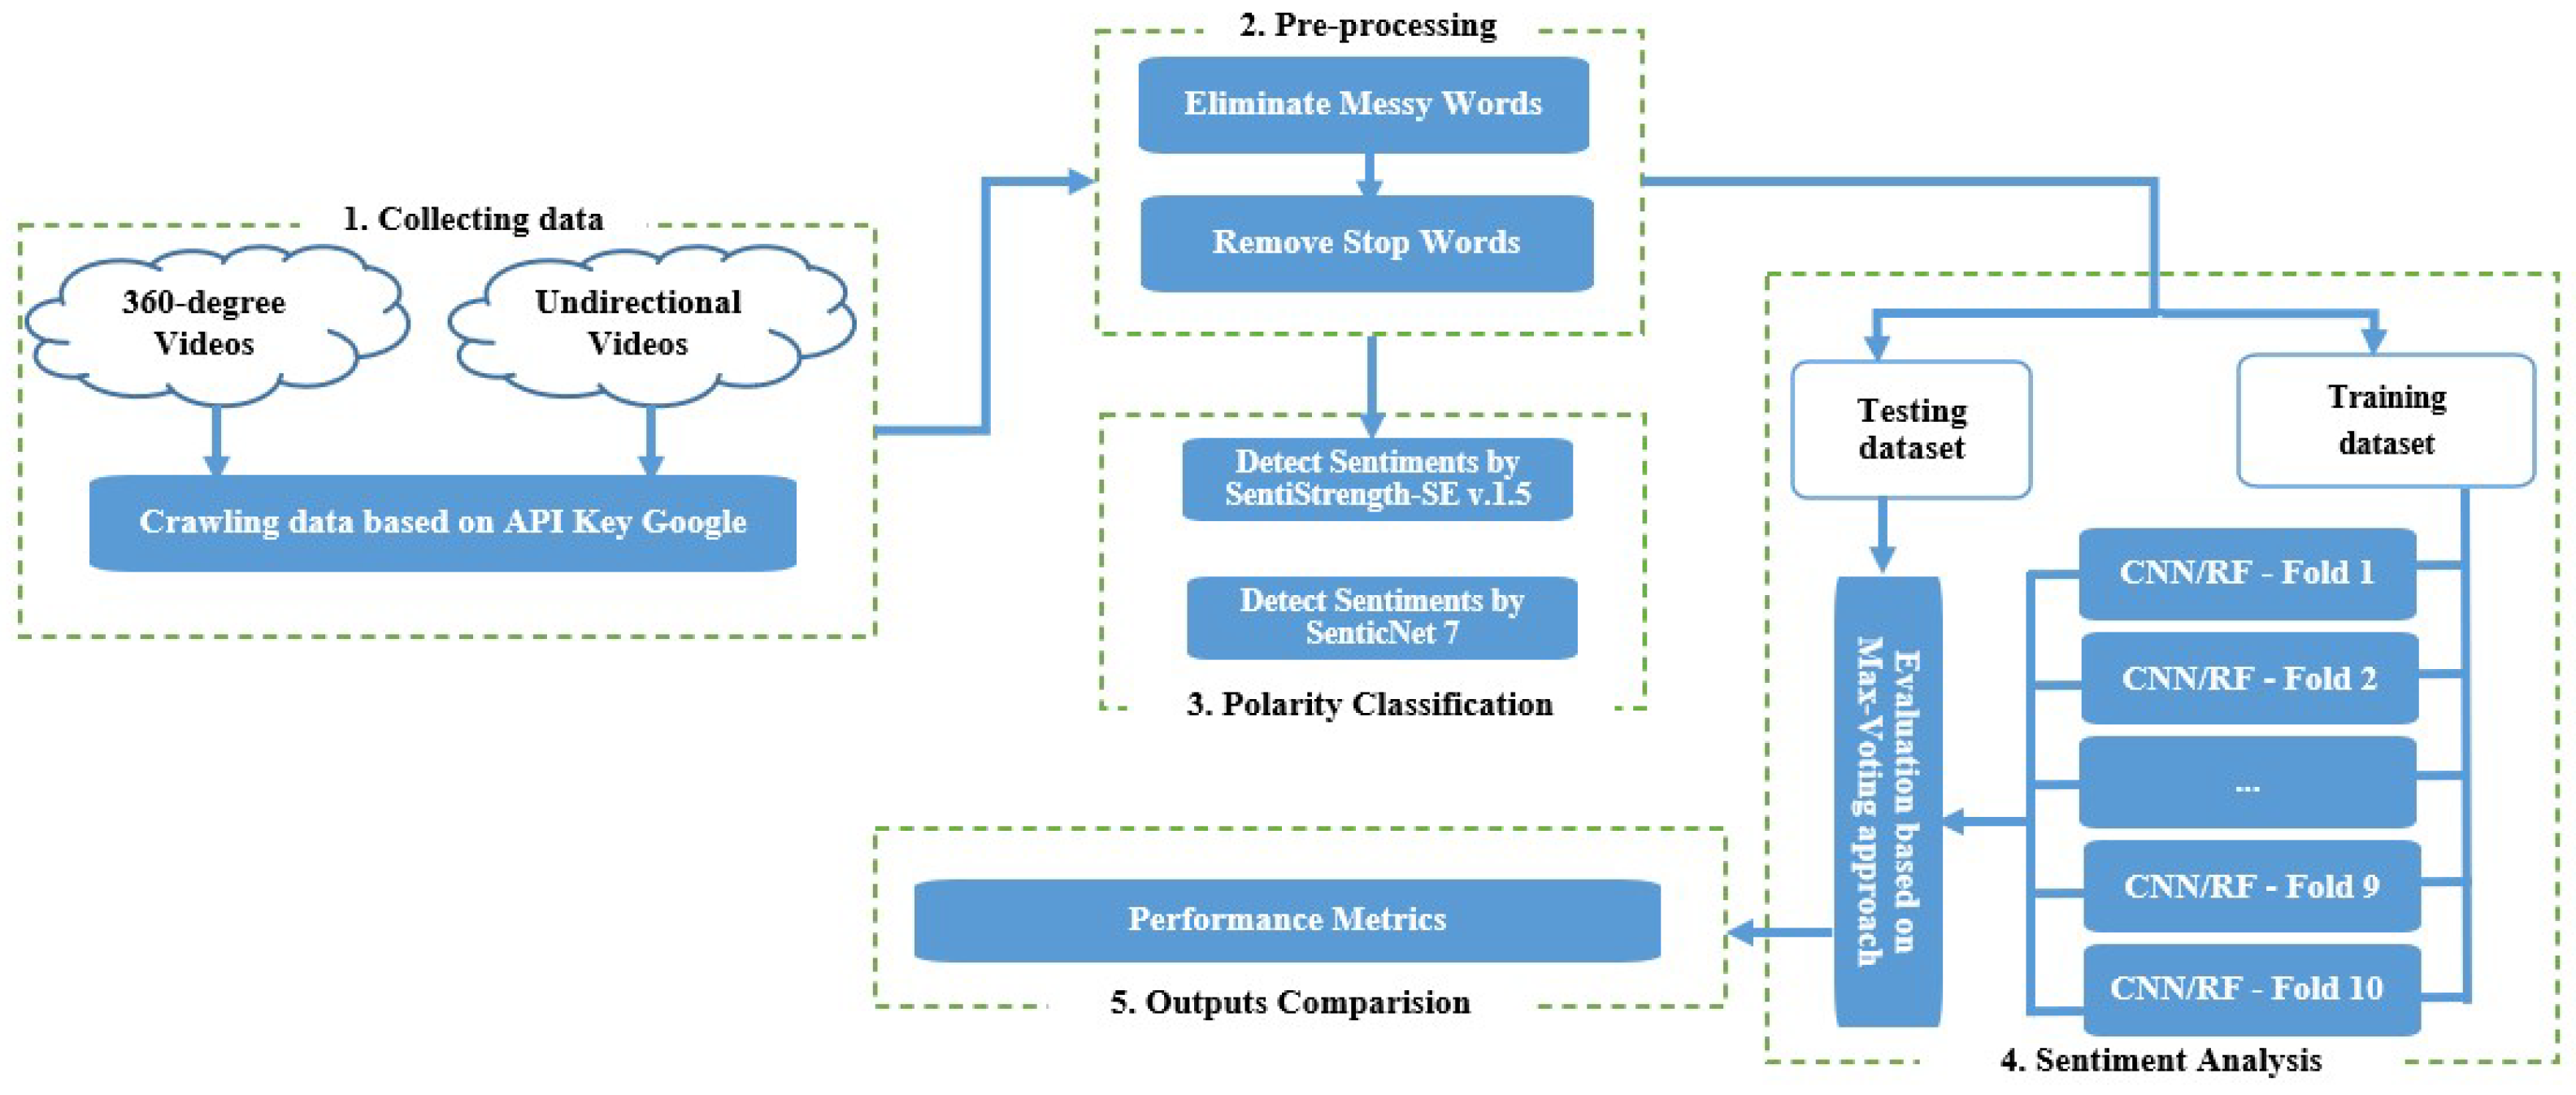
Regarding the relevant dataset for this research, online comments from YouTube were collected using Python. There are two kinds of videos that were collected, one is 360-degree [29], and the other is unidirectional videos. Each video should have two more million views and more than one thousand comments. Furthermore, a five-level sentiment analysis technology [5] to investigate the features and laws of public opinion toward online travel and the SentiStrength-SE [30] tool was applied in this paper.

2. Related Works

Sentiment analysis (SA), often known as opinion mining, is a natural language approach for examining people’s feelings on a particular product or problem [31]. SA is the automatic examination of an online document, such as a blog, remark, review, or comment, to decide if it is a solid positive, positive, negative, strong negative, or neutral (Pang & Lee, 2008). SA may be used to predict polarity results [32], give product information to businesses and organizations, automate product descriptions or summaries in reviews, and even forecast the stock market on online shopping sites [33].
In general, the categorization of emotions is crucial in contemporary SA research. This method assigns the opinion polarity of words and phrases that express sentiments to identify a document’s subjectivity/objectivity orientation, positive, negative, or neutral [34]. Two types of sentiment classification strategies are reported in the literature, supervised and unsupervised SA [33]. This type of classification is related to the method used by the computer to generate sentiment classifications. Machine learning techniques such as support vector machine (SVM), maximum entropy, k-nearest neighbour, Naïve Bayes, Decision Tree, and Artificial Neural Network are utilized [20,33,35,36]. The supervised learning approach makes use of labelled training data that have been annotated by hand, as well as testing data.
On the other hand, the unsupervised technique does not require labelled training data. The current paper’s primary methods are linguistics-based and lexicon-based [37]. The lexicon-based approach entails statistically calculating feelings based on the text’s semantic orientation of words or phrases [38]. The fundamental premise behind lexicon-based techniques is that the most critical indicators of emotion in the natural language literature are words that communicate opinions. A pre-compiled lexicon of positive and negative phrases is necessary for this strategy.
SentiWordNet [39] is another well-known lexical resource intended exclusively for sentiment classification and analysis applications. Based on linguistics, the SA divides natural language information into more than individual constituent words and sentences. It also detects their syntactic structures to determine a syntactic part-of-speech category, such as an adjective or verb phrase, most likely to be mentioned in an opinion. Each word’s polarity score in the text is employed to categorize the emotion of the textual material. For example, if a phrase in the lexicon matches a positive emotion score, the material’s positive polarity score is increased. As a result, if the positive polarity score surpasses the negative polarity score, the substance is deemed positive; otherwise, it is termed negative. A substantial study has been conducted to locate frequently used words reflecting sentiment in an online review using a learning lexicon-based technique and natural language processing to reveal typical terms that indicate opinion mining [34,40].
Thet et al. [30] suggested a linguistic approach for the SA of topic postings in discussion forums based on clause-level opinion analysis. SentiWordNet, a purpose-built domain lexicon (movie review domain), obtained the above word emotion ratings. The emotion score for each phrase was then calculated by analysing the natural language syntactic relationships of words, using syntactic dependency trees and taking pattern rule into account.
Thelwall et al. [41] created the SentiStrength technique enhanced by machine learning to evaluate consumer behaviour and sentiment strength in textual data. Islam et al. utilized SentiStrength to create a database to classify specific content in the double polarity (positive or negative), and SentiStrength identified 298 positive and 465 negative phrases [30]. In addition, Alrehaili et al. adopted SentiStrength to classify positive and negative sentiments based on the comments of YouTube videos for kids [39]. However, SentiStrength-SE also includes domain-specific phrases in the software development area that do not contain any sentiments [30]. According to [42,43], SentiStrength-SE is more efficient than the general-domain lexicon at detecting sentiment polarity in application circumstances. Based on the advantages of SentiStrength-SE, this article will use it to classify polarity sentiment.
Last but not the least, SenticNet7 was proposed by E Cambria et al. [44]. It is a level of acquaintance used by the sentic computing structure for concept-level sentiment analysis [45]. It involves polarity recognition and emotion identification by leveraging the denotative and connotative information in connection with phrases and multi-word expressions rather than depending exclusively on term co-occurrence frequency ranges. Furthermore, Sentic APIs (sentic.net/api) are a set of application programming interfaces built to handle numerous sentiment analysis activities in various languages. Because all APIs are built on the Sentic Computing Structure, they use a combination of SenticNet and deep learning.
On the other hand, various sentiment analysis techniques have been adopted, ranging from tree-based classifiers to neural network-based methods [20,36,46]. They include Naïve Bayes, Decision Trees, Random Forest, Support Vector Machines, Gradient Boosting, Multiplayer Perceptron, and Convolutional Neural Networks.
  • Multi-layer Perceptron (MLP) is a feedforward network [47,48]. Its components have three layers: input, hidden, and output. It is wholly connected, with each node linked to every node in the before and the following layer. The input layer will receive a list of factors, for example, factor 1 to factor k, as a list dataset for training. MLP might be trained to learn new things. A set of the training dataset, consisting of a group of input and output vectors, is required for training. It is continually provided with training data while training, and the network’s weights are modified until the proper input–output mapping is achieved. Pattern categorization, recognition, prediction, and approximation are MLP’s most typical uses. In 2020, M. Almaghrabi et al. adopted this model to improve sentiment analysis in Arabic and English languages [49]. Moreover, Xia et al. (2021) also used MLP in Tweet sentiment analysis of the 2020 United State Presidential Election [50].
  • The Naïve Bayes Classifier is a technique based on Bayes Theorem [35,46]. The Naïve Bayes classifier works on the idea that the existence of one attribute in a class has nothing to do with the presentation of any other feature. For massive data sets, the Naïve Bayes model is beneficial. Naïve Bayes is renowned for outperforming even the most complex classification systems due to its simplicity. According to Kausar et al. [46], Google currently uses it to determine whether or not an e-mail is spam.
  • Decision Trees are a classification method commonly utilized in the scientific world [46]. Text is classified into sentiment polarity using the decision tree. It belongs to the category of machine learning. Several studies [20,33,35,36] use decision trees to sort positive, negative, and neutral comment categories.
  • Support Vector Machine (SVM) might be the most famous machine learning technique [46]. Since the 1990s, it has been popular and is still the leading strategy for a high-performance algorithm. It is a discriminant classifier that builds an ideal hyperplane for new sample classification by using labelled training data. The SVM model can predict unknown input based on the training.
  • Random Forest (RF) is a branch of artificial intelligence that can be used for regression and classification [46]. It also performs reasonably well in the contexts of dimensional-reduction approaches, incomplete data, outlier values, and other critical processes in data discovery. It is an ensemble classifier in which a group of poor models is combined to create a better model. Each tree assigns a categorization to a new object’s various attributes. The forest selects the categorization with the most votes and averages the outputs of the different trees. In 2019, Karthika et al. used RF to classify positive, neutral, and negative customer opinions [51]. They also stated that RF outperformed SVM. Furthermore, Ravinder Ahuja et al. (2019) conducted an investigation that showed that RF might perform more accurately than DT, SVM, and Naïve Bayes [52].
  • Moreover, deep learning-based approaches, particularly convolutional neural networks (CNNs), have demonstrated consistent performance across many applications in medical image processing and documenting classification problems in recent years. As mentioned by Rani et al. (2019), CNNs are four-layer feedforward neural networks [53]. The first is the input layer, representing sentences n × k in size. The second layer is the convolutional layer, followed by the global max-pooling layer, and finally, the fully connected layer, which produces output results. The convolutional layer is CNN’s primary building block because it performs most computations. A feature extraction layer extracts local features using filters, then produces a feature map using the convolutional kernels function and sends it to the pooling layer. In 2022, Priyanka Malhotra et al. presented research in the area of medical image segmentation using CNN [54]. They highlighted the benefits and drawbacks of the most widely used deep learning-based models used for the segmentation of medical lesions. Similar research was also studied by Sarvamangala et al. (2022), they stated that CNN is a common method for resolving medical image problems [55]. In addition, Chetanpal Singh et al. proposed CNN approach for sentiment analysis of COVID-19 reviews on Twitter [56]. The authors stated that their approach outperforms SVM and RF. Furthermore, Hoc et al. (2022) studied MLP, deep learning, and the multiple regression model in terms of software effort estimation; they showed that the deep learning approach leads to higher accuracy than the other [57]. Based on this discussion, we use the CNN approach to build a classification model based on collected datasets. The performance of CNN approach also compared with RF model.

3. Problem Statement

Recently, exceptional methods for determining text polarity have been proposed by scholars. They usually divide comments into five categories: strongly positive, positive, negative, strongly negative, and neutral [20,34,36,37,40,41,58]. The positive class includes documents that use positive language. In contrast, the negative class includes documents in which the user has a negative attitude toward virtual tourists, and the neutral class consists of neither positive nor negative documents. We used SentiStrength-SE and SenticNet7 to identify the five polarity classes in this study. For such a purpose, we employed a variety of arguments driven by participants’ attitudes when travelling to scenic destinations via YouTube as an input dataset.

4. Research Questions

The following research questions (RQs) should be answered in this study:
  • RQ1: How do sentiments differ between users exposed to 3D and unidirectional videos?
  • RQ2: How does the performance differ between SenticNet7 and SentiStrength-SE?
  • RQ3: What is the most precise classification algorithm to gauge the performance of the sentiment analysis CNN-based model?

5. Data Collecting

In this section, we studied six videos from Angel Falls, Sahara Desert, and Victoria Falls, where three videos for each are 360-degree, and three other ones are the same places are unidirectional. Each place has a video with at least 1000 comments and more than two million views. Their comments were collected on 6 April 2022.
Table 1 shows they are categorized into six datasets ranging from Dataset 1 to Dataset 6. In addition, Dataset 7 is an aggregate of comments from six datasets, which are considered in this study. The SentiStrength-SE python library and natural language tool kit (NLTK) have been selected for coding.
The three significant attractions were selected because they are all on the UNESCO world heritage sites list [59]. Interestingly, all of the usually destinations are transnational (spanning across one or more countries). Individually speaking, Victoria Falls, which falls at the cross-border between Zambia and Zimbabwe, attracted 639,000 visitors in 2019 [60]. Angel Falls, which is the world’s largest free-flowing waterfall located in Venezuela, recorded 429,000 tourists [61]. The Sahara Desert, which spans the northern African region, received around 12 million visitors [62].

6. Used Methods

6.1. Comment Gathering

This section aims to present the collection of comments on specific YouTube videos. This work was completed with the help of Python programming. It uses the web API’s HTTP GET function to retrieve comments from a video depending on its URL. However, the retrieved comments differ in terms of the languages and concepts used by the users. As a result, we had to undertake further cleaning on this unclear commentary to construct the data sets.

6.2. Data Pre-Processing

Comment content obtained from YouTube might feel messy, such as incomplete sentences, emojis, and different languages. These are unnecessary for sentiment polarity categorization. Such comments should be recognized, and these characters should be removed from the dataset. The NLTK library and python programming were adopted to carry this out. Following the extraction of the comments, the following adjustments were made:
  • We eliminated any terms that are not relevant to the suggested methodology, such as hyperlinks, dates, special characters (*, /, !, @, #, ?, &, %), and various languages (Arabic, Hindi, Vietnamese, etc.).
  • We removed all punctuation, for example, the period (“.”), space (“ ”), commas (“,”), semicolons (“;”), dash (“-”), etc.
  • The most common words such as “the,” “is,” “this,” and “that”, called stop words, were removed from comments.

6.3. Sentiment Analysis Classification

Research on the subjectivity (neutral vs. emotionally loaded) and polarity (positive vs. negative) of a text is known as sentiment analysis [31]. It is based on sentiment lexicons, which are large collections of words that have each been annotated with a positive or negative orientation (i.e., prior polarity). The overall sentiment of a text is thus calculated based on the polarity of the words it contains. As mentioned above, SentiStrength-SE is a popular tool to carry out sentiment analysis. It works without additional applications or devices [30]. This technology detects emotional responses, emojis, negating words, booster words, slang, and idiomatic expressions. SentiStrength-SE generates a range of [−5, 5] for each sentence. According to [63], SentiStrength-SE measures five classes of sentiment, from strongly negative to strongly positive (see Table 2).
The sentiment analysis classification is presented in Table 2. This table uses the SentiStrength-SE approach to define positive, negative, or neutral polarity. A text is positive if the emotion score ≥ 1 and strongly positive if it is larger than 4. In addition, it is strongly negative if the score is less than −4 and negative if it is in the range of −4 to −1. Otherwise, it is neutral.
SenticNet 7 is built in four sections, as mentioned in [44]. Lexical substitution is a technique for identifying groups of concepts that have similar meanings (primitive sets). Second, the compelling similarity is applied to these semantically related sets to refine them. Then, each primitive set is named after its most representative term and paired with its semantic inverse (e.g., ACCEPT versus REJECT). Finally, primitive sets are refined further by examining the multidimensional path taken by each antithetic primitive pair. Sentic API (supported by sentic.net/api/) can be used to analyse the sentiment analysis. The structure of API is ‘https://sentic.net/api’ + LANG + ‘/’ + APIKEY + ‘.py?text=’ + “input text”. Special formatting, ampersands, hashtags, semicolons, and braces are not required for “input text”. However, in the preprocessing phase, they should be replaced with colons (:) or removed entirely. Currently, this API is supported by several “LANG”, such as English (en), Spanish (es), Portuguese (pt), French (fr), German (de), Italian (it), Indonesian (id), and Vietnamese (vi). However, we need to request SenticNet system to receive APIKEY.

6.4. Sentiment Analysis Proposal

This section discusses NLP-based sentiment analysis based on user comments from selected YouTube videos to extract sentiment polarity classification. As illustrated in Figure 3, the suggested procedure is broken down into five parts. Firstly, the comment collection and preparation module take data (comments) from given YouTube 360-degree/unidirectional videos and performs some linguistic pre-processing to prepare for the following procedure. To start collecting data from YouTube, we went to the Google Developers Console and obtained a YouTube Data API key [64]. According to [19], the new Data API keys have a daily quota of 10,000 queries, allowing users to access public YouTube videos. The YouTube Data API is available in a variety of computer languages. This study focuses on Python gathering comments using the Requests module to make API requests. Secondly, the processed text is subjected to NLP-based algorithms to produce data sets. The regular expression (re library) is used to remove messy words, for instance, hyperlinks, dates, and special characters. Moreover, the most common words, or stop words (“the”, “an”, “a”, “a”, etc.), are eliminated by the Natural Language Toolkit (NLTK) Python library, version 3.7. As mentioned in Section 6.3, we used SentiStrength-SE and SenticNet7 to analyse sentiment polarity in the next step. As a result, the collected datasets generate sentiment polarity based on the relevant comments.
In the following step, the collected datasets were used for both training and testing with a ratio of 80 and 20, respectively. Cross-validation with 10 folds is adopted in the training process for CNN and RF models, where nine distinct folds are chosen as the training dataset and the other one is used as the validation dataset. Each experiment was executed for 200 epochs with a batch size of 32, and the learning rate was 0.001. The purpose was to determine whether a specific comment had various attitudes based on the polarization of key characteristics. Thus, each comment is encoded by one-hot encoding with three given valid labels, negative ([1, 0, 0]), neutral ([0, 1, 0]), and positive ([0, 0, 1]), which are a kind of binary outputs. As a result, we have ten distinct groups, namely Fold 1 to Fold 10. Fold 1 stands for the output of a model that uses Fold 1 as validation and is similar to the other nine different folds. A max-voting approach was adopted to combine each output obtained from each group [65,66]. It might be a suitable approach to integrate predictions from many outputs because the outputs of those predictions are in binary forms. It involves each predictive model making a prediction and casting a vote for each sample. The final prediction consists of the sample that received the most votes.

6.5. CNN Architecture for Sentiment Analysis

Figure 4 represents the CNN architecture for sentiment classification based on collected comments data analysis. CNN receives input in the form of sentences depicted as a matrix. Each row of the matrix symbolizes a single token, which is usually a word but might also be a character. In other words, each row is a vector representing a word. These vectors usually generated word embedding (word2vec) by using GoogleNews-vectors-negative300.bin. They could also be one-time vectors that index the word into a dictionary. The output is fed into the embedding layer.
Next, a group of filters is employed to a sliding window of length h over each phrase in the convolution layers. These filters are adopted for each probable window of words in the phrase. These filters produce several feature maps. Finally, the previous layer’s output is passed to a fully connected softmax layer. Because are three classes (negative, neutral, and positive) to measure the error probability between the prediction and the actual label, the cross-entropy function is used in the softmax layer.

7. Performance Metrics

We used three different evaluation methods to assess our proposed methodology, including Precision, Recall, and F-Measure [46,67]. Their formulas are given below:
Precision = True Positives True Positives + False Positives
Recall = True Positives True Positives + False Negatives
F 1 - score = 2 × Precision × Recall Precision + Recall
These measurements range from 0 to 1, with 0 representing the lowest theoretical and 1 representing the highest academic scores. The worst score is the one we receive from guessing at random. The best score may be less than one in practice because we can only aspire to replicate human achievement in some circumstances. There may be confusion about the correct categorization, such as in sentiment analysis.

8. Results and Discussion

Table 3 and Table 4 present the percentages of sentiment analysis for seven datasets, from dataset 1 to dataset 6, where dataset 7 contains six results. Sentiment analysis for those datasets is executed by using the SentiStrength-SE and SenticNet7 approaches. The results indicate that the sentiments between 360-degree and unidirectional videos range from strongly negative to strongly positive on the sensitivity scale in Table 1. The sentiment analysis using those approaches shows a substantial difference between the viewer sentiments of a virtual-reality-enabled video and a unidirectional one. As can be seen, the percentage of positive comments obtained from dataset 1 is lower than that obtained from dataset 2 using both approaches. The analysis results on dataset 3 vs. 4 and dataset 5 vs. 6 also give similar outcomes. Furthermore, the proportion of viewers who have neutral opinions when watching 360 videos appears to be higher than that of unidirectional videos. This may be because 360-degree videos appear no more interesting than unidirectional videos on YouTube. From these findings, we can answer RQ1 by saying that the unidirectional video garnered more positive sentiments than the other.
To measure the level of agreement between SentiStrength-SE and SenticNet7 among seven given datasets based on the same categories, we employed the Matthews correlation coefficient (MMC). It was introduced by Brian W. Matthews (1975) [68], and its score can reveal the agreement between two raters based on the same categories [69]. Table 5 presents the scores of MMC between the two approaches. As can be seen in this table, their scores range from 0.37 to 0.518. These results might reveal that there is some agreement between the two approaches, the most moderate agreement comes from dataset 3, and the least agreement comes from dataset 4.
However, the ratios of neutral attitude obtained from SentiStrength-SE among the six videos ranged from 37.09% to 58.57%, whereas the corresponding ratios obtained from SenticNet7 were lower, ranging from 12.23% to 26.09% (see Table 3 and Table 4). By contrast, the ratios of positive and negative comments found by SenticNet7 might be higher than those from SentiStrength-SE. These findings can allow us to answer RQ2 by saying that SentiStrength-SE might be unable to identify the proper polarity of the comments compared with SenticNet7. This issue might come from limitationsof the dictionary used; the new dictionary SenticNet’s method might have significantly outperformed SentiStrength-SE. Based on these findings, we encourage researchers to consider modern techniques (such as SenticNet7) for sentiment analysis in the future.
On the other hand, the study has classified the sentiment analysis based on datasets obtained from SenticNet7 by deploying the CNN and RF models. Table 6 and Table 7 present the performance metrics of CNN-based and RF-based models based on 10 folds, and the 10-folds-based max-voting approach. As can be seen, the accuracy obtained from CNN and RF models based on dataset1 in 10 folds is in the range of 0.68–0.73 and 0.68–0.77, respectively, while when the max-voting approach is used, the accuracy increases to 0.73, and 0.78, respectively. Similarity, precision, recall, and F1-score achieved from dataset1 by employing this approach also outperform an individual fold. Significantly, the precision obtained from dataset5 in 10 folds is in the range of 0.52 to 0.65 for the CNN-based model and 0.52 to 0.65 for the RF-based model. However, when the max-voting method is used, the precision improves to 0.67 and 0.66 for CNN-based and RF-based models. These findings are similar to those for the rest of the datasets. We can answer RQ3 by saying that the majority voting approach provides the most robust parameters of model selection in terms of Accuracy, F1 Score, Recall, and Precision.
Furthermore, the accuracy obtained from the CNN model based on dataset 3 and dataset 5 is better than that obtained from the RF model. As can be shown in Table 7 at the max-voting section, the accuracy of the CNN model for dataset3 is 85% and 67% for dataset5, compared with 75% and 66%, respectively, obtained from the RF model. In addition, the F1 score was obtained from those datasets given the similarity results. Although the Random Forest approach slightly outperformed the CNN-based model compared with other datasets, these differences are insignificant.
Last but not least, there are several researchers who have compared performance between RF and CNN approach in terms of sentiment analysis. According to Gordeev, D., the RF algorithm outperforms other machine learning classifiers in terms of consistency and robustness, but it performed poorly for the Russian language [70]. He also stated that CNN classifiers (and deep learning in general) are viewed as more insightful and promising. Furthermore, Shaheen et al. studied machine learning methods such as RF, CNN, and Naïve Bayes in terms of sentiment analysis [71]. They conducted that RF outperformed all other approaches. They discovered that RF outperformed all other methods. However, they also stated that CNN was discovered to be useful for a specific dataset.

9. Conclusions and Future Work

This study aimed to shed light on three significant research inquiries. Firstly, the investigation aimed to gauge the latent disparity between 360-degree and unidirectional videos as prescribed by [72,73]. It was revealed from the SenticNet7-powered sentiment analysis of comments extracted from three popular tourism-related YouTube videos that 360-degree videos, to some extent, appeal to viewers but apparently do not have a significant influence on the viewers when compared with unidirectional videos. Furthermore, 360-degree videos were unsuccessful in actuating extreme sentiments such as strongly negative and strongly positive sentiments. Instead, unidirectional videos were observed at a higher volume. This observation is corroborated by [74], who found that 360-degree videos have a minor capacity to influence the intention to take mountain walking trips.
The following research question revolved around identifying the optimal sentiment analysis model. According to a study by Kausar et al. [75], it was recommended that the efficacy of the sentiment analysis algorithm must be estimated by deploying multiple machine learning classifiers. This study investigated the efficacy of the sentiment analysis model through a recent state-of-the-art method to solve the research question. As discussed in the Related Works section, the CNN technology proved to be the optimal algorithm for estimating performance metrics. In the extant literature, the CNN model with a max-voting approach based on cross-validation has been highly adaptive when a clear separation between the data classes exists and is relatively memory-efficient [76]. Last and not least, the study attempted to investigate viewer engagement with 360-degree videos during COVID-19. The authors analysed comment traffic from 2019 to 2020, when different countries imposed tourism-related restrictions. We showed that viewer engagement for 360-degree videos was higher than in previous years. The study detected high traffic in the subjects’ YouTube videos depicting Angel Falls, Sahara Desert, and Victoria Falls when their countries imposed travel bans.
The study contributes in two ways. For academic, it serves the need to investigate text analyses and natural language processing models through different sentiment analyses and achieve desirable performance matrices. This will further help in advancing the model selection procedure. The study would recommend that tourism marketers and planners capitalize on text-mining technologies such as SenticNet7 and analyse tourist sentiments. Currently, the usage of NLP in the tourism industry is focused only on marketing purposes [75,77,78]. It can be used for tourism forecasting and recommender systems [79]. Furthermore, 360-degree videos can be compounded with Virtual Reality capabilities to promote niche forms of tourism such as adventure, nature-based, and sports. Future studies are encouraged to deploy advanced NLP modelling techniques such as CNN-LSTM [80,81], which have assisted the world of digital humanities in understanding sentiments towards law enforcement during the #BlackLivesMatter movement.
Moreover, as mentioned in the discussion section, CNN and RF employed in sentiment analysis should be studied more in the future.

Author Contributions

Conceptualization, H.H.T., S.D.H., S.K.D. and Z.P.; methodology, H.H.T., P.S., R.S., S.D.H., S.K.D. and Z.P.; software, H.H.T.; validation, H.H.T., P.S. and R.S.; investigation, H.H.T., P.S., R.S., S.D.H., S.K.D. and Z.P.; resources, H.H.T., S.D.H. and S.K.D.; data curation, H.H.T., S.D.H. and S.K.D.; writing—original draft preparation, H.H.T., S.D.H., S.K.D. and Z.P.; writing—review and editing, H.H.T., P.S., R.S., S.K.D. and Z.P.; visualization, H.H.T. and S.K.D.; supervision, P.S., R.S. and H.H.T.; project administration, H.H.T., S.K.D. and Z.P.; funding acquisition, Z.P., P.S. and R.S. All authors have read and agreed to the published version of the manuscript.

Funding

This project has been financed within OP RDE project Junior grants of TBU in Zlin, reg. No. CZ.02.2.69/0.0/19_073/0016941 was supported by the Faculty of Applied Informatics, Tomas Bata University in Zlin, under Project No.: IGA/CebiaTech/2022/001.

Institutional Review Board Statement

Not applicable.

Informed Consent Statement

Not applicable.

Data Availability Statement

This investigation focuses on using Python to gather comments via API requests by using the Requests package. The processed content is then subjected to NLP-based algorithms to generate data sets. Regular expressions remove messy words such as hyperlinks, dates, and special characters, among other things. Furthermore, the Natural Language Toolkit Python library, version 3.7, eliminates the most common words stop words (“the”, “an”, “a”, “a”, etc.).

Acknowledgments

The authors would like to thank the Torus Actions company (https://torus.ai, accessed on 18 December 2022) for allowing us to spend time completing the manuscript. We would also like to express our great appreciation to Nguyen Hoang Phuong for her insightful suggestions and careful reading of the manuscript.

Conflicts of Interest

The authors declare no conflict of interest.

References

  1. Pedrana, M. Location-based services and tourism: Possible implications for destination. Curr. Issues Tour. 2014, 17, 753–762. [Google Scholar] [CrossRef]
  2. Bogicevic, V.; Seo, S.; Kandampully, J.A.; Liu, S.Q.; Rudd, N.A. Virtual reality presence as a preamble of tourism experience: The role of mental imagery. Tour. Manag. 2019, 74, 55–64. [Google Scholar] [CrossRef]
  3. Lin, L.P.L.; Huang, S.C.L.; Ho, Y.C. Could virtual reality effectively market slow travel in a heritage destination? Tour. Manag. 2020, 78, 104027. [Google Scholar] [CrossRef]
  4. Perry Hobson, J.; Williams, A.P. Virtual reality: A new horizon for the tourism industry. J. Vacat. Mark. 1995, 1, 124–135. [Google Scholar] [CrossRef]
  5. Zhang, S.N.; Li, Y.Q.; Ruan, W.Q.; Liu, C.H. Would you enjoy virtual travel? The characteristics and causes of virtual tourists’ sentiment under the influence of the COVID-19 pandemic. Tour. Manag. 2022, 88, 104429. [Google Scholar] [CrossRef]
  6. Dale, C. The competitive networks of tourism e-mediaries: New strategies, new advantages. J. Vacat. Mark. 2003, 9, 109–118. [Google Scholar] [CrossRef] [Green Version]
  7. Lekgau, R.J.; Harilal, V.; Feni, A. Reimagining Tourism: COVID-19 and the Potential for Virtual Tourism in South Africa. Afr. J. Hosp. Tour. Leis. 2021, 10, 1516–1532. [Google Scholar]
  8. Yang, C.; Yan, S.; Wang, J.; Xue, Y. Flow Experiences and Virtual Tourism: The Role of Technological Acceptance and Technological Readiness. Sustainability 2022, 14, 5361. [Google Scholar] [CrossRef]
  9. Guttentag, D.A. Virtual reality: Applications and implications for tourism. Tour. Manag. 2010, 31, 637–651. [Google Scholar] [CrossRef]
  10. Yung, R.; Khoo-Lattimore, C. New realities: A systematic literature review on virtual reality and augmented reality in tourism research. Curr. Issues Tour. 2019, 22, 2056–2081. [Google Scholar] [CrossRef] [Green Version]
  11. Kim, M.J.; Lee, C.K.; Jung, T. Exploring consumer behavior ual reality tourism using an extended stimulus-organism-response model. J. Travel Res. 2020, 59, 69–89. [Google Scholar] [CrossRef]
  12. Talwar, S.; Kaur, P.; Nunkoo, R.; Dhir, A. Digitalization and sustainability: Virtual reality tourism in a post pandemic world. J. Sustain. Tour. 2022, 1–28. [Google Scholar] [CrossRef]
  13. Gössling, S.; Scott, D.; Hall, C.M. Pandemics, tourism and global change: A rapid assessment of COVID-19. J. Sustain. Tour. 2020, 29, 1–20. [Google Scholar] [CrossRef]
  14. Dodds, R.; Butler, R. Overtourism: Issues, Realities and Solutions; Walter de Gruyter GmbH & Co. KG: Berlin, Germany, 2019; Volume 1. [Google Scholar]
  15. Ritchie, H.; Mathieu, E.; Rodés-Guirao, L.; Appel, C.; Giattino, C.; Ortiz-Ospina, E.; Hasell, J.; Macdonald, B.; Beltekian, D.; Roser, M. Coronavirus Pandemic (COVID-19); Our World in Data: Oxford, UK, 2020. [Google Scholar]
  16. Ramírez-Correa, P.; Mariano-Melo, A.; Alfaro-Pérez, J. Predicting and explaining the acceptance of social video platforms for learning: The case of Brazilian YouTube users. Sustainability 2019, 11, 7115. [Google Scholar] [CrossRef] [Green Version]
  17. Pradhan, R. Extracting Sentiments from YouTube Comments. In Proceedings of the 2021 Sixth International Conference on Image Information Processing (ICIIP), Shimla, India, 26–28 November 2021; IEEE: Piscataway, NJ, USA, 2021; Volume 6, pp. 1–4. [Google Scholar]
  18. Dabas, C.; Kaur, P.; Gulati, N.; Tilak, M. Analysis of comments on youtube videos using hadoop. In Proceedings of the 2019 Fifth International Conference on Image Information Processing (ICIIP), Shimla, India, 15–17 November 2019; IEEE: Piscataway, NJ, USA, 2019; pp. 353–358. [Google Scholar]
  19. Kready, J.; Shimray, S.A.; Hussain, M.N.; Agarwal, N. YouTube data collection using parallel processing. In Proceedings of the 2020 IEEE International Parallel and Distributed Processing Symposium Workshops (IPDPSW), New Orleans, LA, USA, 18–22 May 2020; IEEE: Piscataway, NJ, USA, 2020; pp. 1119–1122. [Google Scholar]
  20. Cunha, A.A.L.; Costa, M.C.; Pacheco, M.A.C. Sentiment analysis of youtube video comments using deep neural networks. In Proceedings of the International Conference on Artificial Intelligence and Soft Computing, Zakopane, Poland, 16–20 June 2019; Springer: Berlin/Heidelberg, Germany, 2019; pp. 561–570. [Google Scholar]
  21. Jelodar, H.; Wang, Y.; Rabbani, M.; Ahmadi, S.B.B.; Boukela, L.; Zhao, R.; Larik, R.S.A. A NLP framework based on meaningful latent-topic detection and sentiment analysis via fuzzy lattice reasoning on youtube comments. Multimed. Tools Appl. 2021, 80, 4155–4181. [Google Scholar] [CrossRef]
  22. Dubovi, I.; Tabak, I. An empirical analysis of knowledge co-construction in YouTube comments. Comput. Educ. 2020, 156, 103939. [Google Scholar] [CrossRef]
  23. Yu, C.E.; Wen, J.; Yang, S. Viewpoint of suicide travel: An exploratory study on YouTube comments. Tour. Manag. Perspect. 2020, 34, 100669. [Google Scholar] [CrossRef]
  24. Chakravarthi, B.R.; Priyadharshini, R.; Ponnusamy, R.; Kumaresan, P.K.; Sampath, K.; Thenmozhi, D.; Thangasamy, S.; Nallathambi, R.; McCrae, J.P. Dataset for identification of homophobia and transophobia in multilingual YouTube comments. arXiv 2021, arXiv:2109.00227. [Google Scholar]
  25. Jeon, Y.A.; Hale, B.; Knackmuhs, E.; Mackert, M. Weight stigma goes viral on the internet: Systematic assessment of youtube comments attacking overweight men and women. Interact. J. Med Res. 2018, 7, e9182. [Google Scholar] [CrossRef]
  26. Obadimu, A.; Mead, E.; Hussain, M.N.; Agarwal, N. Identifying toxicity within youtube video comment. In Proceedings of the International Conference on Social Computing, Behavioral-Cultural Modeling and Prediction and Behavior Representation in Modeling and Simulation, Washington, DC, USA, 9–12 July 2019; Springer: Berlin/Heidelberg, Germany, 2019; pp. 214–223. [Google Scholar]
  27. Spörlein, C.; Schlueter, E. Ethnic insults in YouTube comments: Social contagion and selection effects during the german “Refugee Crisis”. Eur. Sociol. Rev. 2021, 37, 411–428. [Google Scholar] [CrossRef]
  28. McCarthy, B. ‘Who unlocked the kitchen?’: Online misogyny, YouTube comments and women’s professional street skateboarding. Int. Rev. Sociol. Sport 2022, 57, 362–380. [Google Scholar] [CrossRef]
  29. Oh, J.; Sudarshan, S.; Jin, E.; Nah, S.; Yu, N. How 360-degree video influences content perceptions and environmental behavior: The moderating effect of environmental self-efficacy. Sci. Commun. 2020, 42, 423–453. [Google Scholar] [CrossRef]
  30. Islam, M.R.; Zibran, M.F. SentiStrength-SE: Exploiting domain specificity for improved sentiment analysis in software engineering text. J. Syst. Softw. 2018, 145, 125–146. [Google Scholar] [CrossRef]
  31. Pang, B.; Lee, L. Opinion mining and sentiment analysis. Found. Trends Inf. Retr. 2008, 2, 1–135. [Google Scholar] [CrossRef] [Green Version]
  32. Tumasjan, A.; Sprenger, T.; Sandner, P.; Welpe, I. Predicting elections with twitter: What 140 characters reveal about political sentiment. In Proceedings of the International AAAI Conference on Web and Social Media, Washington, DC USA, 23–26 May 2010; Volume 4, pp. 178–185. [Google Scholar]
  33. Ghiassi, M.; Skinner, J.; Zimbra, D. Twitter brand sentiment analysis: A hybrid system using n-gram analysis and dynamic artificial neural network. Expert Syst. Appl. 2013, 40, 6266–6282. [Google Scholar] [CrossRef]
  34. Alhujaili, R.F.; Yafooz, W.M. Sentiment analysis for youtube videos with user comments. In Proceedings of the 2021 International Conference on Artificial Intelligence and Smart Systems (ICAIS), Coimbatore, India, 25–27 March 2021; IEEE: Piscataway, NJ, USA, 2021; pp. 814–820. [Google Scholar]
  35. Ghabayen, A.S.; Ahmed, B.H. Polarity Analysis of Customer Reviews Based on Part-of-Speech Subcategory. J. Intell. Syst. 2020, 29, 1535–1544. [Google Scholar] [CrossRef]
  36. Muhammad, A.N.; Bukhori, S.; Pandunata, P. Sentiment analysis of positive and negative of youtube comments using naïve bayes–support vector machine (nbsvm) classifier. In Proceedings of the 2019 International Conference on Computer Science, Information Technology, and Electrical Engineering (ICOMITEE), Jember, Indonesia, 16–17 October 2019; IEEE: Piscataway, NJ, USA, 2019; pp. 199–205. [Google Scholar]
  37. Jongeling, R.; Sarkar, P.; Datta, S.; Serebrenik, A. On negative results when using sentiment analysis tools for software engineering research. Empir. Softw. Eng. 2017, 22, 2543–2584. [Google Scholar] [CrossRef] [Green Version]
  38. Viola, P.; Jones, M. Rapid object detection using a boosted cascade of simple features. In Proceedings of the 2001 IEEE Computer Society Conference on Computer Vision and Pattern Recognition, CVPR 2001, Kauai, HI, USA, 8–14 December 2001; IEEE: Piscataway, NJ, USA, 2001; Volume 1, p. I. [Google Scholar]
  39. Alrehaili, A.; Alsaeedi, A.; Yafooz, W. Sentiment Analysis on YouTube Videos for kids. In Proceedings of the 2021 9th International Conference on Reliability, Infocom Technologies and Optimization (Trends and Future Directions) (ICRITO), Noida, India, 3–4 September 2021; IEEE: Piscataway, NJ, USA, 2021; pp. 1–5. [Google Scholar]
  40. Bhuiyan, H.; Ara, J.; Bardhan, R.; Islam, M.R. Retrieving YouTube video by sentiment analysis on user comment. In Proceedings of the 2017 IEEE International Conference on Signal and Image Processing Applications (ICSIPA), Kuching, Malaysia, 12–14 September 2017; IEEE: Piscataway, NJ, USA, 2017; pp. 474–478. [Google Scholar]
  41. Thelwall, M.; Buckley, K.; Paltoglou, G.; Cai, D.; Kappas, A. Sentiment strength detection in short informal text. J. Am. Soc. Inf. Sci. Technol. 2010, 61, 2544–2558. [Google Scholar] [CrossRef] [Green Version]
  42. Islam, M.R.; Zibran, M.F. A comparison of dictionary building methods for sentiment analysis in software engineering text. In Proceedings of the 2017 ACM/IEEE International Symposium on Empirical Software Engineering and Measurement (ESEM), Toronto, ON, Canada, 9–10 November 2017; IEEE: Piscataway, NJ, USA, 2017; pp. 478–479. [Google Scholar]
  43. Islam, M.R.; Zibran, M.F. Leveraging automated sentiment analysis in software engineering. In Proceedings of the 2017 IEEE/ACM 14th International Conference on Mining Software Repositories (MSR), Buenos Aires, Argentina, 20–21 May 2017; IEEE: Piscataway, NJ, USA, 2017; pp. 203–214. [Google Scholar]
  44. Cambria, E.; Liu, Q.; Decherchi, S.; Xing, F.; Kwok, K. SenticNet 7: A commonsense-based neurosymbolic AI framework for explainable sentiment analysis. In Proceedings of the Thirteenth Language Resources and Evaluation Conference, LREC, Marseille, France, 21–23 June 2022. [Google Scholar]
  45. Cambria, E.; Hussain, A. SenticNet. In Sentic Computing; Springer: Berlin/Heidelberg, Germany, 2015; pp. 23–71. [Google Scholar]
  46. Kausar, S.; Huahu, X.; Ahmad, W.; Shabir, M.Y. A sentiment polarity categorization technique for online product reviews. IEEE Access 2019, 8, 3594–3605. [Google Scholar] [CrossRef]
  47. Adewole, K.S.; Anuar, N.B.; Kamsin, A.; Varathan, K.D.; Razak, S.A. Malicious accounts: Dark of the social networks. J. Netw. Comput. Appl. 2017, 79, 41–67. [Google Scholar] [CrossRef]
  48. Gardner, M.W.; Dorling, S. Artificial neural networks (the multilayer perceptron)—a review of applications in the atmospheric sciences. Atmos. Environ. 1998, 32, 2627–2636. [Google Scholar] [CrossRef]
  49. Almaghrabi, M.; Chetty, G. Improving sentiment analysis in Arabic and English languages by using multi-layer perceptron model (MLP). In Proceedings of the 2020 IEEE 7th International Conference on Data Science and Advanced Analytics (DSAA), Sydney, Australia, 6–9 October 2020; IEEE: Piscataway, NJ, USA, 2020; pp. 745–746. [Google Scholar]
  50. Xia, E.; Yue, H.; Liu, H. Tweet sentiment analysis of the 2020 US presidential election. In Proceedings of the Companion Proceedings of the Web Conference, Ljubljana, Slovenia, 19–23 April 2021; pp. 367–371. [Google Scholar]
  51. Karthika, P.; Murugeswari, R.; Manoranjithem, R. Sentiment analysis of social media network using random forest algorithm. In Proceedings of the 2019 IEEE International Conference on Intelligent Techniques in Control, Optimization and Signal Processing (INCOS), Tamilnadu, India, 11–13 April 2019; IEEE: Piscataway, NJ, USA, 2019; pp. 1–5. [Google Scholar]
  52. Ahuja, R.; Chug, A.; Kohli, S.; Gupta, S.; Ahuja, P. The impact of features extraction on the sentiment analysis. Procedia Comput. Sci. 2019, 152, 341–348. [Google Scholar] [CrossRef]
  53. Rani, S.; Kumar, P. Deep learning based sentiment analysis using convolution neural network. Arab. J. Sci. Eng. 2019, 44, 3305–3314. [Google Scholar] [CrossRef]
  54. Malhotra, P.; Gupta, S.; Koundal, D.; Zaguia, A.; Enbeyle, W. Deep Neural Networks for Medical Image Segmentation. J. Healthc. Eng. 2022, 2022, 9580991. [Google Scholar] [CrossRef] [PubMed]
  55. Sarvamangala, D.; Kulkarni, R.V. Convolutional neural networks in medical image understanding: A survey. Evol. Intell. 2022, 15, 1–22. [Google Scholar] [CrossRef]
  56. Singh, C.; Imam, T.; Wibowo, S.; Grandhi, S. A Deep Learning Approach for Sentiment Analysis of COVID-19 Reviews. Appl. Sci. 2022, 12, 3709. [Google Scholar] [CrossRef]
  57. Hoc, H.T.; Silhavy, R.; Prokopova, Z.; Silhavy, P. Comparing Multiple Linear Regression, Deep Learning and Multiple Perceptron for Functional Points Estimation. IEEE Access 2022, 10, 112187–112198. [Google Scholar] [CrossRef]
  58. Chauhan, G.S.; Meena, Y.K. YouTube video ranking by aspect-based sentiment analysis on user feedback. In Soft Computing and Signal Processing; Springer: Berlin/Heidelberg, Germany, 2019; pp. 63–71. [Google Scholar]
  59. UNESCO. United Nations Educational, Scientific and Cultural Organization, World Heritage Convention; UNESCO World Heritage Centre: Paris, France, 2022. [Google Scholar]
  60. Saleh, M. Zimbabwe: Origin of International Tourists. Available online: https://www.statista.com/statistics/1256492/number-of-international-tourist-arrivals-in-zimbabwe-by-world-region/ (accessed on 9 November 2022).
  61. Lopez, A.M. Number of Tourist Arrivals in Venezuela. Available online: https://www.statista.com/statistics/816645/venezuela-number-of-tourist-arrivals/ (accessed on 9 November 2022).
  62. Abderrahmane, N. Tourism in Morocco. Available online: https://www.meer.com/en/52538-tourism-in-morocco (accessed on 9 August 2022).
  63. Manning, C.D.; Surdeanu, M.; Bauer, J.; Finkel, J.R.; Bethard, S.; McClosky, D. The Stanford CoreNLP natural language processing toolkit. In Proceedings of the 52nd Annual Meeting of the Association for Computational Linguistics: System Demonstrations, Baltimore, MD, USA, 23–24 June 2014; pp. 55–60. [Google Scholar]
  64. Google Developers. Available online: https://developers.google.com (accessed on 1 February 2022).
  65. Azimi, S.M.; Britz, D.; Engstler, M.; Fritz, M.; Mücklich, F. Advanced steel microstructural classification by deep learning methods. Sci. Rep. 2018, 8, 2128. [Google Scholar] [CrossRef] [Green Version]
  66. Ashames, M.M.; Ceylan, M.; Jennane, R. Deep transfer learning and majority voting approaches for osteoporosis classification. Int. J. Intell. Syst. Appl. Eng. 2021, 9, 256–265. [Google Scholar] [CrossRef]
  67. Tripathy, A.; Agrawal, A.; Rath, S.K. Classification of sentiment reviews using n-gram machine learning approach. Expert Syst. Appl. 2016, 57, 117–126. [Google Scholar] [CrossRef]
  68. Matthews, B.W. Comparison of the predicted and observed secondary structure of T4 phage lysozyme. Biochim. Biophys. Acta-Protein Struct. 1975, 405, 442–451. [Google Scholar] [CrossRef] [PubMed]
  69. Chicco, D.; Warrens, M.J.; Jurman, G. The Matthews correlation coefficient (MCC) is more informative than Cohen’s Kappa and Brier score in binary classification assessment. IEEE Access 2021, 9, 78368–78381. [Google Scholar] [CrossRef]
  70. Gordeev, D. Detecting state of aggression in sentences using CNN. In Proceedings of the International Conference on Speech and Computer, Budapest, Hungary, 23–27 August 2016; Springer: Berlin/Heidelberg, Germany, 2016; pp. 240–245. [Google Scholar]
  71. Shaheen, M.; Awan, S.M.; Hussain, N.; Gondal, Z.A. Sentiment analysis on mobile phone reviews using supervised learning techniques. Int. J. Mod. Educ. Comput. Sci. 2019, 7, 32–43. [Google Scholar] [CrossRef]
  72. Pasanen, K.; Pesonen, J.; Murphy, J.; Heinonen, J.; Mikkonen, J. Comparing tablet and virtual reality glasses for watching nature tourism videos. In Information and Communication Technologies in Tourism 2019; Springer: Berlin/Heidelberg, Germany, 2019; pp. 120–131. [Google Scholar]
  73. Rahimizhian, S.; Ozturen, A.; Ilkan, M. Emerging realm of 360-degree technology to promote tourism destination. Technol. Soc. 2020, 63, 101411. [Google Scholar] [CrossRef]
  74. Wu, X.; Lai, I.K.W. The use of 360-degrual tours to promote mountain walking tourism: Stimulus–organism–response model. Inf. Technol. Tour. 2022, 24, 85–107. [Google Scholar] [CrossRef]
  75. Kask, S. Virtual Reality in Support of Sustainable Tourism. Experiences from Eastern Europe. Ph.D. Thesis, Eesti Maaülikool, Tartu, Estonia, 2018. [Google Scholar]
  76. Demidova, L.A. Two-stage hybrid data classifiers based on SVM and kNN algorithms. Symmetry 2021, 13, 615. [Google Scholar] [CrossRef]
  77. Pung, J.M.; Gnoth, J.; Del Chiappa, G. Tourist transformation: Towards a conceptual model. Ann. Tour. Res. 2020, 81, 102885. [Google Scholar] [CrossRef]
  78. Tussyadiah, I.P.; Park, S. When guests trust hosts for their words: Host description and trust in sharing economy. Tour. Manag. 2018, 67, 261–272. [Google Scholar] [CrossRef]
  79. Portugal, I.; Alencar, P.; Cowan, D. The use of machine learning algorithms in recommender systems: A systematic review. Expert Syst. Appl. 2018, 97, 205–227. [Google Scholar] [CrossRef]
  80. Rani, S.; Bashir, A.K.; Alhudhaif, A.; Koundal, D.; Gunduz, E.S. An efficient CNN-LSTM model for sentiment detection in# BlackLivesMatter. Expert Syst. Appl. 2022, 193, 116256. [Google Scholar]
  81. Wang, J.; Yu, L.C.; Lai, K.R.; Zhang, X. Dimensional sentiment analysis using a regional CNN-LSTM model. In Proceedings of the 54th Annual Meeting of the Association for Computational Linguistics (Volume 2: Short Papers), Berlin, Germany, 7–12 August 2016; pp. 225–230. [Google Scholar]
Figure 1. Stay-at-home requirements during COVID-19, 13 May 2020 [15].
Information 14 00011 g001
Figure 2. International travel controls during COVID-19, 13 May 2020 [15].
Information 14 00011 g002
Figure 3. The flow diagram of opinion mining of YouTube comments.
Information 14 00011 g003
Figure 4. The proposed CNN architecture for sentiment analysis.
Information 14 00011 g004
Table 1. List of six videos for case study.
NoVideoIDTypeDescription
Dataset1L_tqK4eqelA 360 Angel Falls, Venezuela
Dataset2etSgGjaSMunidirectionalAngel Falls, Venezuela
Dataset3RdFkC6Gtb5A 360 Sahara Desert, Africa
Dataset4LMHfYnS65w0unidirectionalSahara Desert, Africa
Dataset5WsMjBMxpUTc 360 Victoria Falls, Mosi-oa-Tunya, Zambia & Zimbabwe
Dataset6iywqpda7d8kunidirectionalVictoria Falls, Mosi-oa-Tunya, Zambia & Zimbabwe
Table 2. Sentiment analysis classification.
NoSentiStrength-SEClass
1−5 to −4Strongly negative
2−4 to −1Negative
3−1 to 1Neutral
41 to 4Positive
54 to 5Strongly positive
Table 3. Percentage of sentiment analysis result based on Sentistrength-SE.
DatasetStrongly NegativeNegativeNeutralPositiveStrongly Positive
Dataset10.00%4.50%54.43%40.09%0.98%
Dataset20.41%6.63%42.96%49.59%0.41%
Dataset30.00%1.90%58.57%38.57%0.95%
Dataset40.72%8.49%54.82%34.10%1.87%
Dataset50.52%7.63%54.86%35.59%1.04%
Dataset60.08%2.97%37.09%58.57%1.29%
Dataset70.26%5.61%48.21%44.81%1.10%
Table 4. Percentage of sentiment analysis results based on SenticNet7.
DatasetStrongly NegativeNegativeNeutralPositiveStrongly Positive
Dataset10.26%13.68%20.05 %64.70%1.31%
Dataset21.10%10.11%14.56 %72.21 %1.02%
Dataset30.21%15.25%26.09%56.12%1.37%
Dataset41.15%20.05%14.61%61.71%2.04%
Dataset50.52%20.43%20.00%57.34%1.40%
Dataset60.12%9.07%12.23%76.31%2.03%
Dataset70.32%14.45%16.92%67.11%1.20%
Table 5. MMC score between SentiStrength-SE and SenticNet7.
Dataset1Dataset2Dataset3Dataset4Dataset5Dataset6Dataset7
MMC score0.4410.4470.5180.370.4580.450.448
Table 6. Performance metrics CNN vs. RF (from Folds 1 to 5).
DatasetAccuracyF1 ScoreRecallPrecision
CNNRFCNNRFCNNRFCNNRF
Fold 1
Dataset10.730.720.730.720.730.720.730.71
Dataset20.840.870.840.870.840.870.850.87
Dataset30.820.820.820.820.820.820.820.82
Dataset40.730.720.730.720.730.720.730.72
Dataset50.650.640.650.640.650.640.650.64
Dataset60.800.800.800.800.800.800.830.82
Dataset70.740.740.740.740.740.740.760.75
Fold 2
Dataset10.720.690.720.690.720.690.730.72
Dataset20.760.850.760.850.760.850.820.85
Dataset30.780.850.780.850.780.850.780.85
Dataset40.680.710.680.710.680.710.670.71
Dataset50.640.650.640.670.640.660.640.70
Dataset60.800.760.800.690.800.760.810.76
Dataset70.720.740.720.740.720.740.730.75
Fold 3
Dataset10.690.720.740.720.690.720.690.72
Dataset20.740.780.750.780.740.780.740.82
Dataset30.860.780.860.780.860.780.860.78
Dataset40.650.680.670.680.660.680.660.68
Dataset50.580.630.590.630.580.630.580.63
Dataset60.800.790.810.790.800.630.800.80
Dataset70.760.710.780.710.760.710.760.72
Fold 4
Dataset10.680.690.680.690.680.690.690.71
Dataset20.760.760.760.760.760.760.780.77
Dataset30.750.750.750.750.750.750.800.80
Dataset40.720.710.720.710.720.710.730.72
Dataset50.630.620.630.620.630.620.640.63
Dataset60.790.800.790.800.790.800.810.80
Dataset70.750.770.780.770.750.770.760.78
Fold 5
Dataset10.690.680.690.680.690.680.700.69
Dataset20.790.790.790.790.790.790.810.82
Dataset30.590.640.590.640.590.640.590.64
Dataset40.510.540.510.540.510.540.530.54
Dataset50.580.590.580.590.580.590.590.59
Dataset60.820.820.820.820.820.820.820.82
Dataset70.730.730.730.730.730.730.740.74
Table 7. Performance metrics CNN vs. RF (from Folds 6 to 10 and voting based on 10 folds).
DatasetAccuracyF1 ScoreRecallPrecision
CNNRFCNNRFCNNRFCNNRF
Fold 6
Dataset10.690.680.690.680.690.680.700.69
Dataset20.790.790.790.790.790.790.790.79
Dataset30.650.650.650.650.650.650.650.65
Dataset40.580.550.580.550.580.550.570.53
Dataset50.520.520.520.520.520.520.530.52
Dataset60.790.770.790.770.790.770.780.76
Dataset70.730.740.730.740.730.740.750.75
Fold 7
Dataset10.730.770.730.730.730.770.730.71
Dataset20.720.780.740.780.720.780.720.77
Dataset30.860.690.860.690.860.690.860.69
Dataset40.680.640.680.640.680.640.680.64
Dataset50.610.600.620.640.610.640.610.64
Dataset60.800.710.800.710.800.710.800.72
Dataset70.750.700.750.700.750.700.770.71
Fold 8
Dataset10.740.750.740.750.740.750.750.76
Dataset20.820.790.820.790.820.790.810.78
Dataset30.850.730.850.730.850.730.850.73
Dataset40.670.660.670.660.670.660.670.71
Dataset50.670.610.670.610.670.610.680.61
Dataset60.770.800.770.800.770.800.780.82
Dataset70.750.720.750.720.750.720.770.73
Fold 9
Dataset10.740.750.740.750.740.750.750.76
Dataset20.810.790.810.790.810.790.800.78
Dataset30.730.730.730.730.730.730.730.73
Dataset40.660.660.660.660.660.660.670.71
Dataset50.580.610.580.610.580.610.580.61
Dataset60.830.800.830.800.830.800.840.82
Dataset70.730.720.730.720.730.720.740.72
Fold 10
Dataset10.680.710.680.710.680.710.660.68
Dataset20.700.710.700.710.700.710.710.72
Dataset30.590.590.590.590.590.590.590.59
Dataset40.640.670.640.670.640.670.670.67
Dataset50.570.560.570.560.570.560.560.56
Dataset60.800.800.800.800.800.800.820.82
Dataset70.740.720.740.720.740.720.740.72
Max-voting
Dataset10.750.780.750.760.750.760.760.78
Dataset20.730.740.730.740.730.740.740.75
Dataset30.850.760.850.760.850.760.850.77
Dataset40.660.680.660.680.660.680.660.69
Dataset50.670.660.670.650.670.650.670.66
Dataset60.720.730.720.730.720.730.740.75
Dataset70.710.720.710.720.710.720.720.73
Disclaimer/Publisher’s Note: The statements, opinions and data contained in all publications are solely those of the individual author(s) and contributor(s) and not of MDPI and/or the editor(s). MDPI and/or the editor(s) disclaim responsibility for any injury to people or property resulting from any ideas, methods, instructions or products referred to in the content.

