
Design Factors of Shared Situation Awareness Interface in Human–Machine Co-Driving


Abstract
:1. Introduction
2. Related Work
2.1. Situation Awareness
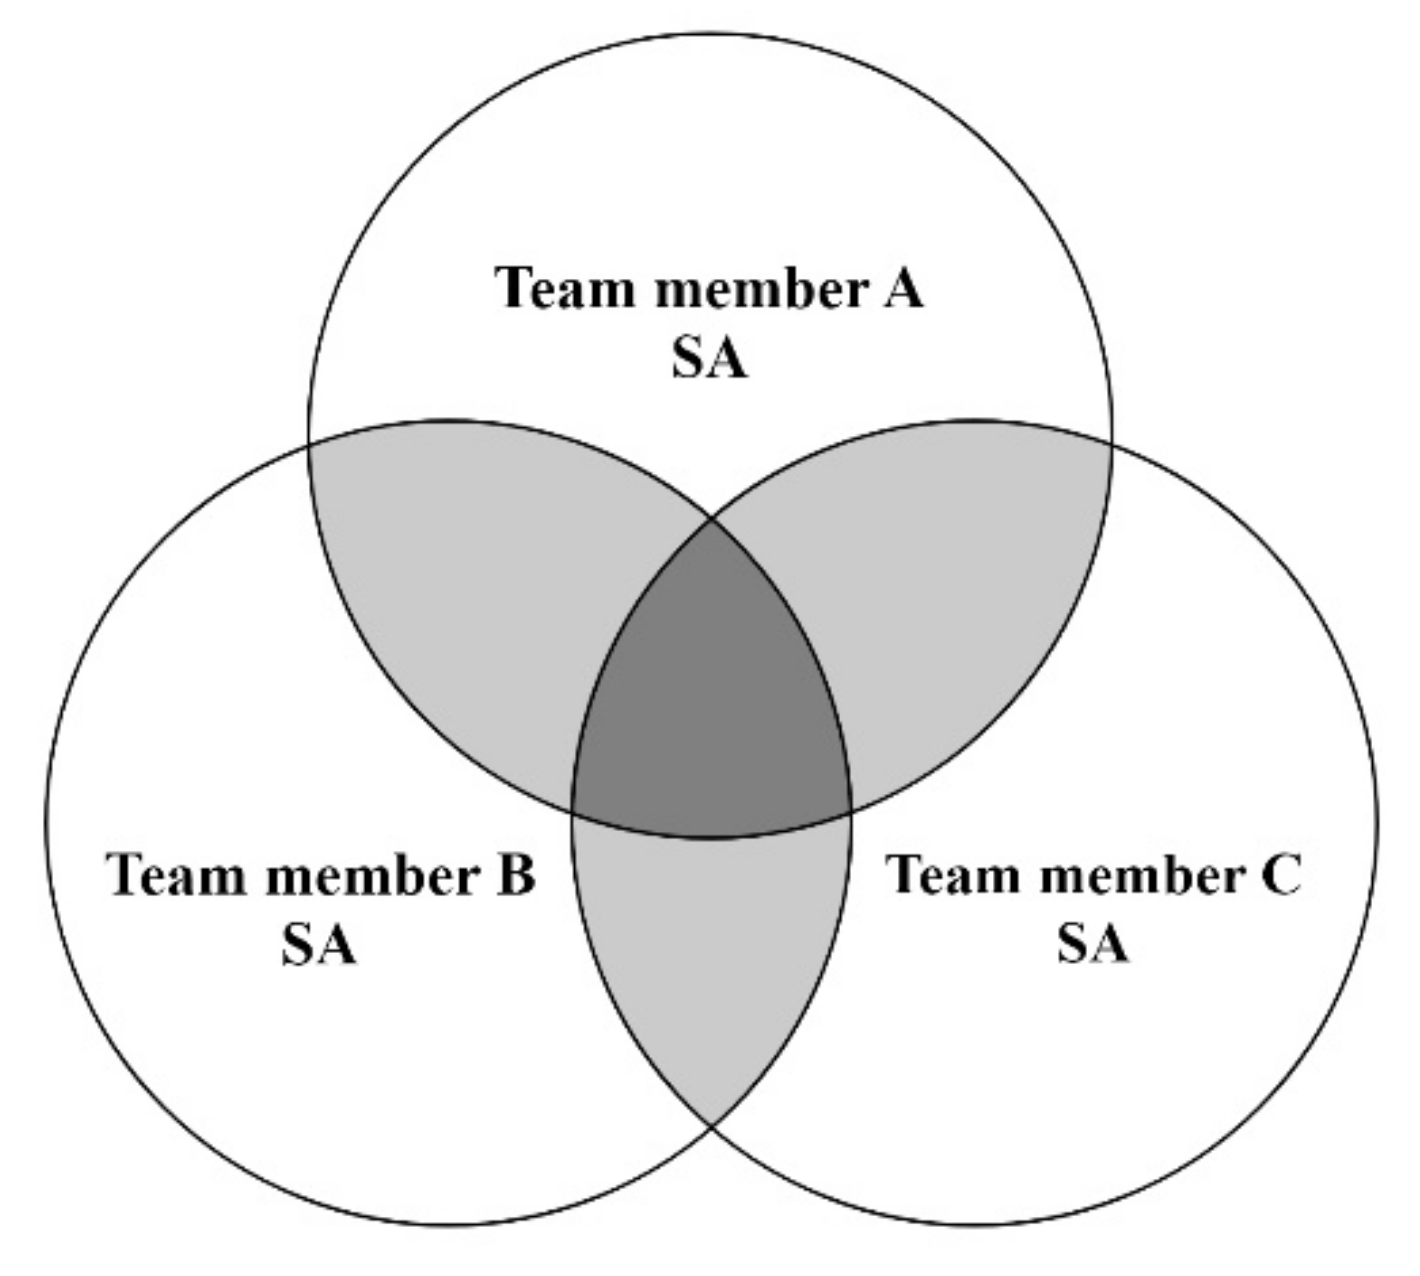
2.2. Shared Situation Awareness
2.3. Interfaces Design of Human–Machine Co-Driving
3. Design Methods
3.1. Abstraction Hierarchy Analysis
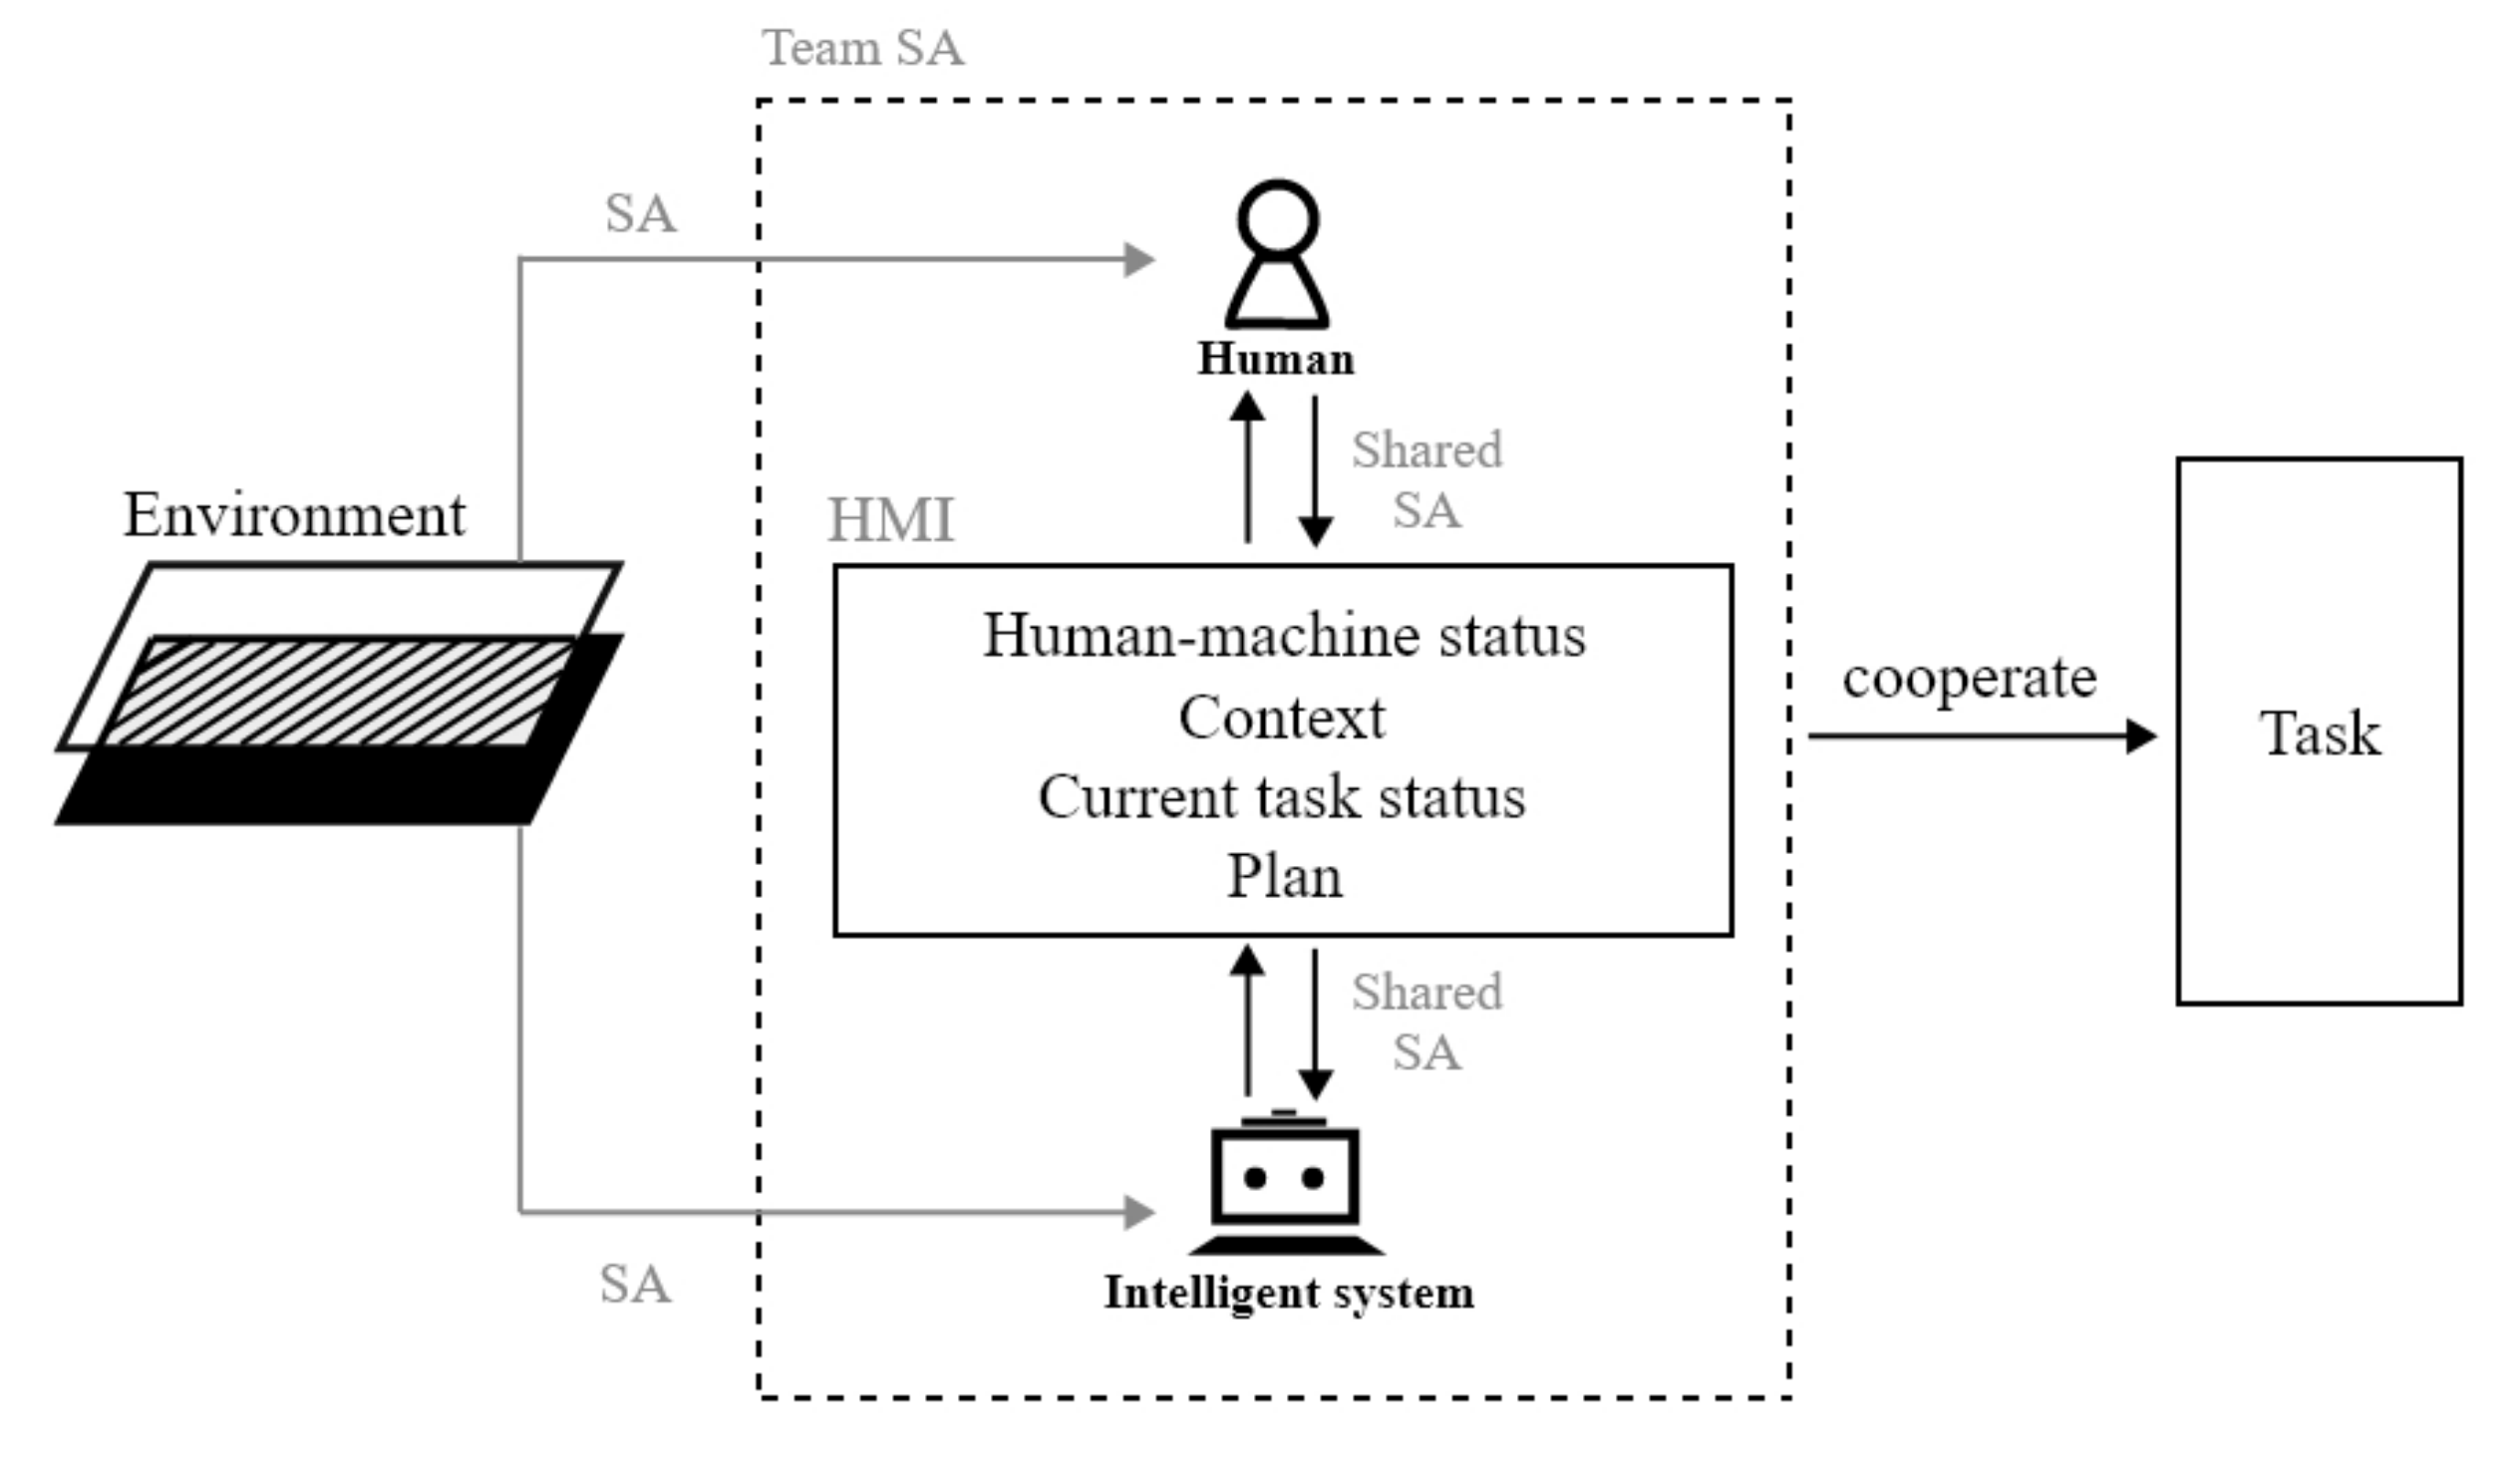
3.2. The AH Analysis of SSA Human–Machine Interaction Interfaces
3.3. Four Factors of SSA Interface
4. Simulation Experiment
4.1. Experimental Subjects
4.2. Experimental Design
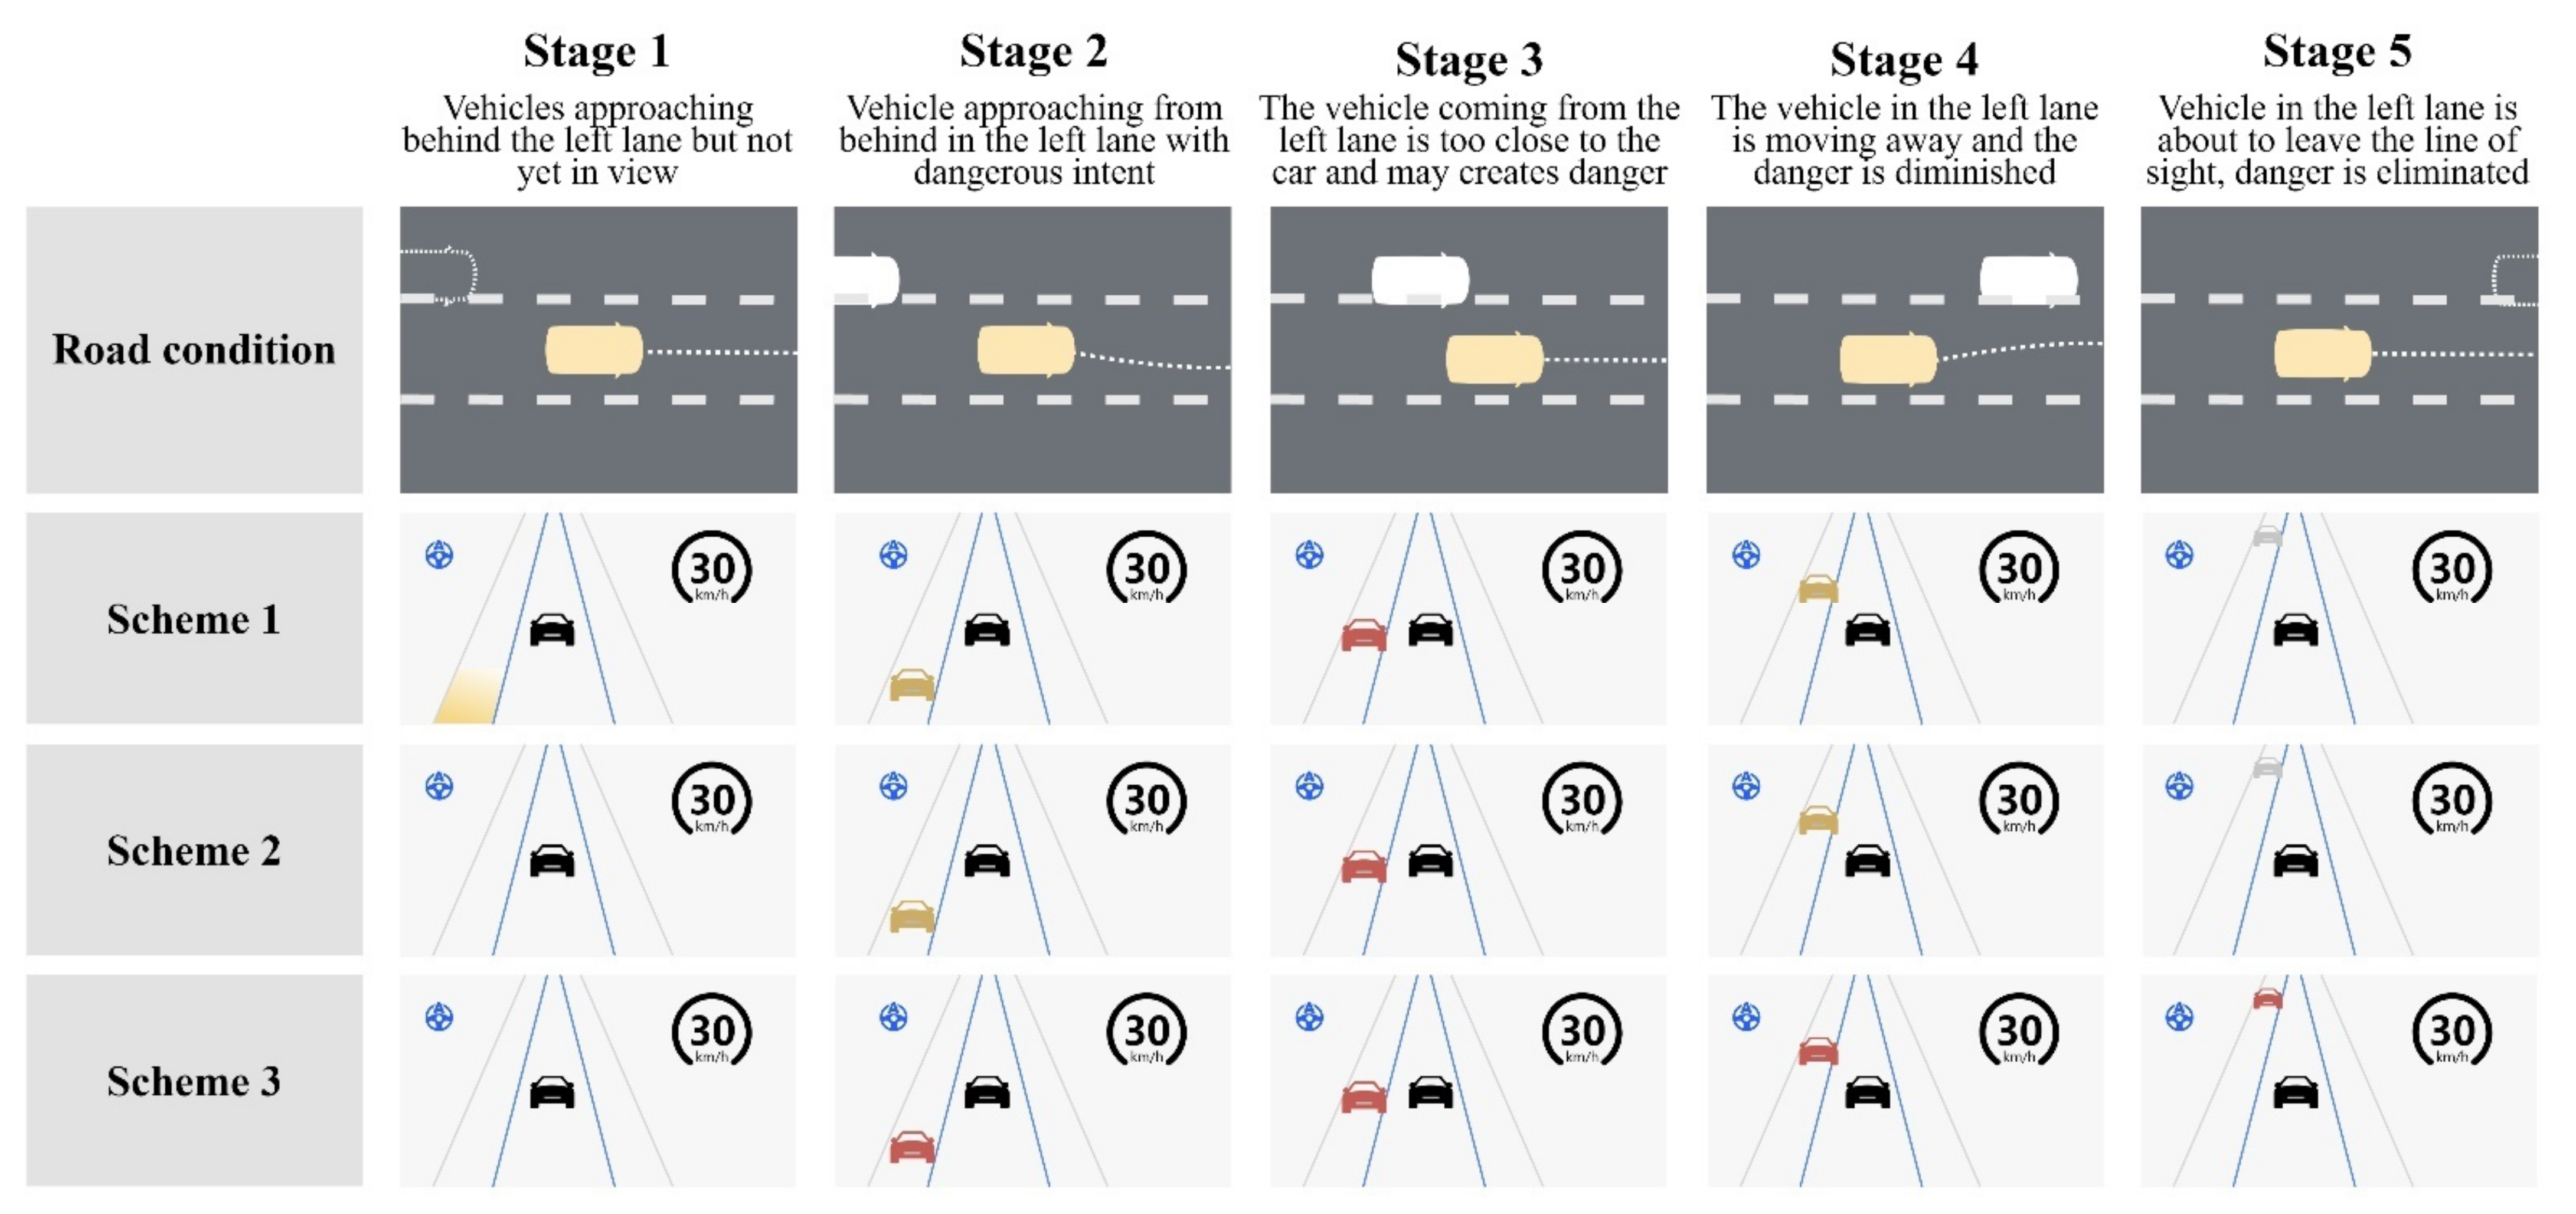
4.3. Selection of Experimental Scenarios and Requirement Analysis of SSA Information
- Human–machine status: the automated driving status—the icon of using the steering wheel (blue color means the automated driving function is on); the current speed—a more common circular icon containing a number that varies according to the actual speed;
- Context: a car approaching from the rear—the icon of two cars, with their relative positions in sync with the experiment process;
- Plan (only in the first stage): a potentially dangerous vehicle is about to appear in the view from the left rear—a gradient color block displayed in the left rear lane on the interface;
- Current task status: the level of danger the drive is in—color added to the vehicle on the interface, with gray, yellow, and red indicating no danger, mildly dangerous, and highly dangerous, respectively.
4.4. Experimental Environment
4.5. Experimental Process
4.6. Experimental Evaluation Method
4.6.1. SAGAT
4.6.2. After-Scenario Questionnaire
4.6.3. Task Response Time and Task Accuracy
4.6.4. Quick Interview
5. Results
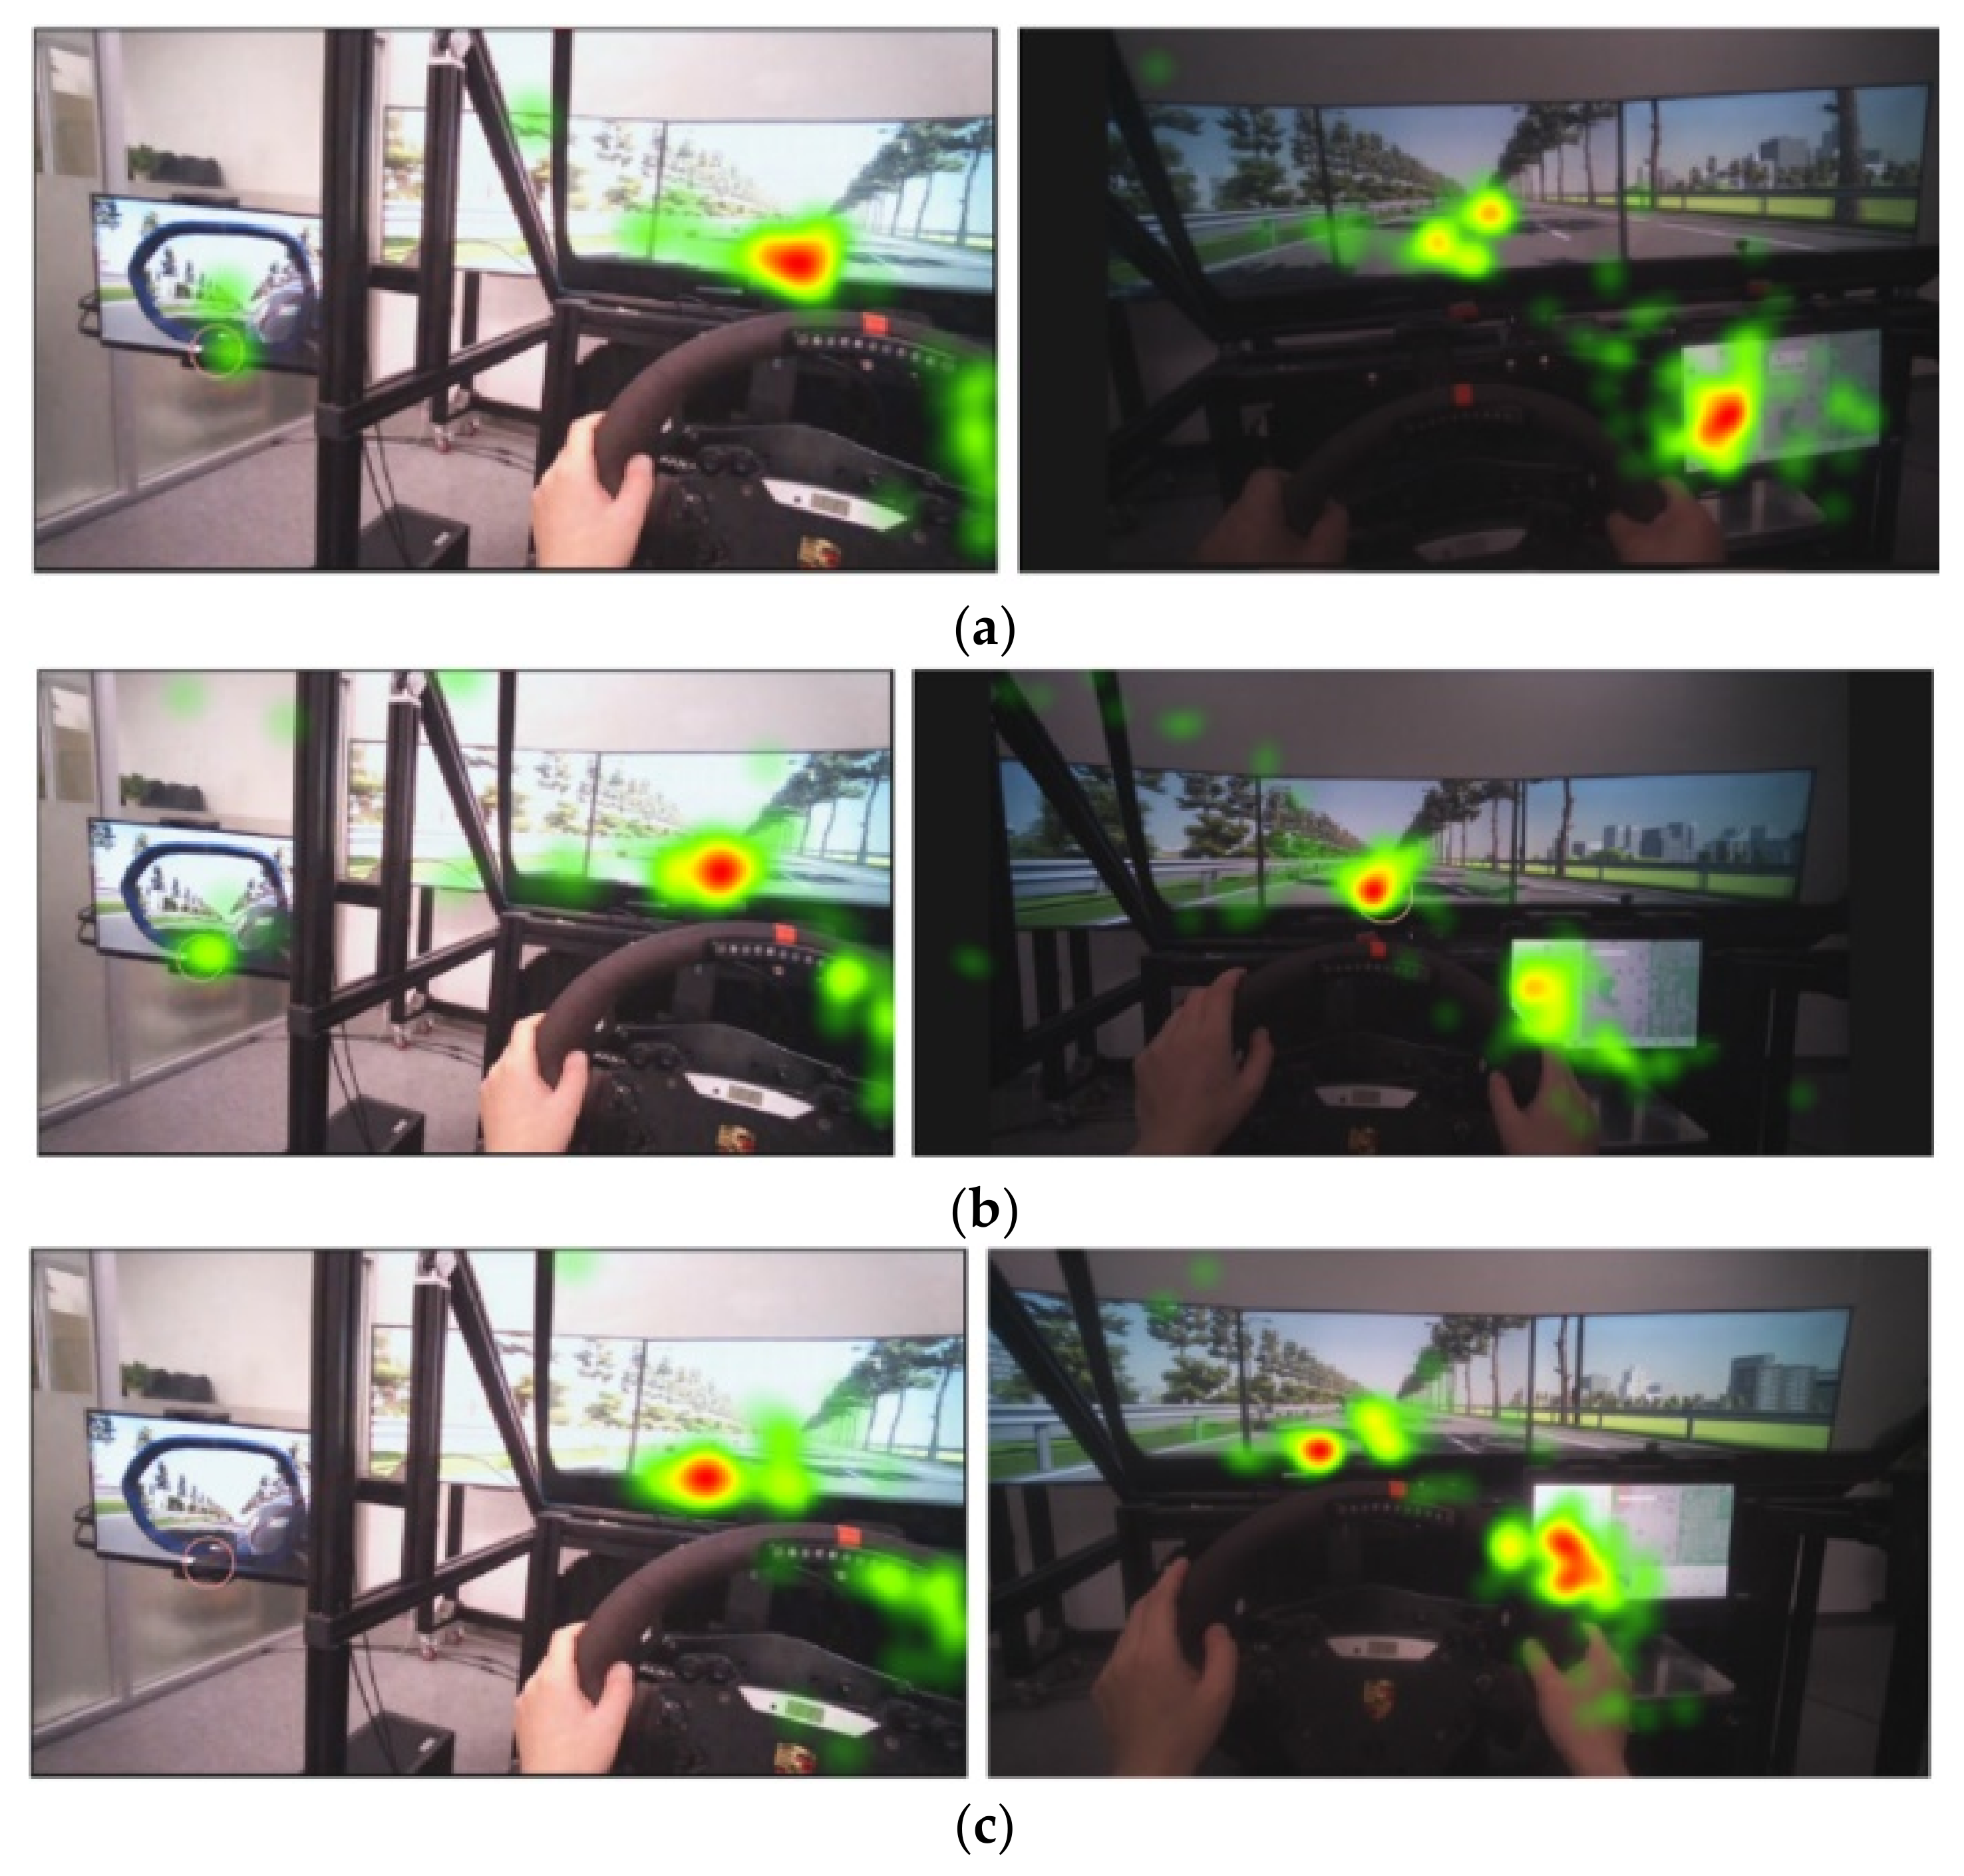
5.1. Eye Movement
5.2. Situation Awareness
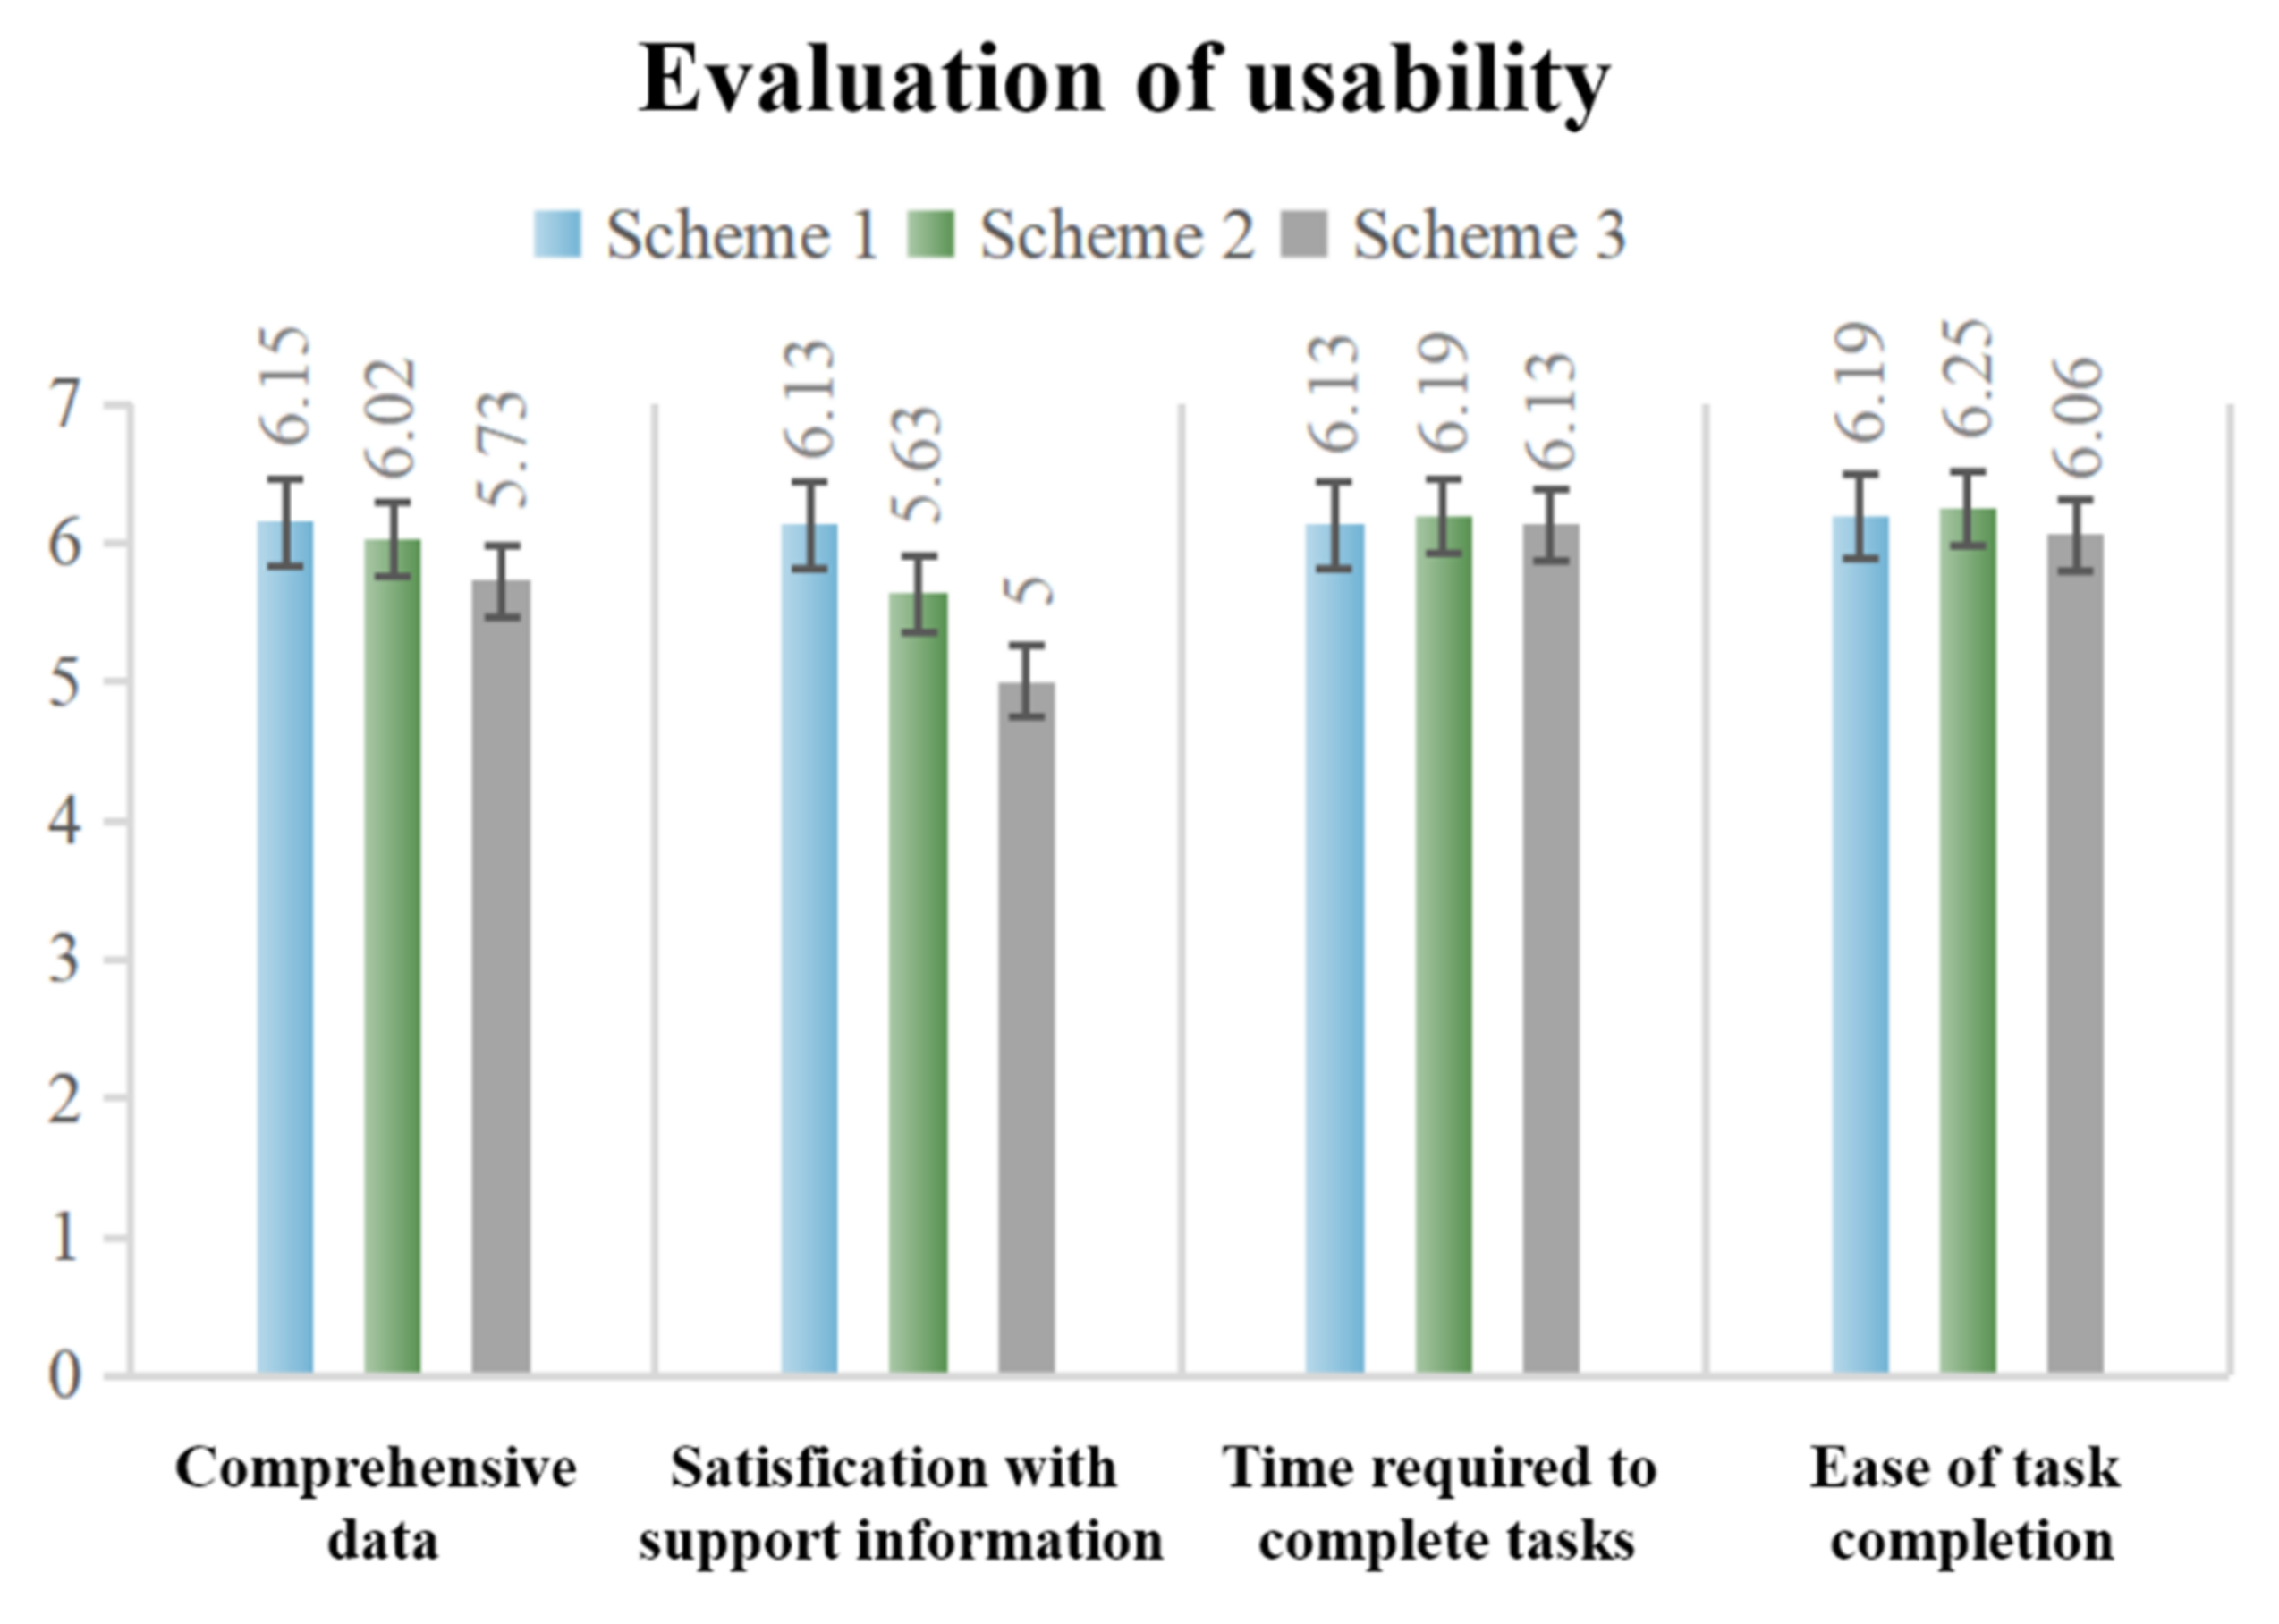
5.3. Usability
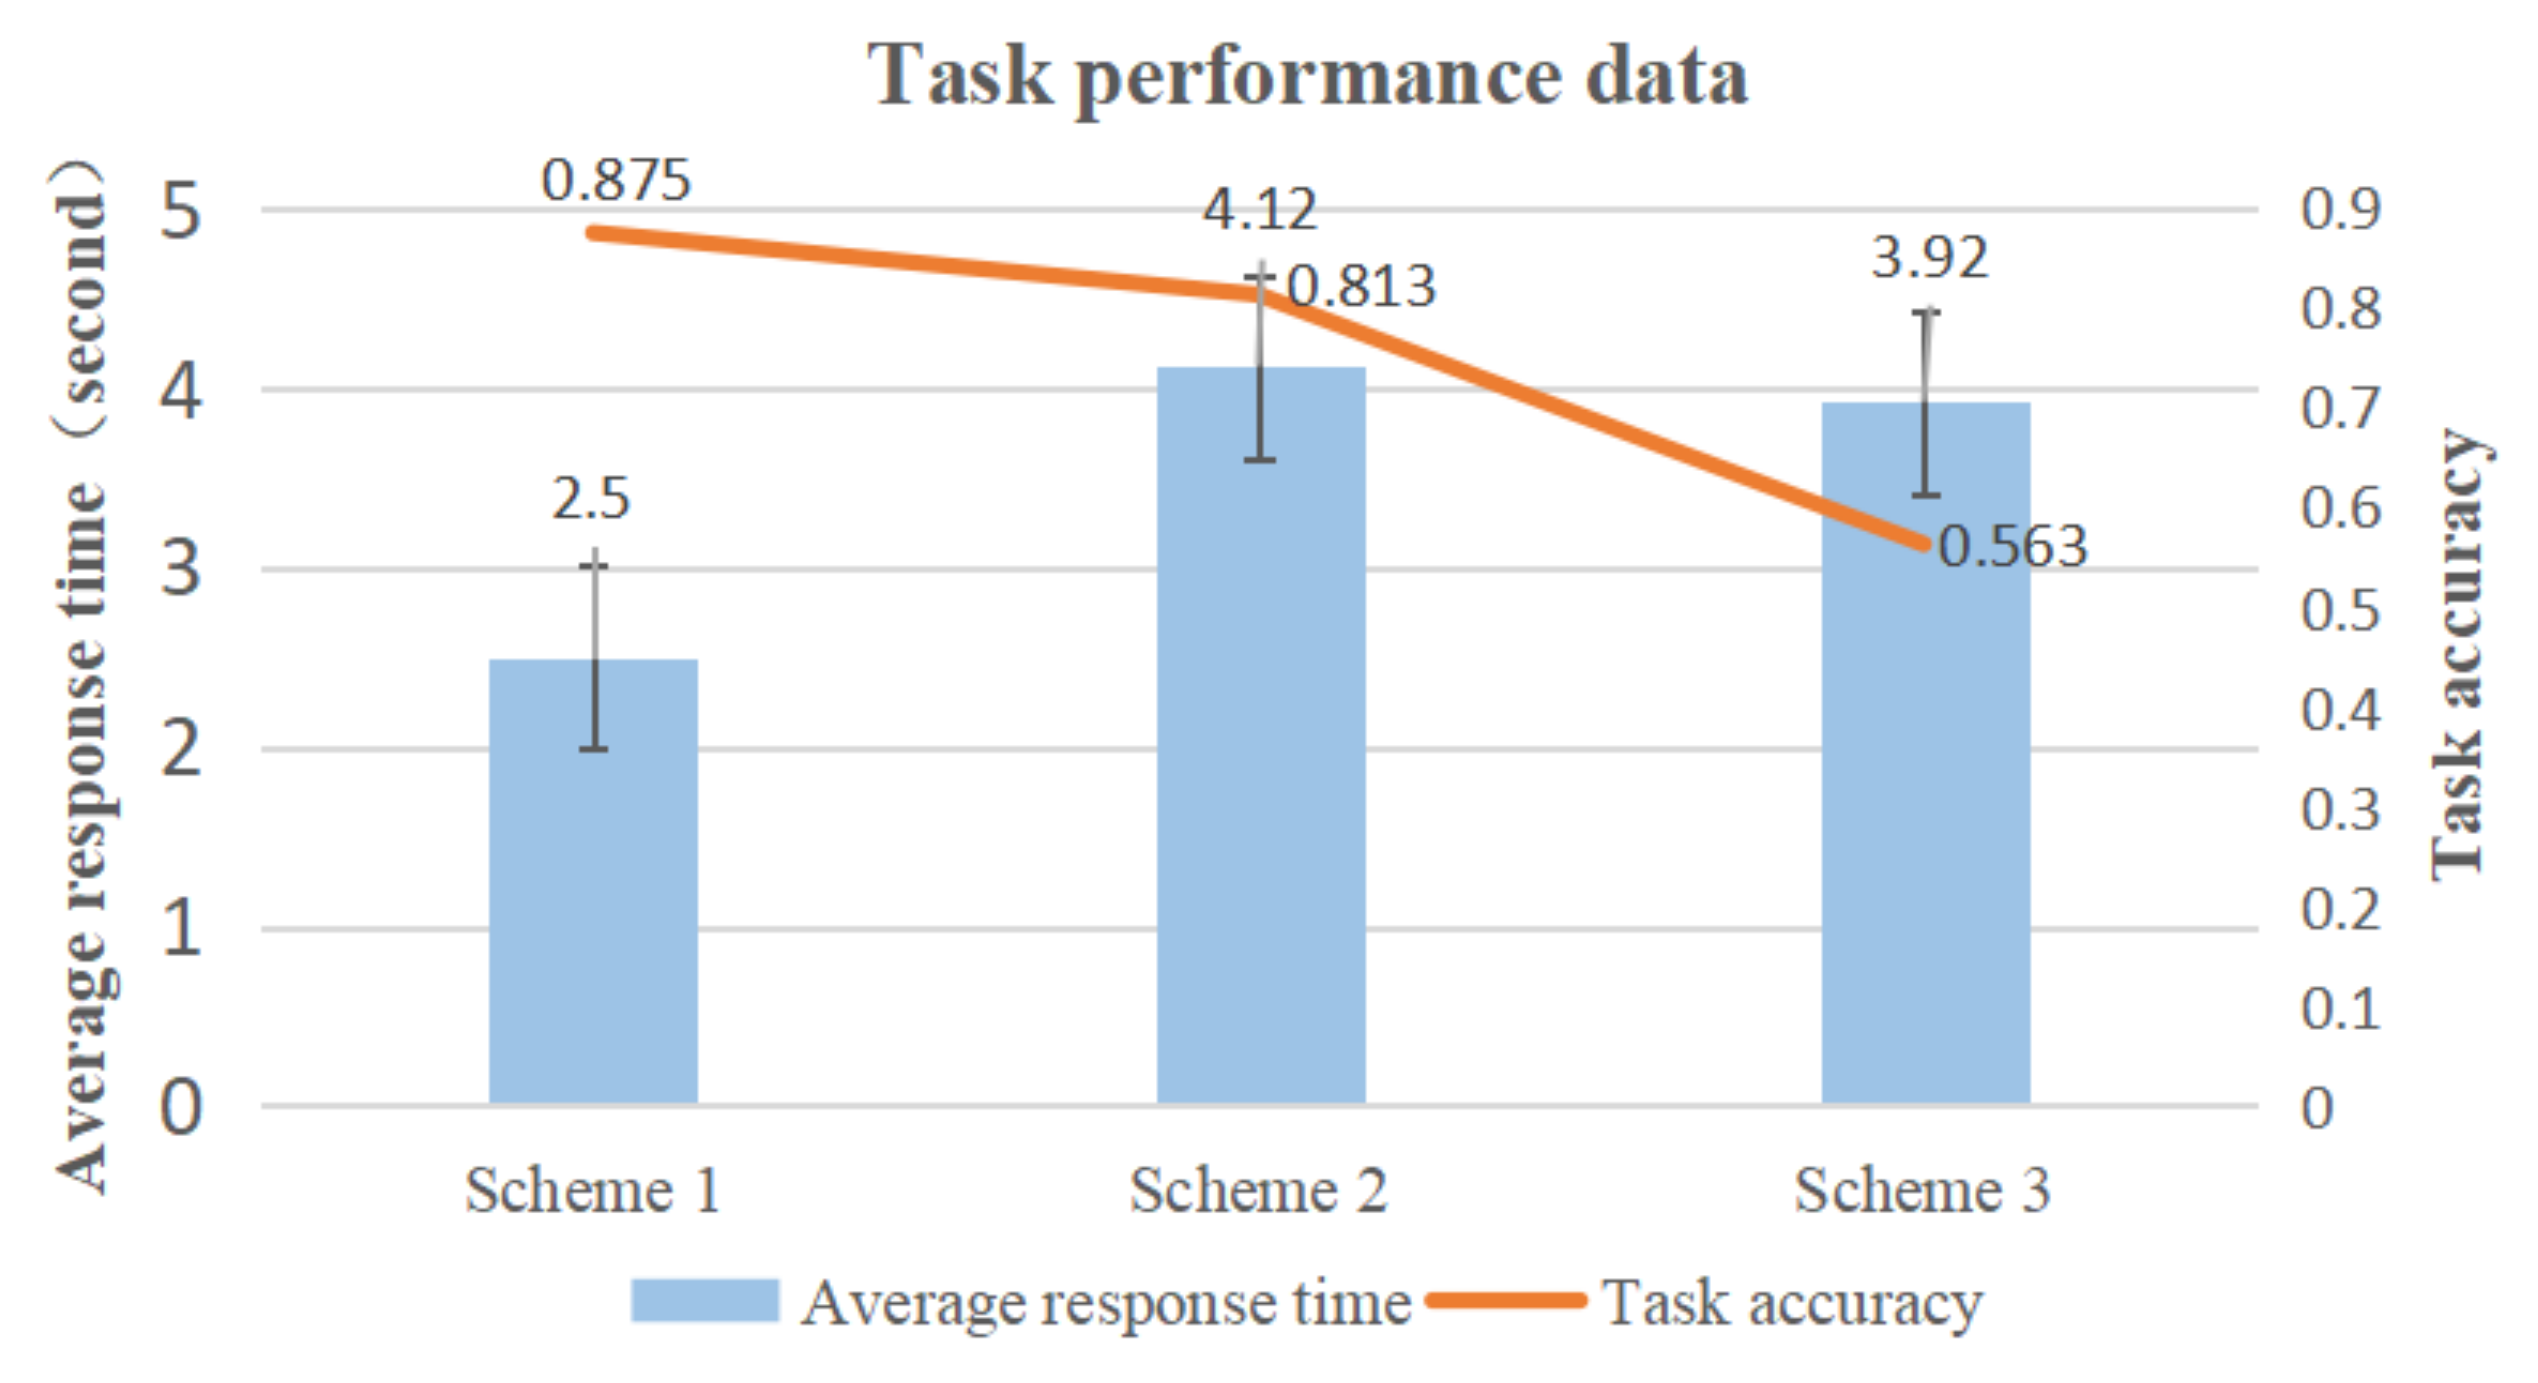
5.4. Task Response Time and Task Accuracy
5.5. Interview
6. Discussion
7. Conclusions
Author Contributions
Funding
Data Availability Statement
Conflicts of Interest
References
- Zong, C.F.; Dai, C.H.; Zhang, D. Human-machine Interaction Technology of Intelligent Vehicles: Current Development Trends and Future Directions. China J. Highw. Transp. 2021, 34, 214–237. [Google Scholar] [CrossRef]
- Hancock, P.A. Human-machine Interaction Technology of Intelligent Vehicles: Current Development Trends and Future Directions. Ergonomics 2017, 60, 284–291. [Google Scholar] [CrossRef] [PubMed]
- J3016_202104; Taxonomy and Definitions for Terms Related to Driving Automation Systems for On-Road Motor Vehicles. SAE International: Warrendale, PA, USA, 2016.
- Dixon, L. Autonowashing: The Greenwashing of Vehicle Automation. Transp. Res. Interdiscip. Perspect. 2020, 5, 100113. [Google Scholar] [CrossRef]
- Pokam, R.; Debernard, S.; Chauvin CLanglois, S. Principles of transparency for autonomous vehicles: First results of an experiment with an augmented reality human–machine interface. Cognit. Technol. Work 2019, 21, 643–656. [Google Scholar] [CrossRef]
- Walch, M.; Mühl, K.; Kraus, J.; Stoll, T.; Baumann, M.; Weber, M. From Car-Driver-Handovers to Cooperative Interfaces: Visions for Driver–Vehicle Interaction in Automated Driving. In Automotive User Interfaces; Human–Computer Interaction Series; Meixner, G., Müller, C., Eds.; Springer: Berlin/Heidelberg, Germany, 2017. [Google Scholar]
- Endsley, M.R. Situation Awareness Global Assessment Technique (SAGAT). In Proceedings of the National Aerospace and Electronics Conference (NAECON), Dayton, OH, USA, 23–27 May 1988; pp. 789–795. [Google Scholar]
- Endsley, M.R. Toward a theory of situation awareness in dynamic systems. Hum. Fact. J. Hum. Fact. Ergon. Soc. 1995, 37, 32–64. [Google Scholar] [CrossRef]
- Shi, Y.S.; Huang, W.F.; Tian, Z.Q. Team Situation Awareness: The Concept, models and Measurements. Space Med. Med. Eng. 2017, 30, 463–468. [Google Scholar]
- Ma, R.; Kaber, D.B. Situation awareness and driving performance in a simulated navigation task. Ergonomics 2007, 50, 1351–1364. [Google Scholar] [CrossRef]
- Burke, J.L.; Murphy, R.R. Situation Awareness and Task Performance in Robot-Assisted Technical Search: Bujold Goes to Bridgeport; University of South Florida: Tampa, FL, USA, 2007. [Google Scholar]
- Merat, N.; Seppelt, B.; Louw, T.; Engström, J.; Lee, J.D.; Johansson, E.; Green, C.A.; Katazaki, S.; Monk, C.; Itoh, M.; et al. The “Out-of-the-Loop” concept in automated driving: Proposed definition, measures and implications. Cognit. Technol. Work 2019, 21, 87–98. [Google Scholar] [CrossRef]
- Louw, T.; Madigan, R.; Carsten, O.M.J.; Merat, N. Were they in the loop during automated driving? Links between visual attention and crash potential Injury Prevention. Inj. Prev. 2017, 23, 281–286. [Google Scholar] [CrossRef]
- Louw, T.; Merat, N. Are you in the loop? Using gaze dispersion to understand driver visual attention during vehicle automation. Transp. Res. Part C Emerg. Technol. 2017, 76, 35–50. [Google Scholar] [CrossRef]
- Endsley, M.R.; Jones, W.M. A model of inter and intra team situation awareness: Implications for design, training and measurement. New trends in cooperative activities: Understanding system dynamics in complex environments. Hum. Fact. Ergono. Soc. 2001, 7, 46–47. [Google Scholar]
- Salas, E.; Prince, C.; Baker, D.P.; Shrestha, L. Situation Awareness in Team Performance: Implications for Measurement and Training. Hum. Fact. 1995, 37, 1123–1136. [Google Scholar] [CrossRef]
- Valaker, S.; Hærem, T.; Bakken, B.T. Connecting the dots in counterterrorism: The consequences of communication setting for shared situation awareness and team performance. Conting. Crisis Manag. 2018, 26, 425–439. [Google Scholar] [CrossRef]
- Lu, Z.; Coster, X.; de Winter, J. How much time do drivers need to obtain situation awareness? A laboratory-based study of automated driving. Appl. Ergon. 2017, 60, 293–304. [Google Scholar] [CrossRef]
- McDonald, A.D.; Alambeigi, H.; Engström, J.; Markkula, G.; Vogelpohl, T.; Dunne, J.; Yuma, N. Toward computational simulations of behavior during automated driving takeovers: A review of the empirical and modeling literatures. Hum. Fact. 2019, 61, 642–688. [Google Scholar] [CrossRef]
- Baumann, M.; Krems, J.F. Situation Awareness and Driving: A Cognitive Model. In Modelling Driver Behaviour in Automotive Environments; Cacciabue, P.C., Ed.; Springer: London, UK, 2007. [Google Scholar]
- Fisher, D.L.; Horrey, W.J.; Lee, J.D.; Regan, M.A. (Eds.) Handbook of Human Factors for Automated, Connected, and Intelligent Vehicles, 1st ed.; CRC Press: Boca Raton, FL, USA, 2020; Chapter 7. [Google Scholar]
- Park, D.; Yoon, W.C.; Lee, U. Cognitive States Matter: Design Guidelines for Driving Situation Awareness in Smart Vehicles. Sensors 2020, 20, 2978. [Google Scholar] [CrossRef]
- Mahajan, K.; Large, D.R.; Burnett, G.; Velaga, N.R. Exploring the benefits of conversing with a digital voice assistant during automated driving: A parametric duration model of takeover time. Transp. Res. Part F Traffic Psychol. Behav. 2021, 80, 104–126. [Google Scholar] [CrossRef]
- Ho, C.; Spence, C. The Multisensory Driver: Implications for Ergonomic Car Interface Design, 1st ed.; CRC Press: Boca Raton, FL, USA, 2008. [Google Scholar]
- Debernard, S.; Chauvin, C.; Pokam, R.; Langlois, S. Designing Human-Machine Interface for Autonomous Vehicles. IFAC-PapersOnLine 2016, 49, 609–614. [Google Scholar] [CrossRef]
- Xue, J.; Wang, F.Y. Research on the Relationship between Drivers’ Visual Characteristics and Driving Safety. In Proceedings of the 4th China Intelligent Transportation Conference, Beijing, China, 12–15 October 2008; pp. 488–493. [Google Scholar]
- Wang, C.; Weisswange, T.H.; Krüger, M. Designing for Prediction-Level Collaboration Between a Human Driver and an Automated Driving System. In AutomotiveUI ‘21: Proceedings of the 13th International Conference on Automotive User Interfaces and Interactive Vehicular Applications, Leeds, UK, 9–14 September 2021; Association for Computing Machinery: New York, NY, USA, 2021; pp. 213–216. [Google Scholar]
- Guo, C.; Sentouh, C.; Popieul, J.-C.; Haué, J.-B.; Langlois, S.; Loeillet, J.-J.; Soualmi, B.; That, T.N. Cooperation between driver and automated driving system: Implementation and evaluation. Transp. Res. Part F Traffic Psychol. Behav. 2019, 61, 314–325. [Google Scholar] [CrossRef]
- Zimmermann, M.; Bengler, K. A multimodal interaction concept for cooperative driving. In Proceedings of the 2013 IEEE Intelligent Vehicles Symposium (IV), Gold Coast, QLD, Australia, 23–26 June 2013; pp. 1285–1290. [Google Scholar]
- Kraft, A.K.; Maag, C.; Baumann, M. Comparing dynamic and static illustration of an HMI for cooperative driving. Accid. Anal. Prev. 2020, 144, 105682. [Google Scholar] [CrossRef]
- Stanton, N.A.; Salmon, P.M.; Walker, G.H.; Jenkins, D.P. Cognitive Work Analysis: Applications, Extensions and Future Directions; CRC Press: Boca Raton, FL, USA, 2017; pp. 8–19. [Google Scholar]
- Khurana, A.; Alamzadeh, P.; Chilana, P.K. ChatrEx: Designing Explainable Chatbot Interfaces for Enhancing Usefulness, Transparency, and Trust. In Proceedings of the 2021 IEEE Symposium on Visual Languages and Human-Centric Computing (VL/HCC), St. Louis, MO, USA, 10–13 October 2021; pp. 1–11. [Google Scholar]
- Schneider, T.; Hois, J.; Rosenstein, A.; Ghellal, S.; Theofanou-Fülbier, D.; Gerlicher, A.R.S. ExplAIn Yourself! Transparency for Positive UX in Autonomous Driving. In Proceedings of the 2021 CHI Conference on Human Factors in Computing Systems (CHI ‘21), Yokohama Japan, 8–13 May 2021; Association for Computing Machinery: New York, NY, USA, 2021. Article 161. pp. 1–12. [Google Scholar]
- Endsley, M.R. Direct Measurement of Situation Awareness: Validity and Use of SAGAT. In Situation Awareness Analysis and Measurement; Lawrence Erlbaum Associates Publishers: Mahwah, NJ, USA, 2000; pp. 147–173. [Google Scholar]
- Lewis, J.R. Psychometric evaluation of an after-scenario questionnaire for computer usability studies. ACM Sigchi Bull. 1991, 23, 78–81. [Google Scholar] [CrossRef]
- Sauro, J.; Lewis, J.R. Chapter 8—Standardized Usability Questionnaires, Quantifying the User Experience, 2nd ed.; Morgan Kaufmann: Burlington, MA, USA, 2016; pp. 185–248. [Google Scholar]
- Cohen, J. A Coefficient of Agreement for Nominal Scales. Educ. Psychol. Meas. 1960, 20, 37–46. [Google Scholar] [CrossRef]


| Old Labels | New Labels | Description |
|---|---|---|
| Functional purposes | Functional purposes | The purposes of the work system and the external constraints on its operation |
| Abstract functions | Values and priority measures | The criteria that the work system uses for measuring its progress toward the functional purposes |
| Generalized functions | Purpose-related functions | The general functions of the work system that are necessary for achieving the functional purposes |
| Physical functions | Object-related processes | The functional capabilities and limitations of physical objects in the work system that enable the purpose-related functions |
| Physical form | Physical objects | The physical objects in the work system that afford the object-related processes |
| Human–Machine Status | Context | Plan | Current Task Status | |
|---|---|---|---|---|
| Scheme 1 | ✓ | ✓ | ✓ | ✓ |
| Scheme 2 | ✓ | ✓ | ✓ | / |
| Scheme 3 | ✓ | ✓ | / | / |
| Factors | Descriptions |
|---|---|
| Human–Machine status | Display the current automated driving status, current vehicle speed, etc. |
| Plan | Indicative message of the presence of vehicles behind |
| Current task status | Prompt for the level of vehicle hazard intent |
| Context | The position change of the oncoming vehicle behind, the relative positional relationship between the oncoming vehicle and own vehicle |
| Satisfaction with Support Information | ||
|---|---|---|
| Prediction | r | 0.488 ** |
| p | 0.000 < 0.001 |
| Scheme (Mean ± Standard Deviation) | F | p | |||
|---|---|---|---|---|---|
| 1 | 2 | 3 | |||
| Reaction time | 2.50 ± 0.75 | 4.12 ± 0.75 | 3.92 ± 0.64 | 24.217 | 0.000 ** |
| Question | Interview Results | |||
|---|---|---|---|---|
| Answer 1 (Rate) | Answer 2 (Rate) | Answer 3 (Rate) | ||
| 1 | Notice the differences? | Yes. (16/16) | ||
| 2 | Prefer which scheme and why? | Scheme 1. (12/16)
| Scheme 2. (3/16)
| Scheme 3. (1/16)
|
| 3 | Attitude of subjective trust | Trust Scheme 1 the most. (12/16) | Trust Scheme 1 and Scheme 2, but not Scheme 3. (3/16) | Trust actual observation more than interface display. (1/16) |
| 4 | Other subjective feelings | Driving habits may affect experimental observations. (3/16) | Red is more likely to attract attention. (15/16) | Being red all the time will bring a sense of tension. (15/16) |
Publisher’s Note: MDPI stays neutral with regard to jurisdictional claims in published maps and institutional affiliations. |
© 2022 by the authors. Licensee MDPI, Basel, Switzerland. This article is an open access article distributed under the terms and conditions of the Creative Commons Attribution (CC BY) license (https://creativecommons.org/licenses/by/4.0/).
Share and Cite
You, F.; Yan, X.; Zhang, J.; Cui, W. Design Factors of Shared Situation Awareness Interface in Human–Machine Co-Driving. Information 2022, 13, 437. https://doi.org/10.3390/info13090437
You F, Yan X, Zhang J, Cui W. Design Factors of Shared Situation Awareness Interface in Human–Machine Co-Driving. Information. 2022; 13(9):437. https://doi.org/10.3390/info13090437
Chicago/Turabian StyleYou, Fang, Xu Yan, Jun Zhang, and Wei Cui. 2022. "Design Factors of Shared Situation Awareness Interface in Human–Machine Co-Driving" Information 13, no. 9: 437. https://doi.org/10.3390/info13090437
APA StyleYou, F., Yan, X., Zhang, J., & Cui, W. (2022). Design Factors of Shared Situation Awareness Interface in Human–Machine Co-Driving. Information, 13(9), 437. https://doi.org/10.3390/info13090437