Abstract
In the context of e-commerce, online travel agencies often derive useful information from online reviews to improve transactions. Based on the dispute on the usefulness of different types of reviews and social exchange theory, this study investigates how the characteristics of pictures and text influence review reading and review posting behaviors and thus influencing the efficiency of online review systems. By analyzing crawled data of online hotels and conducting experiments, we first find that picture reviews are more useful than text reviews, and high-quality pictures in reviews have a significant impact on review usefulness. Second, posting pictures requires review posters to pay more perceived costs. Third, negative review posters have higher perceived costs, so they are more unwilling to post pictures, especially high-quality pictures. Our results indicate that review platforms need to add incentives to encourage consumers to post high-quality picture reviews and design workable interfaces to reduce the burden of negative reviewers to speed up the purchase decision process for review readers. This study provides theoretical implications by demonstrating how the adoption of the picture in review systems influences both review readers’ and review posters’ behaviors. Additionally, our findings also provide useful managerial insights for online travel suppliers in terms of building an effective review system to promote sales.
1. Introduction
One of the most challenging issues online travel agencies are facing is how to build an effective review system to promote hotel sales. The review system acts like an electronic knowledge repository by which early adopters contribute information to populate the system, and consumers seek knowledge from the system for reuse. To overcome the difficulty of information overload, picture reviews are deployed to make it easier and quicker to access valuable information [1]. Its emergence provides scholars with a new orientation to examine word of mouth, which is recognized as the most important driver of sales, and to obtain a deeper understanding of consumer review posting behaviors [2]. Our work aims at investigating how different types of reviews affect the perceived usefulness of review readers and whether there is a significant difference in perceived costs between different types of review posting behaviors.
Some research suggests that the dynamics of pictures implemented in the review system facilitate the delivery of product information. First, visual information greatly affects people’s memory compared with text information. The information presented by the image stimulates more cognitive elaboration, which leads to the development of more storage locations and paths in the memory and, in turn, increases the likelihood of retrieving the information in later recall tasks [3]. As suggested by Mitchell and Olson, when an advertising message contains a picture, as consumer reviews do, users can better remember and recognize the relevant information [4]. Second, previous research suggests that people have different abilities to understand visual reviews and text reviews because reading words usually takes more time and effort than pictures [5]. No matter what types of products, consumers are more likely to pay attention through the presentation of pictures, which improve their cognitive ability, because an individual’s perception of pictures is physically similar to the real objects [6]. They are able to imagine that the objects in the pictures seem to be “here” and “now”, which will generate a relatively close sense of psychological distance and reduce consumers’ perceived risk [5,7]. In sum, pictures are often better at deepening consumers’ understanding of a hotel’s profile than text and therefore enhancing review information delivery. Moreover, pictures with high definition provide a visually appealing experience for consumers, helping them quickly gain more information and details about the product and speed up the decision-making process. We therefore believe that the quality of pictures has an impact on the usefulness of reviews.
However, review systems deploying the form of picture reviews still do not guarantee the success of information delivery, which requires that (1) information contributors (review posters) be willing to part with their information and (2) information seekers (review readers) be willing to reuse the codified information [8]. This is because review posters always make a trade-off between effort and accuracy in the process of parting with knowledge, according to the social exchange theory [9,10]. Although picture reviews accrue higher accuracy, a corresponding effort is needed. So, we propose that consumers will choose different review posting strategies to balance these two factors. Further, effort performs asymmetrically in positive reviews and negative reviews. Dissatisfied consumers tend to have higher perceived costs, which is the result of a detail-oriented system information processing to solve the problem caused by negative emotions [11]. So, we further expect that unsatisfied customers tend to choose text reviews to reduce their effort. However, it is far from being enough to consider only the perspective of review posters. The system is efficient only if the review readers consider the dominant form of review (i.e., the reviewing manner chosen by the majority of review posters) to be more useful. Otherwise, most review posters are making vain attempts to deliver information to review readers, and consequently, the review system is collectively ineffective. Therefore, we shed light on the usefulness of the types of reviews, which should be defined in our work as the capability of a reviewing form that is helpful for the decision-making process, rather than the ability to promote sales. Usefulness is an important indicator to value whether a review is helpful to the process of making purchasing decisions and thus implicating the success of information delivery. To the best of our knowledge, no research draws attention to the review posters and review readers simultaneously to explore the effectiveness of review information delivery. This is surprising because the failure of review information delivery generates mismatched product–consumer tuples, which will bring undesirable hotel ratings and unhealthy social well-being. To address the gap, the aim of this work is to examine how review posters choose different reviewing strategies (picture versus text) to change their perceived costs and which type of review is more useful to review readers. We also shed new light on the difference in review posting intention between negative reviews and positive reviews. As a result, we can figure out whether the review system is effective in terms of the emergence of picture reviews.
Our research questions are: what types of reviews do review readers consider more useful? What types of review posting requires more perceived costs for review posters? Is there any difference in the perceived costs between positive consumers and negative reviewers? To answer these questions, we first develop our hypotheses that picture reviews, especially high-quality pictures, possess higher usefulness for consumers by reviewing previous research. Next, building on the cost–benefit trade-off in the social exchange theory, we argue that people will tend to choose text review because it requires lower perceived costs than picture reviews. Since consumers with negative product experiences are more likely to be burdened with psychological costs, the text advantage effect is more significant for them, so they are more likely to choose text reviews than positive consumers. Further, as high-quality pictures bring higher accuracy and usefulness and hence require higher costs, we put forward that negative review posters post pictures of lower quality. Although the social exchange theory has been extensively emphasized in the consumer behavior domain [12,13,14,15], less is known about whether it affects the type-of-review selection. Next, to validate our hypotheses, we use actual online hotel review data and consumer rating data from Ctrip.com (accessed on 13 July 2022) to empirically examine whether and to what extent the perceived costs affect consumers’ intention of posting different types of reviews.
Our main results are as follows. We first confirm the higher usefulness of picture reviews, especially high-quality pictures, for review readers, and review posters’ unwillingness to adopt picture reviews. Additionally, we then further show that negative review posters endure greater unwillingness than positive review posters because of the higher perceived costs. Additionally, the quality of the pictures taken by negative review posters is significantly lower than that of positive review posters. Our empirical and analytical findings are expected to make theoretical and practical contributions. This work will further our knowledge regarding how perceived costs affect review posting behaviors, especially the reviewing strategy choice. In particular, these are important because they broaden the nature and scope of outcomes studied in e-commerce studies. Our work can guide review system implementation in e-commerce and provide insight into consumer review posting behavior, which is potentially helpful for online travel agencies to design review services to facilitate information delivery. This is also useful for hotels that are trying to seize the opportunity from the market and improve hotel quality by receiving feedback.
2. Literature Review
2.1. Usefulness of Text Reviews of Picture Review
The usefulness of online reviews is defined as the subjective perception of whether online review information is helpful to consumers in the online shopping process [16]. It is also a subjective criterion for judging the quality of online review information. Currently, most scholars are exploring the effects of review credibility [17] and review timeliness [18] on consumers’ perceived usefulness. However, they mostly study text-only reviews, while fewer studies have compared the combined text and image review formats. Only in some product advertising literature, some scholars have studied in depth the effect of pictures on customers’ willingness to make purchase decisions. For example, Marlow et al. argue that images tend to attract consumers’ attention and make them inclined to evaluate the quality of products from a visual perspective [19]. Yang et al. suggest that enhancing the visual experience in an online shopping environment through images can promote consumers’ favorable perceptions of online stores and trust in products [20]. As for user reviews, a small number of studies have also reported that user-generated photos can increase the usefulness of reviews, especially when these images appear in negative reviews [21,22,23,24]. However, contradictory findings appear in Lee’s work, who failed to find a significant relationship between the number of pictures and review usefulness [23]. Kim et al. [25] also point out that pictures can only serve as peripheral cues, but the final decisions consumers make are determined by the text. Therefore, more empirical research on the comparison of the usefulness of text reviews and picture reviews is being called for.
There are two dominant approaches in the research discussing the usefulness of online reviews. One is to collect data from e-commerce platforms, including usefulness votes, text length, text content, review posters’ profiles and different forms of comments for data analysis [26,27,28]. Another method is to design experiments and questionnaires, distribute them to consumers and analyze the results [29]. A more current and novel approach is to use an eye-tracking device to measure the time people spend on text and images while reading reviews in order to determine which reviews are preferred and how useful they are [30]. Due to equipment limitations, this study uses the first two methods to compare the usefulness of text review and picture review.
2.2. Perceived Costs of Review Posters
Review usefulness is assessed from the perspective of the review reader. How to motivate review posters to write reviews is also an issue that has been widely studied. The willingness to spread word of mouth usually includes four types of motivation: self-involvement, others’ involvement, product involvement and information involvement [31]. Self-involvement refers to highlighting the value of the reviewer’s self. Others’ involvement means helping other consumers obtain more goods and services. Product involvement refers to engaging in reviews for emotional catharsis, such as supporting or punishing the merchant. Information ingestion refers to being stimulated by commercial behavior. All of these motivations can be categorized as rewards from the act of reviewing. However, less has been investigated regarding the perceived costs required in posting reviews. To the best of our knowledge, Ref. [32] is the first study exploring the difference in costs between posting reviews by phones and laptops. Against this backdrop, our study seeks to find out whether there is a similar difference between two groups of variables: picture reviews versus text reviews, and positive reviews versus negative reviews.
Our research hypotheses on the perceived costs of review information delivery are based on the social exchange theory. Consumer reviews have been extensively explained using the social exchange theory [8,33,34,35,36,37]. Consumers share their consumption experiences to deliver product information in the form of reviews, with a general but not exact and clear expectation of the future benefits [8]. The social exchange theory encompasses different factors. We specifically draw on the cost–benefit trade-off to explain the mechanisms underlying the review strategy choice.
Significant empirical evidence has supported the view that decision makers always take costs and benefits into consideration and that they pay attention to the trade-off between accuracy (or, in other words, the optimized results) and efforts in making a decision [9,10,38,39,40]. A decision maker always needs to make an effort to obtain enough information, so that they will not regret it in the future. Therefore, the objectives that an individual has to maximize the benefits (or the resulting quality of their decision) and minimize the effort that is deployed to gain informative determinants and even take the action are often in conflict [8]. Although a large amount of the literature focuses on how the increase in benefits will change the way people share information (e.g., Refs. [12,13,14,15]), whether and how changes in the perceived costs resulting in the execution of review posting behavior influence the information delivery process is left unexplored. Therefore, a key distinction between past research on review information delivery and our work pertains to whether the perceived costs and benefits are both considered, in particular, being incorporated in the review strategy choice. Although it has been shown that dissatisfied consumers are less likely to post reviews using mobile phones, because choosing a nonmobile device lowers their effort in the mobile–non-mobile reviewing strategy selection [32], the picture–text reviewing strategy choice remains unstudied. To address the backdrop, our study proposes that the distinguishing characteristics of picture posting behavior and text posting behavior can change the perceived costs of the information sharing process in terms of time and perceived effort. Additionally, therefore, consumers are significantly more unwilling to post picture reviews, particularly with negative consumption experiences.
2.3. Quality of Review Pictures
Pictures with a higher aesthetic rating are generally more compelling. Pictures with interesting composition elements and great use of color can bring humor and impact. Image acquisition may introduce Gaussian noise due to hardware conditions and environmental factors, and image compression may bring about phenomena such as the block effect and blurring of images [41,42]. These unavoidable image quality losses affect the adequacy and accuracy of image information representation and affect people’s visual perception. The topic of image quality has been extensively studied in the fields of medical imaging and newspaper printing [43]. Image characteristics include color characteristics, quality characteristics, shape characteristics and spatial relationship characteristics. The methods for processing these features are often proposed in areas with high aesthetic requirements. However, very few scholars have studied the importance of image quality in reviews on e-commerce platforms. Therefore, this study presents the impact of image quality on the usefulness of review readers and the high or low quality of images posted by different review posters.
3. Hypotheses’ Development
In the information proactively published by consumers, different forms of presentation have a different impact on consumers. Relevant studies have proved that when the information left by users contains pictures, the usefulness of this online review will be greater than a pure text review [44,45]. Additionally, there is literature suggesting that the spread speed and coverage of visual reviews posted by consumers on the internet will be faster and wider than online comments without pictures or videos [46,47] because, for consumers, it usually takes more time and energy to read text reviews than visual reviews. Visual reviews can show the product’s spatial, motion and tactile information clues, which is appropriate for most consumers. The degree of reliability is also stronger than in other forms of online reviews [48]. In sum, picture reviews are superior to text reviews in the following aspects. First, individuals can simultaneously recognize and interpret picture information across the two cognitive systems of text and vision, which will lead to the “picture advantage effect”, thus enabling individuals to understand picture information more fully and remember it more deeply [49]. Second, online reviews attached with pictures illustrate detailed product information beyond what can be explained by plain words [1]. Third, since pictures are less likely to be fake, it greatly enhances the authenticity and credibility of the reviews and thus reduces consumers’ perceived risk and psychological distance [7]. So, consumers often trust pictures more and make purchasing decisions dependent on picture reviews. To sum up, the nature of picture reviews is superior to text reviews in conveying as much useful information as possible. Therefore, we put forward the first hypothesis:
Hypothesis 1 (H1).
Picture reviews are more useful for review readers than text reviews.
While images may increase the credibility of a comment compared to text, the quality of the image can also have an impact on its usefulness. For example, some websites and web pages are aesthetically pleasing and place great importance on color distribution. The mood and behavior of the viewer as well as the experience can be significantly influenced by the appearance of the page. For comments, however, comment readers are more interested in how well the image matches reality than in the photography skills of the comment publisher. They prefer to see high-quality images that are clear and informative. We therefore propose the following hypothesis:
Hypothesis 2 (H2).
High-quality pictures are more useful for review readers.
Unfortunately, while review readers prefer to see picture reviews, posting picture reviews is more difficult than posting text reviews. Consistent with the higher benefit that pictures can bring—for example, pictures have higher accuracy in showing what words cannot [50]—more time and effort required to codify and input knowledge into picture reviews can act as opportunity costs. Specifically, in addition to writing explanatory words, review posters have to take pictures from appropriate angles, edit the pictures and upload these files onto the review forum. Therefore, choosing a reviewing strategy must weigh the benefit against the cost, according to the social exchange theory. However, the effort may typically be weighted more heavily than the accuracy because the feedback on effort expenditure is relatively immediate, while the feedback on accuracy is subject to both delay and ambiguity [51]. So, we argue that consumers will tend to choose the reviewing strategy requiring the least amount of effort while giving up accuracy. From the above statements, we put forward the following hypothesis:
Hypothesis 3 (H3).
Posting picture reviews requires more perceived costs than posting text reviews.
Bad experiences can trigger negative emotions in the body, leading to anxiety and irritability. This emotional state tends to reduce human action and increase the difficulty of completing tasks. Negative emotions can also distract attention and interfere with the ability to grasp information and the behavior the body wants to perform. Dissatisfied consumers tend to have higher perceived costs, which is the result of detail-oriented system information processing to solve the problem caused by negative emotions [11,32]. Dissatisfied consumers often need to recall all kinds of details and unhappiness during their stay in order to retaliate against the hotel and vent their emotions when writing reviews. They have more information to process than satisfied consumers, and the anger of recalling an unpleasant experience discourages review writing. To reduce the cost to themselves, they often need to choose an easier way to comment. Posting a picture requires taking a picture, selecting a picture from a phone and uploading it, which is more difficult than posting a text review, so we suggest that dissatisfied consumers are less likely to post a picture review. Further, dissatisfied consumers often do not write comments until after checking out for fear of retribution. Additionally, when they check out, they may not be able to take pictures of the room and provide evidence of a bad stay, so they may give up on writing picture reviews. We therefore propose that they show a higher probability to choose a reviewing strategy that can reduce costs. We hypothesize:
Hypothesis 4 (H4).
Negative review posters are less willing to post picture reviews than positive review posters.
Similarly, because negative review posters are under psychological pressure in recalling the experience, they will have less energy to shoot and post high-quality images. Therefore, we propose the following hypothesis:
Hypothesis 5 (H5).
Negative review posters post pictures of lower quality.
Our hypotheses are logically related and self-contained. Generalizing from a more understandable language, people prefer to read reviews with pictures (H1) and prefer to see high-quality pictures (H2). However, consumers, especially those with negative experiences, do not like to post images because it requires higher perceived costs (H3, H4). Additionally, the consumers’ experience is positively related to the quality of the pictures they post (H5).
4. Method
Our method consists of two parts: crawled data analysis and experiments. Among them, H1, H2, H4 and H5 are tested in the crawled data analysis part because the variables in these hypotheses can be quantified in the data obtained online. However, the “perceived cost” in H3 could not be assessed directly from online data, so we designed scenario-based experiments to investigate the participants’ perceived cost of writing negative and positive reviews. Second, we think that review usefulness, measured as a binary variable in the crawl data analysis, had insufficient explanatory power for H1, so we designed another experiment to quantify review usefulness as a continuous value to examine H1. Finally, to explore whether negative review posters are less likely to post images than positive review posters because of their higher perceived cost (H4), we also designed experiments to examine this.
4.1. Variable Measurement in the Research Framework
In order to show the relationship of our five hypotheses more clearly, Table 1 illustrates the independent and dependent variables of each hypothesis.

Table 1.
Variables defined for each hypothesis.
Type of review is a categorical variable. Since e-commerce sites have restrictions on the number of pictures that reviewers can post, and few people post videos, we consider comments that attach at least one picture as “picture reviews”. Reviews with only text are considered “text reviews”. The categorization is the same in both crawled data analysis and experiments.
Quality of pictures. We measure this variable by picture definition. When taking a picture, one will see the autofocus process of the camera, which gradually creates a relatively sharp image. We use the Laplace operator to calculate the edge information of the picture. The higher the picture definition, the greater the variance of the corresponding picture after filtering by the Laplace operator. The API cv2.Laplacian provided by OpenCV is used.
Type of review posters includes positive review posters and negative review posters. In the analysis of the crawled data, we use two scales to categorize the type of review posters. As for the first scale, posters scoring 5 are regarded as positive review posters (positive score = 5) and others as negative review posters (negative score < 5). The categorization is based on the quartile. To enhance robustness, the second scale considers posters scoring less than 3 as negative review posters (negative score < 3) and others as positive review posters (3 < positive score ≤ 5). In the experiments, participants are randomly divided into positive review posters and negative review posters in advance.
Review score is only involved in the section of crawled data analysis because we did not set experiments to test H5. We measure this variable using the scores of reviews. A lower score stands for a higher degree of negative emotion. It is a discrete variable in most e-commerce platforms.
Review usefulness. In the analysis of the crawled data, this variable is binary. If the review is labeled as “helpful”, we regard it as useful (coded as 1) and otherwise non-useful (coded as 0). Meanwhile, in the experiment of Section 5, we ask participants to evaluate the usefulness of reviews by scoring them using a 7-point Likert scale. So, the usefulness in the second model ranges from 1 to 7.
Perceived costs This is the average measurement in the experiments section, asking participants two measurement questions based on a scale: “Question 1: How much effort did you put into writing the review?” and “Question 2: How much estimated time did you spend on writing the review?”. The Likert scale ranges from 1 (no effort) to 7 (extremely high level of effort) and 1 (less than 30 s) to 7 (more than 4.5 min).
4.2. Online Review Data
To verify our hypotheses, we collected online review data from Ctrip.com (accessed on 13 July 2022), the most popular hospitality platform in China. Our main tools for data collection and data processing were python and spss statistics. Our sample included 217 hotels in Shenzhen, a famous tourism destination. To avoid the potential heterogeneity effect, we collected the data in a stratified sampling way. Firstly, we classified all the hotels in Shenzhen into groups based on their locations, opening years and average prices. Then, we calculated the number in each group we needed to sample according to the overall proportions. Finally, we obtained a total of 205,090 review data from 217 hotels, spanning from November 2017 to November 2020.
The restaurant-level data consist of information such as the hotel’s name, concrete location, number of reviews, overall score, amenities and other associated attributes. Figure 1 is an example of hotel features on Ctrip.com (accessed on 13 July 2022). Each piece of review data includes the reviewer’s ID, the type of room they booked, review rating, review data, whether the tag “helpful” is labeled and whether the review was posted with pictures. Figure 2 and Figure 3 are examples of text reviews (the consumer posts text only) and picture reviews (the consumer posts at least one image, regardless of whether it is accompanied by text). Because H2 and H5 involve picture quality, we used all the pictures crawled as H2′s and H5′s experimental data. Since more than one image can be included in a review, we used their average picture definition in our quality measurement.
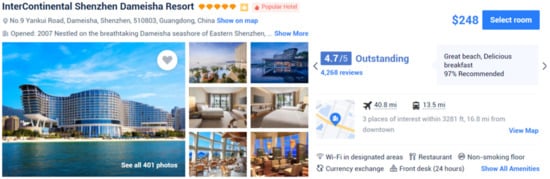
Figure 1.
Screenshot of a hotel homepage from Ctrip.com (accessed on 13 July 2022).

Figure 2.
Screenshot of a text review.
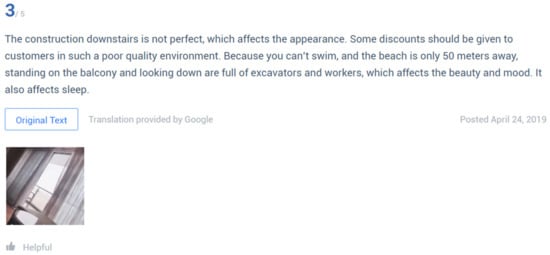
Figure 3.
Screenshot of a picture review.
4.3. Data Description
4.3.1. Customer-Level Data
Table 2 below reveals the distribution of customer reviews. Customers are allowed to grade the hotels with a maximum score of 5 and a minimum of 1. The mean of the 205,090 review scores is 4.68. We can preliminarily conclude that the majority of these reviews have a score of 5 because all of the 3 quartiles are 5.
Table 2.
Distribution of customer review scores.
Table 3 lists the distribution of review scores that inherently represents consumer satisfaction. It is noticeably shown that the largest proportion is on a score of 5 at 77.47%. Based on this, we regard a review with a score of 5 as a positive review. We also follow the rule that reviews scoring 3 or lower are considered negative reviews, as indicated by Ctrip.com (accessed on 13 July 2022). Therefore, the 12,785 negative reviews account for 6.23% of the total.
Table 3.
Distribution of review scores.
4.3.2. Helpfulness of Picture Reviews and Text Reviews
Table 4 is the distribution of usefulness of picture reviews and text reviews. Statistics show that although the number of picture reviews is lower than that of text reviews, the percentage of useful reviews in picture reviews is found to be more than 6 times that in text reviews. The ratio is 14.23% to 2.47%. This becomes a shred of apparent evidence for our first hypothesis.
Table 4.
Distribution of review scores.
4.3.3. Review Types
Table 5 compares the distribution of different types of reviews, wherein we can find that the number of text reviews is 185,943, which is approximately 10 times larger than that of picture reviews. It appears that picture reviews are significantly less likely to be posted than text reviews, which is consistent with the second hypothesis that review posters are more willing to choose text reviews rather than picture reviews. Positive reviews make up 81.92% of the picture reviews, while they are slightly lower (77.01%) for text reviews. In contrast, the percentage of negative reviews (review score ≤ 3) in text reviews is higher than that in picture reviews, with 6.34% and 5.19%, respectively. We further calculate two figures: (1) the percentage of negative reviews with pictures in negative reviews = 7.77% and (2) the percentage of positive reviews with pictures in positive reviews = 9.87%. The difference between the two figures might be evidence of the third hypothesis, that review posters with negative consumption experience are more reluctant to post picture reviews than review posters with positive consumption experience.
Table 5.
Distribution of different types of reviews.
5. Crawled Data Analysis
5.1. Review Usefulness and Perceived Costs
In this part, we conduct two tests as the pre-investigation for H1 and H4 in order to explore whether and to what extent the picture reviews are more useful to review readers than text reviews and positive review posters and negative review posters differ in their perceived costs. In both tests, we have the same treatment group and control group.
Treatment group (picture reviews). The group is made up of reviews and at least one photo posted by customers who stayed at one of the 219 hotels in Shenzhen, including 19,147 review data (see Table 3 and Table 4).
Control group (text reviews). The group consists of 185,943 data pieces posted in plain text by customers who had stayed at the same 219 hotels (see Table 3 and Table 4).
5.1.1. Test 1: A Pre-Investigation of Perceived Usefulness
To test Hypothesis 1, our dependent variable of interest is whether there is a tag of helpfulness in each review, which we define as a useful review and those without the tag as non-useful. Additionally, the independent variable is a binary variable, representing the type of review (picture versus text).
We run a logit regression analysis to answer whether usefulness is related to the type of review (Hypothesis 1). The independent variable x is the binary variable, which is 1 if the review is accompanied by at least one picture and 0 otherwise. The dependent variable y is 1 if the review is useful and 0 otherwise. So, there are four possible scenarios, shown in Table 6. Our only predictor variable is an indicator variable for being with a tag of usefulness.
where i = customer and j = treatment group and control group.
Dependent Variableij = α + β ∗ Type of Reviewij + εij,
Table 6.
Type of review—Usefulness.
Result of Test 1. Table 7 shows the results of Test 1. We find that the effect of being a picture review on the likelihood of usefulness is significant (β = 0.184, p < 0.001). In other words, picture reviews are more likely to be tagged with usefulness than text reviews, which is consistent with Hypothesis 1.
Table 7.
Result of Test 1.
5.1.2. Test 2: A Pre-Investigation of Perceived Costs
To test H4, we apply the same logic and design a model similar to Test 1. We run two main tests. To be specific, for the first main test, our dependent variable of interest is whether the score is equal to or lower than 3 for each review, whereas for the second main test, our dependent variable of interest is whether the score is equal to 5 for each review. We consider a review with a score of 3 or less to be negative (negative review ≤ 3) and positive if its score is equal to 5 (positive review = 5), in accordance with Ctrip.com (accessed on 13 July 2022).
where i = customer and j = treatment group and control group.
Dependent Variable’ij = α’ + β’ ∗ Type of Reviewij + ε’ij,
The independent variable x is the binary variable, which pertains if the review is accompanied by at least one picture and is 0 otherwise. In Test 2, the dependent variable y is 1 if it is a negative review (R.S. ≤ 3) and 0 otherwise (3 < R.S. ≤ 5). So, there are four possible scenarios, shown in Table 8. Meanwhile, in Test 3, the dependent variable y is 1 if it is a positive review (R.S. = 5) and 0 otherwise (1 ≤ R.S. < 5). So, there are also four possible scenarios, shown in Table 9.
Table 8.
Type of review—Review score 1.
Table 9.
Type of review—Review score 2.
Result of Test 2. Table 10 shows the results of Test 2. We can confirm that the relationship between the type of review and review score is significant (βnegative = −0.014, p ≤ 0.001; βpositive = 0.034, p ≤ 0.001), further implying that consumers with an unsatisfactory consumption experience are more reluctant to post pictures than consumers with satisfactory consumption experience, which is consistent with our Hypothesis 4.
Table 10.
Type of review—Review score 2.
5.2. Test 3: Picture Quality and Review Usefulness
To test H2, we use the Laplacian operator to compute the clarity of the images in the 19,147 image comments crawled. The Laplacian operator is used to measure the second-order derivatives of the images and is able to emphasize the regions in the images where the density changes rapidly, i.e., the boundaries. In normal images, the boundary is relatively clear, so the variance is larger; while in blurred images, the boundary information contained in the image is small, so the variance is smaller. The calculated image sharpness distribution is shown in Figure 4, and the quality score is mostly concentrated between 1000 and 4000. We consider picture quality as the independent variable and comment usefulness as the binary dependent variable. Table 11 shows the results of the regression, which shows that picture quality has a significantly positive effect on usefulness (β = 0.099, p < 0.001). Therefore, Hypothesis 2 is supported, indicating that people consider high-quality pictures more useful.
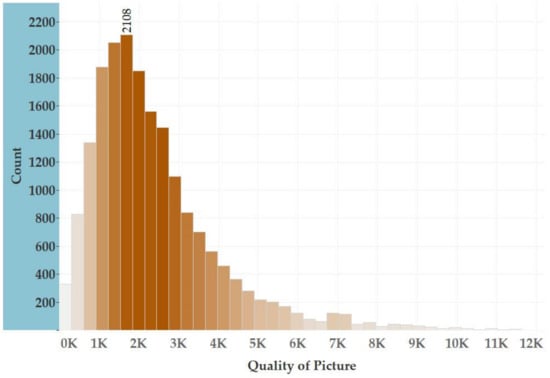
Figure 4.
Distribution of quality of pictures.
Table 11.
Results of Test 3.
5.3. Test 4: Picture Quality and Review Score
According to Hypothesis 3, we believe that posting pictures requires more cognitive effort than posting text. According to Hypothesis 4, we believe that consumers with negative experiences are less willing to post pictures because they pay more perceived costs than positive review posters. Therefore, it can be inferred that when negative review posters choose to post a picture, they are likely to discard the accuracy of photo focusing. Additionally, they photograph items in more detail rather than as a whole to complain about some trivial matters. The camera is harder to focus when shooting at close range. Therefore, negative consumers post lower-quality pictures. In this test, the dependent variable is the quality of the pictures. Additionally, the independent variable is the scores of all the picture reviews we crawled online, which is a discrete variable because people are limited by the platform’s scoring scale. Figure 5 shows the relationship between the two variables. It can be seen that excluding some outlier points, the image quality tends to increase with the increase in the score. Table 12 shows the results of this test with a standardized coefficient equal to 0.099 and a significance level of 0.000, indicating that the review scores are significantly and positively correlated with the quality of the posted pictures. Therefore, H5 is supported.
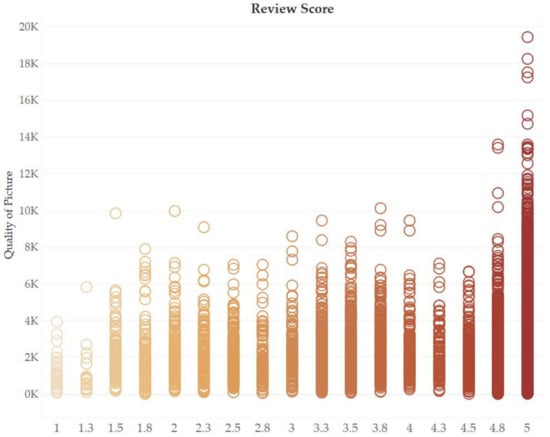
Figure 5.
The relationship between review scores and the quality of pictures.
Table 12.
Results of Test 4.
6. Experiment
In this section, we design two experiments to test our hypotheses—Experiment A for H1 and Experiment B for H3 and H4.
6.1. Experiment A
Experiment A aims to verify whether picture reviews are more useful for review readers than text reviews in terms of three measurement indicators: perceived helpfulness, perceived reliability and perceived persuasiveness. We randomly choose four 5-scored reviews from the data mentioned in Section 3. Each of them is accompanied by text and one picture. Participants were divided into two groups—the text group and the picture group. For the text group, they were first asked to read the text of the reviews (we did not provide any images) and then fill in a survey that asked about the three measurements using a 5-point Likert scale. For the picture group, the only difference was that they were provided with the original pictures of the reviews. Table 13 illustrates the variable measurement items. The more useful the reviews are to readers, the higher the score on all three measurements. In total, 200 participants were recruited in China and, after filtering, 90 questionnaires were left for the text group and 84 for the other group. Among the qualified respondents, 50.6% were females and 49.4% were males, with 86% aged between 18 and 25.
Table 13.
Research variable measurement items.
Result A. In order to test whether online review types can bring an interference effect on consumer perception, we conduct a hierarchical regression. Since the independent variable (text review/picture review) is a category variable, we treat the type of text review as a dummy variable. Table 14 shows the hierarchical regression result. The adjusted R2 = 0.285, F = 15.164, p = 0.000 < 0.05, indicating that the overall explanatory variance of the regression model reaches a significant level. In the regression model result shown in Table 15, the standardized coefficient (β) of the independent variable is positive, and the significance value is less than 0.05, indicating that the independent variable (review type) can bring a significant interference effect to the dependent variable (review readers’ usefulness). It shows that the picture reviews are more useful to readers than text reviews, thus supporting H1.
Table 14.
Overall fitting degree of the model.
Table 15.
Regression coefficients of Experiment A a.
6.2. Experiment B
Experiment B is designed to test H3 and H4. We investigate how the features of posting picture reviews and text reviews influence the perceived costs of review posters. To be more specific, we examine the degree of influence by subdividing review posters into dissatisfied consumers and satisfied consumers.
A 2 (positive consumption experience versus negative consumption experience) × 2 (picture review versus text review) between-subjects comparison is designed. In total, 220 participants were recruited and evenly divided into the positive group and the negative group. After question filtering, 88 were left in the positive group and 90 in the other group. We additionally recruited two participants to balance the number of the two conditions. Among them, 42.6% were males, and 57.4% were females, with a proportion of more than 80% aged between 18 and 25. Participants in both groups were asked to think of themselves as having lived in a hotel. They were first provided with the hotel descriptions and photos we selected from Ctrip.com. Participants in the positive group were asked to imagine that they had a positive consumption experience in the hotel. The duration of imagination was to be no less than three minutes. Additionally, they were then supposed to write a text review of 50–70 words to describe their imagination. Next, they decided whether they wanted to supplement the text review with a related picture, which they needed to choose from the two candidate pictures we provided. If the participant chose an unrelated picture for his/her text review, this review was considered invalid. In the end, they were asked to indicate their perceived costs by answering two measurement questions using a 7-point Likert scale: “Question 1: How much effort did you put into writing the review?” and “Question 2: How much estimated time did you spend on writing the review?”. The Likert scale ranged from 1 (no effort) to 7 (extremely high level of effort) and 1 (less than 30 s) to 7 (more than 4.5 min). The two measurement items were cognitive effort and time the review poster subjectively estimated. Meanwhile, for the negative group, the only difference was that participants in this experiment were supposed to imagine that they had a worse hotel stay experience.
Result B. The relevant variable we were interested in is whether a picture was added to the review. Among the 90 participants in the positive group, 37 (41.1%) chose to add a picture to their review, and all were valid. Meanwhile, only 18 participants in the negative group chose to add a picture, and 15 (17.2%) were valid. To predict whether a picture was added for each review, we ran an ordinary least-square regression. The result shows that having a negative consumption experience can negatively affect the probability of posting a picture review (see Table 16; the coefficient is −0.239, p < 0.001. H4is supported.
Table 16.
Regression coefficients1 of Experiment B a.
We also examine whether posting a picture review requires more perceived costs by running two regressions using the average score of the two measurement indicators as dependent variables—cognitive effort and estimated time. Higher average score means that review posters need to put more effort into writing the reviews. Table 17 and Table 18 show the result of the regression. Both the coefficients of positive and negative reviews are greater than 0 with a significance p < 0.001, thus supporting H3, i.e., that review posters are more willing to post text reviews than picture reviews because the latter requires higher perceived costs. In addition, the standardized coefficient of positive review (β = 0.485, p < 0.001) is smaller than that of negative review (β = 0.650, p < 0.001), indicating that dissatisfied review posters need to pay higher costs, thus supporting H4, i.e., that review posters with negative consumption experience are less willing to post picture reviews than review posters with positive consumption experience. To test whether there is a significant difference in the efforts made by positive review posters and negative review posters, we conduct a t-test on the cost scores of the two groups of data. As shown in Table 19, the mean values of the two are 2.7944 and 3.8103, respectively. In Table 20, p = 0.000 < 0.005 indicates that there is a significant difference in the effort made by the review posters of the two attitudes.
Table 17.
Regression coefficients2 of Experiment B a.
Table 18.
Regression coefficients3 of Experiment B a.
Table 19.
Descriptive statistics of two groups.
Table 20.
Results of independent samples’ t-test.
7. Conclusions
Given the importance of user-generated pictures, using such content to enhance consumer engagement is critical for e-commerce. Consumers are involved in reviews in two main capacities: as review readers and review publishers. If review posters deliver exactly the information that review readers expect to see (or that is useful), then the messaging on the platform is efficient, which can accelerate the review adoption and purchase decision process for consumers. Review messages can be delivered as text and pictures. In recent years, a number of scholars have studied the usefulness of review text length, the sentiment expressed in the text, etc., for consumers of different product categories. However, very few have compared the usefulness of different types of reviews. Some scholars have also disputed the advantages and disadvantages of both text reviews and picture reviews. Therefore, this paper empirically investigates the first research question: which is more useful to review readers—pictures or text? Since the quality of pictures makes a difference in the experience of review reading, and few studies have discussed in depth the usefulness of review pictures, we ask the second question in this paper: do higher-quality review pictures have a significant impact on the usefulness of reviews? We believe that the process of information transfer does not only depend on the characteristics of the receiver of the information, but the willingness of the publisher is also very important. Therefore, we further investigate the aspects of review posters, according to the social exchange theory. We believe that posting pictures conveys more accurate information than posting text, but it also requires more effort from the review posters. We therefore put forward the third research question: does posting pictures require more perceived costs than posting text? Based on previous research on the emotional impact of negative consumers, which results in more effort being required for reviewing, we propose the fourth research question: are consumers with negative experiences more reluctant to post picture reviews? Since the perceived costs of taking high-quality images are higher, we then ask the fifth research question: do high-rated reviewers post higher-quality images (because of the low perceived costs of positive review posters)?
We verify five hypotheses corresponding to the research questions by means of data analysis and experiments. First, we crawled hotel data and reviewed data from Ctrip.com (accessed on 13 July 2022), a popular travel website. A preliminary observation and comparison were made on reviewers’ attitudes (positive versus negative) and the types of reviews (picture versus text), and then, the data were grouped for the regression model test. In Test 2, in order to ensure robustness, we regarded reviews with scores of less than 5 and 3 as negative reviews, respectively, and conducted two tests. The Experiment section was divided into A and B. Experiment A continuously scaled the variable “review usefulness” and evaluated the impact of the review type on it. Experiment B asked participants to write positive and negative reviews and evaluated the perceived cost they incurred using a scale, so as to investigate whether the attitude of participants will affect the type of comments they post and the perceived cost.
Our research results are as follows. First, we present evidence that consumers find picture reviews more useful when reading online reviews and that they prefer high-quality pictures. High-quality picture refers to the fact that the review publisher accurately focuses on the sharpness to improve clarity when taking a picture. This result suggests that this visual form of review reference can be a good aid for consumer decision making and has high commercial value. Second, we find that review publishers are more reluctant in choosing picture reviews than text reviews, and this reluctance is more pronounced in the case of negative reviews. This is because posting images is a more tedious step than posting text and requires more effort. Third, we also find that high-quality pictures are less likely to appear in negative reviews. This is also due to the fact that high-quality images require more effort to capture the focusing process than low-resolution images, and consumers with bad experiences are more reluctant to put so much effort into the posting process. The above results show that pictures, especially high-quality pictures, can improve the efficiency of people’s purchasing decisions, so this form of review is very important for e-commerce platforms. However, the perceived cost greatly reduces the previous adopters’ willingness to post images, resulting in a mismatch between the actual comments and what the review readers want to see. This “non-conformity” is even more pronounced in negative reviews, as the recall of a bad experience when writing a review brings psychological pressure and irritation to the review posters who have higher perceived costs compared to consumers with positive reviews and are less likely to post image reviews and high-quality images. Therefore, we need to pay attention not only to the asymmetry between the expectations of information deliverers and information recipients in the review system but also to the extent to which the attitudes of information deliverers can affect this asymmetry.
7.1. Theoretical Contributions
Our work contributes to research on both review readers and review posters. While most prior research examines online reviews from the perspective of review readers (e.g., Refs. [5,7]), there has been a call for research on the review posters’ side, given their important role in information delivery. Additionally, attention paid to the two parties simultaneously provides useful insights for researchers to examine the success of information delivery. Therefore, our work contributes to the literature on knowledge exchange that underscores the requirements that knowledge contributors be willing to part with their knowledge and knowledge seekers be willing to reuse the codified knowledge to guarantee success [45,46,47,48]. We suggest that it is not sufficient to only examine one side if information delivery is taken into account.
By examining different types of reviews’ usefulness for review readers, we develop a more holistic understanding of the theory basis used to understand information adoption [20]. Although existing studies of consumer decision-making behaviors have generated important insights into online reviews’ usefulness, many discuss the attitudes toward the reviews and the length of the text. Examples of these include consumers having inherent and fixed confidence over extremely negative and extremely positive reviews (e.g., Ref. [49]), and the length of a review has a significantly positive effect on its usefulness (e.g., Refs [50,51]). However, the usefulness of picture reviews and text reviews, given that a picture review is a new reviewing form, is less investigated. Therefore, our work extends the information adoption theory on reviews’ usefulness.
In terms of review posters, our work leverages consumer information sharing behavior research, particularly the social exchange theory, to better understand the review selection choice outcomes. One of the important theoretical contributions of our study is that we divert attention to the cost and benefit simultaneously to discuss the trade-off between effort and accuracy when choosing different types of reviews. We thus gain a better understanding of the role of the cost–benefit factor in affecting consumers’ review posting behaviors by overcoming the limitations of focusing on only one of the two factors (e.g., Refs [12,13,14,15]). Our study reveals the importance of considering changes in the perceived costs and perceived benefits in review posting behavior for future work. Additionally, to the best of our knowledge, the asymmetrical representation of the review strategy choice for negative and positive reviews is less discussed in the existing literature.
7.2. Managerial Implications
Recent research on e-commerce has provided useful ways to boost business for the practitioners, especially online travel agencies, in many different ways to connect customers with service providers to find better strategies. We believe that our work has managerial implications in this regard as well.
First, online travel agencies should create an effective review system to match the manners of information contribution and information seeking together. Encouraging early adopters to write reviews with pictures can help consumers learn more about the product or service and thus make confident decisions according to the empirical result of our study that review readers regard picture reviews as more useful.
Further, as our results show that dissatisfied review posters have a lower motivation to post picture reviews, online travel agencies can provide an appropriate reviewing template for those who rate low scores, which is able to reduce their perceived efforts and thus increase the probability of posting with pictures. Additionally, a potential remedy for the ineffectiveness of negative information delivery is to set a “negative reviews with pictures” filtering option for review readers.
Third, technicians can improve usefulness and better assist consumers in making decisions by automatically enhancing the clarity of the images in reviews. This is also more friendly to partially sighted review readers. Platforms could even design algorithms that automatically detect the quality of review images, giving incentives when review posters upload photos that exceed certain thresholds.
7.3. Limitations and Future Work
There are certain limitations for further research directions. First, we investigate consumer reviews only in one category, which is the hotel industry, whereas prior research has shown that consumers use different criteria to evaluate products based on the product category [53]. Therefore, it would be of great value to understand the nature of the dynamics that show changes in the perceived review costs and benefits affect consumer behavior by analyzing other product or service categories.
Second, our study measures the effectiveness of information delivery by only examining whether the manners of information sending and information receiving are matched. Additionally, we only consider usefulness in the information receiving process. Examining other factors that underlie the success of information delivery would be useful in helping e-commerce businesses develop review systems and reduce information asymmetry.
Third, a great defect of our work is that in the data analysis part of the pre-investigation, we did not take into account whether most review readers click on the tag of “usefulness” of picture reviews because they have less opportunity to refer to text reviews. In Experiment B, we calculated the coefficient of correlation between the two types of reviews and the review posters’ effort. We found that the standardized coefficient of positive reviews is smaller than that of negative reviews. The difference seems obvious; however, when we conducted Fisher’s z-test to compare the difference, the result slightly missed the significance level. Therefore, the hypothesis is not supported strictly. To address the limitation, we will continue this study with a larger sample size in the future.
Fourth, since time did not allow for this, we failed to make the reviews from both groups (picture and text) in the field study as similar as possible, which may have caused certain errors in the results of regression computation. We therefore advise future studies to employ a matching method (e.g., Mahalanobis matching method) to match the treatment group and the control group.
Fifth, though we proposed our hypotheses depending on the social exchange theory, we were unable to design a reliable e-commerce environment to investigate the psychological evidence due to resource limitations. We call for more future studies to test the underlying psychological mechanism of our hypotheses to examine whether review posters are reluctant to post pictures because more costs are required and whether the costs are much higher in negative review posting.
Online reviews are an important source of information for consumers evaluating products and services [54]. This means that understanding review information delivery and information sharing behaviors are important in e-commerce research. Therefore, on the basis of this study, further research is needed to more fully understand the different effects of picture reviews and text reviews on the process of online review information transmission.
Author Contributions
H.L., supervision, conceptualization, funding acquisition, methodology, validation, writing—review and editing; W.Z., conceptualization, methodology, software, validation, investigation, resources, data curation, writing—original draft preparation; W.S., investigation, data curation, writing—original draft preparation; X.H., data curation, investigation, software, formal analysis. All authors have read and agreed to the published version of the manuscript.
Funding
This work was supported by the Discipline Co-construction Project for Philosophy and Social Science in Guangdong Province (No. GD20XGL03), the Universities Stability Support Program in Shenzhen (No. 20200813151607001), the Major Planned Project for Education Science in Shenzhen (No. zdfz20017), the Postgraduate Education Reform Project in Shenzhen University in 2019, and the Postgraduate Innovation and Development Fund Project in Shenzhen University (No. 315-0000470708).
Institutional Review Board Statement
Not applicable.
Informed Consent Statement
Not applicable.
Data Availability Statement
Not applicable.
Conflicts of Interest
The authors declare no conflict of interest.
References
- Wang, J.X. Research on Influencing Factors of Online Shopping Consumers’ Willingness to Publish Comments with Pictures. Master’s Thesis, Xiamen University, Xiamen, China, 2019. [Google Scholar]
- Radnor, M.; Feller, I.; Rogers, E. The Diffusion of Innovations: An Assessment; Center for the Interdisciplinary Study of Science and Technology, Northwestern University: California, CA, USA, 1978. [Google Scholar]
- Kisielius, J.; Sternthal, B. Detecting and explaining vividness effects in attitudinal judgments. J. Mark. Res. 1984, 21, 54–64. [Google Scholar] [CrossRef]
- Mitchell, A.A.; Olson, J.C. Are product attribute beliefs the only mediator of advertising effects on brand attitude? J. Mark. Res. 1981, 18, 318–332. [Google Scholar] [CrossRef]
- Goolkasian, P. Research in Visual Pattern Recognition: The Enduring Legacy of Studies From the 1960s. Am. J. Psychol. 2012, 125, 155–163. [Google Scholar] [CrossRef][Green Version]
- Hoffman, D.L.; Novak, T.P. Toward a Deeper Understanding of Social Media. J. Interact. Mark. 2012, 26, 69–70. [Google Scholar] [CrossRef]
- Glaser, W.R. Picture Naming. Cognition 1992, 42, 61–105. [Google Scholar] [CrossRef]
- Kankanhalli, A.; Tan, B.C.; Wei, K.-K. Understanding seeking from electronic knowledge repositories: An empirical study. J. Am. Soc. Inf. Sci. Technol. 2005, 56, 1156–1166. [Google Scholar] [CrossRef]
- Payne, J.W. Task complexity and contingent processing in decision making: An information search and protocol analysis. Organ. Behav. Hum. Perform. 1976, 16, 366–387. [Google Scholar] [CrossRef]
- Beach, L.R.; Mitchell, T.R. A contingency model for the selection of decision strategies. Acad. Manag. Rev. 1978, 3, 439–449. [Google Scholar] [CrossRef]
- Schwarz, N. Feelings as information: Informational and motivational functions of affective states. In Handbook of Motivation and Cognition: Foundations of Social Behavior; Higgins, E.T., Sorrentino, R.M., Eds.; The Guilford Press: New York, NY, USA, 1990; Volume 2, pp. 527–561. [Google Scholar]
- Fradkin, A.; Grewal, E.; Holtz, D.; Pearson, A. Bias and Reciprocity in Online Reviews: Evidence from Field Experiments on Airbnb. In Proceedings of the 16th ACM Conference on Economics and Computation, Portland, OR, USA, 15–19 June 2015. [Google Scholar]
- Chen, Y.; Harper, F.M.; Konstan, J.; Li, S.X. Social Comparisons and Contributions to Online Communities: A Field Experiment on MovieLens. Am. Econ. Rev. 2010, 100, 1358–1398. [Google Scholar] [CrossRef]
- Cabral, L.; Li, L. A Dollar for Your Thoughts: Feedback-Conditional Rebates on eBay. Manag. Sci. 2015, 61, 2052–2063. [Google Scholar] [CrossRef]
- Burtch, G.; Hong, Y.; Bapna, R.; Griskevicius, V. Stimulating Online Reviews by Combining Financial Incentives and Social Norms. Manag. Sci. 2018, 64, 2065–2082. [Google Scholar] [CrossRef]
- Mudambi, S.M.; Schuff, D. Research Note: What Makes a Helpful Online Review? A Study of Customer Reviews on Amazon.com. MIS Q. 2010, 34, 185–200. [Google Scholar] [CrossRef]
- Tirunillai, S.; Tellis, G. Mining Marketing Meaning from Online Chatter: Strategic Brand Analysis of Big Data Using Latent Dirichlet Allocation. J. Mark. Res. 2014, 51, 463–479. [Google Scholar] [CrossRef]
- Hsu, C.-L.; Yu, L.-C.; Chang, K.-C. Exploring the effects of online customer reviews, regulatory focus, and product type on purchase intention: Perceived justice as a moderator. Comput. Hum. Behav. 2017, 69, 335–346. [Google Scholar] [CrossRef]
- Marlow, N.; Jansson-Boyd, C.V. To touch or not to touch; that is the question. Should consumers always be encouraged to touch products, and does it always alter product perception? Psychol. Mark. 2011, 28, 256–266. [Google Scholar] [CrossRef]
- Yang, X.; Zhang, J.; Peracchio, L.A. Understanding the impact of self-concept on the stylistic properties of images. J. Consum. Psychol. 2010, 20, 508–520. [Google Scholar] [CrossRef]
- An, Q.; Ma, Y.; Du, Q.; Xiang, Z.; Fan, W. Role of user-generated photos in online hotel reviews: An analytical approach. J. Hosp. Tour. Manag. 2020, 45, 633–640. [Google Scholar] [CrossRef]
- Cheng, Y.-H.; Ho, H.-Y. Social influence’s impact on reader perceptions of online reviews. J. Bus. Res. 2015, 68, 883–887. [Google Scholar] [CrossRef]
- Lee, S.; Choeh, J.Y. The interactive impact of online word-of-mouth and review helpfulness on box office revenue. Manag. Decis. 2018, 56, 849–866. [Google Scholar] [CrossRef]
- Ma, Y.; Xiang, Z.; Du, Q.; Fan, W. Effects of user-provided photos on hotel review helpfulness: An analytical approach with deep leaning. Int. J. Hosp. Manag. 2018, 71, 120–131. [Google Scholar] [CrossRef]
- Kim, M.; Lennon, S. The effects of visual and verbal information on attitudes and purchase intentions in internet shopping. Psychol. Mark. 2008, 25, 146–178. [Google Scholar] [CrossRef]
- Karimi, S.; Wang, F. Online review helpfulness: Impact of reviewer profile image. Decis. Support Syst. 2017, 96, 39–48. [Google Scholar] [CrossRef]
- Rarcherla, P.; Friske, W. Perceived ‘usefulness’ of online consumer reviews: An exploratory investigation across three services categories. Electron. Commer. Res. Appl. 2012, 11, 548–559. [Google Scholar] [CrossRef]
- Liu, Z.; Park, S. What makes a useful online review? Implication for travel product websites. Tour. Manag. 2015, 47, 140–151. [Google Scholar] [CrossRef]
- Leung, D. Unraveling the interplay of review depth, review breadth, and review language style on review usefulness and review adoption. Int. J. Hosp. Manag. 2021, 97, 102989. [Google Scholar] [CrossRef]
- Wang, C.C.; Chen, X.; Zhu, W.L.; Fu, W.Z.; Jin, J. Eye-tracking study on the impact of photographic reviews and verbal reviews on consumers’ perceived usefulness. Inf. Stud. Theory Appl. 2020, 43, 7–17. [Google Scholar]
- Dichter, E. Getting Motivated by Ernest Dichter, 1st ed.; Pergamon: Oxford, UK, 2013. [Google Scholar]
- Kim, J.M.; Han, J.; Jun, M. Differences in mobile and nonmobile reviews: The role of perceived costs in review-posting. Int. J. Electron. Commer. 2020, 24, 450–473. [Google Scholar] [CrossRef]
- Wu, I.-L.; Chuang, C.-H.; Hsu, C.-H. Information sharing and collaborative behaviors in enabling supply chain performance: A social exchange perspective. Int. J. Prod. Econ. 2014, 148, 122–132. [Google Scholar] [CrossRef]
- Wang, Y. Information adoption model, a review of the literature. J. Econ. Bus. Manag. 2016, 4, 618–622. [Google Scholar] [CrossRef]
- Molm, L. Theories of social exchange and exchange networks. In Handbook of Social Theory; Smart, B., Ritzer, G., Eds.; SAGE Publications: Thousands Oak, CA, USA, 2001; pp. 260–272. [Google Scholar]
- Liang, T.-P.; Liu, C.-C.; Wu, C.-H. Can Social Exchange Theory Explain Individual Knowledge-Sharing Behavior? A Meta-Analysis. In Proceedings of the ICIS 2008, Paris, France, 14–17 December 2008. [Google Scholar]
- Lee, M.K.O.; Cheung, C.M.K.; Lim, K.H.; Sia, C.L. Understanding customer knowledge sharing in web-based discussion boards: An exploratory study. Internet Res. 2006, 16, 289–303. [Google Scholar] [CrossRef]
- Shugan, S.M. The cost of thinking. J. Consum. Res. 1980, 7, 99–111. [Google Scholar] [CrossRef]
- Russo, J.; Johnson, E.; Stephens, D. The validity of verbal protocols. Mem. Cogn. 1989, 17, 759–769. [Google Scholar] [CrossRef] [PubMed]
- Christensen-Szalanski, J.J.J. Problem solving strategies: A selection mechanism, some implications, and some data. Organ. Behav. Hum. Perform. 1978, 22, 307–323. [Google Scholar] [CrossRef]
- Hambal, A.M.; Pei, Z.; Ishabailu, F.L. Image noise reduction and filtering techniques. Int. J. Sci. Res. 2017, 6, 2033–2038. [Google Scholar]
- Yu, S.; Wu, S.; Wang, L.; Jiang, F.; Xie, Y.; Li, L. A shallow convolutional neural network for blind image sharpness assessment. PLoS ONE 2017, 12, e0176632. [Google Scholar] [CrossRef] [PubMed]
- Jian, F.R. Method of Deblurring Microscope Image; Harbin University of Science and Technology: Harbin, China, 2021. [Google Scholar]
- Min, Q.; Qin, L.; Zhang, K. Factors affecting the perceived usefulness of online reviews. Chin. Manag. Rev. 2017, 29, 95–107. [Google Scholar]
- Zhang, Y.; Li, Z.; Zhao, Y. How the information quality affects the online review usefulness—An empirical analysis based on Taobao review data. Chin. J. Manag. 2017, 14, 77–85. [Google Scholar]
- Lin, S.; Lv, X.; Song, H. Is a picture worth a thousand words? The effect of pictorial reviews and verbal reviews on consumer purchase intention. J. Bus. Econ. 2017, 8, 59–68. [Google Scholar]
- Wang, X.H.; Chen, X. Fit of graph and text in user-generated contents and its effect on the perceived usefulness for consumers. Chin. J. Manag. Sci. 2018, 31, 101–115. [Google Scholar]
- Ert, E.; Fleischer, A.; Magen, N. Trust and reputation in the sharing economy: The role of personal photos in Airbnb. Tour. Manag. 2016, 55, 62–73. [Google Scholar] [CrossRef]
- Paivio, A.; Csapo, K. Picture superiority in free recall: Imagery or dual coding? Cogn. Psychol. 1973, 5, 176–206. [Google Scholar] [CrossRef]
- Amit, E.; Algom, D.; Trope, Y. Distance-dependent processing of pictures and words. J. Exp. Psychol. 2009, 138, 400–415. [Google Scholar] [CrossRef]
- Einhorn, H.; Hogarth, R. Confidence in Judgment—Persistence of the illusion of validity. Psychol. Rev. 1978, 85, 395–416. [Google Scholar] [CrossRef]
- Deng, P. Research on the Influence of Online Comment Type on Consumers’ Purchase Intention. Master’s Thesis, University of Electronic Science and Technology of China, Xi’an, China, 10 June 2020. [Google Scholar]
- Pan, L.; Chiou, J. How much can you trust online information? Cues for perceived trustworthiness of consumer-generated online information. J. Interact. Mark. 2011, 25, 67–74. [Google Scholar] [CrossRef]
- Laroche, M.; Yang, Z.; Mcdougall, G.; Bergeron, J. Internet versus bricks-and-mortar retailers: An investigation into intangibility and its consequences. J. Retail. 2005, 81, 251–267. [Google Scholar] [CrossRef]
Publisher’s Note: MDPI stays neutral with regard to jurisdictional claims in published maps and institutional affiliations. |
© 2022 by the authors. Licensee MDPI, Basel, Switzerland. This article is an open access article distributed under the terms and conditions of the Creative Commons Attribution (CC BY) license (https://creativecommons.org/licenses/by/4.0/).