
Joint Effect of Different Dimensions of eWOM on Product Sales


Abstract
:1. Introduction
2. Literature Review and Hypotheses
2.1. Literature Review
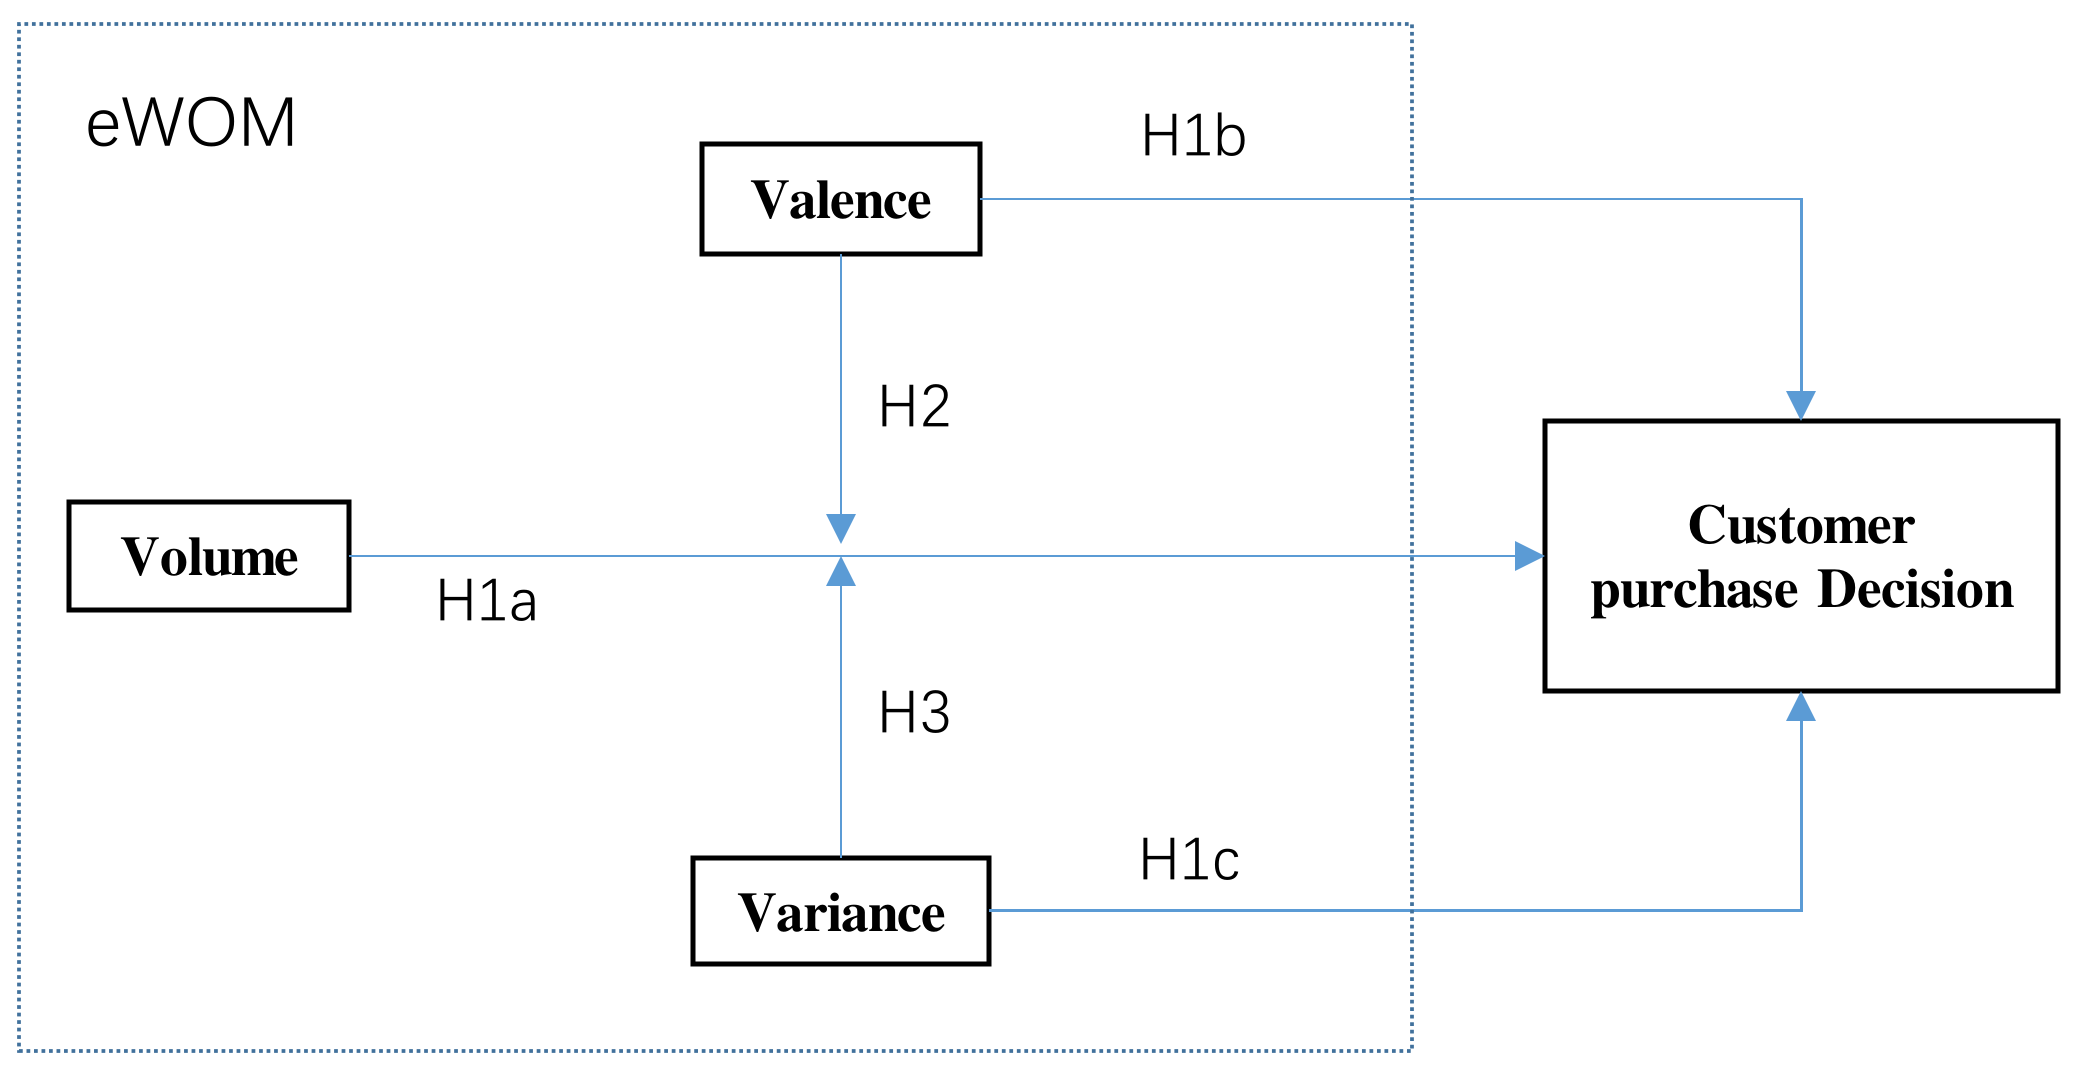
2.2. Conceptual Framework
2.3. Development of Hypotheses
3. Methodology
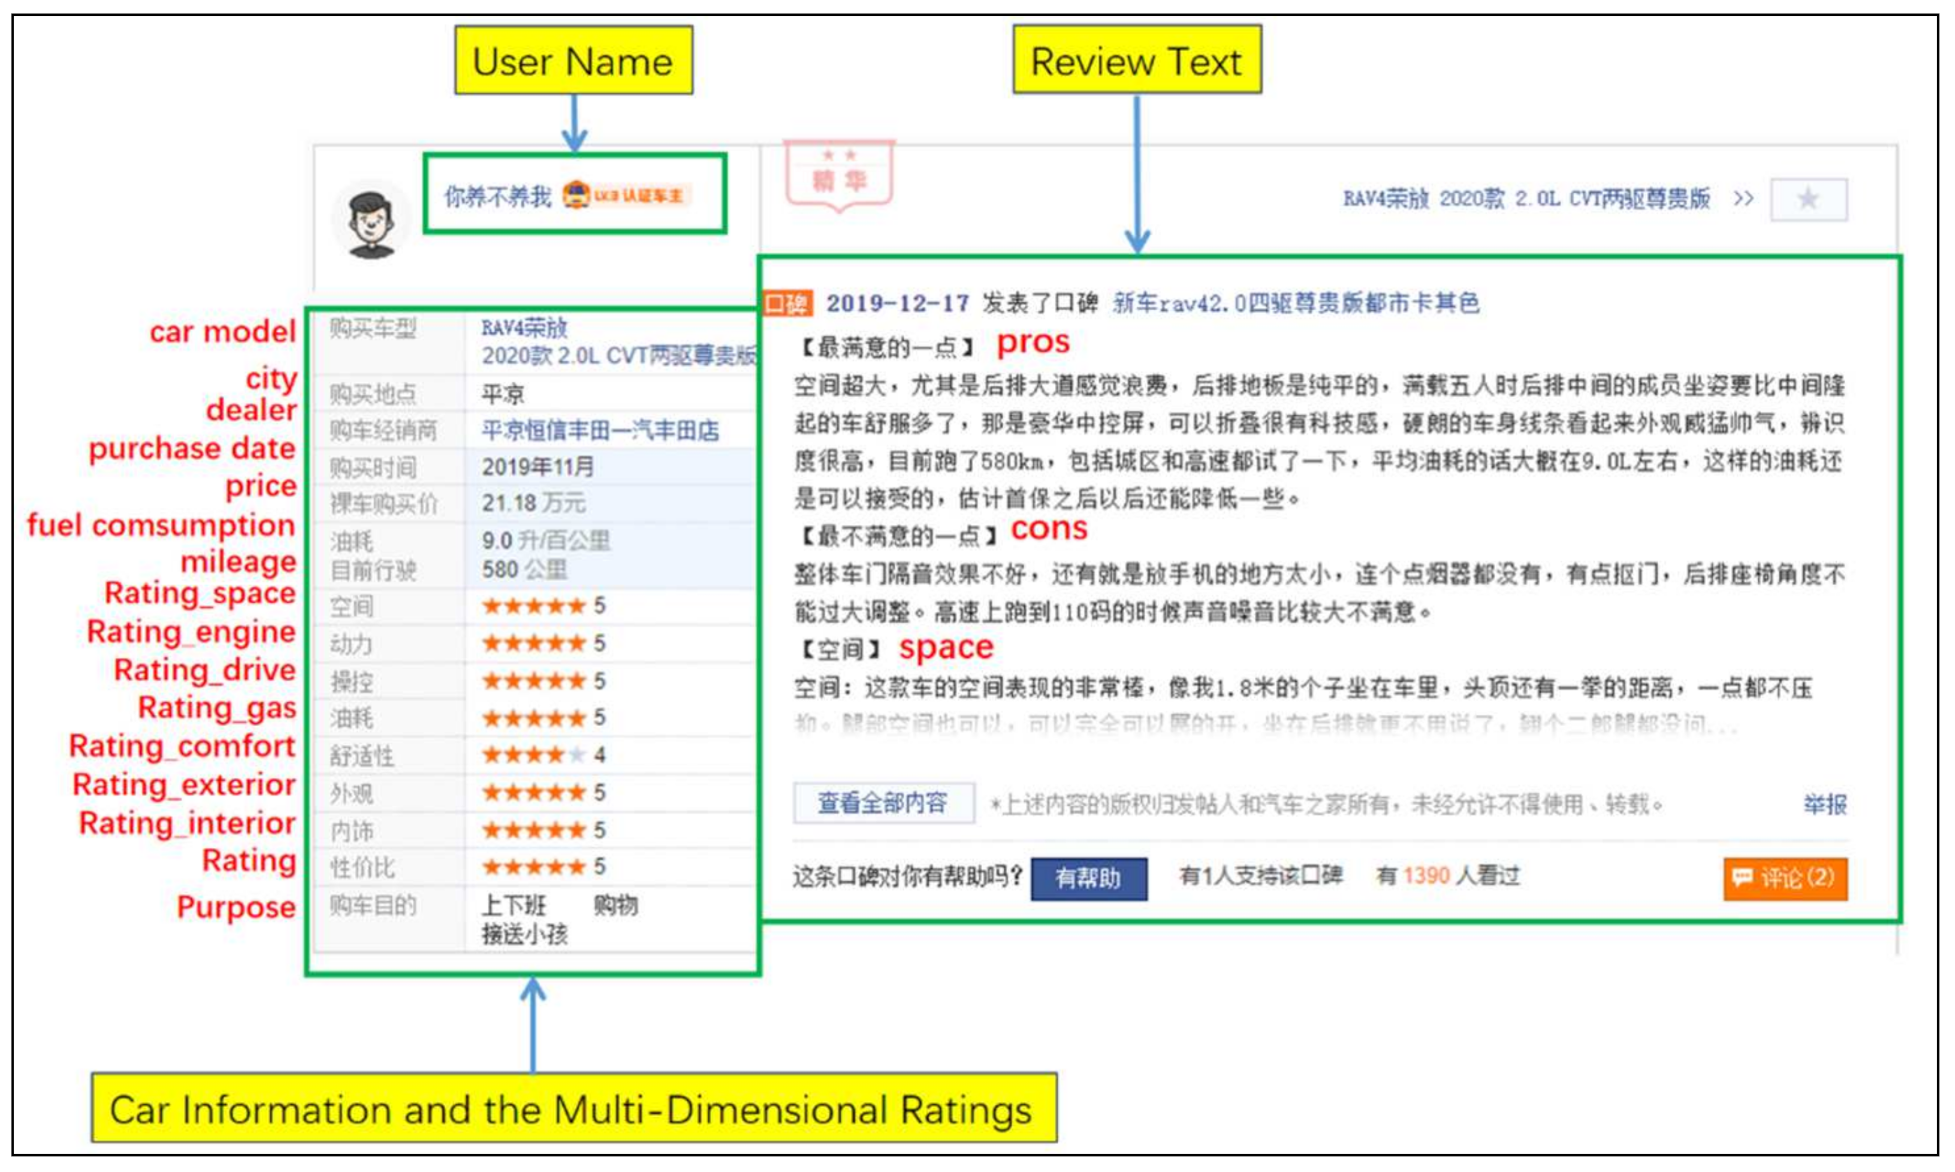
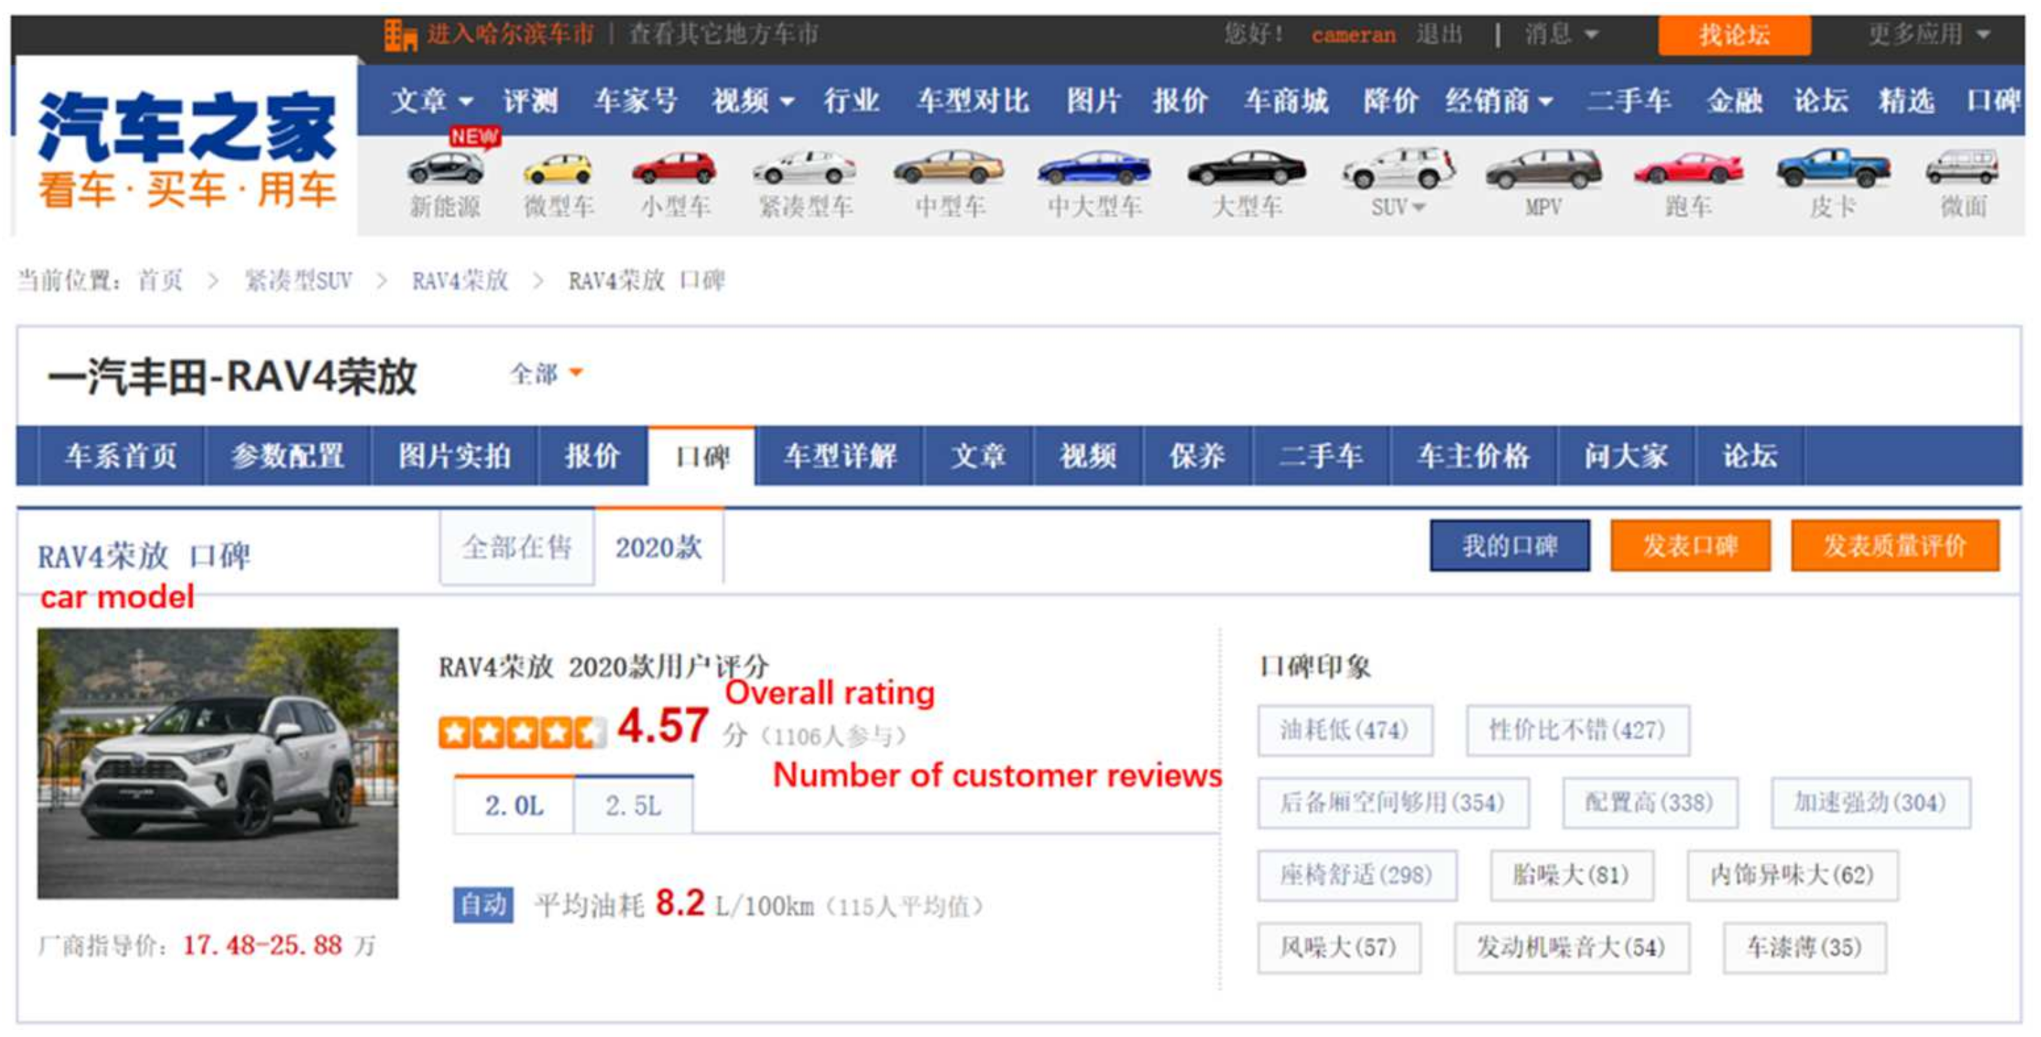
3.1. Data
3.2. Variables
3.3. Model Specification
4. Results
4.1. Descriptive Statistics
4.2. Panel Data Analysis
5. Conclusions, Implications and Limitations
5.1. Conclusions
5.2. Managerial Implications
5.3. Limitations and Future Research
Author Contributions
Funding
Institutional Review Board Statement
Informed Consent Statement
Data Availability Statement
Conflicts of Interest
References
- Maslowska, E.; Malthouse, E.C.; Viswanathan, V. Do customer reviews drive purchase decisions? The moderating roles of review exposure and price. Decis. Support Syst. 2017, 98, 1–9. [Google Scholar] [CrossRef]
- Cheung, C.M.K.; Lee, M.K.O. What drives consumers to spread electronic word of mouth in online consumer-opinion platforms. Decis. Support Syst. 2012, 53, 218–225. [Google Scholar] [CrossRef]
- Gu, B.; Park, J.; Konana, P. Research note—The impact of external word-of-mouth sources on retailer sales of high-involvement products. Inf. Syst. Res. 2012, 23, 182–196. [Google Scholar] [CrossRef]
- Chevalier, J.A.; Mayzlin, D. The effect of word of mouth on sales: Online book reviews. J. Mark. Res. 2006, 43, 345–354. [Google Scholar] [CrossRef] [Green Version]
- Godes, D.; Mayzlin, D. Using Online Conversations to Study Word-of-Mouth Communication. Mark. Sci. 2004, 23, 545–560. [Google Scholar] [CrossRef] [Green Version]
- Dellarocas, C. The digitization of word of mouth: Promise and challenges of online feedback mechanisms. Manag. Sci. 2003, 49, 1407–1424. [Google Scholar] [CrossRef] [Green Version]
- Cui, G.; Lui, H.-K.; Guo, X. The effect of online consumer reviews on new product sales. Int. J. Electron. Commer. 2012, 17, 39–57. [Google Scholar] [CrossRef]
- Moe, W.W.; Trusov, M. The value of social dynamics in online product ratings forums. J. Mark. Res. 2011, 48, 445–456. [Google Scholar] [CrossRef]
- Zhu, F.; Zhang, X.M. Impact of online consumer reviews on sales:The moderating role of product and consumer characteristics. J. Mark. 2010, 74, 133–148. [Google Scholar] [CrossRef]
- Blazevic, V.; Aksoy, L.; Hammedi, W.; Garnefeld, I.; Rust, R.T.; Keiningham, T.; Andreassen, T.W.; Donthu, N.; Carl, W. Beyond traditional word of mouth: An expanded model of customer-driven influence. J. Serv. Manag. 2013, 24, 294–313. [Google Scholar] [CrossRef]
- Liu, Y. Word of mouth for movies: Its dynamics and impact on box office revenue. J. Mark. 2006, 70, 74–89. [Google Scholar] [CrossRef]
- Hinz, O.; Skiera, B.; Barrot, C.; Becker, J.U. Seeding strategies for viral marketing: An empirical comparison. J. Mark. 2011, 75, 55–71. [Google Scholar] [CrossRef] [Green Version]
- Berger, J.; Schwartz, E.M. What drives immediate and ongoing word of mouth? J. Mark. Res. 2011, 48, 869–880. [Google Scholar] [CrossRef]
- Murphy, R. Local Consumer Review Survey 2018. Available online: https://www.brightlocal.com/research/local-consumer-review-survey-2018 (accessed on 31 December 2021).
- Maslowska, E.; Malthouse, E.C.; Bernritter, S.F. Too good to be true: The role of online reviews’ features in probability to buy. Int. J. Advert. 2016, 36, 142–163. [Google Scholar] [CrossRef]
- Gopinath, S.; Thomas, J.S.; Krishnamurthi, L. Investigating the relationship between the content of online word of mouth, advertising, and brand performance. Mark. Sci. 2014, 33, 241–258. [Google Scholar] [CrossRef]
- Qin, L. Word-of-blog for movies: A predictor and an outcome of box office revenue? J. Electron. Commer. Res. 2011, 12, 187–198. [Google Scholar]
- Archak, N.; Ghose, A.; Ipeirotis, P.G. Deriving the pricing power of product features by mining consumer reviews. Manag. Sci. 2011, 57, 1485–1509. [Google Scholar] [CrossRef] [Green Version]
- Chintagunta, P.K.; Gopinath, S.; Venkataraman, S. The effects of online user reviews on movie box office performance: Accounting for sequential rollout and aggregation across local markets. Mark. Sci. 2010, 29, 944–957. [Google Scholar] [CrossRef]
- Clemons, E.K.; Gao, G.G.; Hitt, L.M. When online reviews meet hyperdifferentiation: A study of the craft beer industry. J. Manag. Inf. Syst. 2006, 23, 149–171. [Google Scholar] [CrossRef] [Green Version]
- Park, J.; Gu, B.; Lee, H. The relationship between retailer-hosted and third-party hosted WOM sources and their influence on retailer sales. Electron. Commer. Res. Appl. 2012, 11, 253–261. [Google Scholar] [CrossRef]
- Amblee, N.; Bui, T. Harnessing the influence of social proof in online shopping: The effect of electronic word of mouth on sales of digital microproducts. Int. J. Electron. Commer. 2011, 16, 91–113. [Google Scholar] [CrossRef]
- Hu, N.; Liu, L.; Zhang, J.J. Do online reviews affect product sales? The role of reviewer characteristics and temporal effects. Inf. Technol. Manag. 2008, 9, 201–214. [Google Scholar] [CrossRef]
- Forman, C.; Ghose, A.; Wiesenfeld, B. Examining the relationship between reviews and sales: The role of reviewer identity disclosure in electronic markets. Inf. Syst. Res. 2008, 19, 291–313. [Google Scholar] [CrossRef]
- Lilien, G.L.; Kotler, P.; Moorthy, S.K. Marketing Models; Prentice Hall: London, UK, 1992. [Google Scholar]
- Duan, W.; Gu, B.; Whinston, A.B. The dynamics of online word-of-mouth and product sales—An empirical investigation of the movie industry. J. Retail. 2008, 84, 233–242. [Google Scholar] [CrossRef]
- Kim, K.; Yoon, S.; Choi, Y.K. The effects of eWOM volume and valence on product sales—An empirical examination of the movie industry. Int. J. Advert. 2019, 38, 471–488. [Google Scholar] [CrossRef]
- Lu, X.; Ba, S.; Huang, L.; Feng, Y. Promotional marketing or word-of-mouth? Evidence from online restaurant reviews. Inf. Syst. Res. 2013, 24, 596–612. [Google Scholar] [CrossRef]
- Sun, M. How does the variance of product ratings matter? Manag. Sci. 2012, 58, 696–707. [Google Scholar] [CrossRef] [Green Version]
- Feng, J.; Papatla, P. Is Online Word of Mouth Higher for New Models or Redesigns? An Investigation of the Automobile Industry. J. Interact. Mark. 2012, 26, 92–101. [Google Scholar] [CrossRef]
- Ho-Dac, N.N.; Carson, S.J.; Moore, W.L. The effects of positive and negative online customer reviews: Do brand strength and category maturity matter? J. Mark. 2013, 77, 37–53. [Google Scholar] [CrossRef] [Green Version]
- Dellarocas, C.; Zhang, X.M.; Awad, N.F. Exploring The Value of Online Product Reviews in Forecasting Sales: The Case of Motion Pictures. J. Interact. Mark. 2007, 21, 23–45. [Google Scholar] [CrossRef]
- Duan, W.; Gu, B.; Whinston, A.B. Do online reviews matter?—An empirical investigation of panel data. Decis. Support Syst. 2008, 45, 1007–1016. [Google Scholar] [CrossRef]
- Rosario, A.B.; Sotgiu, F.; Valck, K.D.; Bijmolt, T.H.A. The effect of electronic word of mouth on sales: A meta-analytic review of platform, product, and metric factors. J. Mark. Res. 2016, 53, 297–318. [Google Scholar] [CrossRef]
- Wang, Y.; Goes, P.; Wei, Z.; Zeng, D. Production of online word-of-mouth: Peer effects and the moderation of user characteristics. Prod. Oper. Manag. 2019, 28, 1621–1640. [Google Scholar] [CrossRef]
- Xinxin Li, L.M.H. Self-Selection and Information Role of Online Product Reviews. Inf. Syst. Res. 2008, 19, 456–474. [Google Scholar]
- Duan, W.; Gu, B.; Whinston, A.B. Informational Cascades and Software Adoption on The Internet: An Empirical Investigation. MIS Q. 2009, 33, 23–48. [Google Scholar] [CrossRef]
- Zhang, P.; Lee, H.-M.; Zhao, K.; Shah, V. An empirical investigation of eWOM and used video game trading: The moderation effects of product features. Decis. Support Syst. 2019, 123, 113076. [Google Scholar] [CrossRef]
- Kim, R.Y. When does online review matter to consumers? The effect of product quality information cues. Electron. Commer. Res. 2021, 21, 1011–1030. [Google Scholar] [CrossRef]
- Manes, E.; Tchetchik, A. The role of electronic word of mouth in reducing information asymmetry: An empirical investigation of online hotel booking. J. Bus. Res. 2018, 85, 185–196. [Google Scholar] [CrossRef]
- Lu, Q.; Ye, Q.; Law, R. Moderating effects of product heterogeneity between online word-of-mouth and hotel sales. J. Electron. Commer. Res. 2014, 15, 1. [Google Scholar]
- Ye, Q.; Law, R.; Gu, B. The impact of online user reviews on hotel room sales. Int. J. Hosp. Manag. 2009, 28, 180–182. [Google Scholar] [CrossRef]
- Filieri, R.; Vitari, C.; Raguseo, E. Extreme Negative Rating and Review Helpfulness: The Moderating Role of Product Quality. J. Travel Res. 2021, 60, 699–717. [Google Scholar] [CrossRef]
- Ba, S.; Jin, Y.; Li, X.; Lu, X. One Size Fits All? The Differential Impact of Online Reviews and Coupons. Prod. Oper. Manag. 2020, 29, 2403–2424. [Google Scholar] [CrossRef]
- Bilal, M.; Jianqiu, Z.; Dukhaykh, S.; Fan, M.; Trunk, A. Understanding the Effects of eWOM Antecedents on Online Purchase Intention in China. Information 2021, 12, 192. [Google Scholar] [CrossRef]
- You, Y.; Vadakkepatt, G.G.; Joshi, A.M. A meta-analysis of electronic word-of-mouth elasticity. J. Mark. 2015, 79, 19–39. [Google Scholar] [CrossRef] [Green Version]
- Geva, T.; Oestreicher-Singer, G.; Efron, N.; Shimshoni, Y. Using forum and search data for sales prediction of high-involvement projects. MIS Q. 2017, 41, 65–82. [Google Scholar] [CrossRef]
- Feng, J. Reliability/Quality, Performance/Design, Innovativeness: Their Different Roles in Generating Buzz for Automobile. J. Strateg. Innov. Sustain. 2019, 14, 25–42. [Google Scholar]
- Wang, Y.-Y.; Guo, C.; Susarla, A.; Sambamurthy, V. Online to Offline: The Impact of Social Media on Offline Sales in the Automobile Industry. Inf. Syst. Res. 2021, 32, 582–604. [Google Scholar] [CrossRef]
- Moe, W.W.; Schweidel, D.A. Online Product Opinions: Incidence, Evaluation, and Evolution. Mark. Sci. 2012, 31, 372–386. [Google Scholar] [CrossRef]
- Kostyra, D.S.; Reiner, J.; Natter, M.; Klapper, D. Decomposing the effects of online customer reviews on brand, price, and product attributes. Int. J. Res. Mark. 2016, 33, 11–26. [Google Scholar] [CrossRef]
- Wang, M.; Lu, Q.; Chi, R.T.; Shi, W. How word-of-mouth moderates room price and hotel stars for online hotel booking an empirical investigation with expedia data. J. Electron. Commer. Res. 2015, 16, 72–80. [Google Scholar]
- Li, X.; Wu, C.; Mai, F. The effect of online reviews on product sales: A joint sentiment-topic analysis. Inf. Manag. 2019, 56, 172–184. [Google Scholar] [CrossRef]
- Clarke, K.; Belk, R.W. The effects of product involvement and task definition on anticipated consumer effort. Adv. Consum. Res. 1978, 5, 313–318. [Google Scholar]
- Chen, P.-Y.; Wu, S.-y.; Yoon, J. The Impact of Online Recommendations and Consumer Feedback on Sales. In Proceedings of the ICIS 2004 Proceedings, Washington DC, USA, 12–15 December 2004. [Google Scholar]
- Banerjee, A.V. A simple model of herd behavior. Q. J. Econ. 1992, 107, 797. [Google Scholar] [CrossRef] [Green Version]
- Dimoka, A.; Hong, Y.; Pavlou, P.A. On Product Uncertainty in Online Markets: Theory and Evidence. MIS Q. 2012, 36, 395–426. [Google Scholar] [CrossRef] [Green Version]
- West, P.M.; Broniarczyk, S.M. Integrating Multiple Opinions: The Role of Aspiration Level on Consumer Response to Critic Consensus. J. Consum. Res. 1998, 25, 38–51. [Google Scholar] [CrossRef]


| Study | Method | Data | eWOM Metrics | Key Findings |
|---|---|---|---|---|
| [30] | three-stage least squares | Sales Data: Automotive News; eWOM Data: Edmunds.com and Consumer Reports (online); Time span: 2000–2007 | Volume | Redesigned models of automobiles attract more consumer word of mouth than new models. |
| [47] | least-squares linear regression | Sales Data: Automotive News; Search Data: Google Trends; eWOM Data: Google’s discussion forum search Time span: 2007–2010 | Volume Valence | Adding search trend data to models based on social media data significantly improves predictive accuracy, and the improvement is larger for “value” car brands than “premium” car brands; Predictive models based on search trend data provide predictive accuracy that is comparable, at least, to that of social media data-based predictive models. |
| [48] | 3 levels Binomial response model with random effects | Sales Data: Automotive News; eWOM data: Consumer Reports (online); Time span: 2000–2007 | Positive Volume Negative Volume | Reliability/quality, performance/design, and innovativeness play qualitatively different roles in generating word of mouth. |
| [49] | PVAR model | eWOM Data: Twitter and Facebook; Sales Data: WardsAuto Premium database; Advertising Data: Kantar Media; Time Span: 2009–2015 | Volume | Facebook and Twitter have heterogeneous effects on offline vehicle sales. Moreover, FGC is more effective than UGC for influencing offline light vehicle sales. |
| Study | Method | Product Category | Data | eWOM Metrics | Key Findings |
|---|---|---|---|---|---|
| [29] | DID approach | Book | Amazon.com and BN.com (two period: January 2009 and May 2009) | Volume Valence Variance | The higher variance would correspond to a higher subsequent demand if and only if the average rating is low. |
| [9] | DID approach | Video Game | GameSpot (from March 2003 to October 2005) | Volume Valence | Online reviews are more influential for less popular games and games whose players have greater Internet experience. |
| [41] | DID approach | Hotel | Ctrip and Elong (Hotels in nine major cities in China from December 2009 to November 2011) | Volume Valence Variance | The average rating and variance of customer reviews will have a positive effect on hotel sales; eWOM has more impact on sales for hotels with lower rather than higher star ratings. |
| [52] | Negative Binomial Regression model | Hotel | Expedia.com (250 hotels in Detroit from 17 April to August 7 2013) | Volume Valence | The online sales performances of hotels with more or better WOM are less likely to be influenced by lower prices or higher star ratings. |
| [51] | Choice-based conjoint experiment | eBook reader | Survey Data (771 respondents, treatment group included 601 respondents, and the control group included 170 respondents) | Volume Valence Variance | Volume and variance do not affect customers’ choices directly but they moderate the impact of valence on customers’ choices; importance of product attributes decreases in the presence of eWOM |
| [45] | Structural equation modeling (SEM) | Fashion products | Survey Data (477 Chinese WeChat users in Beijing and Shanghai) | None | Social media usage significantly moderates the relationship between eWOM and the online purchase intention of fashion products |
| [53] | dynamic panel data (DPD) | tablet computers | 312 unique SKUs with sales records spanning 23 weeks from 1 February to 11 July 2012 | Volume Valence | Both numerical ratings and sentiment have significant impacts on the sales performance; The influence of overall sentiment on sales is completely mediated by star rating; |
| Variable | Measure | Data Source |
|---|---|---|
| Dependent Variable | ||
| Sales of car i in month t. | CSMAR | |
| Independent Variable | ||
| Volume of eWOM of car i in month t. | Autohome | |
| Moderating Variables | ||
| Average of eWOM ratings of car i in month t. | Autohome | |
| Variance of eWOM ratings for car i in month t. | Autohome | |
| Control Variables | ||
| Months from the launch month to month t of car i. | Autohome | |
| Search volume on Baidu for car i in month t. | Baidu | |
| Average of actual selling prices of car i in month t. | Autohome | |
| Average of ratings for dealers of car i in month t. | Autohome | |
| Average resident disposable income in month t. | NBSC | |
| Vehicle purchase tax rate in month t. | NBSC | |
| Oil price in month t. | NBSC | |
| Variable | Obs# | Mean | Std. Dev. | Min | Max |
|---|---|---|---|---|---|
| Sales | 14,756 | 5578.15 | 6909.74 | −173 | 80,495 |
| Volume | 14,756 | 47.35 | 59.88 | 1 | 823 |
| Rating | 14,756 | 4.21 | 0.31 | 1 | 5 |
| Variance | 14,756 | 0.21 | 0.15 | 0 | 2.84 |
| Price | 14,756 | 13.37 | 9.13 | 2.4 | 79.9 |
| Age | 14,756 | 60.97 | 48.55 | 0 | 214 |
| DealerRating | 14,756 | 4.19 | 0.39 | 1 | 5 |
| SearchIndex | 14,756 | 127,044.7 | 194,792.5 | 66 | 5,823,991 |
| Income | 14,756 | 1841.45 | 261.44 | 1347.67 | 2394.67 |
| Tax | 14,756 | 0.08 | 0.02 | 0.05 | 0.1 |
| OilPrice | 14,756 | 7329.71 | 944.61 | 5965 | 8900.97 |
| Variable | (1) | (2) | (3) | (4) | (5) | (6) | (7) | (8) | (9) | (10) | (11) |
|---|---|---|---|---|---|---|---|---|---|---|---|
| (1) | 1.00 | ||||||||||
| (2) | 0.61 | 1.00 | |||||||||
| (3) | 0.14 | 0.24 | 1.00 | ||||||||
| (4) | 0.04 | −0.03 | −0.29 | 1.00 | |||||||
| (5) | 0.04 | 0.03 | 0.31 | −0.17 | 1.00 | ||||||
| (6) | 0.20 | 0.08 | −0.27 | 0.09 | 0.02 | 1.00 | |||||
| (7) | 0.06 | 0.12 | 0.54 | −0.20 | 0.15 | −0.06 | 1.00 | ||||
| (8) | 0.34 | 0.29 | 0.18 | 0.01 | 0.12 | −0.03 | 0.08 | 1.00 | |||
| (9) | 0.02 | −0.04 | 0.11 | 0.06 | 0.02 | 0.01 | 0.07 | 0.11 | 1.00 | ||
| (10) | −0.03 | −0.01 | −0.07 | −0.06 | −0.01 | −0.01 | −0.01 | −0.09 | −0.50 | 1.00 | |
| (11) | −0.01 | −0.02 | −0.07 | −0.06 | −0.00 | −0.01 | 0.00 | −0.11 | −0.60 | 0.70 | 1.00 |
| VIF | 1.20 | 1.94 | 1.13 | 1.16 | 1.15 | 1.47 | 1.14 | 1.65 | 2.05 | 2.39 |
| Variable | Model 1 | Model 2 | Model 3 |
|---|---|---|---|
| Volume | 29.406 (0.737) *** | 306.719 (10.470) *** | 217.519 (14.552) *** |
| Volume*Rating | −61.674 (2.323) *** | −43.971 (3.068) *** | |
| Volume*Variance | 67.809 (7.705) *** | ||
| Rating | 496.512 (128.714) *** | 1109.333 (127.766) *** | 951.389 (128.684) *** |
| Variance | 22.119 (174.604) | −240.444 (170.753) | −1002.331 (191.041) *** |
| Price | −54.956 (18.781) ** | −10.079 (18.413) | −14.8406 (18.372) |
| Age | 7.787 (15.595) | 45.486 (15.291) ** | 40.921 (15.259) *** |
| DealerRating | −155.230 (77.453) ** | −106.844 (75.639) | −111.701 (75.440) |
| SearchIndex | 0.002 (0.000) *** | 0.001 (0.000) *** | 0.001 (0.000) *** |
| Income | −0.810 (1.128) | −2.280 (1.103) ** | −2.133 (1.100) ** |
| Tax | −13,571.47 (1725.394) *** | −12,810.39 (1684.752) *** | −12,075.91 (1682.346) *** |
| OilPrice | 0.441 (0. 043) *** | 0.536 (0.042) *** | 0.536 (0.042) *** |
| Intercept | 3633.444 (1540.727) ** | −84.300 (1510.722) | 695.564 (1509.311) |
| Time fixed effect | Yes | Yes | Yes |
| Car Model fixed effect | Yes | Yes | Yes |
| Obs# | 14,756 | 14,756 | 14,756 |
| R-squared | 0.187 | 0.225 | 0.229 |
| Hypotheses | Test Result |
|---|---|
| H1a: The volume of eWOM is positively related to product sales for automobile industries. | Supported |
| H1b: The valence of eWOM is positively related to product sales for automobile industries. | Supported |
| H1c: The variance of eWOM is negatively related to product sales for automobile industries. | Partially Supported |
| H2: The rating will weaken the relationship between the volume of eWOM and product sales for automobile industries. | Supported |
| H3: The disagreement among customers’ evaluations will strengthen the relationship between the volume of eWOM and product sales for automobile industries. | Supported |
Publisher’s Note: MDPI stays neutral with regard to jurisdictional claims in published maps and institutional affiliations. |
© 2022 by the authors. Licensee MDPI, Basel, Switzerland. This article is an open access article distributed under the terms and conditions of the Creative Commons Attribution (CC BY) license (https://creativecommons.org/licenses/by/4.0/).
Share and Cite
Liu, X.; Wu, X.; Ye, Q. Joint Effect of Different Dimensions of eWOM on Product Sales. Information 2022, 13, 311. https://doi.org/10.3390/info13070311
Liu X, Wu X, Ye Q. Joint Effect of Different Dimensions of eWOM on Product Sales. Information. 2022; 13(7):311. https://doi.org/10.3390/info13070311
Chicago/Turabian StyleLiu, Xudong, Xianjiao Wu, and Qiang Ye. 2022. "Joint Effect of Different Dimensions of eWOM on Product Sales" Information 13, no. 7: 311. https://doi.org/10.3390/info13070311
APA StyleLiu, X., Wu, X., & Ye, Q. (2022). Joint Effect of Different Dimensions of eWOM on Product Sales. Information, 13(7), 311. https://doi.org/10.3390/info13070311