Article

LPCOCN: A Layered Paddy Crop Optimization-Based Capsule Network Approach for Anomaly Detection at IoT Edge

by
Bhuvaneswari Amma Narayanavadivoo Gopinathan
1,
Velliangiri Sarveshwaran
2,
Vinayakumar Ravi
3,* and
Rajasekhar Chaganti
4
1
School of Computer Science and Engineering, Vellore Institute of Technology, Chennai 600127, Tamil Nadu, India
2
Department of Computational Intellignece, SRM Institute of Science and Technology, Kattankulathur Campus, Chennai 603203, Tamil Nadu, India
3
Center for Artificial Intelligence, Prince Mohammad Bin Fahd University, Khobar 34754, Saudi Arabia
4
Department of Computer Science, University of Texas at San Antonio, San Antonio, TX 78249, USA
*
Author to whom correspondence should be addressed.
Information 2022, 13(12), 587; https://doi.org/10.3390/info13120587
Submission received: 15 October 2022 / Revised: 2 December 2022 / Accepted: 14 December 2022 / Published: 16 December 2022
(This article belongs to the Special Issue Enhanced Cyber-Physical Security in IoT)

Abstract

:
Cyberattacks have increased as a consequence of the expansion of the Internet of Things (IoT). It is necessary to detect anomalies so that smart devices need to be protected from these attacks, which must be mitigated at the edge of the IoT network. Therefore, efficient detection depends on the selection of an optimal IoT traffic feature set and the learning algorithm that classifies the IoT traffic. There is a flaw in the existing anomaly detection systems because the feature selection algorithms do not identify the most appropriate set of features. In this article, a layered paddy crop optimization (LPCO) algorithm is suggested to choose the optimal set of features. Furthermore, the use of smart devices generates tremendous traffic, which can be labelled as either normal or attack using a capsule network (CN) approach. Five network traffic benchmark datasets are utilized to evaluate the proposed approach, including NSL KDD, UNSW NB, CICIDS, CSE-CIC-IDS, and UNSW Bot-IoT. Based on the experiments, the presented approach yields assuring results in comparison with the existing base classifiers and feature selection approaches. Comparatively, the proposed strategy performs better than the current state-of-the-art approaches.

1. Introduction

IoT devices are widely employed in smart applications, including travel, healthcare, and smart cities [1]. The ubiquity of IoT devices and the massive volume of data these devices generate are the root causes of IoT security vulnerabilities [2]. Since IoT devices lack adequate security measures and are connected to the Internet, they are susceptible to attack [3]. By seizing control of intelligent gadgets that can be used maliciously to exploit other IoT-connected devices, an attacker can quickly hack IoT devices [4]. By the year 2025, there may be 27 billion smart devices online, as per the IoT market forecast [5]. The adoption of IoT devices could boost cyberattacks, including collusion, malware, and distributed denial of service (DDoS) attacks. The expanding adoption of services offered by smart devices is currently being hampered by cyberattacks. In order to protect IoT devices, it is crucial to identify irregularities in IoT traffic. As more and more traffic is generated by smart devices, it is important to detect the attacks on the fly at the edge of the IoT network [6].
Statistical and machine learning techniques are used to identify anomalies in IoT systems [7]. Only typical IoT traffic is used in statistical approaches to train models. This is accomplished by machine learning algorithms by training their models on both legitimate and non-legitimate messages. Based on the learning process, these techniques are divided into supervised, unsupervised, and semi-supervised groups [8]. The traffic features are assigned to a traffic class, such as normal or attack, throughout the supervised learning process. Only labelled datasets are used in this learning procedure. By detecting appealing structures in the data, unsupervised learning finds the traffic features without being aware of the traffic class. Unsupervised learning is used to group comparable data using semi-supervised learning, and labelled data are used to categorise unlabeled data. Because the class labels for the IoT traffic records in this study are known, the model was created using supervised learning techniques.
Big data applications are centered on IoT devices due to the volume of traffic they generate [9]. Consequently, real-time data processing techniques are essential for handling enormous amounts of data. It is possible to learn data representation through deep learning (DL), which recognizes correlations automatically [10]. There are several DL techniques that are commonly used, including convolutional neural networks (CNNs), auto encoders (AEs), recurrent neural networks (RNNs), capsule networks (CN), and long short-term memory (LSTM) [11]. This type of analysis requires large amounts of data and powerful computers [12].
The inadequacy of a centralised cloud to fulfil IoT requirements, such as resource allocation and scalability, is a major factor in the existing detection methods for anomalies. With IoT, actions are carried out across a sizable number of devices, and enormous volumes of data are exponentially generated. Because it enables consumers to access Internet-based services, the cloud is essential to the IoT [13]. However, while performing expensive calculations, it is unable to handle IoT devices due to its centralised architecture. The significant distance between an IoT device and the centralised anomaly detection system contributes to the lengthy detection time as well. Because the centralised cloud architecture can manage the service requirements of IoT, anomaly detection in IoT differs from current methodologies [14].
The features that are utilised for attack detection determine the efficacy of detection techniques; selecting the ideal set of features improves a detection system’s precision [15,16]. In order to select the features, filter and wrapper methods are employed. Based on the connection between characteristics or the class label, the filter approaches employ statistical techniques to find the pertinent features [17]. The drawback of filtering methods is that each feature is assessed independently and does not reveal anything about the class on its own [18]. The wrapper techniques select the attributes in accordance with categorization approaches [19]. Wrapper techniques have the disadvantage that they produce more feature subsets, which increases the danger of overfitting [20].
Fog computing, a new approach to distributed intelligence, is used to close the gap. By processing data close to the data sources, or IoT devices, the fog communicates at the edge of the IoT network [21,22]. When fog nodes are selected for distributed processing, security measures can be used. In order to develop distributed security measures, it could be conceivable to offload time-consuming calculations and storage from IoT devices [23,24]. We used this as inspiration to develop a framework for IoT traffic anomaly identification at the edge of the network.
This study makes several key contributions, including:
  • The layered paddy crop optimization (LPCO) approach for selecting the optimal set of features;
  • The architecture of a capsule network for learning;
  • A procedure for LPCO to select optimal features;
  • The analysis and comparison of the true positive rate, false positive rate, accuracy, and error rate of the proposed anomaly detection system with respect to existing deep learning classifiers and optimization-based feature selection methods.
The remainder of the study is structured as follows: Section 2 discusses the materials and methods pertaining to this study. Section 3 describes the proposed layered paddy crop optimization with the capsule network approach. Section 4 of the article acts as a performance evaluation of the suggested approach. Section 5 concludes and provides instructions for further investigation.

2. Materials and Methods

This section discusses the literature pertaining to the current study.

2.1. Anomaly Detection

IoT networks incorporate a variety of devices, such as workstations, laptops, routers, and IoT gadgets [25,26]. IoT networks are vulnerable because of their pervasive use of and dependency on IoT devices, which produce a lot of data and can be the target of cyberattacks. Attackers regularly use easily accessible, cost-free botnets to carry out a range of cyberattacks [27]. A botnet is a collection of infected computers, often known as bots, that contain infrastructure for command and control. They are employed for nefarious activities such as DDoS, keylogging, identity theft, and the spread of more bot software [28].
Recent reviews of IoT security-learning strategies are given in [29,30]. The design of learning algorithms, the confidentiality and security of learning methodology, and hacker misuse of learning algorithms are among the issues explored. Anomalies have been identified using a variety of machine learning methods, including the Bayesian network, support-vector machine (SVM), artificial neural network (ANN), k-nearest neighbour (KNN), logistic regression (LR), genetic algorithm (GA), decision tree (DT), and DL. Due to their successful results, these learning algorithms can offer practical solutions for anomaly identification. It has been noted that not all teaching strategies can provide a solution for every issue. There are benefits and drawbacks to each strategy.

2.2. Feature Selection

There are numerous feature selection algorithms in the literature. Examples of filter-based feature selection algorithms include correlation coefficient-based and mutual information-based algorithms [31]. Mutual information-based intrusion detection techniques use a redundancy parameter called b e t a to adjust for input data redundancy and boost performance. It has been proven that higher performance is still possible without this setting, though. By calculating the dependencies between the features, correlation coefficient-based algorithms find the optimal feature set [32]. The sequential selection algorithm and the heuristic search algorithm are examples of wrapper-based feature selection algorithms. Several subsets of features are evaluated repeatedly, but the classifier accuracy cannot be stored for later retrieval [33,34].
Despite the fact that the idea of evolutionary optimization is not new, the current approaches have problems with lengthy run-times and early convergence to local minima [35]. A local minimum is more likely to form when populations evolve towards smaller, less diverse ones because of high run-time. Several evolutionary optimization techniques include GA, differential evolution, particle swarm optimization (PSO), ant colony optimization (ACO), and simulated annealing [36]. The development of techniques to significantly enhance the performance of evolutionary algorithms by reducing their run-time, as well as the usage of traditional encoding strategies for the representation of individuals, provide obstacles for optimization algorithms [37]. The suggested optimization method uses a new coding scheme, which speeds up the detection and selection of the optimal set of features because only the best-fitting features are taken into account, in contrast to the aforementioned existing optimization techniques.

2.3. Supervised Learning Based Anomaly Detection

A survey of machine learning-based detection methods can be found at [38]. It is possible to classify unknown data after the model is constructed. Classifiers constructed on neural networks offer better generalisation capabilities. The disadvantages include overfitting and higher computational costs. Each neuron in an artificial neural network generates a series of activations that have a definite value. Neurons are little, connectionless processors. In learning, weights are determined that cause a neural network to act in a desired way. Several lengthy computations may be necessary, each of which modifies the network’s overall activation, depending on the issue and the connectivity of the neurons [39]. Weights are accurately assigned at different stages of the processing process when using DL, and several processing layers can learn how to represent data at various levels of abstraction [40]. The inclusion of the capsule network in the suggested solution is justified by its capacity to adapt to dynamically changing network conditions.

3. Proposed LPCOCN Approach

This section discusses the proposed LPCOCN approach. The LPCOCN is a lightweight approach that can detect network anomalies at the edge of the IoT. Figure 1 depicts the block schematic of the proposed approach. The proposed approach consists of four modules: feature selection using LPCO, conversion of selected features to image, capsule-network-based learning, and LPCOCN-based anomaly detection.
Let T r be the training dataset with r records and n features with raw data for each record. The nominally valued characteristics are transformed to integers. Min-max normalisation removes the bias from the raw data. By determining the low and high values for each feature, the data are converted throughout the normalisation procedure in the range [0, 1]. The following computation produces the normalised value N o r F i j :
N o r F i j = R F i j L j H j L j
where R F i j denotes the value of the feature, L j denotes the low value, and H j denotes the high value.

3.1. Proposed LPCO-Based Feature Selection

The proposed layered LPCO algorithm is based on the life cycle of a paddy crop and is depicted in Figure 2. It consists of six stages, viz., seedling, tillering, replantation, selection, reproduction, and harvest. These stages are discussed in the following subsections.

3.1.1. Layer 1: Seedling

This layer is the foundation stage as it decides the number of seeds, plants, and generations. The seeds are the number of features in the dataset. The plants and generations are randomly chosen. The seeds are randomly sown for each plant and are binary coded. A seed value of 1 represents the presence of a feature, and 0 represents the absence of a feature. The randomly generated plants belong to the first generation and are involved in producing the best plants. Let P 1 , P 2 , P 3 , …, P m be the plants, where m is the number of plants, and let S i 1 , S i 2 , S i 3 , …, S i n be the seeds of the ith plant, where n is the number of features in the dataset. Each plant is represented as follows:
P i = S i 1 S i 2 S i 2 S i n .

3.1.2. Layer 2: Tillering

In the life cycle of a paddy crop, tillering is the stage in which terminal roots and up to five leaves develop, and the plant becomes ready for replantation. In the proposed approach, the sown seeds with the presence of the feature are replaced with the corresponding data from the training dataset.
S i 1 S i 2 S i 3 S i n = x i 1 x i 2 x i 2 x i n , S i i = 1 0 0 0 0 , O t h e r w i s e .

3.1.3. Layer 3: Replantation

This layer is responsible for computing the fitness of each plant and rank according to the fitness value. The distance-based classifier receives the plants as input, and the accuracy is calculated [7]. The fitness value is computed, and the plants are ranked. It is to be noted that the higher the fitness value is, the lower the rank is. The plant with the lowest rank is the top-fitted plant. The fitness is computed based on the accuracy, A c c , of the distance-based classifier, D C , as follows:
F F = A c c ( D C ) .

3.1.4. Layer 4: Selection

This layer is responsible for selecting the top 50% of the best-fitted plants. Once the plants are ranked, the condition is checked to see if this generation meets the stopping criterion. If not, the top 50% of the plants are selected for reproduction. The top 50% of the plants in the current generation, P t 50 , are represented as follows:
P t 50 = R 1 R 2 R 3 R p .

3.1.5. Layer 5: Reproduction

This layer is responsible for reproducing new plants from the best-fit plants. The sample illustration is depicted in Figure 3. The top two plants are selected, and the position that they differ is identified and converted to 0. Now, both the plants have an equal number of 1s, and this forms the newly produced plant. The bottom 50% of the plants that are reproduced from the best-fit plants of the current generation, P b 50 , are represented as follows:
P b 50 = N P 1 N P 2 N P 3 N P p .

3.1.6. Layer 6: Harvest

This layer is responsible for generating the plants for the next generation. The plants selected in layer 4 and the plants reproduced in layer 5 are concatenated and passed to layer 2. This cycle is repeated until the stopping criterion is met.
P n e w = P t 50 | | P b 50 .
The following are the steps for the feature selection using LPCO:
  • Step 1: Initialize the number of seeds, total number of plants in a generation, and the number of generations.
  • Step 2: The number of seed, s and number of plants, p are binary coded randomly, where 1 represents the presence of a feature, and 0 represents the absence of a feature.
  • Step 3: The distance-based classifier receives the plants with the available feature, and the accuracy is calculated.
  • Step 4: Rank the plants according to the accuracy, such that the higher the accuracy is, the smaller the rank is.
  • Step 5: The top 50% of plants are selected for reproduction.
  • Step 6: The remaining 50% are produced as follows:
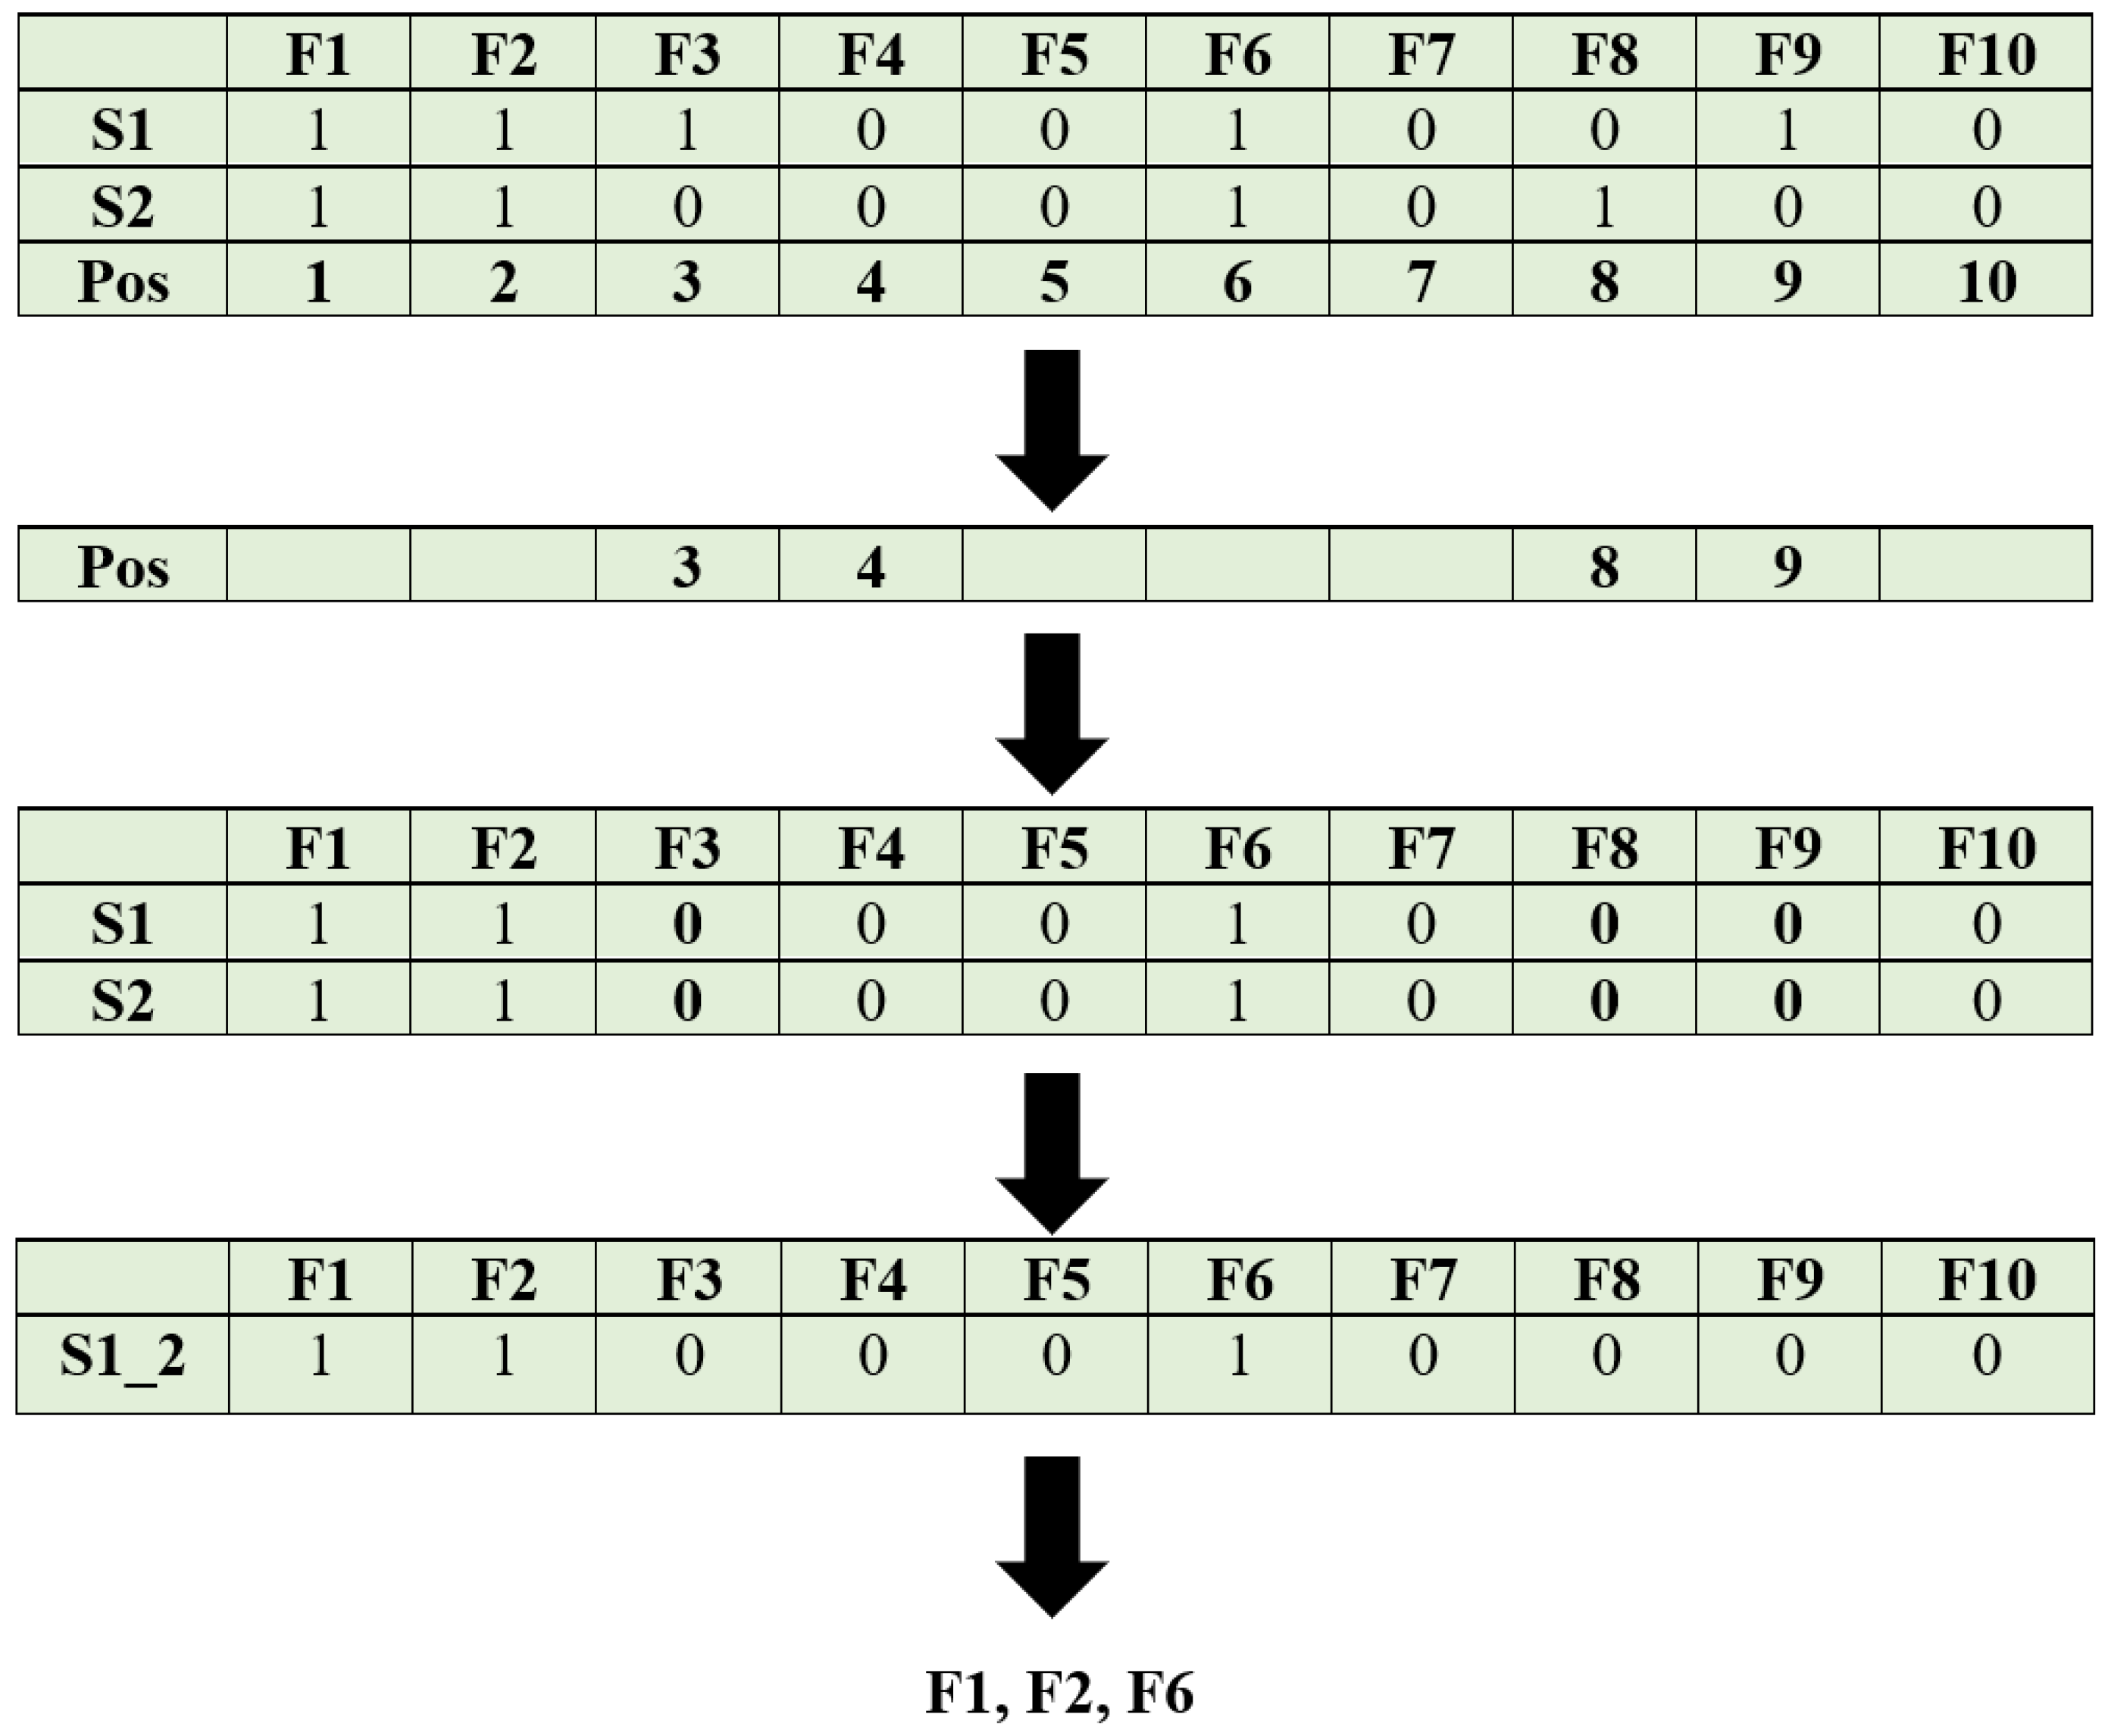
    Step 6.1: Select the top two plants, i and i + 1 , and compute the Hamming distance between them.
    Step 6.2: The position of the plant which is involved for Hamming distance computation is converted to ‘0’, i.e., the absence of a feature.
    Step 6.3: Steps 6.1 and 6.2 are repeated until the Hamming distance computation is performed for all the features.
    Step 6.4: The pth plant is produced by finding the Hamming distance of all records.
  • Step 7: The new generation is passed to step 3, and this continues until the number of generations.
  • Step 8: The features in the last generation are the optimal set of features.
The selected features using LPCO are represented as follows:
S O F = x 1 x 2 x 3 x s
where s is the selected number of features.

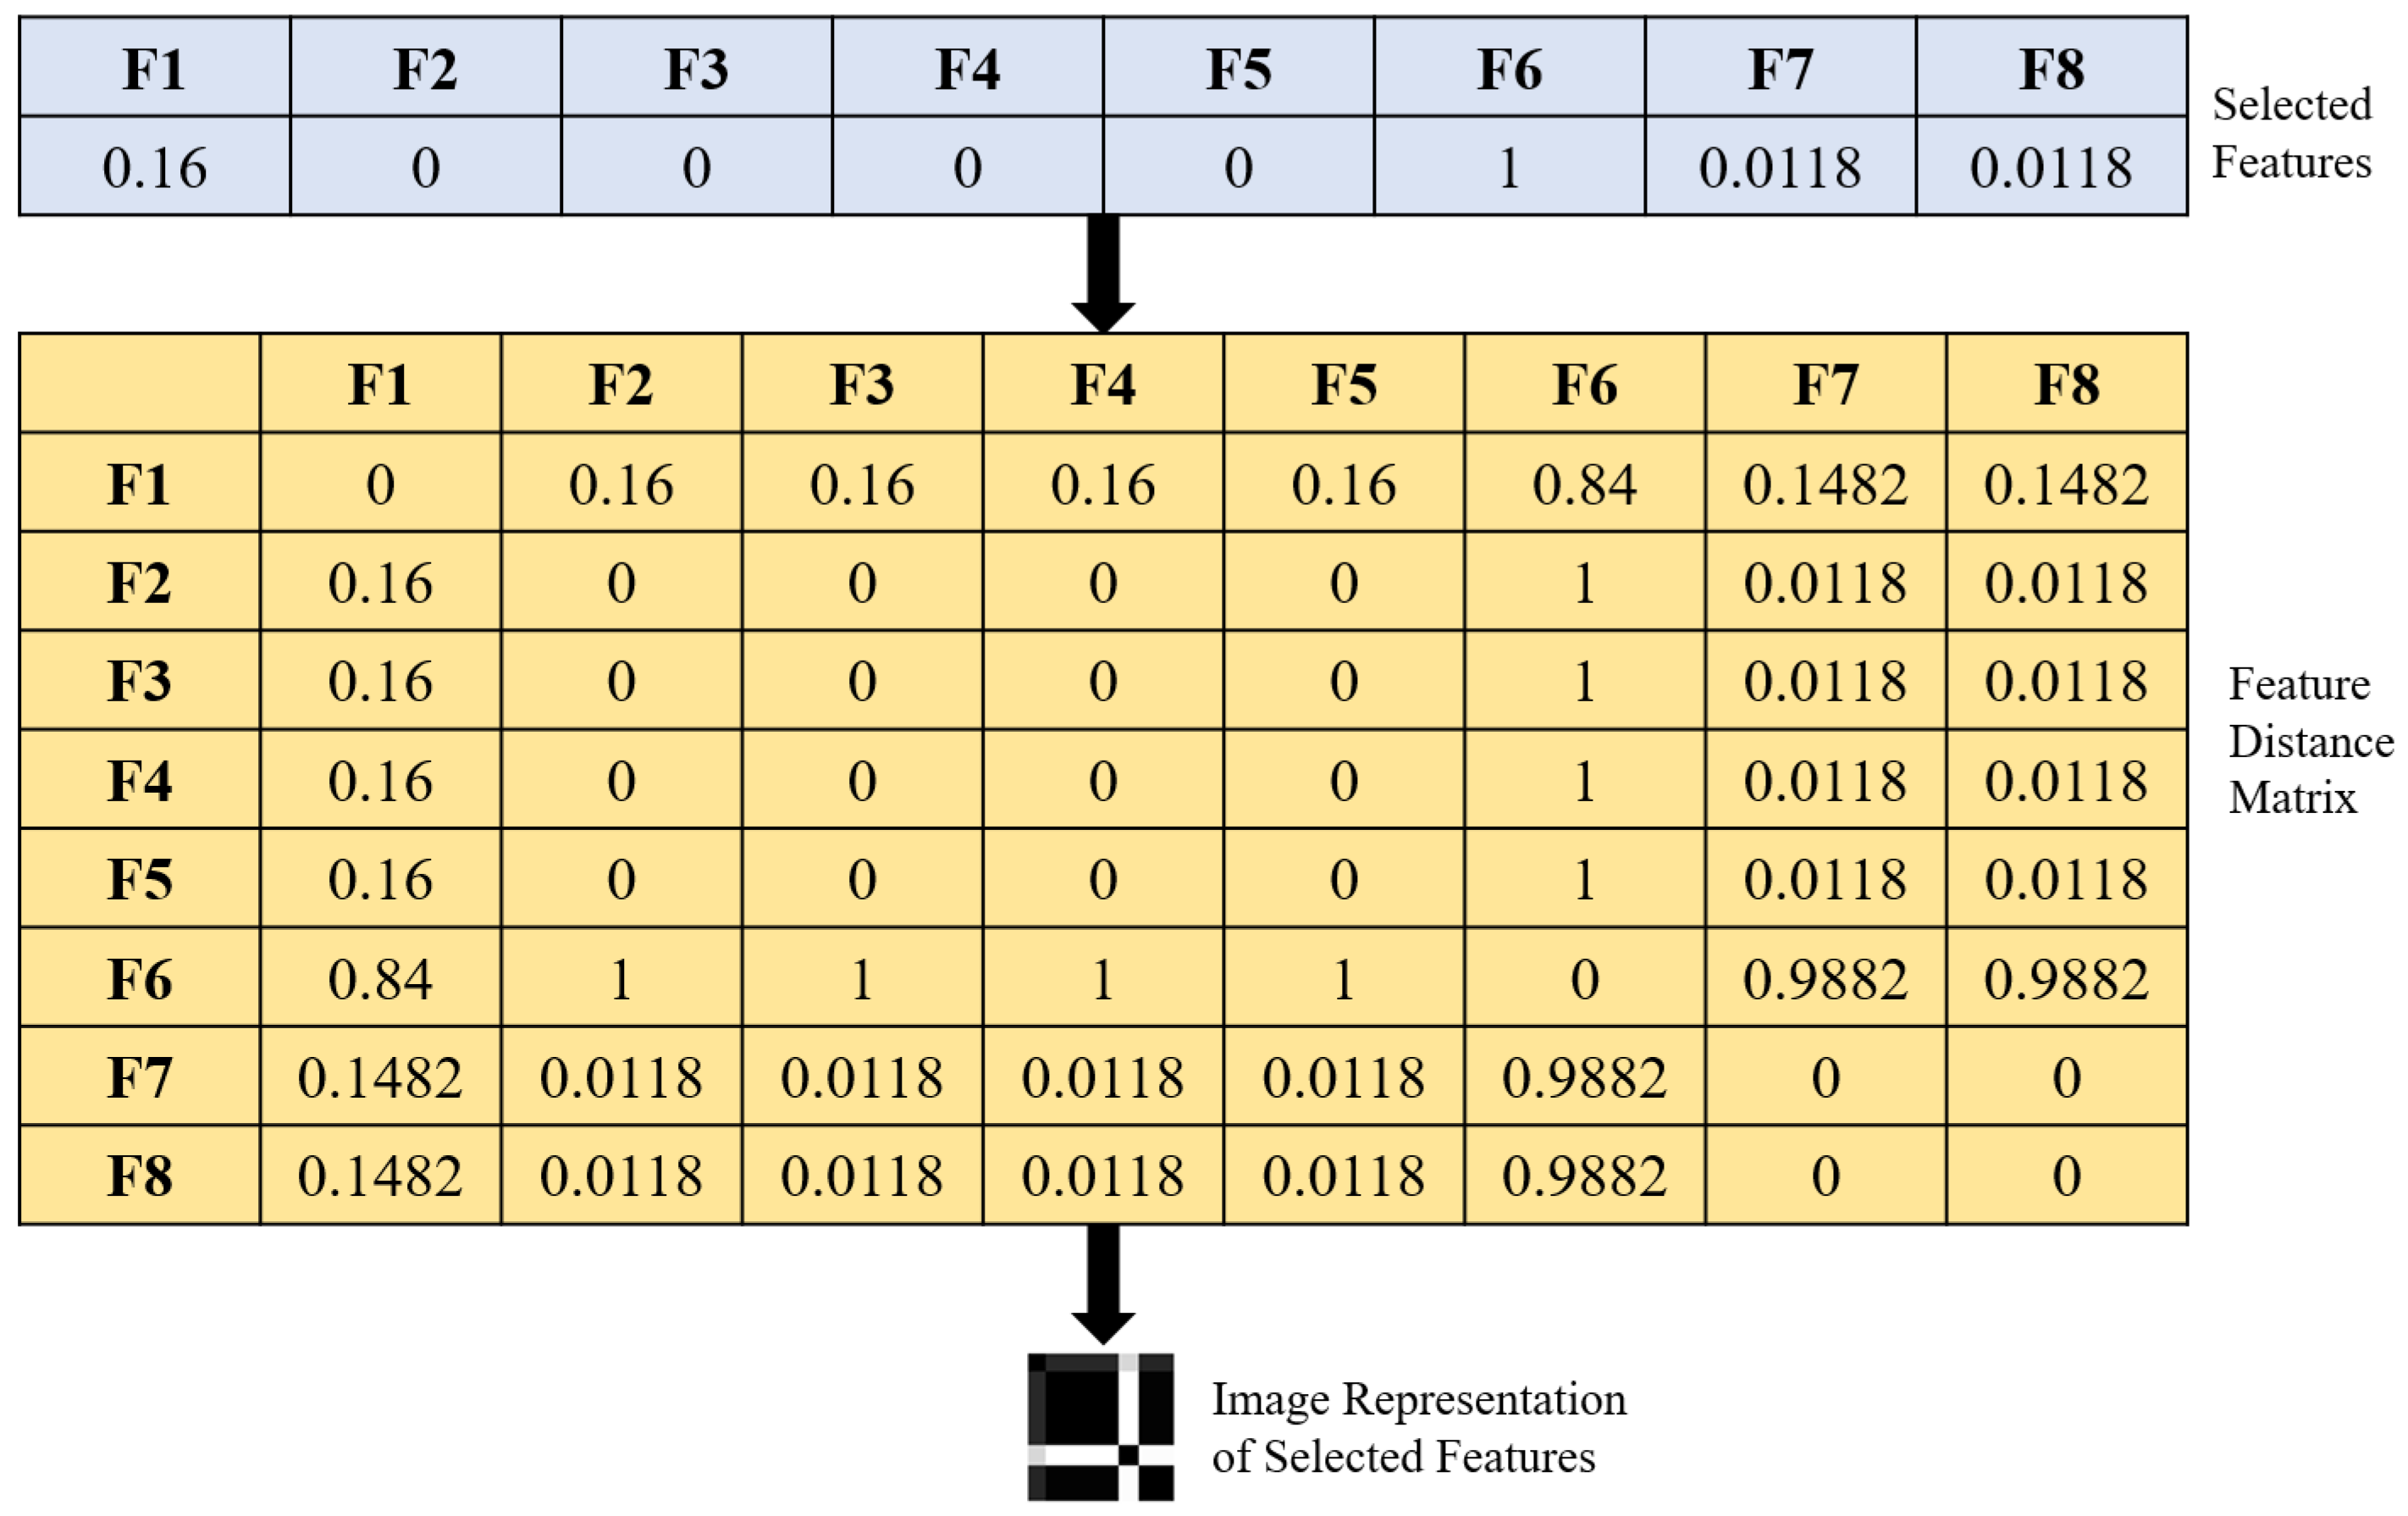
3.2. Conversion of Selected Features to Image

In the proposed LPCOCN approach, the learning is performed using the capsule network. The input to the capsule network must be an image. Therefore, the selected features are converted to an image using the feature distance matrix approach [7]. Figure 4 depicts the illustration of the steps involved in the conversion of selected features to an image.
Using the Manhattan distance technique, the inner correlation between the chosen features is recovered as follows:
D t M a n S O F i , S O F j = S O F i S O F j .
For record i, the feature distance matrix, F e a D M , is calculated as follows:
F e a D M i = D f 11 i D f 12 i D f 13 i D f 1 k i D f 21 i D f 22 i D f 23 i D f 2 k i D f n 1 i D f n 2 i D f n 3 i D f n k i .
The function m a t t o g r a y in MATLAB is utilized to convert the feature distance matrix to a network traffic image.

3.3. Capsule Network Based Learning

Capsule networks and dynamic routing techniques have been used to overcome the drawbacks of convolutional neural network models [41]. Figure 5 depicts the block schematic of the proposed capsule network. The convolution layer, pooling layer, primary capsule, and label capsule make up the proposed capsule network. Lower-layer capsules anticipate higher-layer capsules, and through a positive feedback loop, the parent is further associated with the lower-layer capsules that are more suited to the higher-layer capsules.
Considering that c o i is the output of the ith capsule, the estimation of parent capsule jth is as follows:
c o i | j = W e i i j . c o i
Here, W e i i j is a weight matrix. When a coupling coefficient is multiplied by the product, two capsules come to an agreement. This coefficient, C o C i j , is computed using a softmax function as follows:
C o C i j = e x p ( l o g p p i j ) k e x p ( l o g p p j k )
where l o g p p is the log prior probabilities between two linked capsules. The higher level capsule’s input vector, H L C j , is computed as follows:
H L C j = i C o C i j c o i | j
Long vectors are closer to one with the nonlinear squash activation function, and short vectors are essentially zero with the squash activation function. The squash function is computed as follows:
S Q A j = H L C j 2 1 + H L C j 2 × H L C j H L C j
The margin loss of each output capsule, k, is computed as follows:
M L o s s = U k m a x ( 0 , q + S Q A k ) 2 + λ ( 1 U k ) m a x ( 0 , S Q A k q ) 2
The M L o s s is the deciding factor to stop the learning process. Here, U k is 1 when class k actually exists; otherwise, 0, q + and q are hyperparameters, and λ is used to manage how gradient backpropagation affects learning at the beginning.

3.4. LPCOCN Based Anomaly Detection

The test IoT traffic data are passed as input to this module. The optimal features are selected using the LPCO feature selection approach. The feature distance matrix is constructed for the optimal features and converted to image format, which is passed to the capsule network. Equation (14) is utilized to classify the given test traffic as either normal or attack.

4. Experimental Results

The proposed strategy was put into practice in MATLAB R2021b using an Intel Core 2 Quad CPU [email protected] GHz processor, NVIDIA GPU, and 16 GB RAM running Windows 10. The publicly available benchmark network traffic datasets, such as NSL KDD, UNSW NB, CICIDS, CSE-CIC-IDS, and UNSW Bot-IoT, were used to conduct the experiments [42,43,44,45,46]. Table 1 displays the benchmark anomaly detection dataset statistics. The class label is one of the features.
Figure 6 depicts the epoch versus accuracy of all the datasets. The proposed feature selection approach is tuned based on the number of epochs. The proposed approach has been executed for 150 epochs. The maximum accuracy was obtained in 9, 6, 6, 7, and 7 for the NSL KDD, UNSW NB, CICIDS, CSE-CIC-IDS, and UNSW Bot-IoT datasets, respectively. The features selected in all the datasets are tabulated in Table 2. The number of features selected are 7, 10, 12, 15, and 14 for the NSL KDD, UNSW NB, CICIDS, CSE-CIC-IDS, and UNSW Bot-IoT datasets, respectively.
Based on assessments of true negatives (TN), false positives (FP), false negatives (FN), and true positives (TP), the performance of the proposed technique is assessed. The measures TN, FP, FN, and TP, respectively, represent the proportion of records of normal traffic that are correctly classified as normal, the proportion of records of normal traffic that are incorrectly classified as attacks, the proportion of records of attacks that are incorrectly classified as normal, and the proportion of records of attacks that are correctly classified as attacks. The true positive rate (TPR), false positive rate (FPR), precision, recall, F1-score, accuracy, and error rate (ER) are performance metrics that are calculated using Equations (16), (17), (18), (19), (20), (21), and (22), respectively, and presented in Table 3. The percentage of the attack class that was successfully identified as an attack is measured by the TPR. The percentage of the normal class that was wrongly labelled as an attack is measured by the FPR. Recall is the percentage of relevant instances that were really recovered, whereas precision is the percentage of relevant occurrences among the retrieved instances. The harmonic mean of recall and precision is known as the F1-score. The ability of the attack detection system to correctly identify the class label is measured by accuracy. The anomaly detection system which erroneously identifies the class label is measured as ER.
T P R = T P T P + F N × 100
F P R = F P F P + T N × 100
P r e c i s i o n = T P T P + F P × 100
R e c a l l = T P T P + F N × 100
F 1 S c o r e = 2 × P r e c i s i o n × R e c a l l P r e c i s i o n + R e c a l l
A c c u r a c y = T P + T N T P + F P + T N + F N × 100
E R = F N + F P T P + F P + T N + F N × 100
The suggested method is contrasted with already known deep learning methods such as CNN, a combination of CNN and LSTM, and CN, as well as optimization-based feature selection methods such as GA, PSO, and ACO. Table 4 lists the deep learning approach parameters that were used for comparison [47]. All optimization methods started with a population size of 50.
Figure 7 depicts the performance of the proposed approach with selected features using LPCO and with all the features. It is evident that the detection of anomalies with the selected features outperforms the detection of anomalies without feature selection. In UNSW Bot-IoT, there is not much difference between selected features and without selected features as the number of records in normal traffic is much less as compared to other datasets.
Table 5 tabulates the state-of-the-art comparison of the proposed approach with existing machine learning classifiers in terms of accuracy and error rate. It is observed that the proposed approach exceeds the existing state-of-the-art approaches except [27], as this approach considers only the five best features. The proposed LPCOCN approach selected the optimal features using the LPCO feature selection method and detected the anomaly efficiently using the capsule network approach with the best set of traffic features. As the proposed approach used only the best set of features, it is fit to be deployed at the edge of the IoT network.

5. Conclusions

In this study, the LPCOCN approach is suggested for the detection of anomalies at the edge of IoT networks. The aim is to build an anomaly detection system that is suitable to detect traffic anomalies at the edge of IoT networks. The lightweight anomaly detection system was built by selecting an optimal set of features using the proposed LPCO feature selection approach, and the anomaly was detected using the capsule network. The benchmark anomaly detection datasets, viz., NSL KDD, UNSW NB, CICIDS, CSE-CIC-IDS, and UNSW Bot-IoT, have been used to evaluate the performance of the proposed LPCOCN approach. The experimental study shows that the suggested technique converges after only a few learning epochs. Additionally, the experimental results manifested that the suggested approach significantly outperforms the cutting-edge deep learning algorithms in terms of accuracy and error rate reduction. However, by capturing real-world network traffic, this study might be extended to include on-the-fly anomaly identification in IoT networks.

Author Contributions

B.A.N.G.: conceptualization, implementation, writing—original draft preparation; V.S.: investigation, implementation, writing—review and editing; V.R.: writing—review and editing, supervision, funding; R.C.: resources, writing—review and editing. All authors have read and agreed to the published version of the manuscript.

Funding

This research received no external funding.

Data Availability Statement

Not applicable.

Conflicts of Interest

The authors declare no conflict of interest.

References

  1. Shafiq, M.; Nazir, S.; Yu, X. Identification of Attack Traffic Using Machine Learning in Smart IoT Networks. Secur. Commun. Netw. 2022, 2022, 9804596. [Google Scholar] [CrossRef]
  2. Malhotra, P.; Singh, Y.; Anand, P.; Bangotra, D.K.; Singh, P.K.; Hong, W.C. Internet of things: Evolution, concerns and security challenges. Sensors 2021, 21, 1809. [Google Scholar] [CrossRef] [PubMed]
  3. NG, B.A.; Selvakumar, S. Anomaly detection framework for Internet of things traffic using vector convolutional deep learning approach in fog environment. Future Gener. Comput. Syst. 2020, 113, 255–265. [Google Scholar]
  4. Dhelim, S.; Aung, N.; Kechadi, T.; Ning, H.; Chen, L.; Lakas, A. Trust2Vec: Large-Scale IoT Trust Management System based on Signed Network Embeddings. IEEE Internet Things J. 2022. [Google Scholar] [CrossRef]
  5. IoT Market Forecast. Available online: https://www.iotforall.com/state-of-iot-2022 (accessed on 30 September 2022).
  6. Bangui, H.; Buhnova, B. Lightweight intrusion detection for edge computing networks using deep forest and bio-inspired algorithms. Comput. Electr. Eng. 2022, 100, 107901. [Google Scholar] [CrossRef]
  7. Amma, N.B.; Selvakumar, S.; Velusamy, R.L. A statistical approach for detection of denial of service attacks in computer networks. IEEE Trans. Netw. Serv. Manag. 2020, 17, 2511–2522. [Google Scholar] [CrossRef]
  8. Wei, D.; Shi, F.; Dhelim, S. A Self-Supervised Learning Model for Unknown Internet Traffic Identification Based on Surge Period. Future Internet 2022, 14, 289. [Google Scholar] [CrossRef]
  9. Koroniotis, N.; Moustafa, N.; Sitnikova, E.; Turnbull, B. Towards the development of realistic botnet dataset in the internet of things for network forensic analytics: Bot-iot dataset. Future Gener. Comput. Syst. 2019, 100, 779–796. [Google Scholar] [CrossRef] [Green Version]
  10. Chander, B.; Pal, S.; De, D.; Buyya, R. Artificial intelligence-based internet of things for industry 5.0. In Artificial Intelligence-Based Internet of Things Systems; Springer: Cham, Switzerland, 2022; pp. 3–45. [Google Scholar]
  11. Alkadi, O.; Moustafa, N.; Turnbull, B.; Choo, K.K.R. A deep blockchain framework-enabled collaborative intrusion detection for protecting IoT and cloud networks. IEEE Internet Things J. 2020, 8, 9463–9472. [Google Scholar] [CrossRef]
  12. Bebortta, S.; Singh, S.K. An Opportunistic Ensemble Learning Framework for Network Traffic Classification in IoT Environments. In Proceedings of the Seventh International Conference on Mathematics and Computing; Springer: Singapore, 2022; pp. 473–484. [Google Scholar]
  13. Churcher, A.; Ullah, R.; Ahmad, J.; Ur Rehman, S.; Masood, F.; Gogate, M.; Alqahtani, F.; Nour, B.; Buchanan, W.J. An experimental analysis of attack classification using machine learning in IoT networks. Sensors 2021, 21, 446. [Google Scholar] [CrossRef]
  14. Tidjon, L.N.; Frappier, M.; Mammar, A. Intrusion detection systems: A cross-domain overview. IEEE Commun. Surv. Tutor. 2019, 21, 3639–3681. [Google Scholar] [CrossRef]
  15. Thakkar, A.; Lohiya, R. Fusion of statistical importance for feature selection in Deep Neural Network-based Intrusion Detection System. Inf. Fusion 2022, 90, 353–363. [Google Scholar] [CrossRef]
  16. Zuech, R.; Khoshgoftaar, T.M. A survey on feature selection for intrusion detection. In Proceedings of the 21st ISSAT International Conference on Reliability and Quality in Design, Philadelphia, PA, USA, 6–8 August 2015; pp. 150–155. [Google Scholar]
  17. Kasongo, S.M.; Sun, Y. Performance analysis of intrusion detection systems using a feature selection method on the UNSW-NB15 dataset. J. Big Data 2020, 7, 1–20. [Google Scholar] [CrossRef]
  18. Shahbaz, M.B.; Wang, X.; Behnad, A.; Samarabandu, J. On efficiency enhancement of the correlation-based feature selection for intrusion detection systems. In Proceedings of the 2016 IEEE 7th Annual Information Technology, Electronics and Mobile Communication Conference (IEMCON), Vancouver, BC, Canada, 13–15 October 2016; pp. 1–7. [Google Scholar]
  19. Aparicio-Navarro, F.J.; Kyriakopoulos, K.G.; Parish, D.J. Automatic dataset labelling and feature selection for intrusion detection systems. In Proceedings of the 2014 IEEE Military Communications Conference, Washington, DC, USA, 6–8 October 2014; pp. 46–51. [Google Scholar]
  20. Ebrahimi, H.; Majidzadeh, K.; Soleimanian Gharehchopogh, F. Integration of deep learning model and feature selection for multi-label classification. Int. J. Nonlinear Anal. Appl. 2022, 13, 2871–2883. [Google Scholar]
  21. Ibitoye, O.; Shafiq, O.; Matrawy, A. Analyzing adversarial attacks against deep learning for intrusion detection in IoT networks. In Proceedings of the 2019 IEEE global communications conference (GLOBECOM), Waikoloa, HI, USA, 9–13 December 2019; pp. 1–6. [Google Scholar]
  22. Shafiq, M.; Tian, Z.; Bashir, A.K.; Du, X.; Guizani, M. CorrAUC: A malicious bot-IoT traffic detection method in IoT network using machine-learning techniques. IEEE Internet Things J. 2020, 8, 3242–3254. [Google Scholar] [CrossRef]
  23. Zeeshan, M.; Riaz, Q.; Bilal, M.A.; Shahzad, M.K.; Jabeen, H.; Haider, S.A.; Rahim, A. Protocol-Based Deep Intrusion Detection for DoS and DDoS Attacks Using UNSW-NB15 and Bot-IoT Data-Sets. IEEE Access 2021, 10, 2269–2283. [Google Scholar] [CrossRef]
  24. Naouri, A.; Wu, H.; Nouri, N.A.; Dhelim, S.; Ning, H. A novel framework for mobile-edge computing by optimizing task offloading. IEEE Internet Things J. 2021, 8, 13065–13076. [Google Scholar] [CrossRef]
  25. Magaia, N.; Fonseca, R.; Muhammad, K.; Segundo, A.H.F.N.; Neto, A.V.L.; de Albuquerque, V.H.C. Industrial internet-of-things security enhanced with deep learning approaches for smart cities. IEEE Internet Things J. 2020, 8, 6393–6405. [Google Scholar] [CrossRef]
  26. Karim, R.; Rizvi, M.; Islam, A.; Arefin, M.S. A Survey on Anomaly Detection Strategies. In Proceedings of the International Conference on Image Processing and Capsule Networks, Bangkok, Thailand, 27–28 May 2021; pp. 289–297. [Google Scholar]
  27. Popoola, S.I.; Adebisi, B.; Ande, R.; Hammoudeh, M.; Anoh, K.; Atayero, A.A. smote-drnn: A deep learning algorithm for botnet detection in the internet-of-things networks. Sensors 2021, 21, 2985. [Google Scholar] [CrossRef]
  28. Tsogbaatar, E.; Bhuyan, M.H.; Taenaka, Y.; Fall, D.; Gonchigsumlaa, K.; Elmroth, E.; Kadobayashi, Y. DeL-IoT: A deep ensemble learning approach to uncover anomalies in IoT. Internet Things 2021, 14, 100391. [Google Scholar] [CrossRef]
  29. Aversano, L.; Bernardi, M.L.; Cimitile, M.; Pecori, R. A systematic review on Deep Learning approaches for IoT security. Comput. Sci. Rev. 2021, 40, 100389. [Google Scholar] [CrossRef]
  30. Tahaei, H.; Afifi, F.; Asemi, A.; Zaki, F.; Anuar, N.B. The rise of traffic classification in IoT networks: A survey. J. Netw. Comput. Appl. 2020, 154, 102538. [Google Scholar] [CrossRef]
  31. Amma, N.G.B.; Subramanian, S. Feature correlation map based statistical approach for denial of service attacks detection. In Proceedings of the 2019 5th International Conference on Computing Engineering and Design (ICCED), Singapore, 11–13 April 2019; pp. 1–6. [Google Scholar]
  32. Nimbalkar, P.; Kshirsagar, D. Feature selection for intrusion detection system in Internet-of-Things (IoT). ICT Express 2021, 7, 177–181. [Google Scholar] [CrossRef]
  33. Kamalov, F.; Moussa, S.; Zgheib, R.; Mashaal, O. Feature selection for intrusion detection systems. In Proceedings of the 2020 13th International Symposium on Computational Intelligence and Design (ISCID), Hangzhou, China, 12–13 December 2020; pp. 265–269. [Google Scholar]
  34. Maza, S.; Touahria, M. Feature selection for intrusion detection using new multi-objective estimation of distribution algorithms. Appl. Intell. 2019, 49, 4237–4257. [Google Scholar] [CrossRef]
  35. Aghdam, M.H.; Kabiri, P. Feature selection for intrusion detection system using ant colony optimization. Int. J. Netw. Secur. 2016, 18, 420–432. [Google Scholar]
  36. Kunhare, N.; Tiwari, R.; Dhar, J. Particle swarm optimization and feature selection for intrusion detection system. Sādhanā 2020, 45, 1–14. [Google Scholar] [CrossRef]
  37. Moukhafi, M.; El Yassini, K.; Bri, S. A novel hybrid GA and SVM with PSO feature selection for intrusion detection system. Int. J. Adv. Sci. Res. Eng 2018, 4, 129–134. [Google Scholar] [CrossRef]
  38. Maldonado, J.; Riff, M.C.; Neveu, B. A review of recent approaches on wrapper feature selection for intrusion detection. Expert Syst. Appl. 2022, 198, 116822. [Google Scholar] [CrossRef]
  39. Dahou, A.; Abd Elaziz, M.; Chelloug, S.A.; Awadallah, M.A.; Al-Betar, M.A.; Al-qaness, M.A.; Forestiero, A. Intrusion Detection System for IoT Based on Deep Learning and Modified Reptile Search Algorithm. Comput. Intell. Neurosci. 2022, 2022, 6473507. [Google Scholar] [CrossRef]
  40. Amma, N.B.; Selvakumar, S.; Velusamy, R.L. SAGRU: A Stacked Autoencoder-Based Gated Recurrent Unit Approach to Intrusion Detection. In Proceedings of the FICTA (2), Karnataka, India, 4–5 January 2020; pp. 41–50. [Google Scholar]
  41. Krupski, J.; Graniszewski, W.; Iwanowski, M. Data Transformation Schemes for CNN-Based Network Traffic Analysis: A Survey. Electronics 2021, 10, 2042. [Google Scholar] [CrossRef]
  42. Iglesias, F.; Zseby, T. Analysis of network traffic features for anomaly detection. Mach. Learn. 2015, 101, 59–84. [Google Scholar] [CrossRef] [Green Version]
  43. Moustafa, N.; Slay, J. The evaluation of Network Anomaly Detection Systems: Statistical analysis of the UNSW-NB15 data set and the comparison with the KDD99 data set. Inf. Secur. J. Glob. Perspect. 2016, 25, 18–31. [Google Scholar] [CrossRef]
  44. CICIDS 2017. Available online: https://www.unb.ca/cic/datasets/ids-2017.html (accessed on 25 July 2022).
  45. CSE-CIC-IDS 2018. Available online: https://www.unb.ca/cic/datasets/ids-2018.html (accessed on 25 July 2022).
  46. UNSW Bot-iot Dataset 2018. Available online: https://research.unsw.edu.au/projects/unsw-nb15-dataset (accessed on 27 July 2022).
  47. Yao, H.; Gao, P.; Wang, J.; Zhang, P.; Jiang, C.; Han, Z. Capsule network assisted IoT traffic classification mechanism for smart cities. IEEE Internet Things J. 2019, 6, 7515–7525. [Google Scholar] [CrossRef]
Figure 1. Block schematic of proposed LPCOCN approach.
Information 13 00587 g001
Figure 2. Block schematic of proposed LPCO feature selection method.
Information 13 00587 g002
Figure 3. Illustration of proposed LPCO feature selection method.
Information 13 00587 g003
Figure 4. Conversion of selected features to image.
Information 13 00587 g004
Figure 5. Block schematic of proposed capsule network.
Information 13 00587 g005
Figure 6. Epoch vs. Accuracy: (a) NSL KDD, (b) UNSW NB, (c) CICIDS, (d) CSE-CIC-IDS, (e) UNSW Bot-IoT.
Information 13 00587 g006
Figure 7. Traffic Dataset vs. Accuracy with respect to features.
Information 13 00587 g007
Table 1. Statistics of benchmark anomaly detection datasets.
DatasetFeaturesTraining DataTest Data
NormalAttackNormalAttack
NSL KDD4213,449919521523603
UNSW NB4820,520407656,00012,264
CICIDS83128,73729,28555,17312,550
CSE-CIC-IDS7868,40389,61929,31538,408
UNSW Bot-IoT441018303,6915477366,8045
Table 2. Selected features using LPCO approach.
DatasetSelected Features
NSL KDD s r c _ b y t e s , d s t _ h o s t _ s r v _ s e r r o r _ r a t e , d s t _ b y t e s , d s t _ h o s t _ s e r r o r _ r a t e , s e r r o r _ r a t e ,
d s t _ h o s t _ c o u n t , d s t _ h o s t _ s r v _ r a t e
UNSW NB c t _ s r v , s m e a n , s l o a d , r a t e , s t t l , c t _ s r c , d m e a n , d l o s s , d w i n , s y n a c k
CICIDS p a c k e t _ l e n g t h _ s t d , t o t a l _ l e n g t h _ b w d _ p a c k e t s , s u b f l o w _ b w d _ b y t e , s u b f l o w _ f w d _ b y t e s ,
a v e r a g e _ p a c k e t _ s i z e , f w d _ I A T _ m e a n , f l o w _ I A T _ m e a n , i d l e _ m a x , a c t i v e _ m e a n , a c t _ d a t a _ p k t _ f w d ,
f w d _ p a c k e t _ l e n g t h _ s t d , f w d _ h e a d e r _ l e n g t h
CSE-CIC-IDS i n i t _ w i n _ b y t e s _ b a c k w a r d , p a c k e t _ l e n g t h _ s t d , t o t a l _ l e n g t h _ b w d _ p a c k e t s , s u b f l o w _ b w d _ b y t e ,
s u b f l o w _ f w d _ b y t e s , a v e r a g e _ p a c k e t _ s i z e , f w d _ I A T _ m e a n , f l o w _ I A T _ m e a n , i d l e _ m a x , a c t i v e _ m e a n ,
i n i t _ w i n _ b y t e s _ b a c k w a r d , a c t _ d a t a _ p k t _ f w d , f w d _ p a c k e t _ l e n g t h _ s t d , f w d _ h e a d e r _ l e n g t h , f l o w _ p a c k e t s / s
UNSW Bot-IoT s a d d r , s p o r t , d a d d r , d p o r t , p k t s , b y t e s , s t a t e , s t a t e _ n u m b e r , l t i m e , s e q , d u r , m e a n , d p k t s ,
P k t s _ P _ S t a t e _ P _ P r o t o c o l _ P _ S r c I P
Table 3. Performance evaluation.
DatasetClassifiersTPRFPRPrecisionRecallF1-ScoreAccuracyER
NSL KDDCNN99.5840.74399.55699.58499.57099.4610.539
CNNLSTM99.6390.69799.58499.63999.61299.51350.4865
CN99.6950.55899.66799.69599.68199.6000.400
GACN99.7220.41899.75099.72299.73699.6700.330
PSOCN99.6670.27999.83399.66799.75099.6870.313
ACOCN99.7500.37299.77899.75099.76499.7050.295
Proposed LPCOCN99.8330.18699.88999.83399.86199.8260.174
UNSW NBCNN98.7850.60597.27898.78598.02699.2850.715
CNNLSTM98.7200.56197.47298.72098.09299.3100.690
CN98.8670.49397.77498.86798.31799.3920.608
GACN99.1520.43098.05799.15298.60199.4950.505
PSOCN99.0950.35598.38999.09598.74199.5460.454
ACOCN99.2420.36898.33699.24298.78799.56200.438
Proposed LPCOCN99.4540.30798.60999.45499.03099.6500.350
CICIDSCNN95.2270.43798.02395.22796.60598.7601.240
CNNLSTM95.3710.46897.89095.37196.61498.7611.239
CN95.9120.43098.06995.91296.97998.8931.107
GACN96.0800.40198.20096.08097.12898.9471.053
PSOCN96.0000.41098.15996.00097.06798.9251.075
ACOCN96.1670.39598.22696.16797.18698.9681.032
Proposed LPCOCN96.6850.44898.00596.68597.34199.0210.979
CSE-CIC-IDSCNN98.3050.84999.34598.30598.82298.6711.329
CNNLSTM98.3360.79599.38598.33698.85998.7121.288
CN98.3280.90499.30398.32898.81398.6611.339
GACN98.4350.78199.39898.43598.91498.7741.226
PSOCN98.4090.79899.38598.40998.89598.7521.248
ACOCN98.4590.70399.45898.45998.95698.8221.178
Proposed LPCOCN98.5190.62899.51698.51999.01598.8881.112
UNSW Bot-IoTCNN99.9565.03199.99999.95699.97899.9560.044
CNNLSTM99.9575.45199.99999.95799.97899.9560.044
CN99.9573.98399.99999.95799.97899.9570.043
GACN99.9592.725100.099.95999.97999.9590.041
PSOCN99.9612.096100.099.96199.98099.9610.039
ACOCN99.9652.306100.099.96599.98299.9650.035
Proposed LPCOCN99.9721.258100.099.97299.98699.9720.028
Table 4. Parameters of existing deep learning approaches.
ModelLayerParameters
CNConvolutionfilters = 64, kernel = 3, stride = 1
Convolution capsulefilters = 128, kernel = 2, stride = 1,
capsule vector = 8, capsule = 16
Fully connectedcapsule vector = 8, capsule = 2
LSTMhidden units = 32, bias = 1
CNNConvolutionfilters = 64, kernel = 3,4,5, stride = 1
CNNLSTMConvolutionfilters = 64, kernel = 3,4,5, stride = 1
LSTMhidden units = 32, bias = 1
Table 5. State-of-the-Art analysis of proposed LPCOCN using UNSW Bot-IoT dataset.
Approach/YearAccuracy (%)Error Rate (%)
FNN [21]/201995.05.0
SVM [9]/201988.311.7
RNN [9]/201997.92.1
LSTM [9]/201998.02.0
DT [22]/202099.990.01
NB [22]/202097.52.5
RF [22]/202099.980.02
SVM [22]/202097.82.2
VCDL [3]/202099.760.24
BiLSTM [11]/202098.911.09
LSTM [23]/202196.33.7
KNN [13]/202199.01.0
SVM [13]/202179.021.0
DT [13]/202196.04.0
NB [13]/202194.06.0
RF [13]/202195.05.0
ANN [13]/202197.03.0
LR [13]/202174.026.0
SMOTE-DRNN [27]/2021100.00.0
LPCOCN99.970.03
Publisher’s Note: MDPI stays neutral with regard to jurisdictional claims in published maps and institutional affiliations.

