Abstract
Since the start of the COVID-19 pandemic, government authorities have responded by issuing new public health policies, many of which were intended to contain its spread but ended up limiting economic and social activities. The citizen responses to these policies are diverse, ranging from goodwill to fear and anger. It is challenging to determine whether or not these public health policies achieved the intended impact. This requires systematic data collection and scientific studies, which can be very time-consuming. To overcome such challenges, in this paper, we provide an alternative approach to continuously monitor and dynamically make sense of how public health policies impact citizens. Our approach is to continuously collect Twitter posts related to COVID-19 policies and to analyze the public reactions. We have developed a web-based system that collects tweets daily and generates timelines and geographical displays of citizens’ “concern levels”. Tracking the public reactions towards different policies can help government officials assess the policy impacts in a more dynamic and real-time manner. For this paper, we collected and analyzed over 16 million tweets related to ten policies over a 10-month period. We obtained several findings; for example, the “COVID-19 (General)” and ”Ventilators” policies engendered the highest concern levels, while the “Face Coverings” policy caused the lowest. Nine out of ten policies exhibited significant changes in concern levels during the observation period.
1. Introduction
1.1. Motivations
The global COVID-19 pandemic has been a devastating event with unique scientific and public health challenges. As of 26 October 2022, there were over 600 million cumulative infections and over 6.5 million cumulative deaths worldwide [1]. In order to reduce the spread of the virus while recognizing the need to return to normal life, policymakers have had to formulate policies, guidelines, actions, or measures, ranging from directives to prevent the spread of the disease to economic measures to minimize adverse impacts. These policies or directives addressed activities of personal preventive care, such as washing hands, social distancing, or mask mandates, and economic, educational, and social restrictions by enforcing business and school closings, housing eviction suspensions, etc.
Over the course of the evolving COVID-19 pandemic, policies were repeatedly enacted and changed on short notice, impacting not only disease control but also public attitudes. For example, China enforced an extreme COVID-19 measure called the “zero-COVID policy”, locking entire cities, restricting their citizens’ movement for prolonged periods, forcing people into isolation and quarantine, and subjecting them to continuous testing and surveillance [2]. While such policies were intended to prevent the disease’s spread, citizens have shown a variety of attitudes toward them. Many citizens reacted to these policies with anxiety, depression, panic, and fear, as well as anger. When a large international retail chain in China faced a sudden lockdown, panicked customers tried to exit the store as quickly as possible, fearing quarantine, isolation, and enforced testing [3]. It is important to track the public’s attitudes toward these COVID-19 policies in real time because this can be another gauge for assessing the impact of these government policies.
In this paper, we propose a Public Health Policy Perception Monitoring and Awareness Platform as a near-real-time tracking system of citizen reactions toward health policies. This platform’s objective is to elucidate the public perception of COVID-19 health policies as an indirect indicator of policy impact in a near-real-time manner. This platform has an advantage over the traditional policy outcomes assessment or impact study methods, which involve well-designed surveys or observational data collected over a long period of time [4]. In contrast, this platform continuously collects citizen-generated Twitter data about health policies and analyzes their sentiments and concern levels expressed about each policy. In addition, the platform intends to enhance public awareness of health policies through visual browsing and summarization tools.
To measure public perceptions towards public health policies, we limited our inquiry to the coarse-grained measures of whether Twitter users felt positive, negative, or neutral about them and to what extent. As news reports expressed enough evidence that reactions were mostly negative, we quantified these attitudes as “concern levels”. A priori, there is no reason why all reactions to COVID-19 policies should be negative. While many citizens might feel restricted by indoor facemask mandates, others might experience an increased degree of safety because their fellow citizens are also masked. While some working parents might feel burdened by having their children at home, other parents would appreciate that the danger of infection to their children is reduced by school closings.
The concern levels can be instructive for government policymakers who have had the difficult task of balancing the expected positive effects with the actual impact of policies. Keeping track of public concern levels is challenging due to different policy types, temporal trends, regional variations, etc. Fine-grained monitoring of concern levels is necessary because government agencies promulgate policies at different levels (federal, state, county, city/town). In a rapidly changing environment, monitoring public perceptions of health policies needs to be continuous so that it can be useful for understanding the policy’s impact on citizens.
1.2. Research Questions
There are several websites providing visualizations of daily and cumulative cases at different administrative levels, such as the Johns Hopkins Coronavirus Resource Center [5], the New York Times [6], and different government agencies [7]. These websites provide awareness of the COVID-19 pandemic regarding the number of cases and deaths. In contrast, our system for health policy monitoring aims to answer the following research questions:
- What government policies engendered the highest and the lowest concern levels in citizens?
- How have citizens’ concern levels about different health policies changed during the progression of the pandemic?
- Is the concern level trend positively correlated with the infection/death case trends?
- Is there a notable difference in the public’s attitude toward health policies among US states?
- What kinds of public health policies are issued by different regions/towns, and how many?
- Are there any notable health policy differences among different regions/towns?
- What are summaries of particular policies?
1.3. Contributions
This study makes the following contributions:
- We have developed a working prototype system of our proposed Public Health Policy Perception Monitoring and Awareness Platform that continuously collects Twitter data relating to COVID health policies. It provides analysis by near real-time tracking of citizen concerns towards government policies through sentiment analysis and policy awareness capabilities.
- The provision of concern level trends could serve as a speedy source of information to identify resistance or acceptance of launched COVID-19 policies among citizens. Tracking the concern level trends over time in all US states can help local government agencies to gauge the reactions of citizens to particular policies and compare them across different states or cities. Uncovering negative public perceptions and concerns towards a health policy could provide useful feedback to identify problematic policies and to fine-tune them to address any arising tensions between citizens and government agencies.
- Situational awareness components of public health policies provide policy transparency to citizens. There have been many policies and measures mandated and recommended by different local governments during the pandemic. Keeping track of the multiple policies is challenging. The tracking capabilities and spatial analysis of policies by types and quantities show different city/state-level foci of policies. In addition, policies that are stated mostly as long text documents could be challenging to digest by citizens with limited time and without a legal background. Using AI-based text summarization models, the system could provide the public with summarized policy text documents to enhance the citizens’ understanding of policy contents.
1.4. Organization
This paper is organized as follows. In Section 2, we summarize related work. We present the COVID policy concern monitoring methods and results in Section 3. Specifically, we are discussing concern level analysis, monitoring, and trends, as well as relationships between pandemic trends and concern levels. This is complemented by a geographical analysis.
2. Related Work
Twitter is one of the world’s top platforms for user-generated content. In 2020, there were, on average, around 500 million tweets generated every day [8].
2.1. Sentiment Analysis
Sentiment analysis is a discipline that aims to extract qualitative characteristics from users’ text data, such as sentiments, opinions, thoughts, and behavioral intent [9]. Social media texts are particularly useful for sentiment analysis research [10]. They are (1) used to express a standpoint and (2) filled with subjective text. Soon after Twitter was launched in 2006, social and computer scientists used Twitter data for sentiment detection and analysis research [11]. In the past decade, there has been significant research on Twitter sentiment classification using Machine Learning algorithms such as Naïve Bayes, Support Vector Machines, Convolutional Neural Networks, and Sentiment Specific Word Embeddings [12]. Meanwhile, sentiment analysis of tweets often must tackle issues such as under-specificity, noise, and multilingual content. Singh et al. [13] proposed a heterogeneous multi-layer network-based representation. Their work addressed the issues of under-specificity (text limits), noisy text (presence of short forms, long forms, misspellings, etc.), and multilingual content and provided better classification performance.
A 2017 study [14] found approximately 7000 papers published on sentiment analysis by 2016, including work on sarcasm detection, emotion mining, and sentiment analysis applications. In industry, sentiment analysis is implemented for pattern identification and accurate data-driven predictions [15], providing solutions to different real-life problems, such as stock market prediction [16], political elections forecasting [17], crisis management [18], individual and collective emotional response communication [19], etc. In the study of Asur and Huberman [10], they argued that a deep understanding of social media communications could be helpful for accurate predictions of future activities and events. Twitter posts have also been used for cluster analysis by a cognitive pattern recognition system [20], which picked up real-time information about road-traffic events prior to any mainstream reporting channels. Ji et al. [21] presented an application of Twitter sentiment analysis to track disease outbreak paths and concern level trends, following the locations and sentiments about swine flu, measles, listeria, and tuberculosis cases.
2.2. Perception Studies on COVID-19 on Social Media
Few sources and reports are available concerning temporal trends and geographic distribution of citizens’ concerns about COVID-19 [22]. The State of Colorado allows citizens to report health concerns on a state website [23]. The focus of these concerns appears to be on health hazards caused by oil and gas exploration. Between the fall of 2015 and the fall of 2016, only 111 citizens reported concerns to the relevant state office. Few trends can be derived from such small numbers.
Survey-based research is also naturally limited in data points and delayed in availability. Furthermore, the focus of such research might be different even when COVID-19 is a topic. For example, Kravitz-Wirtz et al. [24] used a survey that was completed by 2870 participants to gauge the depth of concern about the secondary effects of COVID-19 relating to firearm violence. While our research analyzes public reactions towards government policies, their interest is in determining the degree to which citizens are worried about bodily harm perpetrated by other citizens in the form of home invasions, robberies, etc., indirectly caused by COVID-19.
Another small study [25] based on a survey with 538 inputs in the Philippines tried to determine the level of panic, health anxiety, and related feelings experienced by citizens. The study found a geographic difference, namely a “difference in the avoidance behavior between residents inside Metro Manila and outside Metro Manila”.
The Centers for Disease Control and Prevention (CDC) provided a COVID Data Tracker [26] as the primary source of information about cases, deaths, hospitalizations, and vaccinations, as well as state-issued prevention measures such as mask mandates, bar closures, restaurant closures, stay-at-home orders, etc. These state-level measures are counted and shown on a map. This is similar to our policy awareness component. However, the concern levels or reactions by the public to these measures are not tracked in their work.
Mittal et al. [27] used a lexicon-based sentiment analysis tool [28] on the collected Twitter data regarding COVID-19. Their work identified a significant and positive connection between global infections/deaths and negative tweets and between global recoveries and negative/positive tweets. Hung et al. [29] also applied a lexicon-based sentiment analysis tool to investigate the sentiments of tweets regarding COVID-19. Their work included using a bag-of-word representation to identify the topic discussions in the tweets during a one-month period. Their study found five COVID-19-related topics, and they identified the U.S. states expressing the most negative sentiments and the most positive sentiments. In our work, we utilize a fine-tuned sentiment analysis tool that considers both the meaning of each word and the structure of the input phrases. Our work involves ten COVID-19 related policies during a ten-month period.
Yadav and Vishwakarma [30] proposed a deep-learning model to extract three different categories of sentiments. Their work provides feedback to government and health officials to help deal with future outbreaks. In the work of Yu et al. [31], they presented an interactive visual analytic system for reflecting and analyzing public sentiment and detecting sentiment fluctuation triggers on social media. Their system adopted a lexicon-based sentiment analysis tool to uncover public opinion about COVID-19 events. Basiri et al. [32] found that the coronavirus attracted the attention of people from different countries at different times with varying intensities. The sentiments in their tweets were correlated with the news and events that occurred in their countries, including the numbers of new infections, recoveries, and deaths. They also showed that different social media platforms have a great impact on evoking citizens’ awareness regarding the importance of this pandemic. By extracting around 12,741 tweets with the keyword “Indialockdown” from 5 to 17 April 2020 and by applying two lexicon-based sentiment analysis tools, Gupta et al. [33] showed that a majority of Indian citizens supported the decision to impose a lockdown implemented by the Indian government.
During the early stages of the outbreak of this pandemic, Naseem et al. [34] annotated their 90,000 collected tweets with three categories, negative, neutral, and positive. They reported several critical findings. For example, they discovered that citizens favored a lockdown earlier in the pandemic. However, sentiment shifted by mid-March. Their study showed that there is a need to develop a proactive approach to fight against the spread of negative sentiments on social media platforms during any pandemic.
Chen et al. [35] described a multilingual COVID-19 dataset for studying online conversation dynamics. For example, the policy of social distancing has caused changes to public access to physical/social environments for gaining information and updates. Lopez et al. [36] collected daily tweets about COVID-19 in multiple languages to explore the citizens’ perceptions regarding the pandemic. The study was aimed at identifying public sentiments towards the pandemic and how the responses varied over time, by countries, and by language. However, the published datasets include the analyzed sentiments or Named Entity data, not the raw tweet text data or social features, such as retweets. Thus, it is hard to verify the sentiment analysis results. In addition, claims about policy perceptions are not presented in the paper.
Prominent politicians’ emotions expressed on social media were also analyzed during this period. Yaqub [37] performed a sentiment analysis of tweets by President Trump during the early spread of the COVID-19 pandemic. The work identified a negative correlation between the sentiments expressed by Trump’s posts and the infection cases in the US. A transition from positive to negative sentiments in his posts about China and the coronavirus was discovered as well.
The National Institutes of Health (NIH) provide open-access data and computational resources to address COVID-19 [38], with available datasets from the US CDC [26], JHU [5], and the European CDC [39]. These data sources present daily numbers of newly reported COVID-19 cases and deaths worldwide. However, the daily updates provided in [39] were discontinued on 17 December 2020.
Most of these reviewed studies were conducted based on static datasets and either provide the situation awareness of the disease status, such as cases of infections, death counts, and vaccination rates, or they provide sentiments (negative or positive tweet counts) toward particular measures such as lockdown policies [33] or prevention measures, as with the CDC data [26]. A few studies reported large-scale data collections [36], but the analyses were rudimentary in showing the sentiment counts of different tweets by region and by language.
3. Public Health Policy Monitoring
In this Section, we present the Public Health Policy Perception Monitoring component as well as experimental results. This section is organized as follows. In Section 3.1, we introduce the source and collection of the dataset. We present three sentiment analysis tools and justify our choice of one of them based on human evaluation in Section 3.2. In Section 3.3, we discuss the formula to compute Concern Levels. We present the visualization of concern level trends for each policy in Section 3.4. In Section 3.5, we analyze the changes in concern levels over time and identify the significance of these changes. We then investigate the relationship between concern levels and pandemic progress during our study period in Section 3.6. In Section 3.7, we visualize the monthly concern levels for each policy in each US state and present the information in geographical maps.
3.1. Datasets
The data used in the paper has been collected from Twitter. We were interested in the COVID-19 related health policies as well as other relevant protocols. We search tweets related to COVID- policies. Table 1 shows the policy types, the keywords used, and the total tweet counts for each policy. Between August 2020 and March 2021, 16,680,266 tweets were collected. We performed tweet searches by using the official Twitter search API [40] using these keywords. We collected only English tweets from the US by restricting the search by setting the parameters “lang: en” and “place_country: US” to focus on the public health policies in the US. While we understand that COVID-19 is a global concern, policy decisions are local. Therefore, our methodology and analyses are designed to encompass a locality useful for a set of policy makers and the relevant public. However, the framework can be extended to any region or any language. We present tweet samples for each policy in Table A1 in Appendix A.

Table 1.
Policy Names, Search Terms, and Tweet Counts (The counts are based on data collected between August 2020 and March 2021).
For continuous monitoring, we used a Python script to perform data collection once per minute. The results are appended to a file for each search category, and the files are saved in a directory organized by search date. At the end of each day, the daily datasets are analyzed with sentiment classification software to automatically label each tweet with a sentiment category (positive, negative, or neutral). The results are stored in a relational database for further analysis and visualization. This paper is based on data collected from August 2020 to May 2021. However, data collection has been continuous beyond the study period and ongoing. We provide a link to a dataset of tweets (with sentiment annotation) for the time period covered by this paper, http://ai4sg.njit.edu/data/ai4sg_raw_data.csv (accessed on 25 October 2022)
3.2. Sentiment Analysis for Public Concern Levels
In order to track public perceptions towards government health policies during the pandemic, we applied a sentiment analysis tool to each tweet. A number of sentiment analysis tools are described in the literature. We considered the VADER [28], Stanford Sentiment Analyzer [41], and TextBlob [42]. In order to decide which sentiment analysis tool to use, we performed three initial experiments. First, we conducted a human evaluation of a sample of 100 randomly collected tweets regarding COVID-19 [43]. Three research group members participated in this evaluation. Every member worked independently to label each tweet either with 0 as “Negative”, 2 as “Neutral”, or 4 as “Positive” sentiment. We computed a combined result of the human labelers by a majority vote.
Second, in order to identify the degree of agreement among the three sets of human-labeled sentiments, we computed the Inter-rater reliability based on Krippendorff’s alpha [44]. We compared the sentiments of the combined human result with those generated by the Stanford Sentiment Analyzer, VADER, and TextBlob. Among the 100 tweets, 91 agreed with a human majority vote, while there was no agreement for the remaining 9. Among the 91 tweets, there were 51 for which TextBlob and the combined human results agreed on the same sentiments, 58 for VADER, and 43 for the Stanford Sentiment Analyzer. Therefore, the accuracy of our human evaluation for TextBlob is 56% (51/91), for VADER, it is 63.7% (58/91), and for the Stanford Sentiment Analyzer, it is 47.2% (43/91). We utilized an online calculator [45] to obtain the value of alpha, which was computed as 0.485. Third, according to [46], data with an alpha < 0.667 should be discarded, which meant it did not matter which tool we selected. Based on the prior studies, the Stanford Sentiment Analyzer has the best accuracy among the three, with 80.7% [41], while VADER has an accuracy of 76.8%, and TextBlob has 68.8% accuracy [47]. Thus, we chose the Stanford Sentiment Analyzer.
The Stanford Sentiment Analyzer uses a fine-grained analysis based on both words and labeled phrasal parse trees to train a Recursive Neural Tensor Network (RNTN) model. The approach of RNTN is shown in Figure 1. In order to derive the sentiment (p2) of a phrase, the RNTN uses a compositionality function g(.) to compute parent node vectors from child node vectors (Figure 1). To compute the sentiment (p1) of the sub-phrase, it uses the function g(.) with the sentiments of its children b and c. For each node (a, b, and c), the analyzer uses varied features for classifying its sentiment. Therefore, the sentiment computed by the RNTN model is based on (1) the sentiment values of each word and (2) the sentiment of the parse-tree structure composed from the sentiment values of words and sub-phrases. Furthermore, these characteristics enable the model to capture some sophisticated features, such as sarcasm and negation expressed by input phrases.
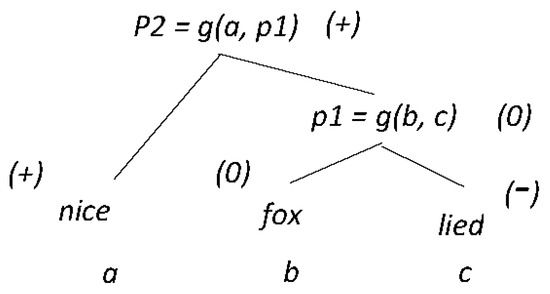
Figure 1.
Approach of Recursive Neural Network Model, based on [41], predicting the sentiment classes of “Negative” (−), “Neutral” (0), and “Positive” (+). Sentiment classes in the figure are examples, not actual computed output.
Each input phrase is classified as belonging to one of five sentiment classes: “Very Negative”, “Negative”, “Neutral”, “Positive”, or “Very Positive”. Table 2 shows examples of sentiments of the dataset tweets classified by the Stanford Sentiment Analyzer. For our study, we used only three sentiment classes. A positive sentiment was assigned to a tweet if it was classified as positive or very positive by the Stanford Sentiment Analyzer. Similarly, a tweet was assigned a negative sentiment when it was classified as either negative or very negative. The neutral sentiment of a tweet remained neutral.
Table 2.
Examples of sentiment analysis on collected tweets.
3.3. Concern Level Analysis
In order to monitor and track citizens’ concerns about government policies, we performed a “concern level” analysis. The formula for computing the concern level was defined by Ji et al. [21].
Definition 1.
Concern Level is an index of negative sentiments over emotional sentiments expressed in a set of social posts.
We analyzed the concern levels for different government policies to understand citizens’ reactions to official policies, actions, and measures. We annotated the policy-related tweets with sentiment labels and calculated the concern levels.
To analyze citizens’ concern levels by US State, it is important to have accurate and standardized information about the tweet author’s geographic location. Unfortunately, among the raw tweets that we collected, only approximately 7% contained usable location information, including the tweet author’s US State. Part of the tweet processing pipeline, besides sentiment annotation, uses other tweet metadata to attempt to properly associate the tweet with a US State. Tweet attributes such as “city”, “location”, “state_name”, and “state_id” were examined and mapped to standardized state ids whenever possible. With this additional processing, the percentage of tweets with usable state locations increased from 7% to approximately 21%. With the US State information in the tweets, we were able to build a “concern map” and observe the concern levels by state. Due to the low percentage of tweets that could be tagged with location information, we summarized the concern level by month for each state instead of by day.
3.4. Monitoring Levels of Concern
We tracked the daily concern levels about different COVID-19 related government policies. Figure 2 shows the concern level trend for each policy between August 2020 and March 2021. According to the trends, we report the following findings. The concern levels toward each policy are tracked on a daily basis and are visualized on our platform site (http://ai4sg.njit.edu/ai4sg/SentimentByPolicy, accessed 25 October 2022).
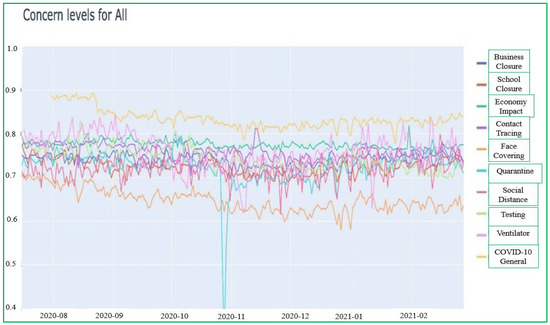
Figure 2.
Concern Level Trends of All Policies.
We observed that the concern level about “COVID-19 (General)” is higher than it is for individual policies. On the other hand, the concern level for “Face Coverings” has stayed relatively low throughout the period. Meanwhile, the concern level trend of “Economic Impact” stayed quite stable but was relatively higher than the concern levels for other individual policies throughout the period. The drop in the concern level about Quarantine at the end of October was due to a data collection issue during that time.
In Table 3, we demonstrate the mean concern level for each policy between August 2020 and May 2021, in descending order. Besides “COVID-19 (General)”, “Ventilators”, “Economic Impact”, and “Contact Tracing” show the highest mean concern levels over time. On the other hand, the mean concern level of “Face Coverings” was the lowest among all and was the only one under 0.7.
Table 3.
Average Concern Levels from August 2020 to May 2021.
3.5. Concern Level Trend Analysis
We examined the concern levels over time by computing summary statistics, namely mean and standard deviation for concern levels for each policy. In addition, we compared the mean concern levels for the first week of the time frame with the mean concern level for the last week of the time frame. The statistics are demonstrated in Table 4.
Table 4.
Statistical Significance Tests.
Our examination showed statistically significant changes in concern levels over time for most of the policies, except on the business closing and social distancing policies. We considered concern levels from 27 July 2020 to 23 May 2021 for this computation. We calculated a Z-score using the formula in Definition 2:
Definition 2.
Z-score calculation.
NS = Negative Tweets, Start Week
TS = Total Tweets, Start Week
NE = Negative Tweets, End Week
TE = Total Tweets, End Week
We then did a lookup of a two-tailed p-value from the Z-score and considered a p-value less than 0.05 to indicate statistical significance. Except for Business Closing, all the policies experienced significant changes in concern levels as shown in Table 4: Economic Impact (−1.21%, from 0.7766 to 0.7672), Contact Tracing (1.81%, from 0.7753 to 0.7893), COVID-19 (General) (−2.21%, from 0.8815 to 0.8620), Face Coverings (−8.33%, from 0.6923 to 0.6346), Quarantine (−3.84%, from 0.7469 to 0.7182), School Closing (−3.02%, from 0.7493 to 0.7267), Social Distancing (3.56%, from 0.7172 to 0.7427), Testing (−6.03%, from 0.7664 to 0.7202) and Ventilators (12.02%, from 0.7811 to 0.875).
3.6. Relationship between Pandemic Progress and Concern Levels
An important objective in our research was to understand the relationship between the progress of the pandemic, i.e., daily, and cumulative confirmed cases as well as deaths, and the levels of citizen concerns about the various defined policies. How did the hard data of the pandemic affect the measured levels of concern, if at all?
To answer this question, we computed correlation coefficients between confirmed cases, deaths, and concern levels for each of the policies. Correlations were computed using the raw daily concern values, weekly mean concern values and monthly mean concern values. In Table 5, we demonstrate correlations of daily infections and deaths for each policy with concern levels. We computed the p-values for the correlations using an online calculator [48] for the two-tailed p-value for 243 days (August 2020–March 2021) of data.
Table 5.
Correlation Coefficients for Daily Confirmed Cases and Daily Deaths with Concern Levels about each Policy between August 2020 and March 2021. We marked all the non-significant p values in italics, using a cut-off value of p = 0.05.
We note that only three correlations are positive. Namely, an increase in daily deaths led to an increase of concern about Quarantine, School Closing, and Social Distancing. However, these three correlations are statistically not significant. Among the seventeen negative correlations, three are not significant, while the other fourteen are significant. It is counterintuitive that (for example) an increase in daily confirmed cases would lead to a decrease of concern about Economic Impact (with r = −0.252). This is a surprising result. The p-values of 0.0 that the calculator returned for six correlations indicate that the input values resulted in an out of bounds output value. For example, for “COVID-19 (General)” the p-value is 0.0, unless we reduce the sample size to 114 (days) where p = 0.00000001.
In addition, we plotted concern levels for each policy, and normalized values of COVID-19 cases and confirmed deaths over time. Figure 3 shows the trend visualization. There was little fluctuation of the concern level trend of COVID-19 (General) (shown as a blue line), while the normalized infections (orange line) and deaths (green line) fluctuated drastically between November 2020 and March 2021. Based on this information, we were not able to identify any meaningful correlation between the progress of the pandemic and the levels of citizen concern. We track and update the COVID-19 progress on a daily basis on our website (http://ai4sg.njit.edu/ai4sg/Covid, accessed 26 October 2022).
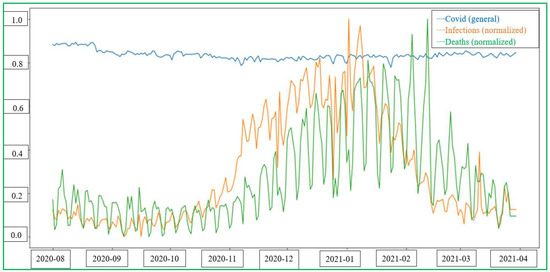
Figure 3.
Comparison of the progress of the pandemic and the levels of citizen concerns. Blue: COVID-19 (General) Concern Level; Orange: Infections (normalized); Green: Deaths (normalized).
3.7. Public Concern Map by Policy
Over the whole period of data collection, we observed that states with large populations tended to fluctuate to a smaller degree than states with small populations. For example, in Wyoming, which has a population of 578,759, the concern levels between August 2020 and May 2021 varied widely: 0.91, 0.80, 0.82, 0.88, 0.83, 0.76, 0.97, 0.87, 0.76, and 0.93. However, these values were computed from small numbers of tweets. For example, the concern level of 0.93 for May 2021 is based on only 25 negative tweets. In comparison, for the same month, the concern level of California, which has 39.5 million residents, was 0.83, but it was based on 3963 negative tweets. Texas, which has 29.2 million people, had a comparable concern level to California of 0.84, based on 3712 negative tweets. The concern level of 0.97 in Wyoming, which was recorded in February 2021, is the highest observed in any state and any category. The lowest concern level was recorded in Minnesota as 0.68 for March 2021. Even though Minnesota, which has 5.7 million residents, is ten times more populous than Wyoming, this result was based on only 69 negative tweets. All these numbers are for “COVID-19 (General)”. For individual policies, values are notably lower.
For concerns about masks (“Face Coverings”), Idaho and New Hampshire were at the low end of the spectrum in May 2021, at 0.57 and 0.43, respectively. However, the state of Wyoming, which is a neighboring state of Idaho, had a concern level at the high end of its range, with a value of 0.86, based on 18 negative tweets. With the stored data, a concern map can be computed for each policy for each month. The concern map shown in Figure 4 illustrates the concern levels of each state regarding “Face Coverings” in May 2021.
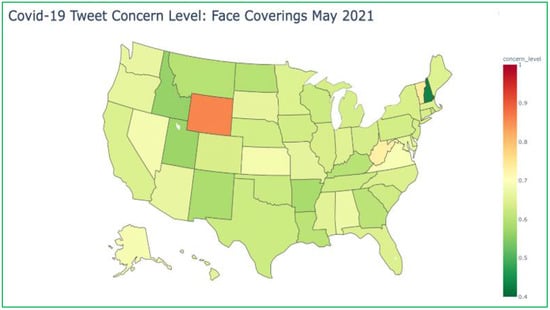
Figure 4.
Concern Levels by State for Face Coverings in May 2021.
For Economic Impact in April 2021, Mississippi had the countrywide highest concern level of 0.85 but based on only 118 negative tweets. South Dakota and North Dakota had the lowest concern levels about the economy at 0.65 and 0.70, respectively. We could not discern any obvious regional patterns.
We expected that concern maps for “Economic Impact” would have clearly differentiated red (Republican) and blue (Democrat) states. Given the instability of values for small states, we chose California as a representative of the blue states and Texas as the prototypical red state. We then compared concern levels for all ten months. However, the results contradicted our expectations. First, we noticed that values were relatively stable throughout the period. In California, the values varied from 0.75 to 0.79. For Texas, the values were between 0.76 and 0.79. Furthermore, the absolute value of the difference in each month between the two states was never larger than 0.02.
One of our expectations was narrowly fulfilled. We hypothesized that “high-tech states” produce more tweet activity than rural states. We summed the total number of tweets in each of the ten largest states by population and set them in relation to the number of citizens, shown in Table 6. New York and California, the home states of many computing startups, lead the pack at 19% and 14%, respectively. The other large states vary between 9% and 13%, with Texas, Illinois, and Pennsylvania coming close to California.
Table 6.
Tweet Activity.
4. Public Health Policy Awareness
During the pandemic, many different types of government policies and measures were issued. Having an awareness of the rapidly changing government actions and policies during a public health crisis such as the COVID-19 pandemic may provide critical and useful information, at the right time, to citizens and businesses in terms of their obligations and their rights. There are websites, such as the IMF policy tracker [49], that follow economic policies by different country governments to limit the human and economic impact of the COVID-19 pandemic. This is a global country-wide policy tracker where all policies are listed as text. The municipal city government responses to COVID-19 have been shared through the NLC (National League of Cities) Local Action Tracker [50], which allows different city responses to be searched for and browsed. These tools provide the information needed for global and local leaders to manage the many pandemic-related issues. But textual legal policies are difficult to comprehend, and the comparative policy analysis across different cities or states is challenging.
To enhance public health policy awareness, we used the dataset of 5295 pandemic-related policies or local actions in 23 distinct policy areas collected from the National League of Cities (NLC) and Bloomberg Philanthropies [50]. The policy analysis in Figure 5 shows the distribution of different types of policies. Policies for Prevention/Flattening the Curve comprise the highest total policy count of 947. These include face covering, quarantine/self-isolation, social distancing, COVID-19 testing, ventilators, etc. The second-highest policy type is Government Operations, with a total count of 631, including policies related to emergency services operations, first responders, and frontline medical workers across the country, who continue to provide essential services combating the pandemic. The Housing policy category, with a total count of 521, was the third policy, and so on.
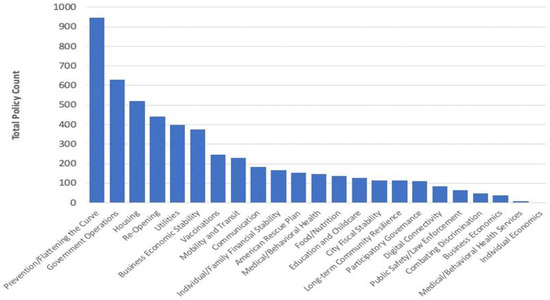
Figure 5.
Number of Public Health Policies by type during the COVID-19 Pandemic.
4.1. Policy Mapping and Filtering
The policy tracking map implemented in [50] helps to browse local actions taken by cities around the country to respond to the pandemic. We have developed a prototype spatial browsing tool for policies in which the policies can be filtered by policy area, state, city, and action date, as shown in Figure 6 and Figure 7. For example, the map in Figure 6 shows the housing policy counts that were issued by each state, while the map in Figure 7 shows the transportation/mobility-related policies by state. The two maps show that the transit and mobility policies are more prominent in NY (25 counts) compared to the housing policies (8 counts), while in California, there are more housing policies (128) than transit/mobility-related policies (38). The filtering by policy types shows the different policy emphases in different states to address local needs. The prototype spatial browsing tool we have developed is available at the platform site (http://ai4sg.njit.edu/ai4sg/PolicyMaps, accessed 28 October 2022).
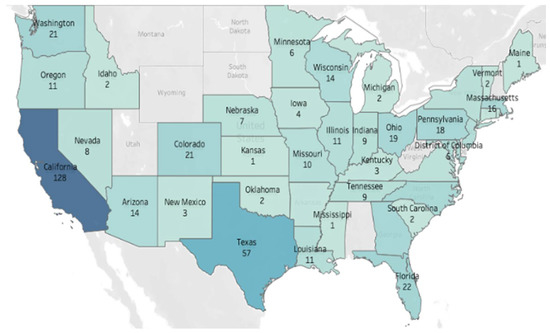
Figure 6.
Housing Policy counts by State.
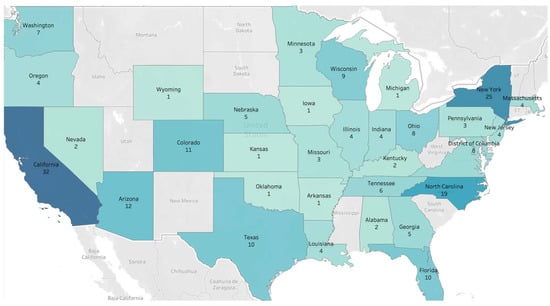
Figure 7.
Transit/Mobility Policy counts by State.
4.2. Policy Summarization Tool
Pandemic policies pose many challenges to the reader. As demonstrated in the previous Section, there are many policies, and they are often expressed as long documents of legal text. To make it easier for the casual user to navigate this environment, we did a preliminary analysis of the usability of text summarization tools for health policies. To determine the most appropriate method to use, we conducted experiments with several existing pretrained text-summarization machine learning models. Specifically, we tested Bart using Pytorch [51], T5 using TensorFlow [52], Gensim with TextRank [53], and GPT-2 Transformers [54]. The result of our test runs on several text samples taken from the policy database were compared by members of our research group, and the agreement was that Bart and T5 summarization models produced the best summarization outcomes. Furthermore, based on our human evaluation, we did not discern a significant difference in the summarization quality between Bart using Pytorch and T5 using TensorFlow. Thus, we randomly chose to work with Bart to summarize the policy descriptions.
The summarization with Bart resulted in a compression rate of 0.6295. The compression rate was calculated as the total number of words of the summarized text divided by the total number of words of the original text. A compression rate equal to 0.6295 means there was an average 37.04% reduction of the original text size. Table 7 shows five examples of the summarization of policies by Bart and T5. These summaries are not intended for lawyers, who often need to argue about a single word in a legal text, but for quickly navigating an overwhelmingly complex patchwork of different government regulations.
Table 7.
Policy Summarization Results with Original Policy Description.
5. Discussion
Based on the results derived from our experiments on public health policy concern tracking between August 2020 and March 2021, we have discovered several findings, which include:
- (1)
- The levels of citizens’ concerns about the disease itself appear higher than the levels of concern about individual policies throughout the period of investigation. As shown in Figure 2, among all the policies, “Ventilators” engendered the highest concern level at 0.77, except for COVID-19 (General) at 0.84. The concern level about Ventilators was relatively high in two periods throughout the time of the study. One was between August and September 2020, when the COVID death cases were on the rise. The second peak was in January 2021, after the holiday season was over, with surging infections and deaths. The Face Coverings policy was associated with a concern level of 0.64. Its concern levels were the lowest and the only one under 0.7 throughout the period, despite the mask shortage in the early stages of the pandemic [55]. This result implies that citizens might not have cared much about wearing masks. Besides, the concern level trend of Economic Impact remained fairly stable but relatively higher among all individual policies. Many industries were impacted during this period. Especially the recreational sector registered high job losses [56], as citizens would reduce the frequency of traveling or going out to avoid becoming infected.
- (2)
- By comparing the concern levels in the first week with those in the last week of our date range, we found that the concern levels about policies concerning Economic Impact, COVID-19 (General), Face Coverings, Quarantine, School Closing, and Testing exhibited negative changes, while Business Closing, Contact Tracing, Social Distancing, and Ventilators showed positive changes. Except for Business Closing, these changes are all statistically significant. This finding implied that citizens might have adapted to a new normal, even with rising case numbers [57] amid the pandemic.
- (3)
- While the trend of case numbers of infections and deaths showed notable fluctuations, the concern level of COVID-19 (General) stayed relatively constant throughout the study period. In other words, no meaningful correlation between the progress of the pandemic and the levels of citizens’ concern was identified.
- (4)
- We expected to see a geographic distribution of concerns that reflects the political divide of the country. However, we were not able to confirm this.
The characteristic of capturing sophisticated features made the Stanford Sentiment Analyzer a strong candidate for our sentiment analysis. However, no analysis tool is perfect. A limitation of the Stanford Sentiment Analyzer is that it lacks multipolarity analysis. An input phrase might express multiple polarities based on different aspects mentioned in a post. If we obtain only one composed result of several expressed sentiments, this could be misleading. For example, the phrase “This restaurant provides excellent food but poor service” expresses a positive sentiment about the food but a negative sentiment about the service. Currently, we are working on a novel sentiment analysis algorithm that reports multiple polarities when an input phrase discusses multiple aspects with different sentiments.
Our proposed Public Health Policy Perception Monitoring and Awareness Platform overcomes challenges in prior works and extends our preliminary study [58] with capabilities of continuous monitoring of citizen perceptions of health policies to serve as an indirect indicator of measuring the impact and potential acceptance or resistance of health-related policies. Table 8 shows improvements carried out in our work.
Table 8.
Our improvements to prior limitations.
Besides this, we have also achieved several novel breakthroughs in our work. The generated results from the continuous monitoring data and analyses can help governments and citizens get insights to adapt to a “new normal” in a post-pandemic era. The correlation between policy concern levels and pandemic progress statistics helps citizens to understand if or how life is impacted. Our system allows us to quickly retrieve and access the results for a desired period. For example, one can examine the previous holiday seasons’ results to better prepare for the upcoming holiday seasons. It is possible to quickly extend our work when a new relevant government policy is issued. Users of our system can rapidly react and apply our work to novel pandemics or similar urgent situations occurring in the future.
Our study also has some limitations. First, the datasets are collected with static policy sets. If a new public health issue emerges, the system needs the ability to dynamically choose the policies for which tweets are collected (e.g., add a new user-selected policy) to monitor it. Second, the collected data is limited to the US. Third, the concern levels depend on the sentiment analysis results, which are not perfect. We used the Stanford Sentiment Analyzer, which has the highest accuracy among alternative tools but with lower human agreement scores compared with other approaches. Thus, there is a great deal of uncertainty in the sentiment associated with the tweets. Any system that relies on the currently available sentiment analysis tools would be subject to this kind of uncertainty due to the technical limitations and human subject variabilities.
An important theoretical implication of this research is that refined measures for concern levels could be introduced, e.g., weighted and/or relative measures, as was hinted at in Section 3.3. Such an analysis goes beyond the scope of this paper. The most important practical implication is that near-real-time monitoring and processing of reactions to policies is possible and provides a powerful capability that goes beyond what is publicly available at the current time.
6. Conclusions
In this work, we have developed a Public Health Policy Perception Monitoring and Awareness Platform that tracks citizens’ concern level trends about ten different public health policies during the COVID-19 pandemic. Our tools can also enhance the public understanding of government health policies.
The concern level tracking revealed that “COVID-19 (General)” and “Ventilators” engendered the highest concern levels, while the “Face Coverings” policy caused the lowest concern levels during the data collection period. This answers the first research question we raised in the Introduction.
Between the first week and the last week of our data period, the concern levels about “Economic Impact”, “COVID-19 (General)”, “Face Coverings”, “Quarantine”, “School Closing”, and “Testing” demonstrated negative changes, while “Business Closing”, “Contact Tracing”, “Social Distancing”, and “Ventilators” had positive changes. Moreover, all changes except for “Business Closing” were significant. This addresses the second research question raised in the Introduction.
Throughout the study period, the concern level of “COVID-19 (General)” stayed relatively stable, even though the trends of both infections and deaths were notably fluctuating. Therefore, no meaningful correlation between the pandemic progress and the concern levels could be identified. This provides an answer to our third research question.
We expected to see a clear difference in concern levels regarding the economy that would reflect the political divide between politically red (Republican) and blue (Democrat) states. However, our experiments showed no evidence supporting this hypothesis. This provides some insights about our fourth question.
We reviewed publicly available policies and local actions in 23 distinct policy areas, including 5295 pandemic-related policies [50]. Policies for Prevention/Flattening the Curve occurred most often (947), including rules for face covering, quarantine/self-isolation, social distancing, COVID-19 testing, ventilators, etc. The second most frequent policies dealt with Government Operations, totaling 631, including policies related to emergency services operations, first responders, and frontline medical workers across the country. The Housing policy category, with a total count of 521, ranked third. This provides answers to our fifth research question.
The policy awareness tool, however, demonstrated regional differences for the analyzed policies, such as housing-focused policies in California compared to transit/mobility-focused policies in New York. This constitutes an example answer for our sixth research question.
The summary of the housing policies in Table 7 shows that the California government is providing more funds to help local people, such as tenants, the homeless, etc., to ameliorate the impact of the pandemic. The assistance from the government includes rental reimbursement, extended eviction protection, and accommodations for the homeless. This limited answer to our seventh research question should be extended in the future.
Our reported results are based on a specific period and concentrate on concern levels and government policies. However, the continuous monitoring capabilities of our system can be used to observe temporal trends and geographic distributions in policy perception. Thus, our proposed platform can provide public perceptions as a near real-time feedback mechanism for policymakers and evaluators to appraise each health policy.
7. Future Work
A limitation in the presented work is an analysis of concern levels about COVID vaccines. At the beginning of this study, vaccines did not yet exist. With the wide availability of Pfizer, Moderna, etc. vaccines, the new phenomenon of “political” and personal resistance to vaccine policies has arisen. Thus, unexpected to us, vaccines were not universally welcomed by the population. A simple recording of concern levels about vaccines does not distinguish between citizens concerned about getting access to the shots versus citizens concerned about the negative effects of the vaccines. We plan to perform a more fine-grained analysis of the available social network data about vaccines.
We were surprised to see that steep rises in infections and deaths had no discernable effect on the concern levels to different policies expressed by Twitter-active netizens. This phenomenon could be a topic of an in-depth future investigation and will require the addition of a sociologist to the team. It would also be interesting to see in the future whether other “sudden, unpredictable events” (what Nassim Taleb has called “Black Swan Events”) [59] will also have no measurable effects on the concern levels of Twitter users. For example, did an overnight spike in oil prices (caused by the Ukraine conflict) cause more concerns than a spike in COVID-19 deaths? There are several ways the concepts embodied in this paper could be extended both in granularity and generality. Granularity could be increased by refining the location tagging of tweets, for example, to the county, city, or borough level. This would enable us to better identify concern levels before and after specific governmental actions at the corresponding geographical level, such as the imposition of a quarantine order in a specific area. The research could also be expanded to incorporate broader (e.g., international) geographic areas and languages.
As noted, the Stanford Sentiment Analyzer does not easily support the analysis of several aspects in the same tweet. We propose to perform a multipolarity analysis based on different aspects identified in the tweets. We plan to apply sentence tokenization and embedding to achieve sentence topic modeling. Thus, each policy could be further categorized. For example, “Vaccine Policy” could be categorized as “Pfizer”, “Moderna”, “J & J”, etc. By combining these refinements with the use of the Sentiment Analyzer, we would see how citizens react to the specific vaccines rather than the whole “Vaccine Policy”. In the work of Bonifazi et al. [60], they figured out that anti-vaxxers tend to have denser ego networks and are more cohesive than pro-vaxxers. This shows that anti-vaxxers have four times more interactions than pro-vaxxers. We propose to analyze and compare the networks among pro-vaxxers, especially when they have different vaccine preferences.
One of our goals in this work is to provide actionable data and real-time analysis results to policymakers. When concern levels in the population rise to high values, a policy change might be called for. However, as we pointed out, the concern levels in a small state are less alarming than those in one of the mega states, e.g., California, Texas, Florida, New York, Illinois, etc., because they are based on a few tweets. Thus, a new metric along the lines of a “concern impact level” that incorporates concern level and population size would be useful. We intend to investigate possible formulas for a concern impact level in future work.
Finally, the concepts in this paper could be applied to understand citizens’ concerns about entirely different public events and policy actions. Our concern level tracking system could be easily repurposed to analyze tweets for sentiments regarding other policies, e.g., immigration rules, tax cuts, congestion pricing in New York City, or funding for interplanetary space travel. The possibilities are as broad as the range of government actions and natural events causing them. We plan to expand this dynamic policy data collection capability by allowing users to select new policies to be tracked or by automatically identifying emerging policies to monitor. This will make the platform adjustable for future crisis events.
Author Contributions
Conceptualization, S.A.C. and J.G.; Data curation, C.-y.L., M.R. and F.Y.; Formal analysis, C.-y.L.; Investigation, C.-y.L., J.G. and S.A.C.; Methodology, C.-y.L. and S.A.C.; Software, M.R. and F.Y.; Supervision, J.G. and S.A.C.; Visualization, C.-y.L., M.R. and F.Y.; Writing—original draft, C.-y.L., M.R. and S.A.C.; Writing—review and editing, J.G. All authors have read and agreed to the published version of the manuscript.
Funding
Research reported in this publication was supported by the National Center for Advancing Translational Sciences (NCATS), a component of the National Institute of Health (NIH) under award number UL1TR003017. The content is solely the responsibility of the authors and does not necessarily represent the official views of the National Institutes of Health. This research was partially funded by the National Research Foundation of Korea (NRF-2017S1A3A2066084).
Acknowledgments
We thank Sasikala Vasudevan for her work on the policy maps.
Conflicts of Interest
We declare that the research was conducted in the absence of any commercial or financial relationships that could be construed as a potential conflict of interest.
Appendix A. Examples of COVID-19-Related Health Policies
Table A1.
Tweets examples for each policy.
Table A1.
Tweets examples for each policy.
| COVID-19 Health Policy | Example Tweets |
|---|---|
| COVID-19 (General) | Great example of ongoing medical education in the wake of restricted travel and meetings #COVID19 Thank you for sharing. We need more of the same! |
| Me too. I took it, along with the family. Personal choice for each of us. I get the apprehension. CDC doesnt make it any better. But my whole point was Dr are treating everything as COVID erroneously at the sake of misdiagnosing other things. | |
| We are getting ready to open on August 15! So “……” to give us a little more time the store will be closed this Friday and Saturday! We will post all the changes due to COVID ASAP. The apples are looking lovely. | |
| Face Coverings | We letting these beasts make masks mandatory. This is all about obedience, no fucking evidence supporting the effectiveness of masks against contracting COVID. Niggas is wearing tissue paper for face mask but as long as you a good sheep and comply it’s all good. |
| Wear a Mask! Californians must wear a face-covering in high-risk settings. | |
| Miss Princess! Customizable Face Masks with PM2.5 Activated Carbon Filters! | |
| Business Closing | Attached is an article that @TheSlideJob wrote about him (after the video) and what he did when our family business was shutdown from COVID-19. He will do almost anything to race! |
| Interesting that the president of the U.S. is hunkering in a bunker under the W.H. instead of addressing the nation? Tear gassing peaceful protestor’s yet, when your ppl protested the closing of business’s due to COVID. You allowed machine gun carrying nasty rude ppl to cont. on? | |
| Bull! Like Walmart isn’t our Myrtle beach. COVID mart has been open every since the virus started and they have curbside service. Beshear is scared of Walmart’s lawyers! While everyone that owns other business was made to shutdown! Typical democrat. | |
| School Closing | Day 1 of our COVID-19 school shutdown and there was abundant evidence of our @PosProject theme this week: #LoveofLearning Everyone worked so hard to make sure our wee Turtles have what they need to keep growing while they are away. |
| 15 yo grandson says COVID cases at school are up. School in Raytown may be closing soon. | |
| After more than week of classes, a Fort Bend ISD elementary school is closing its doors and shifting to online learning due to a significant” risk of COVID-19 on campus. | |
| Economic Impact | The reason the country went in the tank was the democrat leaders in their states locking everyone and thing down. That’s what killed our economy. There’s study after study that show lockdowns didn’t help with COVID |
| We might retest COVID lows. Anything can happen. Still a lot of stubborn inflation and a horrible economy is not priced in. We bottom when Bored Ape is a zero, GME is at 15, and BTC trades at 3000. | |
| People can make money when the virus is under control. Imagine that. With COVID-19 Under Control, China’s Economy Surges Ahead. | |
| Quarantine | Iran becomes the first country to report a second wave of coronavirus infections as cases hit a record high after easing lockdown and has so far reported 164,270 cases and 8071 deaths. |
| The World Health Organization has announced that dogs cannot contract COVID-19. Dogs previously held in quarantine can now be released. To be clear, WHO let the dogs out. | |
| Crazy how essential workers never got any hazard pay for going to work during quarantine especially after I got sick twice with COVID. First time I was out for a month and second time I was out for 2 months. What happened to that $25,000 heroes pay? It was let go. | |
| Contact Tracing | Contact tracing shows high risk for coronavirus spread in churches |
| WHO urged countries to continue to test, isolate, and treat COVID pts. Contact-tracing & quarantining to help reduce transmission. face masks, physical distance in public, handwashing. These measures can flatten the curve without lockdowns, regardless of drugs. | |
| I just completed a free certificate on COVID-19 Contact Tracing—you can too. If you are still looking for a summer job, this could be worth 5 h of your time. | |
| Testing | Getting the vaccine does NOT prevent a positive COVID test. It’s like the flu shot. You can still get the flu. You can still get COVID but the symptoms and fighting it isn’t severe |
| Negative COVID test. I got the results today but I had an ER visit yesterday morning for asthma like symptoms. Doing much better but I never had asthma before so it was a bit scary. | |
| In need of a #COVID19 test? Come to McDonough Middle School. If you’re in need of a ride call 860.550.7540 | |
| Ventilators | After more than 3 weeks on a ventilator while fighting COVID-19, this man says convalescent plasma saved his life. |
| Corpus people really out here thinking COVID-19 is a hoax. I’ve seen multiple people say let’s just get it so we can get it over with. If they tell me I have it I’m not gonna believe them & continue about my life. You all are a bunch of fools. Have fun with that ventilator sis. | |
| Just found out my cousin has Covid and is on a ventilator. Please send positive vibes. | |
| Social Distancing | It took a little work, but we have the pets practicing Social Distancing |
| As if social distancing, working from home & home school don’t already mess up your sense of days- this reminded me of when I woke up for school on the wkends … need 2 stay on top of this calendar & make sure dates/days match to avoid confusion | |
| Practicing social distancing. Even us newsies are doing it with ya. |
References
- The World Health Organization (WHO). Characterizes COVID-19 as a Pandemic. 2020. Available online: https://www.who.int/emergencies/diseases/novel-coronavirus-2019/events-as-they-happen (accessed on 3 January 2022).
- Agence France-Presse. China Locks down City of 9 Million and Reports 4,000 Cases as Omicron Tests Zero-Covid Strategy. The Guardian, 2022. Available online: https://www.theguardian.com/world/2022/mar/22/china-locks-down-city-of-9-million-and-reports-4000-cases-as-omicron-tests-zero-covid-strategy (accessed on 30 March 2022).
- Tsui, K. Shanghai Ikea Lockdown Sparks Scramble as China Enforces ‘Zero COVID’. Washington Post, 2022. Available online: https://www.washingtonpost.com/world/2022/08/15/shanghai-ikea-lockdown-china-zero-covid/ (accessed on 20 August 2022).
- Coen, D.; Kreienkamp, J.; Tokhi, A.; Pegram, T. Making global public policy work: A survey of international organization effectiveness. Glob. Policy 2022, 13, 1–13. [Google Scholar] [CrossRef]
- COVID-19 Dashboard by the Center for Systems Science and Engineering (CSSE) at Johns Hopkins University (JHU). Available online: https://coronavirus.jhu.edu/map.html (accessed on 8 March 2021).
- Coronavirus in the U.S.: Latest Map and Case Count. Available online: https://www.nytimes.com/interactive/2020/us/coronavirus-us-cases.html?action=click&module=Spotlight&pgtype=Homepage (accessed on 8 March 2021).
- New Jersey COVID-19 Information Hub. Available online: https://covid19.nj.gov/index.html (accessed on 8 March 2021).
- Sayce, D. The Number of Tweets per Day in 2020. 2020. Available online: https://www.dsayce.com/social-media/tweets-day/ (accessed on 15 December 2021).
- Stoy, L. Sentiment Analysis: A Deep Dive Into The Theory, Methods, and Applications. 2021. Available online: https://lazarinastoy.com/sentiment-analysis-theory-methods-applications/ (accessed on 2 February 2022).
- Asur, S.; Huberman, B. Predicting the Future with Social Media. In Proceedings of the 2010 IEEE/WIC/ACM International Conference on Web Intelligence and Intelligent Agent Technology, Toronto, ON, Canada, 31 August–3 September 2010; pp. 492–499. [Google Scholar] [CrossRef]
- Moschitti, A. Efficient Convolution Kernels for Dependency and Constituent Syntactic Trees. In Machine Learning: ECML 2006; Lecture Notes in Computer Science; Fürnkranz, J., Scheffer, T., Spiliopoulou, M., Eds.; Springer: Berlin/Heidelberg, Germany, 2006; Volume 4212. [Google Scholar] [CrossRef]
- Tang, D.; Wei, F.; Yang, N.; Zhou, M.; Liu, T.; Qin, B. Learning Sentiment-Specific Word Embedding for Twitter Sentiment Classification. In Proceedings of the 52nd Annual Meeting of the Association for Computational Linguistics (Volume 1: Long Papers), Baltimore, MD, USA, 22–27 June 2014; pp. 1555–1565. [Google Scholar] [CrossRef]
- Singh, L.G.; Mitra, A.; Singh, S.R. Sentiment Analysis of Tweets Using Heterogeneous Multi-layer Network Representation and Embedding. In Proceedings of the 2020 Conference on Empirical Methods in Natural Language Processing, EMNLP, Online, 16–20 November 2020. [Google Scholar]
- Davisson, M. Staff Budget Briefing, FY 2017-18; Department of Public Health and Environment, 2016. Available online: https://leg.colorado.gov/sites/default/files/fy2017-18_pubheabrf.pdf (accessed on 23 April 2021).
- Tan, L.; Zhang, H. An approach to user knowledge acquisition in product design. Adv. Eng. Inform. 2021, 50, 101408. [Google Scholar] [CrossRef]
- Nassirtoussi, A.K.; Aghabozorgi, S.; Wah, T.Y.; Ngo, D.C.L. Text mining for market prediction: A systematic review. Expert Syst. Appl. 2014, 41, 7653–7670. [Google Scholar] [CrossRef]
- Rill, S.; Reinel, D.; Scheidt, J.; Zicari, R.V. PoliTwi: Early detection of emerging political topics on twitter and the impact on concept-level sentiment analysis. Knowl.-Based Syst. 2014, 69, 24–33. [Google Scholar] [CrossRef]
- Torkildson, M.; Starbird, K.; Aragon, C. Analysis and Visualization of Sentiment and Emotion on Crisis Tweets. In Cooperative Design, Visualization, and Engineering; Luo, Y., Ed.; Springer International Publishing: Berlin/Heidelberg, Germany, 2014; pp. 64–67. [Google Scholar] [CrossRef]
- Kontopoulos, E.; Berberidis, C.; Dergiades, T.; Bassiliades, N. Ontology-based sentiment analysis of twitter posts. Expert Syst. Appl. 2013, 40, 4065–4074. [Google Scholar] [CrossRef]
- Lahuerta-Otero, E.; Cordero-Gutiérrez, R. Looking for the perfect tweet. The use of data mining techniques to find influencers on twitter. Comput. Hum. Behav. 2016, 64, 575–583. [Google Scholar] [CrossRef]
- Ji, X.; Chun, S.A.; Geller, J. Monitoring Public Health Concerns Using Twitter Sentiment Classifications. In IEEE International Conference on Healthcare Informatics; IEEE: Philadelphia, PA, USA, 2013. [Google Scholar] [CrossRef]
- OECD. The territorial impact of COVID-19: Managing the crisis and recovery across levels of government. In OECD Policy Responses to Coronavirus (COVID-19); OECD Publishing: Paris, France, 2021. [Google Scholar] [CrossRef]
- Colorado Department of Public Health and Environment. Available online: https://cdphe.colorado.gov/ (accessed on 15 June 2021).
- Kravitz-Wirtz, N.; Aubel, A.; Schleimer, J.; Pallin, R.; Wintemute, G. Public Concern About Violence, Firearms, and the COVID-19 Pandemic in California. JAMA Netw. Open 2021, 4, e2033484. [Google Scholar] [CrossRef]
- Nicomedesa, C.J.C.; Avila, R.M.A. An analysis on the panic during COVID-19 pandemic through an online form. J. Affect. Disord. 2020, 276, 14–22. [Google Scholar] [CrossRef]
- Centers for Disease Control and Prevention. COVID Data Tracker. 2021. Available online: https://covid.cdc.gov/covid-data-tracker/#datatracker-home (accessed on 24 April 2021).
- Mittal, R.; Mittal, A.; Aggarwal, I. Identification of affective valence of Twitter generated sentiments during the COVID-19 outbreak. Soc. Netw. Anal. Min. 2021, 11, 108. [Google Scholar] [CrossRef]
- Hutto, C.J.; Gilbert, E. VADER: A Parsimonious Rule-Based Model for Sentiment Analysis of Social Media Text. In Proceedings of the International AAAI Conference on Web and Social Media. 8, Ann Arbor, MI, USA, 1–4 June 2014; pp. 216–225. Available online: https://ojs.aaai.org/index.php/ICWSM/article/view/14550 (accessed on 15 December 2021).
- Hung, M.; Lauren, E.; Hon, E.S.; Birmingham, W.C.; Xu, J.; Su, S.; Hon, S.D.; Park, J.; Dang, P.; Lipsky, M.S. Social Network Analysis of COVID-19 Sentiments: Application of Artificial Intelligence. J. Med. Internet Res. 2020, 22, e22590. [Google Scholar] [CrossRef]
- Yadav, A.; Vishwakarma, D.K. A Language-independent Network to Analyze the Impact of COVID-19 on the World via Sentiment Analysis. ACM Trans. Internet Technol. 2022, 22, 28. [Google Scholar] [CrossRef]
- Yu, X.; Ferreira, M.D.; Paulovich, F.V. Senti-COVID19: An Interactive Visual Analytics System for Detecting Public Sentiment and Insights Regarding COVID-19 From Social Media. IEEE Access 2021, 9, 126684–126697. [Google Scholar] [CrossRef]
- Basiri, M.E.; Nemati, S.; Abdar, M.; Asadi, S.; Acharrya, U.R. A novel fusion-based deep learning model for sentiment analysis of COVID-19 tweets. Knowl.-Based Syst. 2021, 228, 107242. [Google Scholar] [CrossRef]
- Gupta, P.; Kumar, S.; Suman, R.R.; Kumar, V. Sentiment Analysis of Lockdown in India During COVID-19: A Case Study on Twitter. IEEE Trans. Comput. Soc. Syst. 2021, 8, 992–1002. [Google Scholar] [CrossRef]
- Naseem, U.; Razzak, M.I.; Khushi, M.; Eklund, P.W.; Kim, J. COVIDSenti: A Large-Scale Benchmark Twitter Data Set for COVID-19 Sentiment Analysis. IEEE Trans. Comput. Soc. Syst. 2021, 8, 1003–1015. [Google Scholar] [CrossRef]
- Chen, E.; Lerman, K.; Ferrara, E. COVID-19: The first public coronavirus twitter dataset. arXiv 2020, arXiv:2003.07372. [Google Scholar]
- Lopez, C.E.; Vasu, M.; Gallemore, C. Understanding the perception of COVID-19 policies by mining a multilanguage twitter dataset. arXiv 2020, arXiv:2003.10359. [Google Scholar]
- Yaqub, U. Tweeting During the COVID-19 Pandemic: Sentiment Analysis of Twitter Messages by President Trump. Digit. Gov. Res. Pract. 2021, 2, 1–7. [Google Scholar] [CrossRef]
- National Institutes of Health. Office of Data Science Strategy. Available online: https://datascience.nih.gov/COVID-19-open-access-resources (accessed on 5 November 2022).
- European Centre for Disease Prevention and Control. Download Historical Data (to 14 December 2020) on the Daily Number of New Reported COVID-19 Cases and Deaths Worldwide. Available online: https://www.ecdc.europa.eu/en/publications-data/download-todays-data-geographic-distribution-COVID-19-cases-worldwide (accessed on 6 November 2022).
- Twitter Developer Platform. Available online: https://developer.twitter.com/en/docs (accessed on 1 June 2021).
- Socher, R.; Perelygin, A.; Wu, J.; Chuang, J.; Manning, C.D.; Ng, A.; Potts, C. Recursive Deep Models for Semantic Compositionality Over a Sentiment Treebank. In Proceedings of the 2013 Conference on Empirical Methods in Natural Language Processing, Seattle, WA, USA, 18–21 October 2013; Available online: https://aclanthology.org/D13-1170 (accessed on 2 January 2021).
- Loria, S. TextBlob Documentation. Release 0.16.0. 2020. Available online: https://buildmedia.readthedocs.org/media/pdf/TextBlob/latest/TextBlob.pdf (accessed on 15 December 2021).
- COVID 19 Daily Trends—New Cases, Deaths by State and Counties. Available online: https://www.makeready.com/covid/ (accessed on 28 February 2022).
- Krippendorff, K. Estimating the Reliability, Systematic Error and Random Error of Interval Data. Educ. Psychol. Meas. 1970, 30, 61–70. [Google Scholar] [CrossRef]
- ReCal for Nominal, Ordinal, Interval, and Ratio-Level Data. Available online: http://dfreelon.org/recal/recal-oir.php (accessed on 1 March 2022).
- Krippendorff, K. Content Analysis: An Introduction to Its Methodology, 2nd ed.; Sage Publications: Thousand Oaks, CA, USA, 2004. [Google Scholar]
- Sentiment Analysis without Modeling: TextBlob vs. VADER vs. Flair. Available online: https://pub.towardsai.net/sentiment-analysis-without-modeling-TextBlob-vs-vader-vs-flair-657b7af855f4 (accessed on 20 October 2022).
- Free Statistics Calculators, Calculator: P-Value for Correlation Coefficients. Available online: https://www.danielsoper.com/statcalc/calculator.aspx?id=44 (accessed on 15 December 2021).
- IMF. Policy Tracker. Available online: https://www.imf.org/en/Topics/imf-and-covid19/Policy-Responses-to-COVID-19 (accessed on 1 September 2022).
- COVID-19: Local Action Tracker. Available online: https://www.nlc.org/resource/COVID-19-local-action-tracker/ (accessed on 1 March 2022).
- Lewis, M.; Liu, Y.; Goyal, N.; Ghazvininejad, M.; Mohamed, A.; Levy, O.; Stoyanov, V.; Zettlemoyer, L. BART: Denoising Sequence-to-Sequence Pre-training for Natural Language Generation, Translation, and Comprehension. arXiv 2019. [Google Scholar] [CrossRef]
- Raffel, C.; Shazeer, N.; Roberts, A.; Lee, K.; Narang, S.; Matena, M.; Zhou, Y.; Li, W.; Liu, P.J. Exploring the Limits of Transfer Learning with a Unified Text-to-Text Transformer. arXiv 2019. [Google Scholar] [CrossRef]
- Barrios, F.; López, F.; Argerich, L.; Wachenchauzer, R. Variations of the Similarity Function of TextRank for Automated Summarization. arXiv 2016. [Google Scholar] [CrossRef]
- Radford, A.; Wu, J.; Child, R.; Luan, D.; Amodei, D.; Sutskever, I. Language Models are Unsupervised Multitask Learners. 2019. Available online: https://openai.com/blog/better-language-models/ (accessed on 15 June 2022).
- Wu, H.; Huang, J.; Zhang, C.J.P.; He, Z.; Ming, W. Facemask shortage and the coronavirus disease (COVID-19) outbreak: Reflection on public health measures. medRxiv 2020. [Google Scholar] [CrossRef]
- Roy, S.; Dutta, R.; Ghosh, P. Recreational and philanthropic sectors are the worst-hit US industries in the COVID-19 aftermath. Soc. Sci. Humanit. Open 2021, 3, 100098. [Google Scholar] [CrossRef] [PubMed]
- Cheng, C.; Wang, H.; Ebrahimi, O.V. Adjustment to a “New Normal:” Coping Flexibility and Mental Health Issues During the COVID-19 Pandemic. Front. Psychiatry 2021, 12, 353. [Google Scholar] [CrossRef]
- Chun, S.A.; Li, C.; Toliyat, A.; Geller, J. Tracking Citizen’s Concerns During COVID-19 Pandemic. In Proceedings of the 21st Annual International Conference on Digital Government Research, New York, NY, USA, 15–19 June 2020. [Google Scholar] [CrossRef]
- Black Swan in the Stock Market: What Is It, With Examples and History. 2022. Available online: https://www.investopedia.com/terms/b/blackswan.asp (accessed on 6 November 2022).
- Bonifazi, G.; Breve, B.; Cirillo, S.; Corradini, E.; Virgili, L. Investigating the COVID-19 vaccine discussions on Twitter through a multilayer network-based approach. Inf. Process. Manag. 2022, 59, 103095. [Google Scholar] [CrossRef]


Publisher’s Note: MDPI stays neutral with regard to jurisdictional claims in published maps and institutional affiliations. |
© 2022 by the authors. Licensee MDPI, Basel, Switzerland. This article is an open access article distributed under the terms and conditions of the Creative Commons Attribution (CC BY) license (https://creativecommons.org/licenses/by/4.0/).