
An Education Process Mining Framework: Unveiling Meaningful Information for Understanding Students’ Learning Behavior and Improving Teaching Quality


Abstract
:1. Introduction
- Motivations
- M1: What are the relevant methodologies adopted by researchers to address the issues of student learning analytics using process mining?
- M2: What are the most common process mining tools and techniques employed in educational process mining for the automatic discovery of process models from collected event logs?
- M3: How can EPM add insights to improve students’ learning management systems and
- M4: What are the challenges that need to be explored to make this emerging topic useful for the overall development of the academic system?
- Research Questions:
- RQ 1: How the large volume of educational system data is exploited by instructors and administrators to understand students’ learning habits, the factors influencing their learning habit and academic performance?
- RQ 2: How automatic process mining algorithms can help to discover simplified educational process models and to extract more knowledge about the student learning behavioral properties?
- Research Objectives (RO):
- RO 1: To compare and study the students learning behavior using correlation amongst several features available in the learning analytics dataset.
- RO 2: To explore discovered process models with various modeling languages.
- RO 3: To apply process mining using an inductive visual miner (IvM) and directly follows visual miner (DFvM) to discuss the learning behavior of the students.
2. Related Work
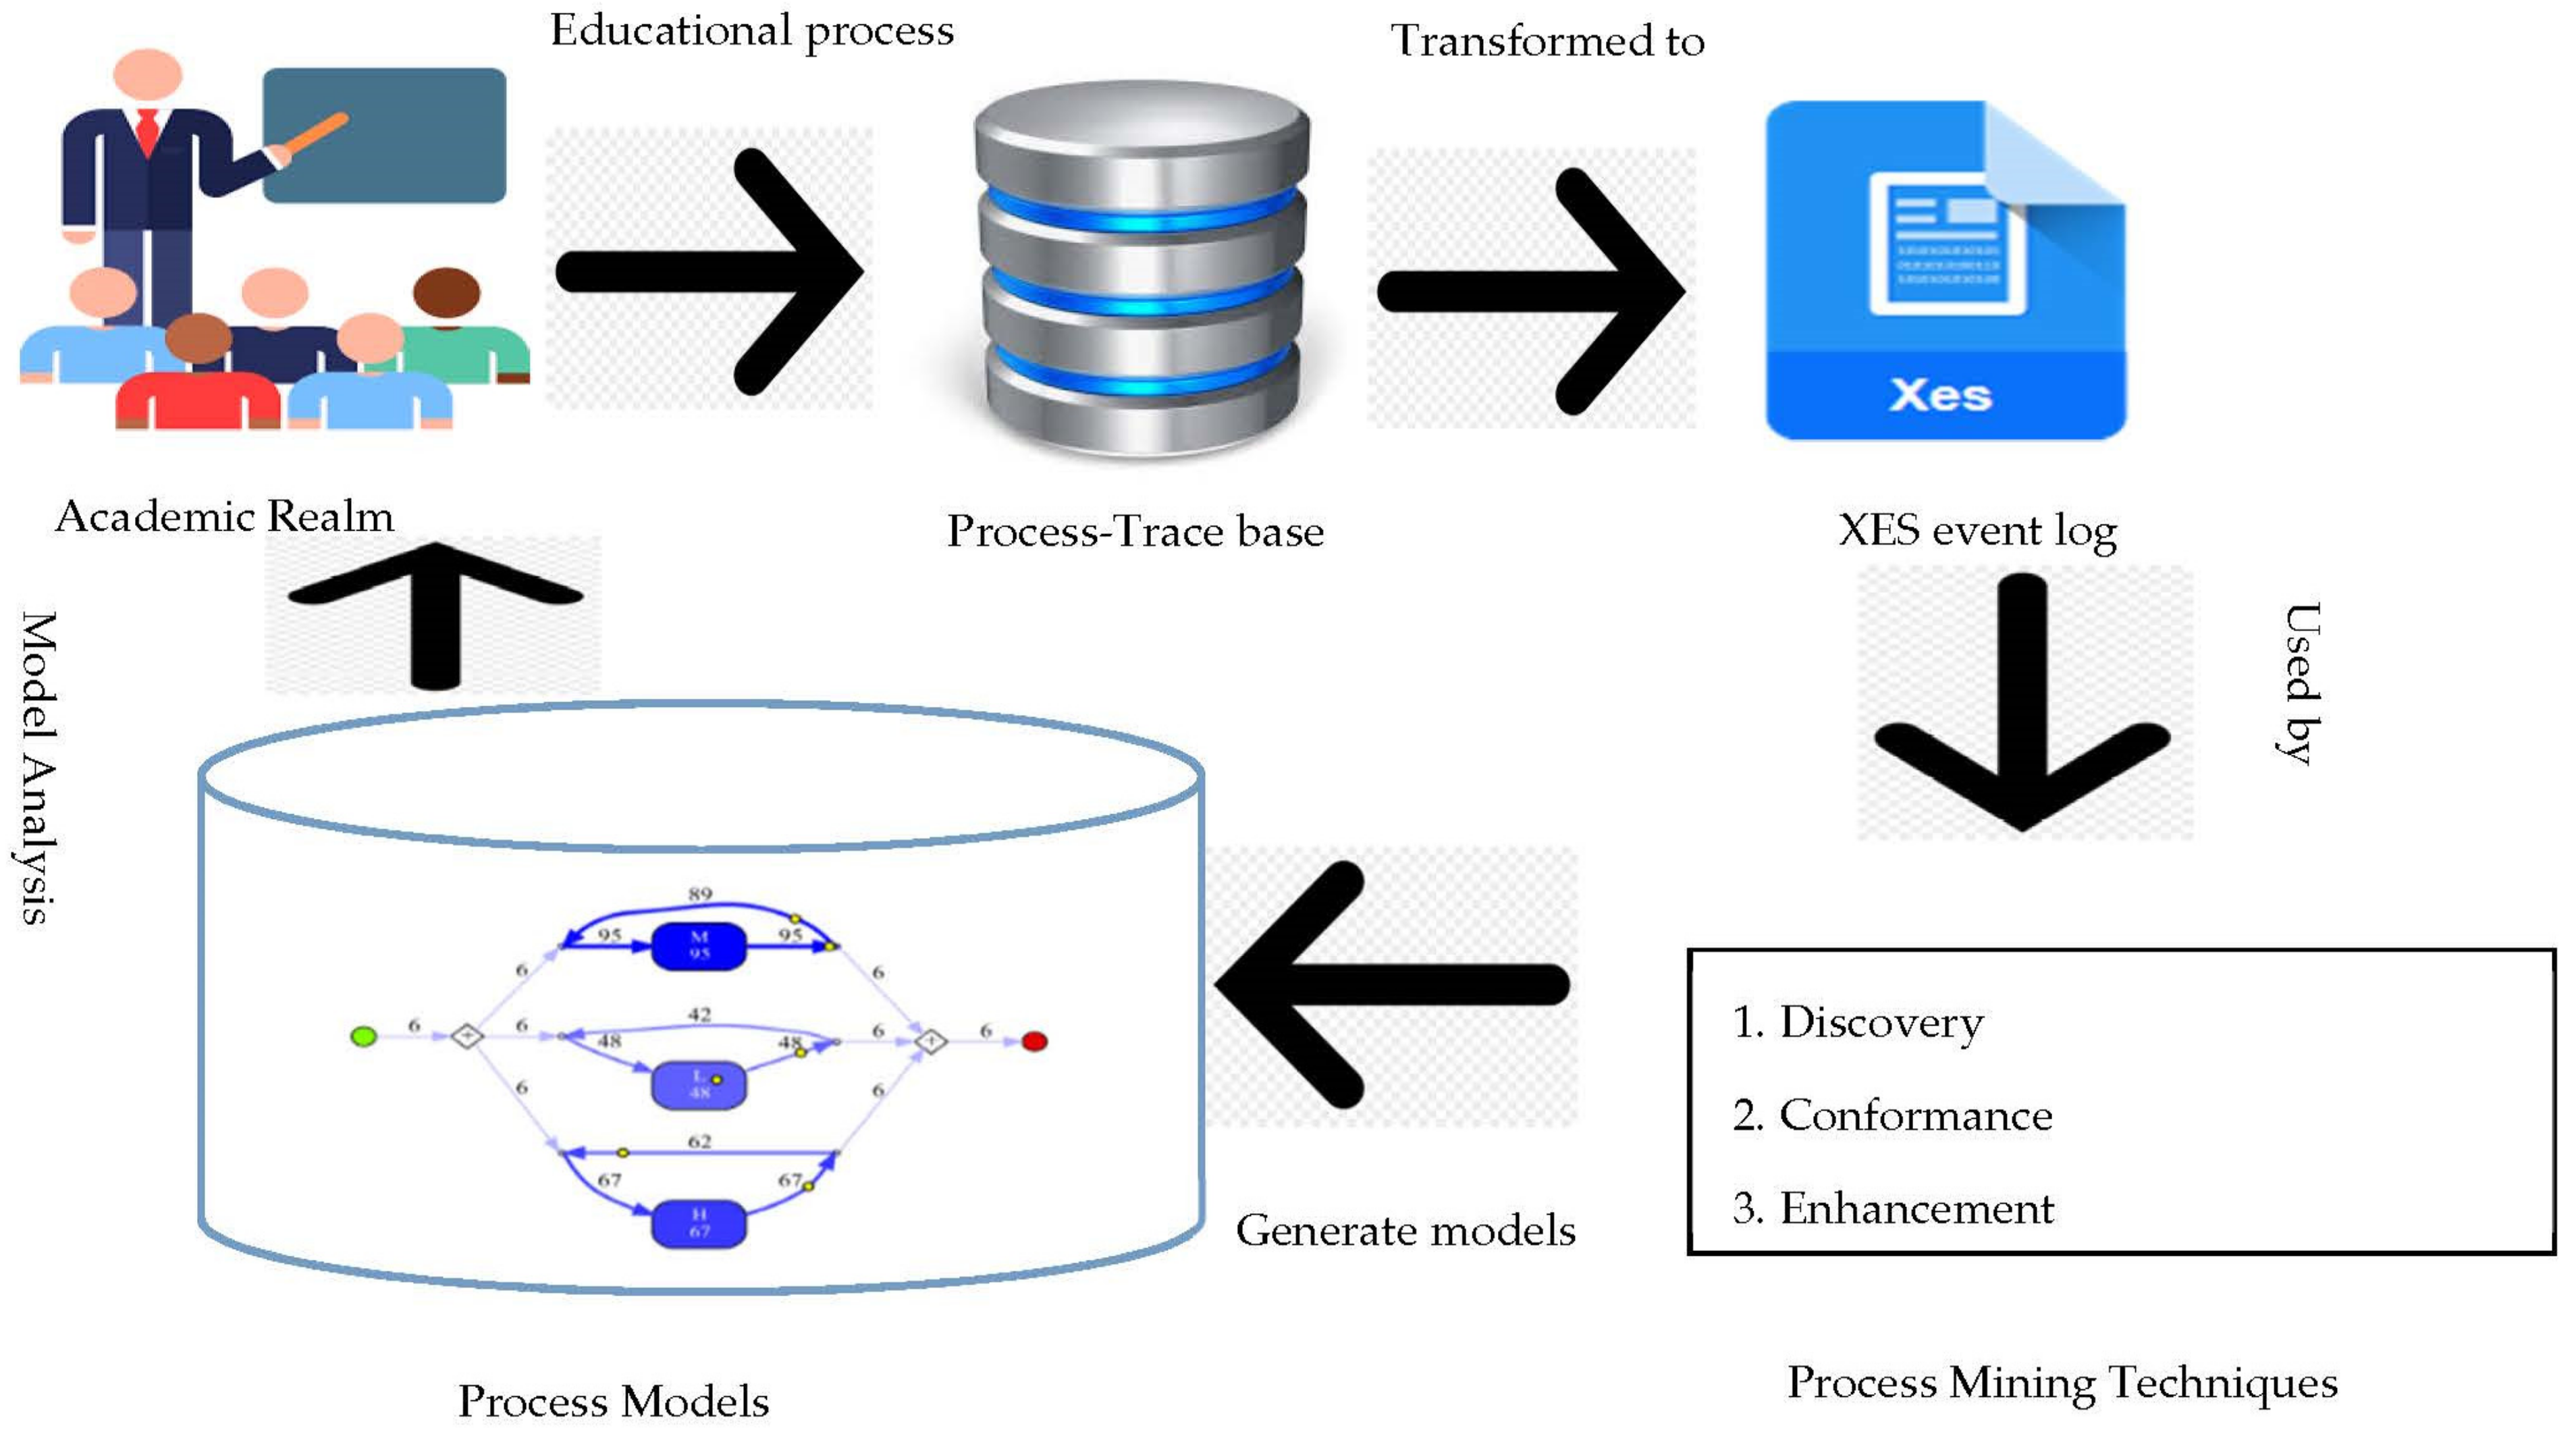
3. Educational Process Mining
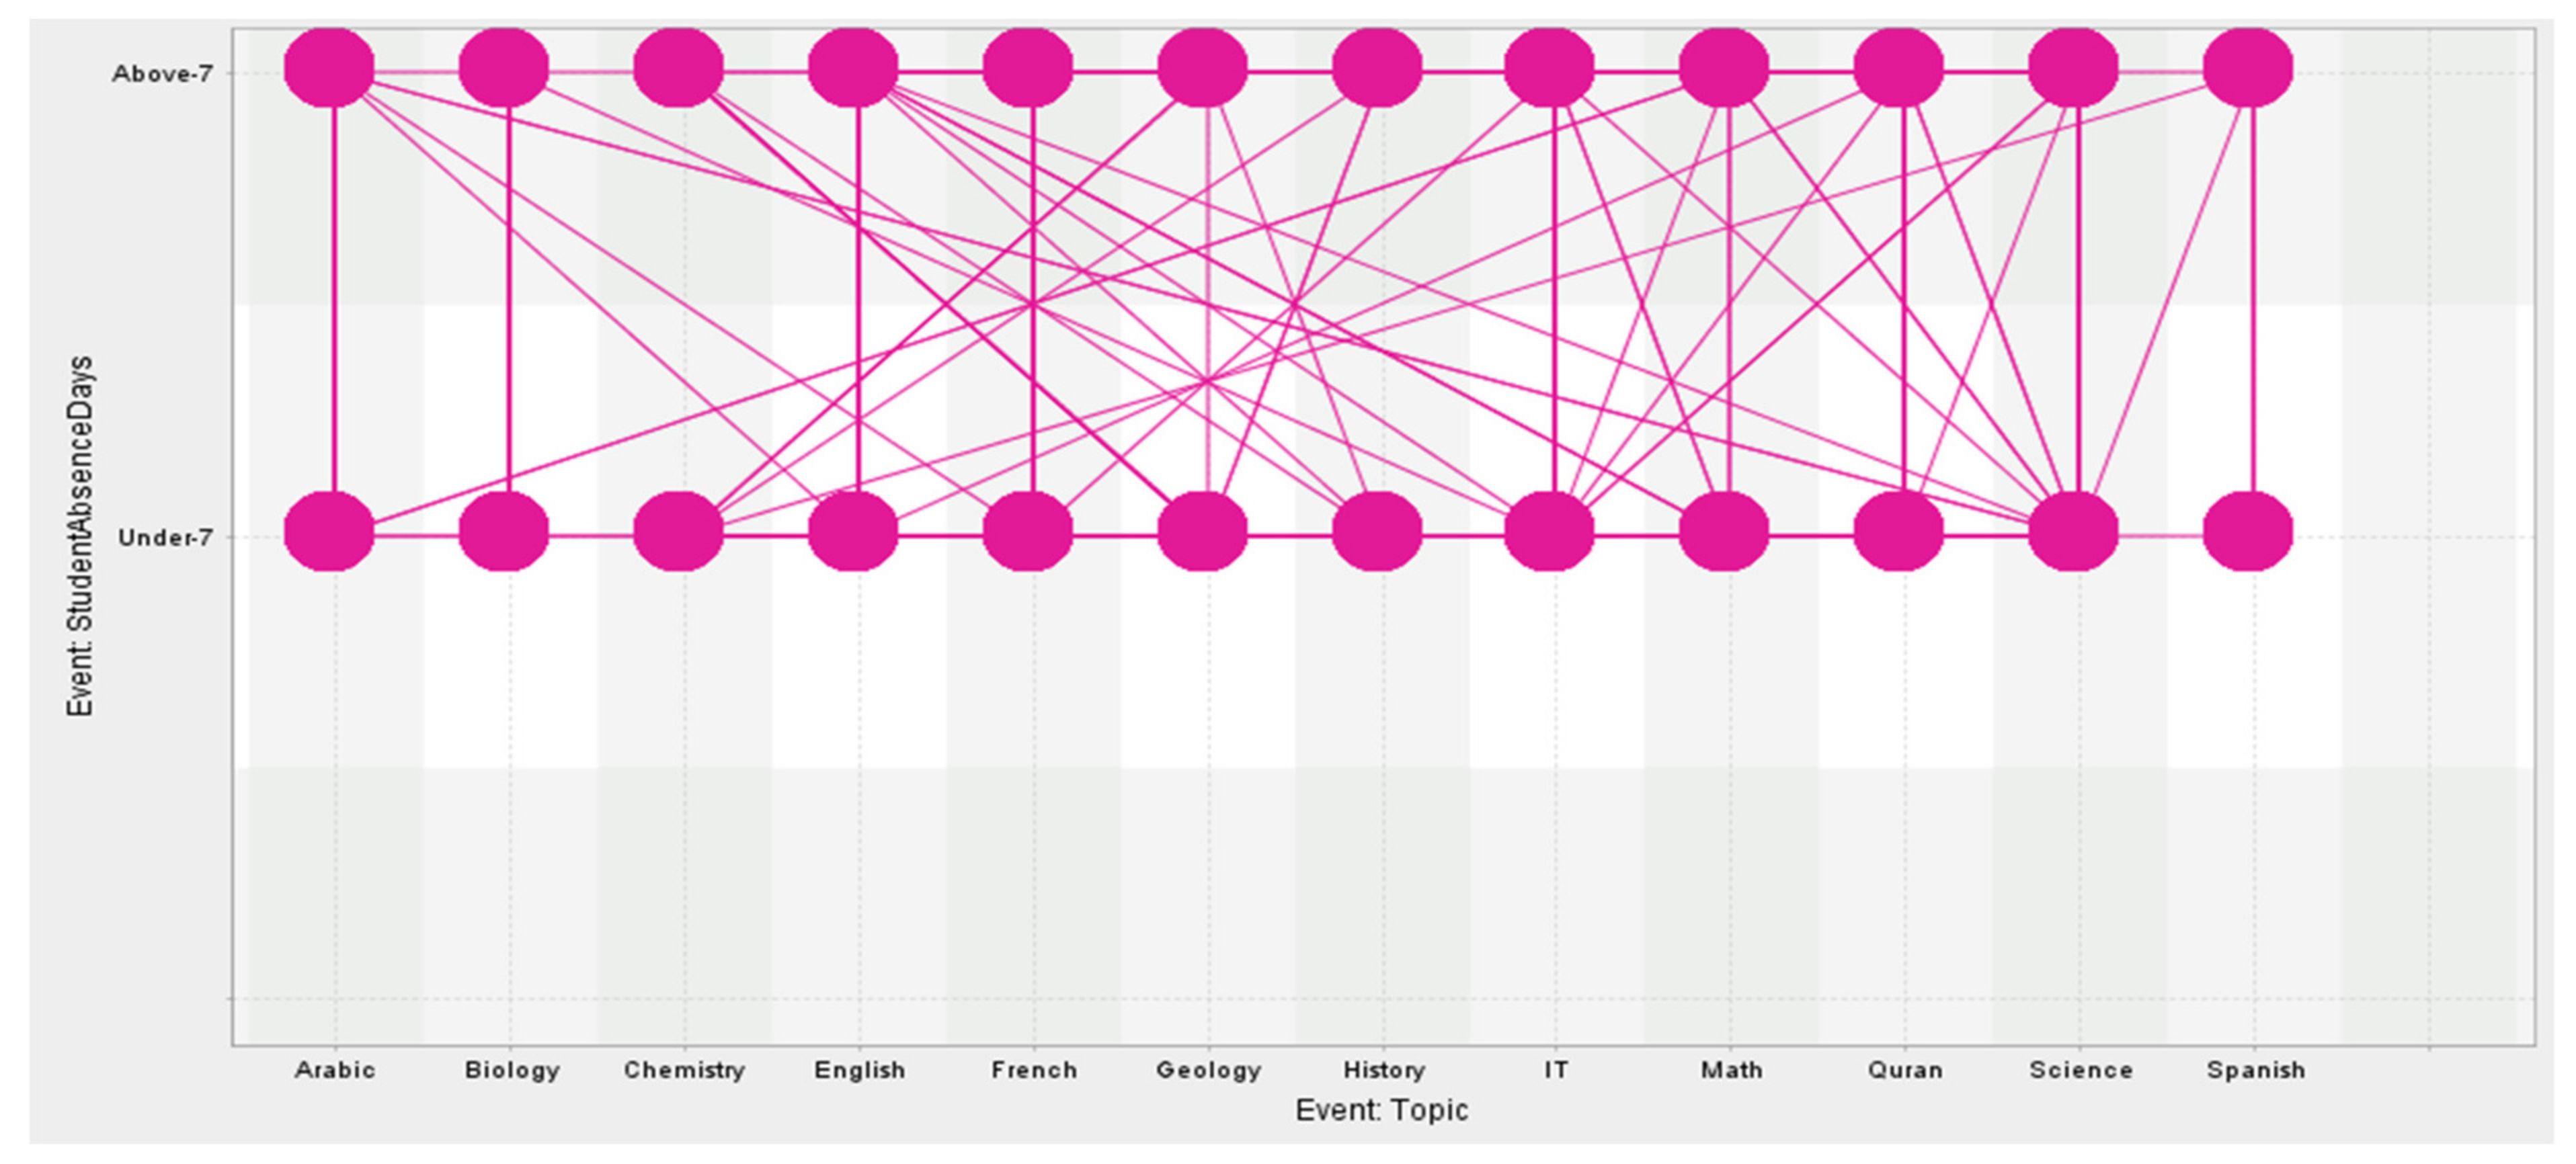
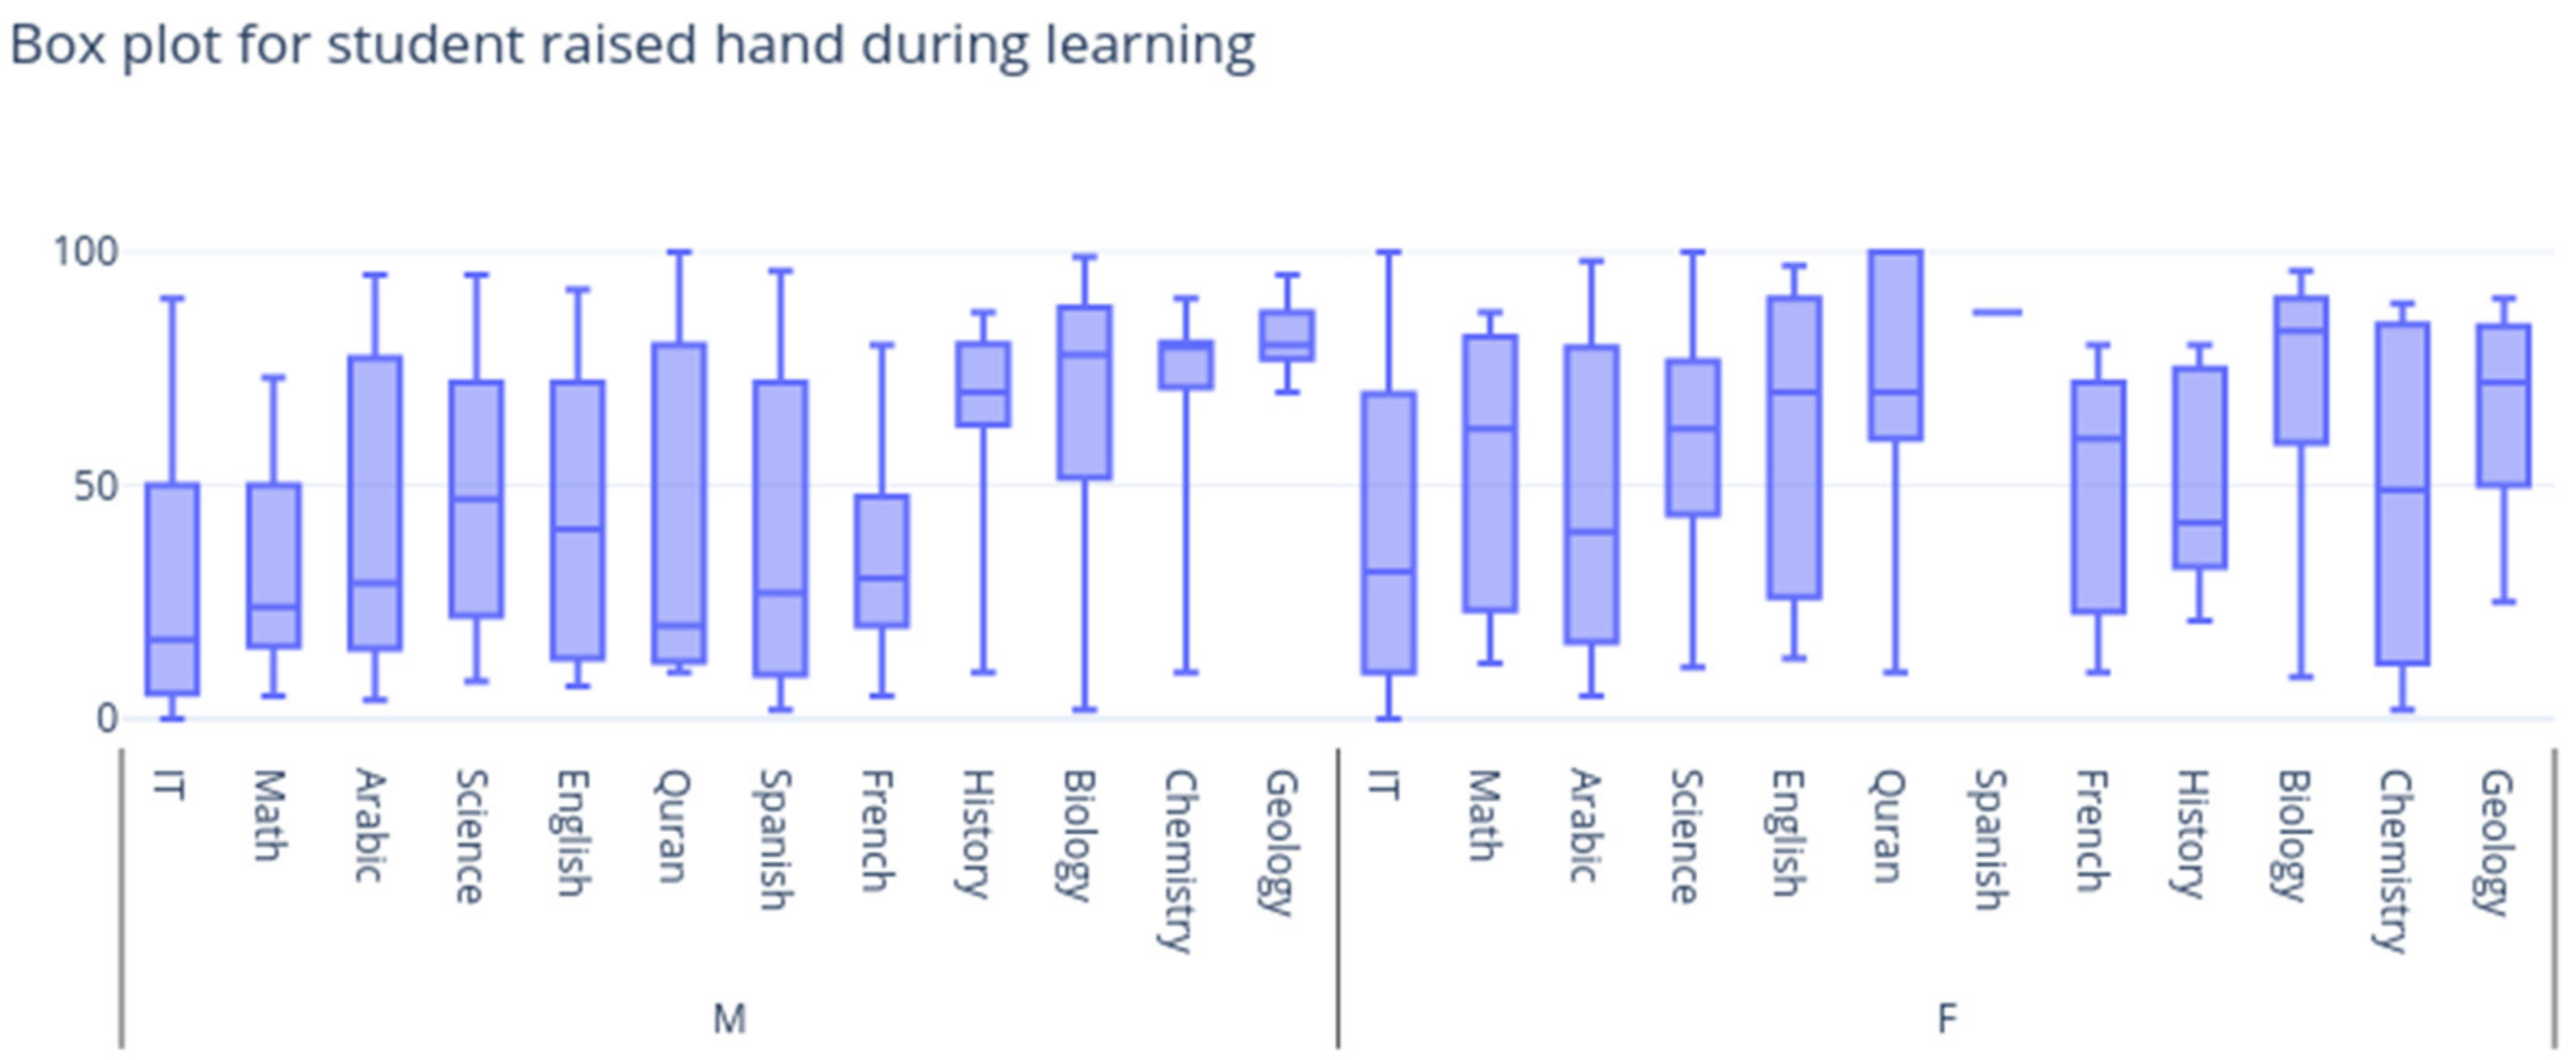
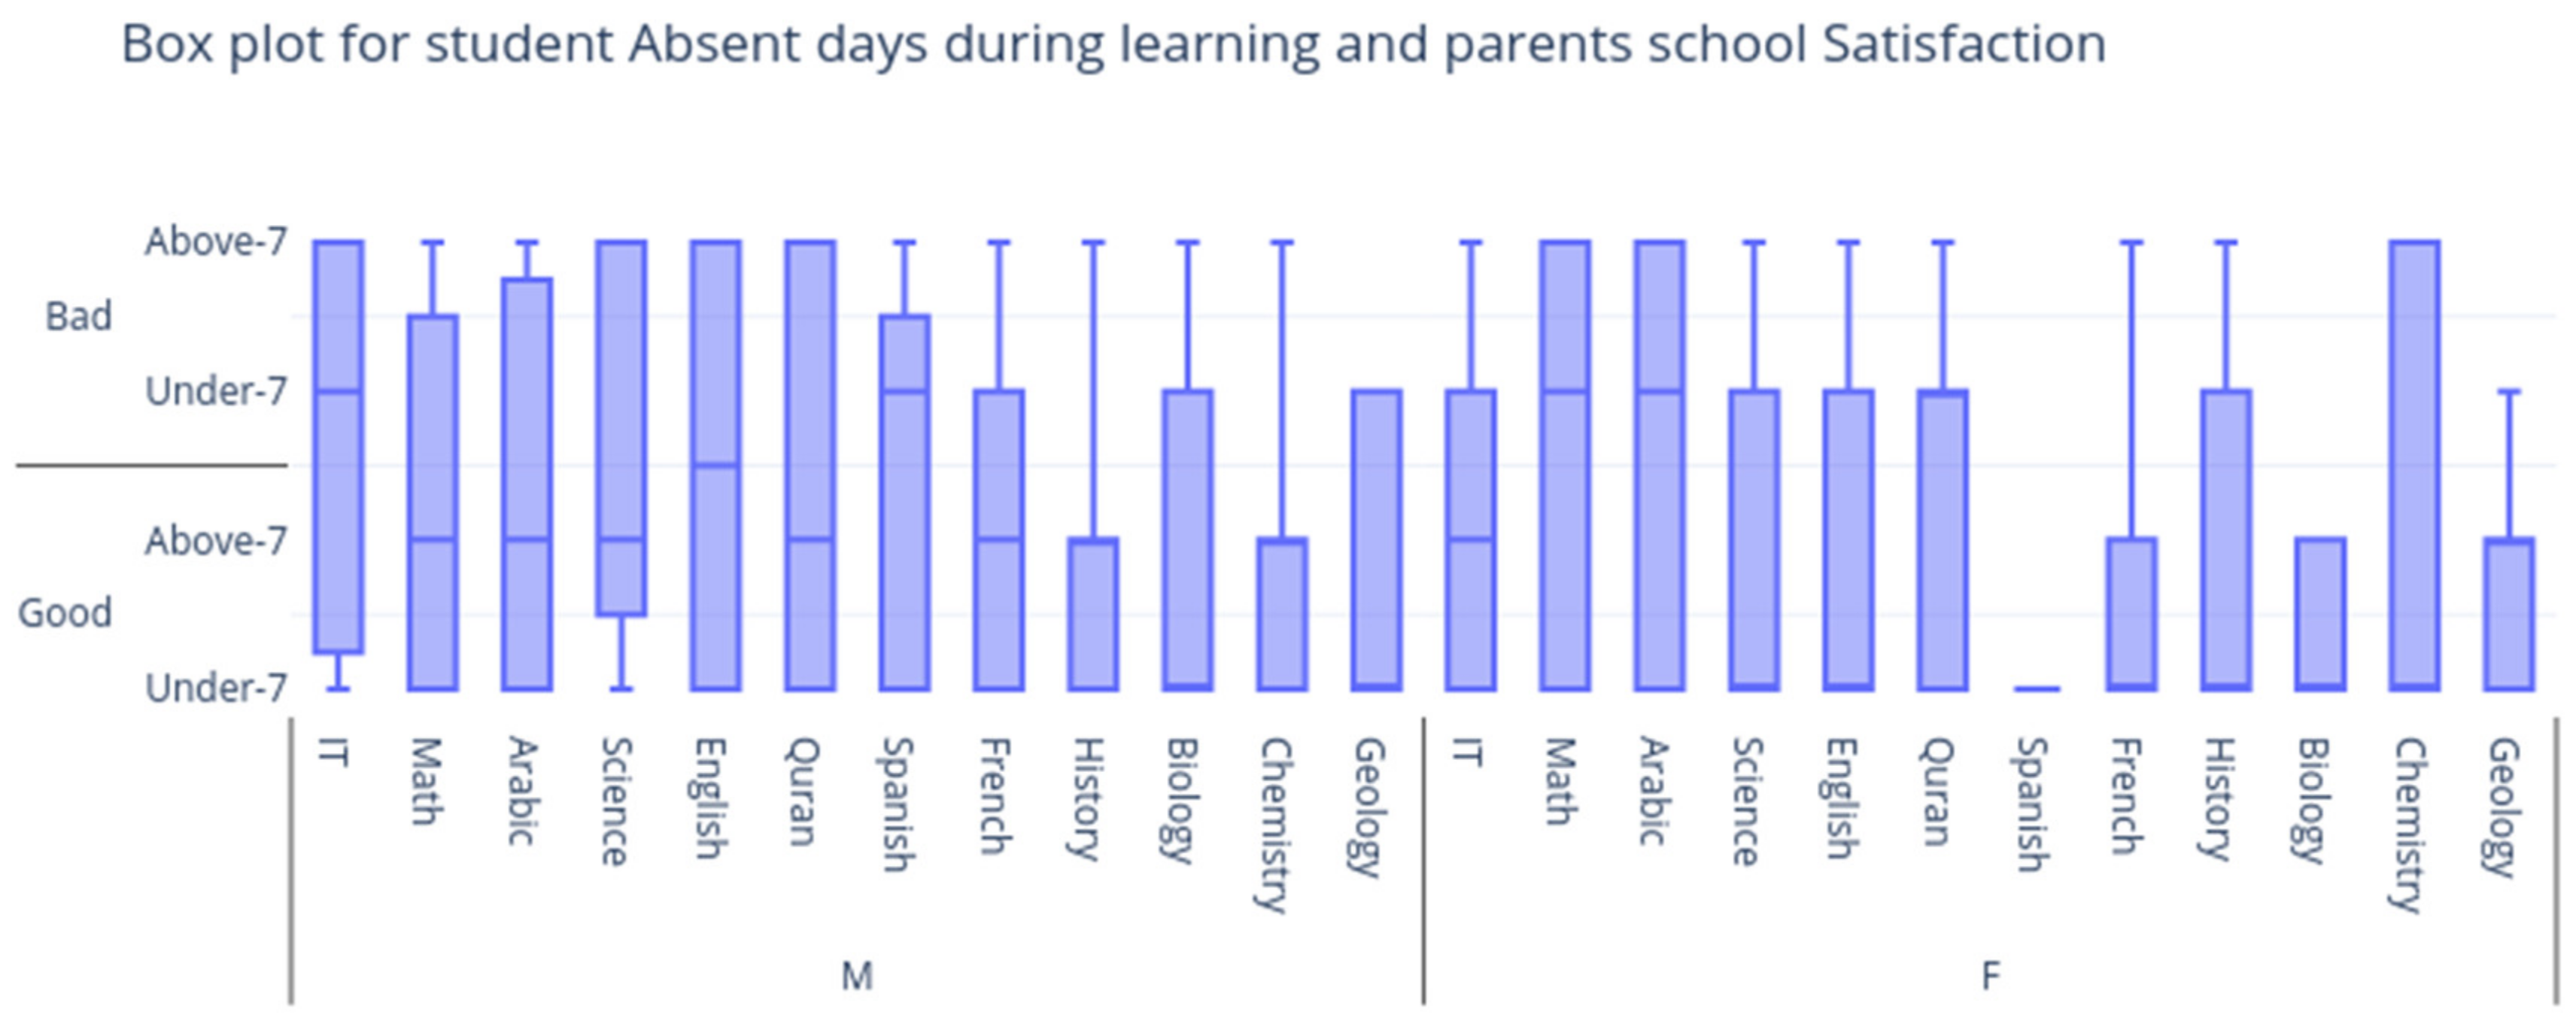
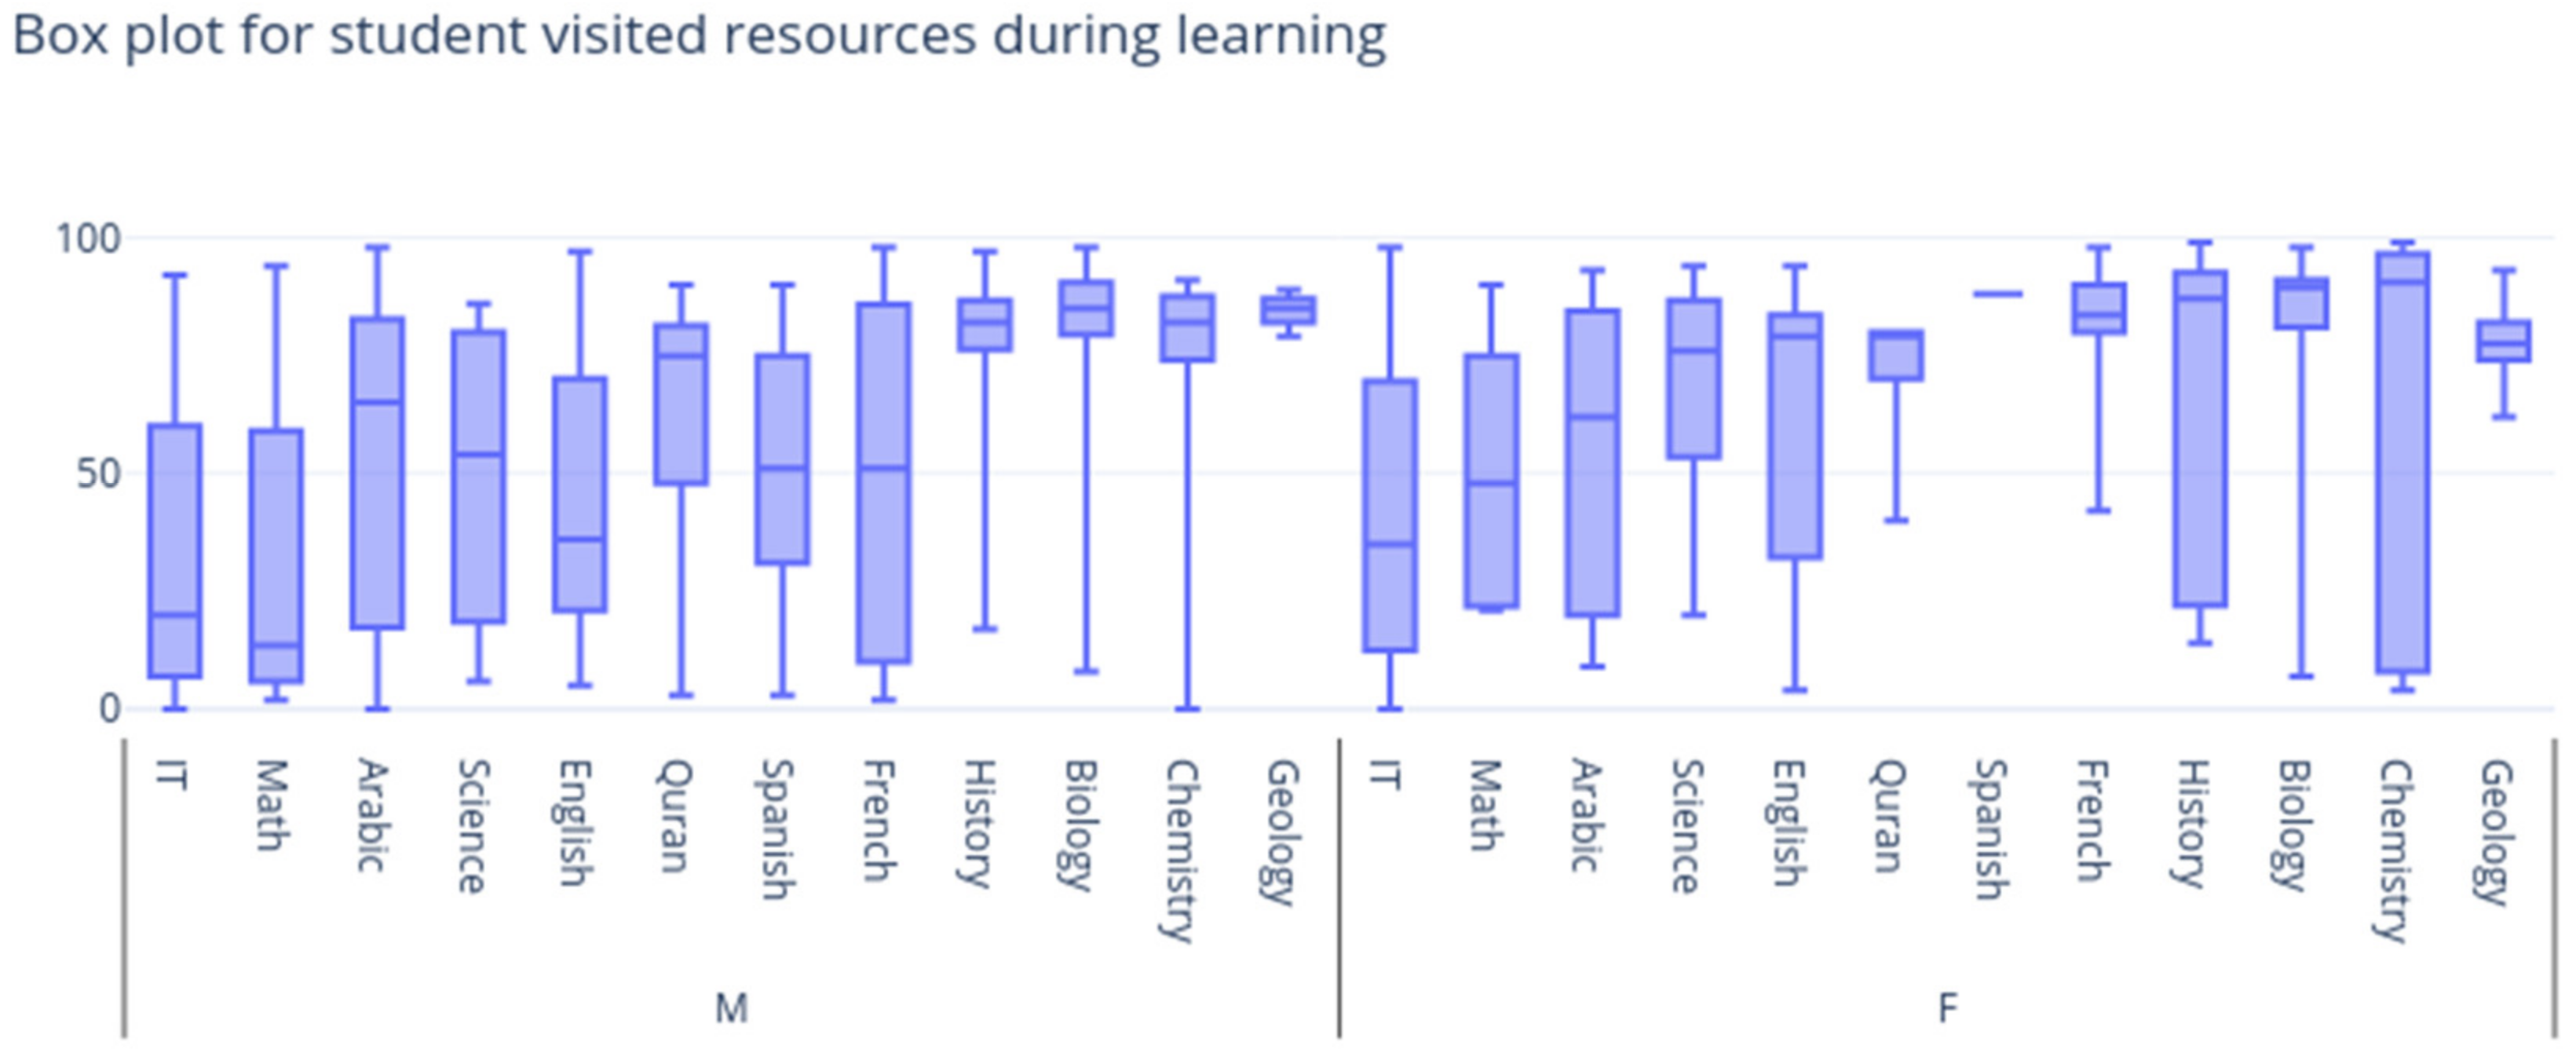
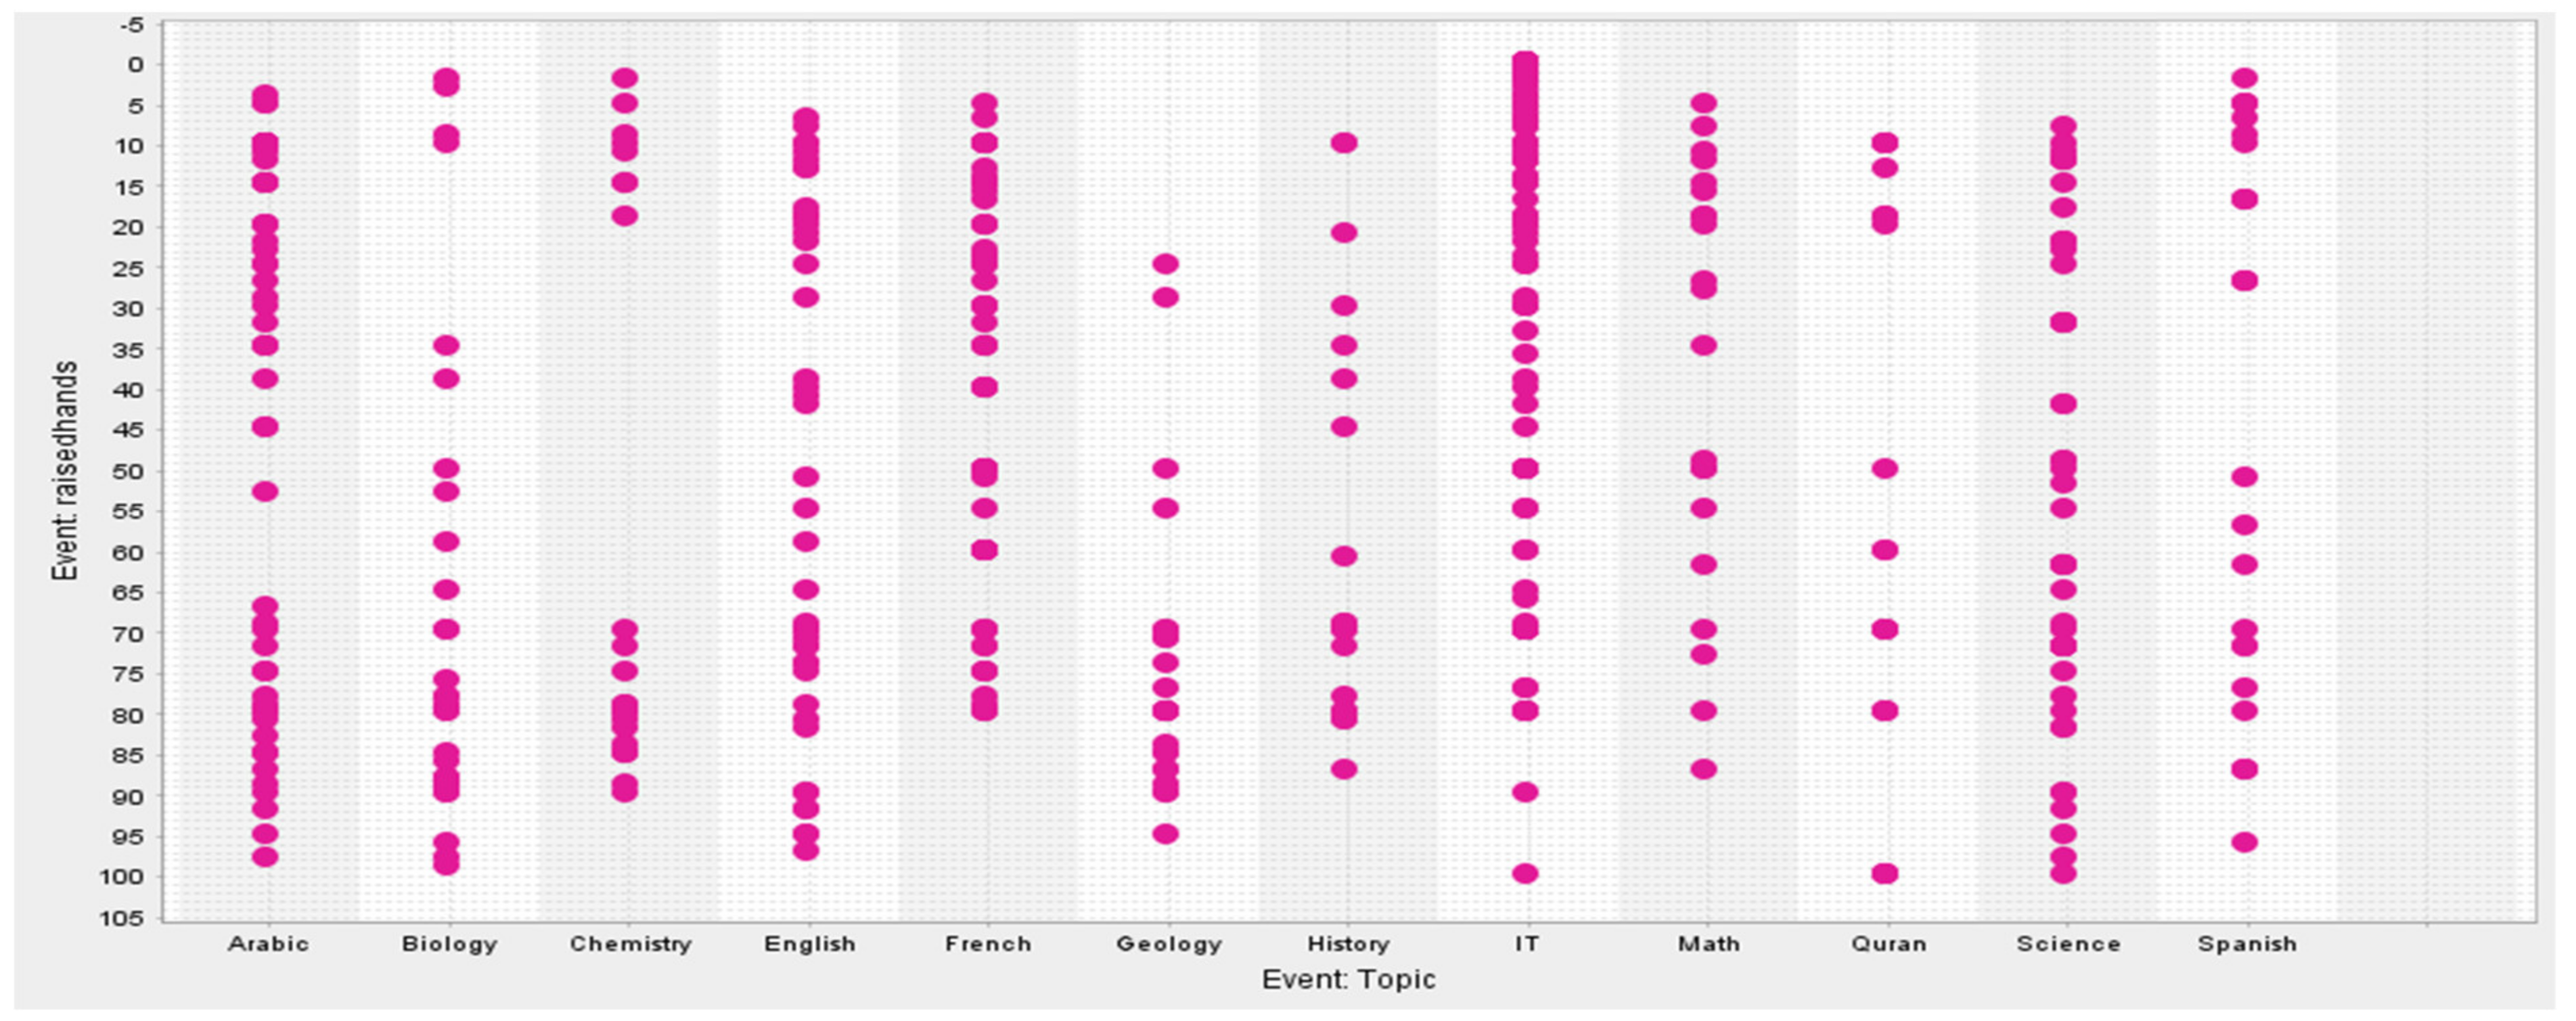
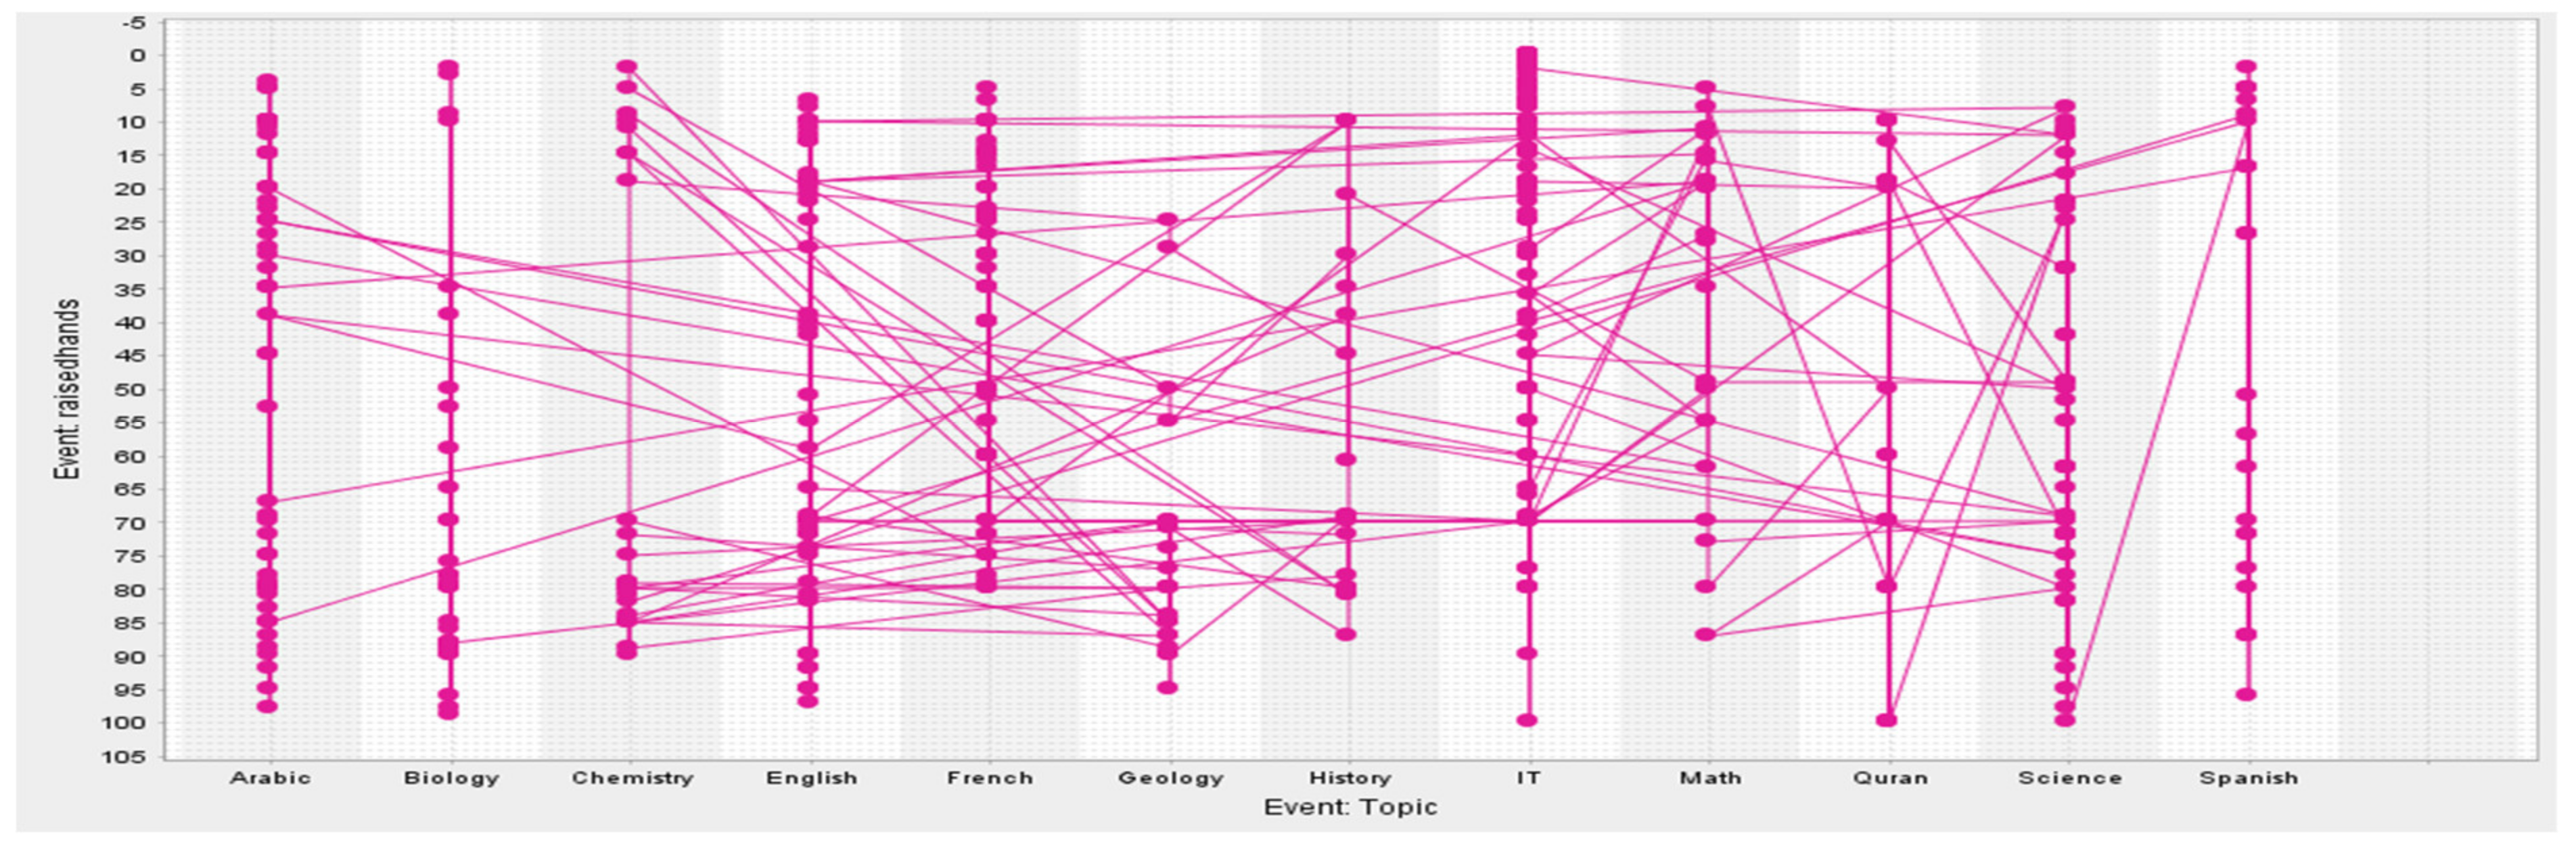
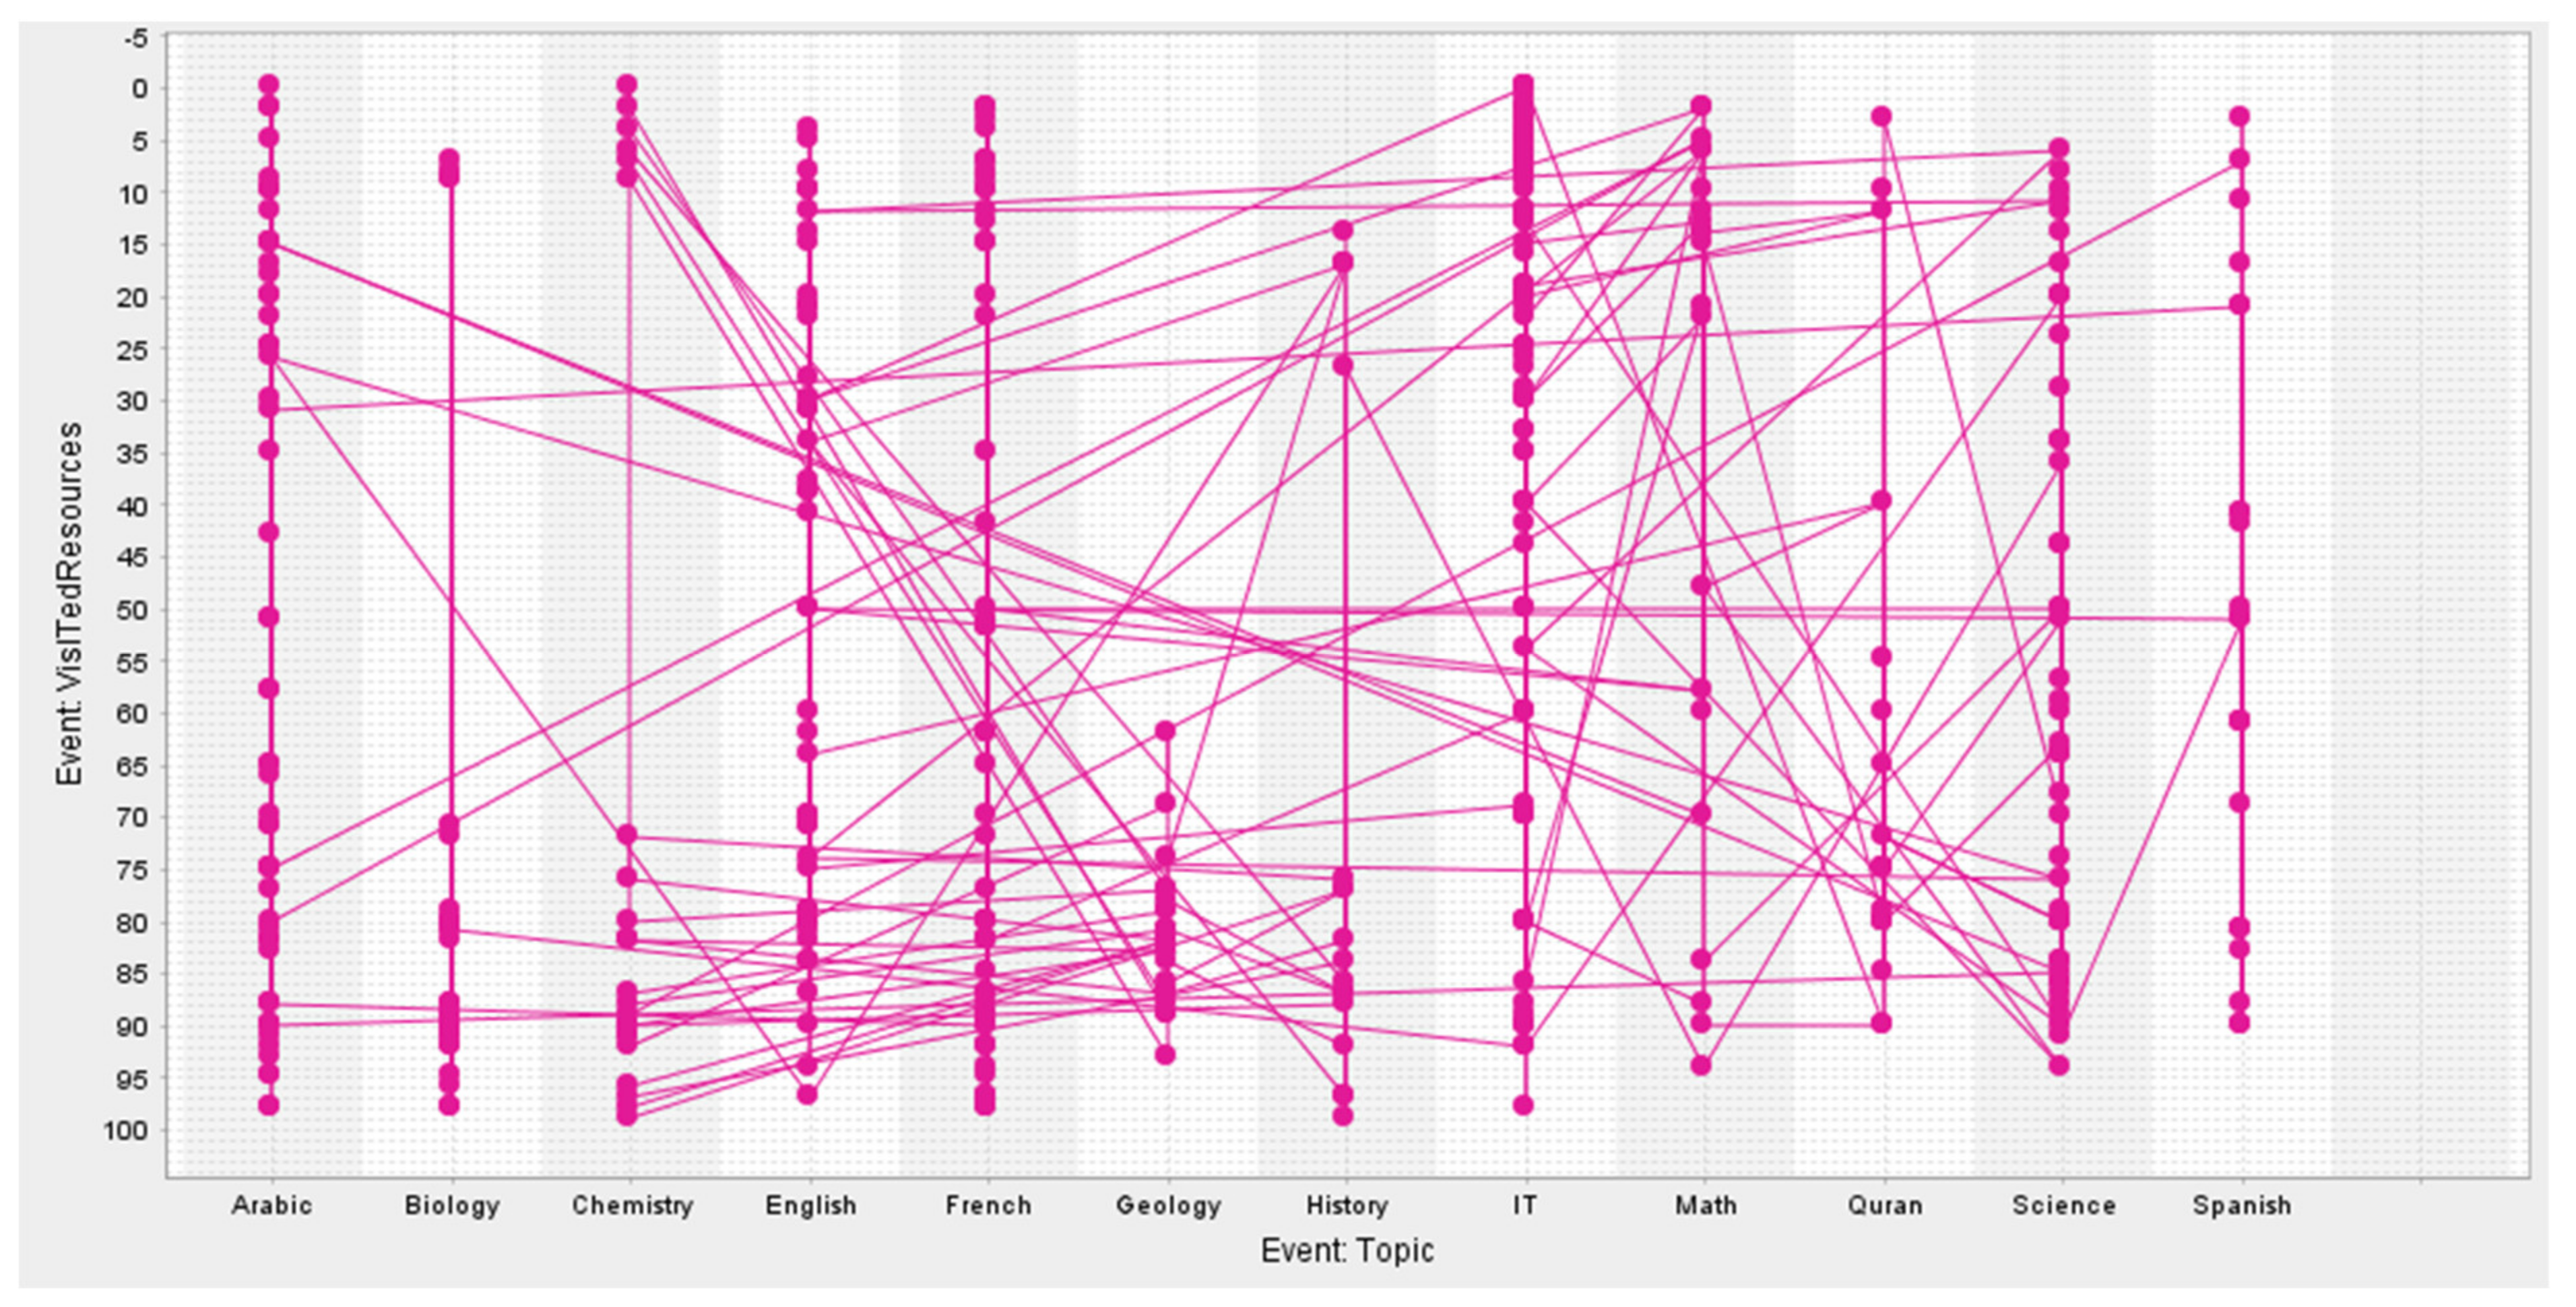
4. Dataset Used
5. Implementation Approaches
- Process mining techniques:
- Alpha Miner:
- Inductive Visual Miner:
- Heuristics Miner:
- Evaluation metrics
- Throughput time denotes the time taken for a process to be executed completely from the start to the end
- Fitness (or recall) measures the aptness of the model to apprehend the recorded behavior in the collected event log. This quantifies how many of the observed behaviors in the event log fit well into the process model.
- Precision is used to enumerate the extent to which a process model overapproximates the behavior seen in an event log without allowing too many non-existent behaviors in the event logs.
- Simplicity in a process model provides a wool-gathering process and is induced by independent process instances. The model discovered should be as simple as possible, but too much simplicity will reduce its precision.
- Generalization indicates that the discovered model should generalize the example behavior, as seen in event logs that do not have any variations.
- Soundness deals with whether the process model is free from anomalies, such as deadlocks or livelocks. This provides an understanding as to whether a process terminates properly, provided that every activity is a participant in a process instance.
- F1 score is a performance measure of a process model’s accuracy that is often defined as a harmonic mean of the precision and recall. Furthermore, it presents a score for the accuracy of the fitting or positive event traces and the accuracy of the non-fitting (or negative) ones. Therefore, if a process model classifies all traces as positive, the F1 score will be one (100%). On the other hand, if it classifies all traces as negative, the F1 score will be 0 (0%). In general, the value of the F1 score lies between 0% and 100%.
- Execution time or processing time is the time required to process an event log. A longer or shorter duration in process model building can have a negative or positive impact on the business activities, respectively.
6. Experimental Result and Discussion
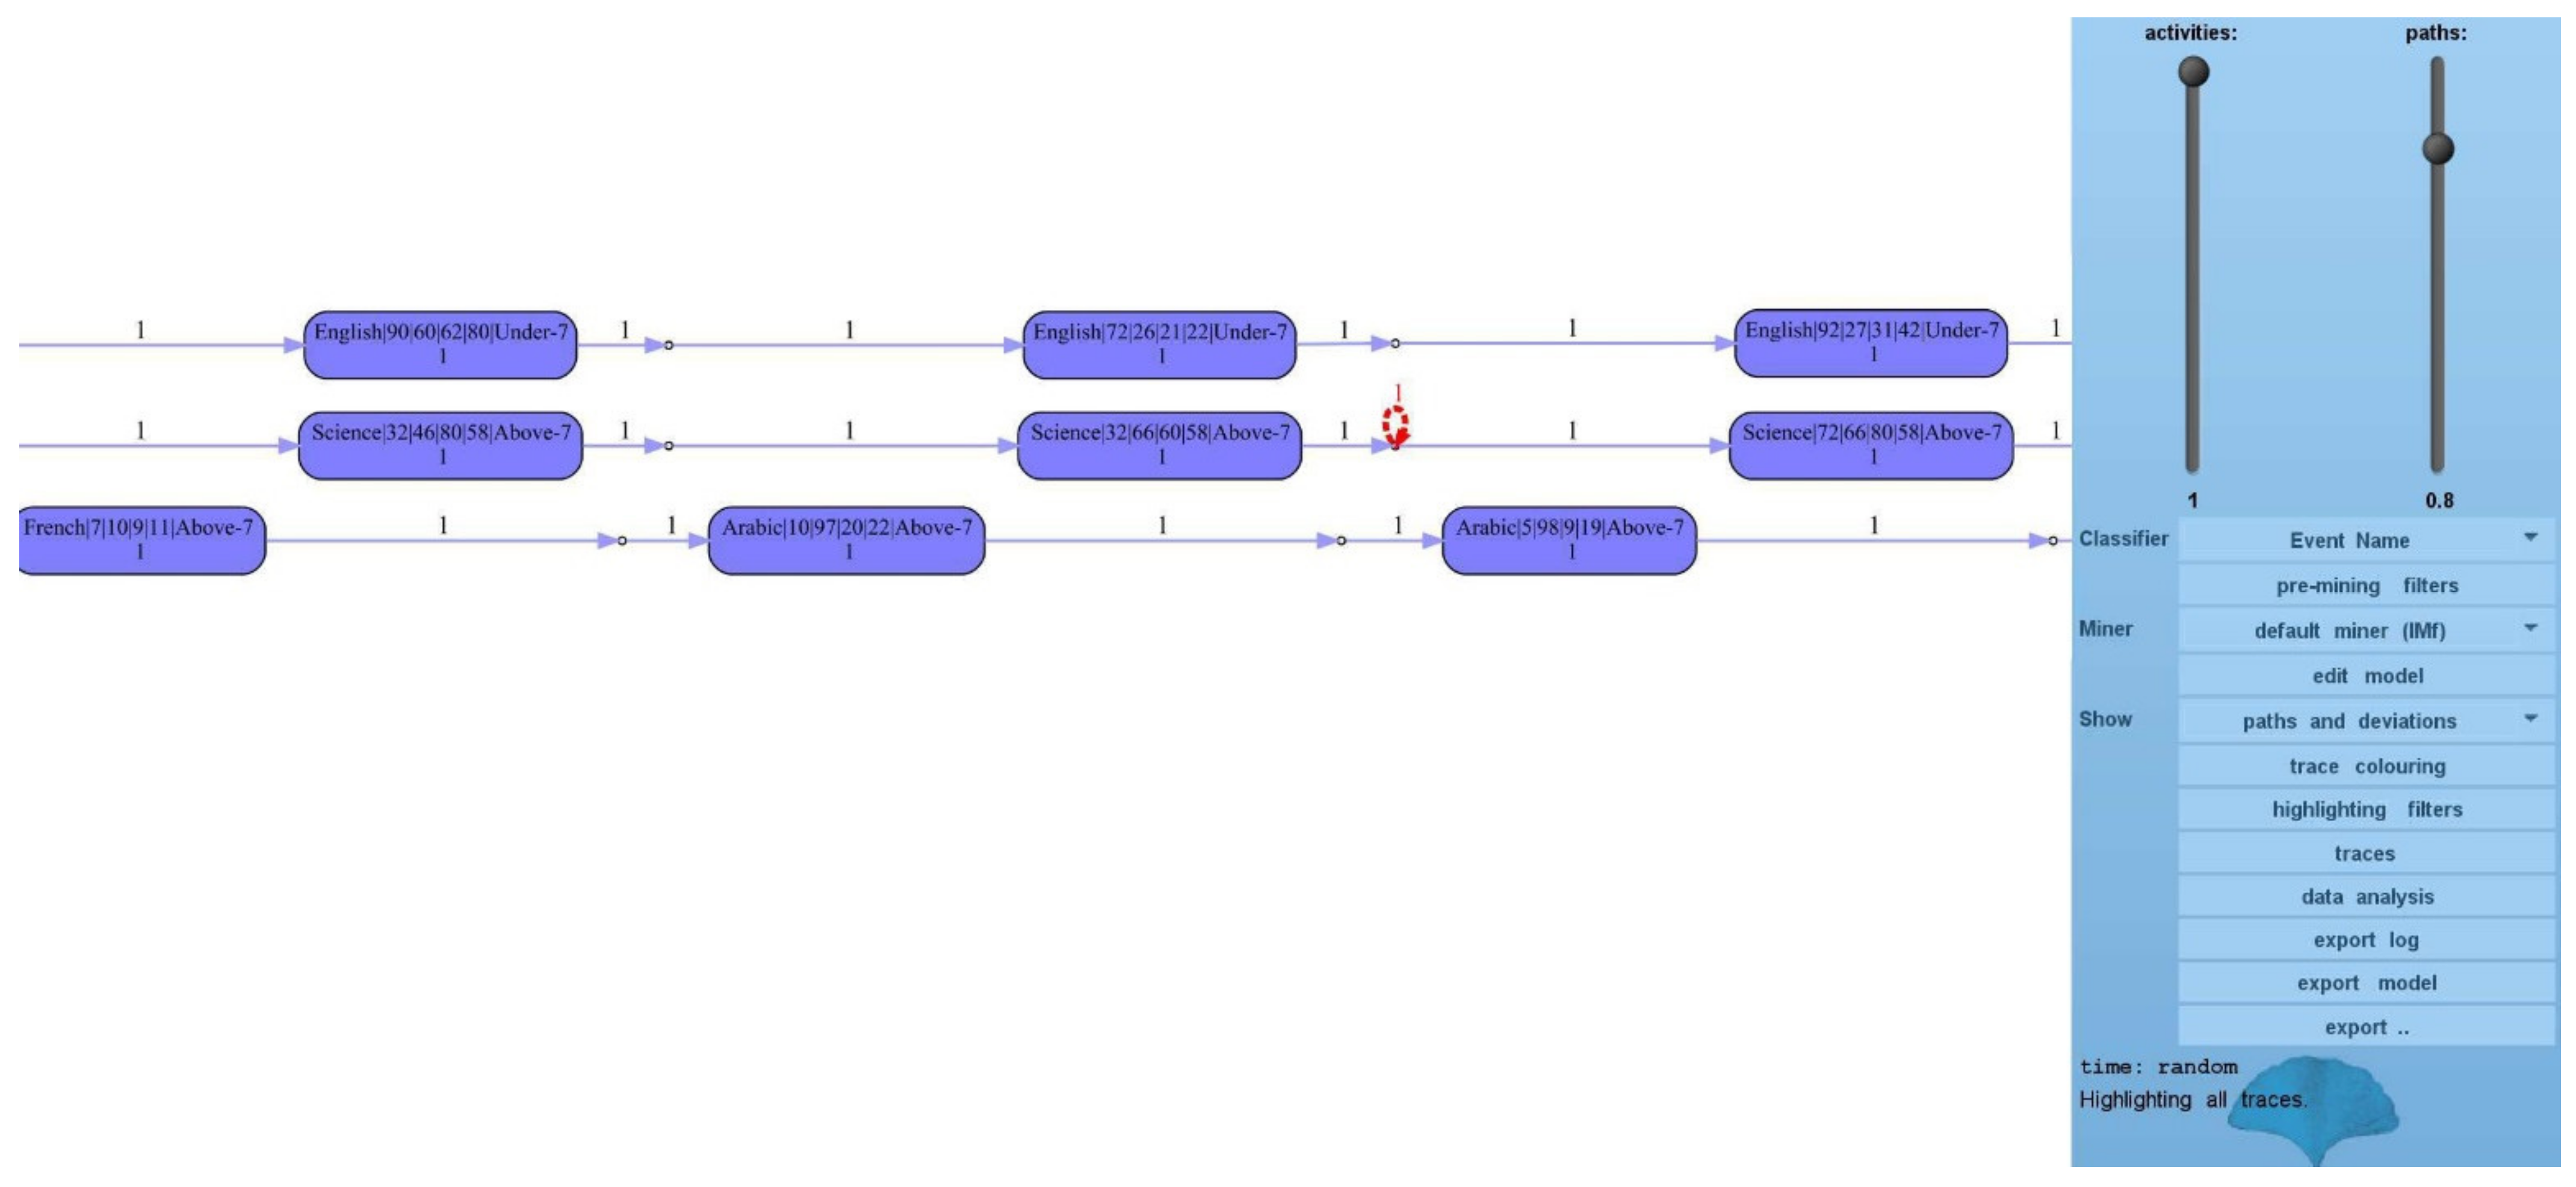
- Experiment 1: Inductive Visual Miner (IvM)
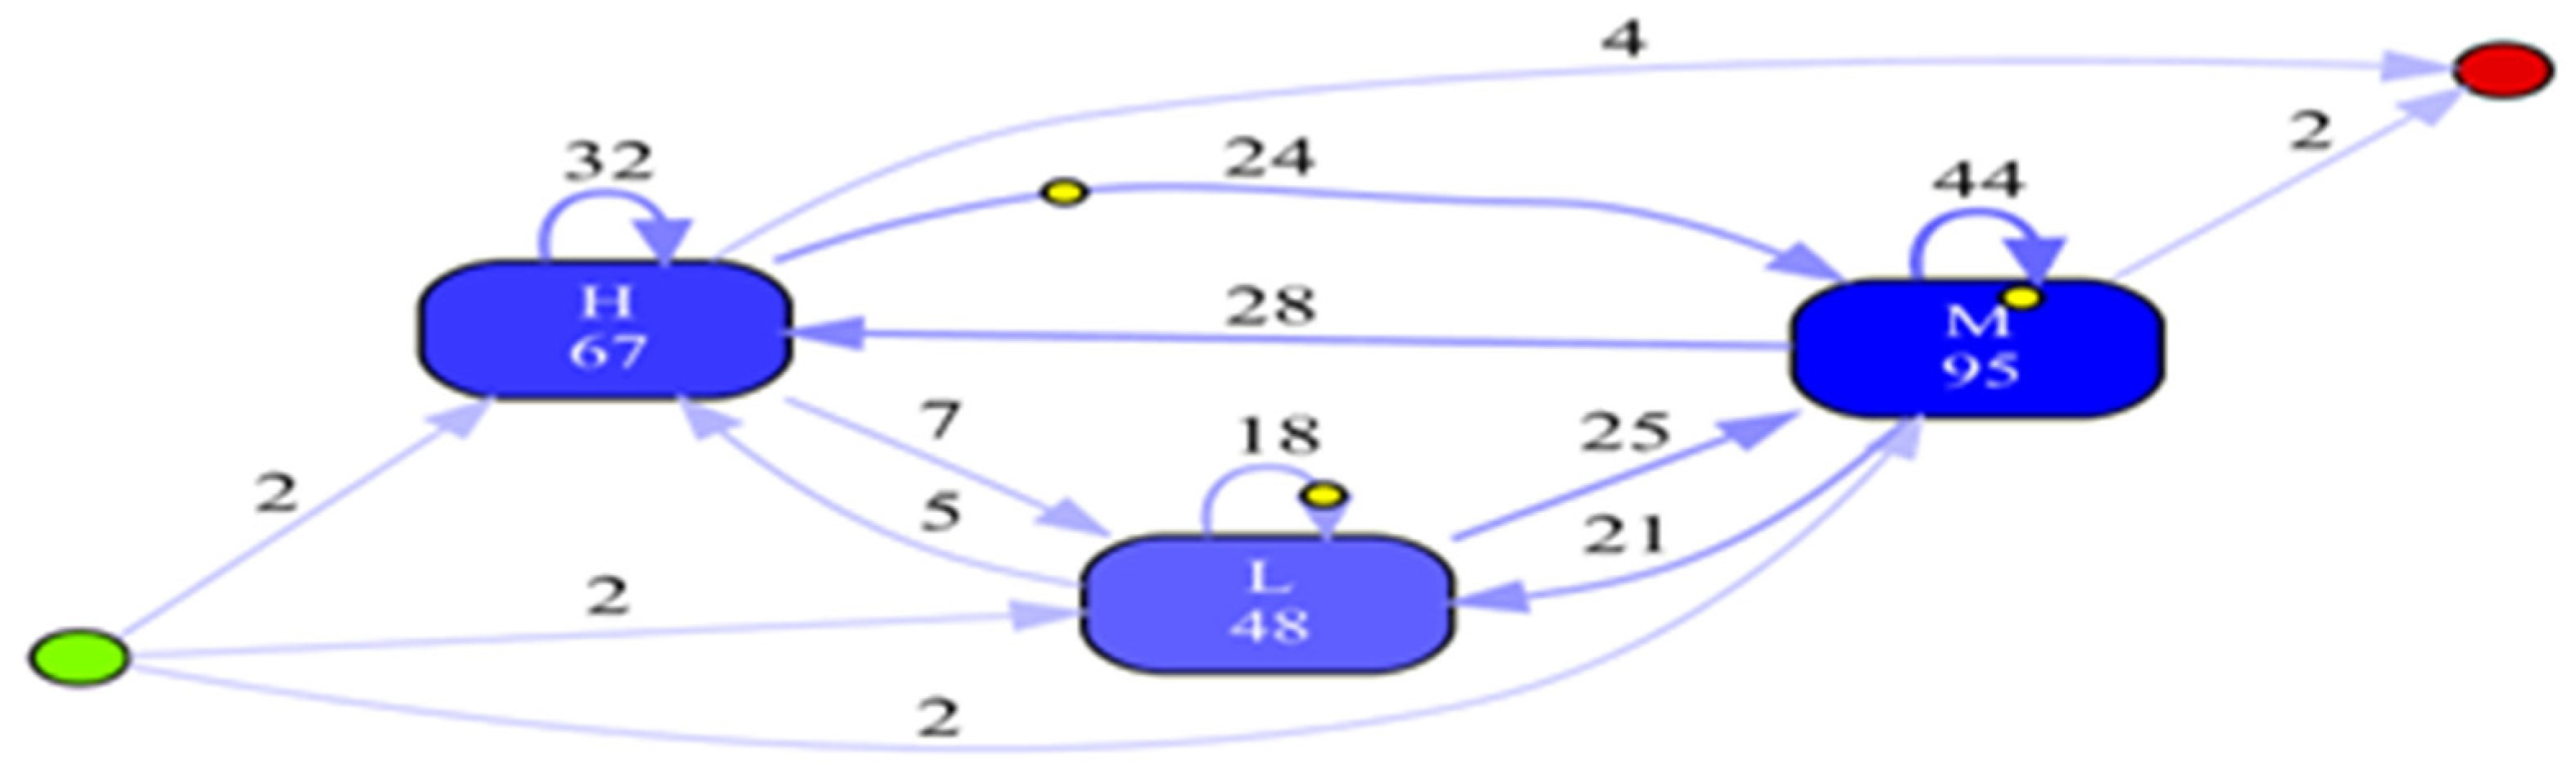
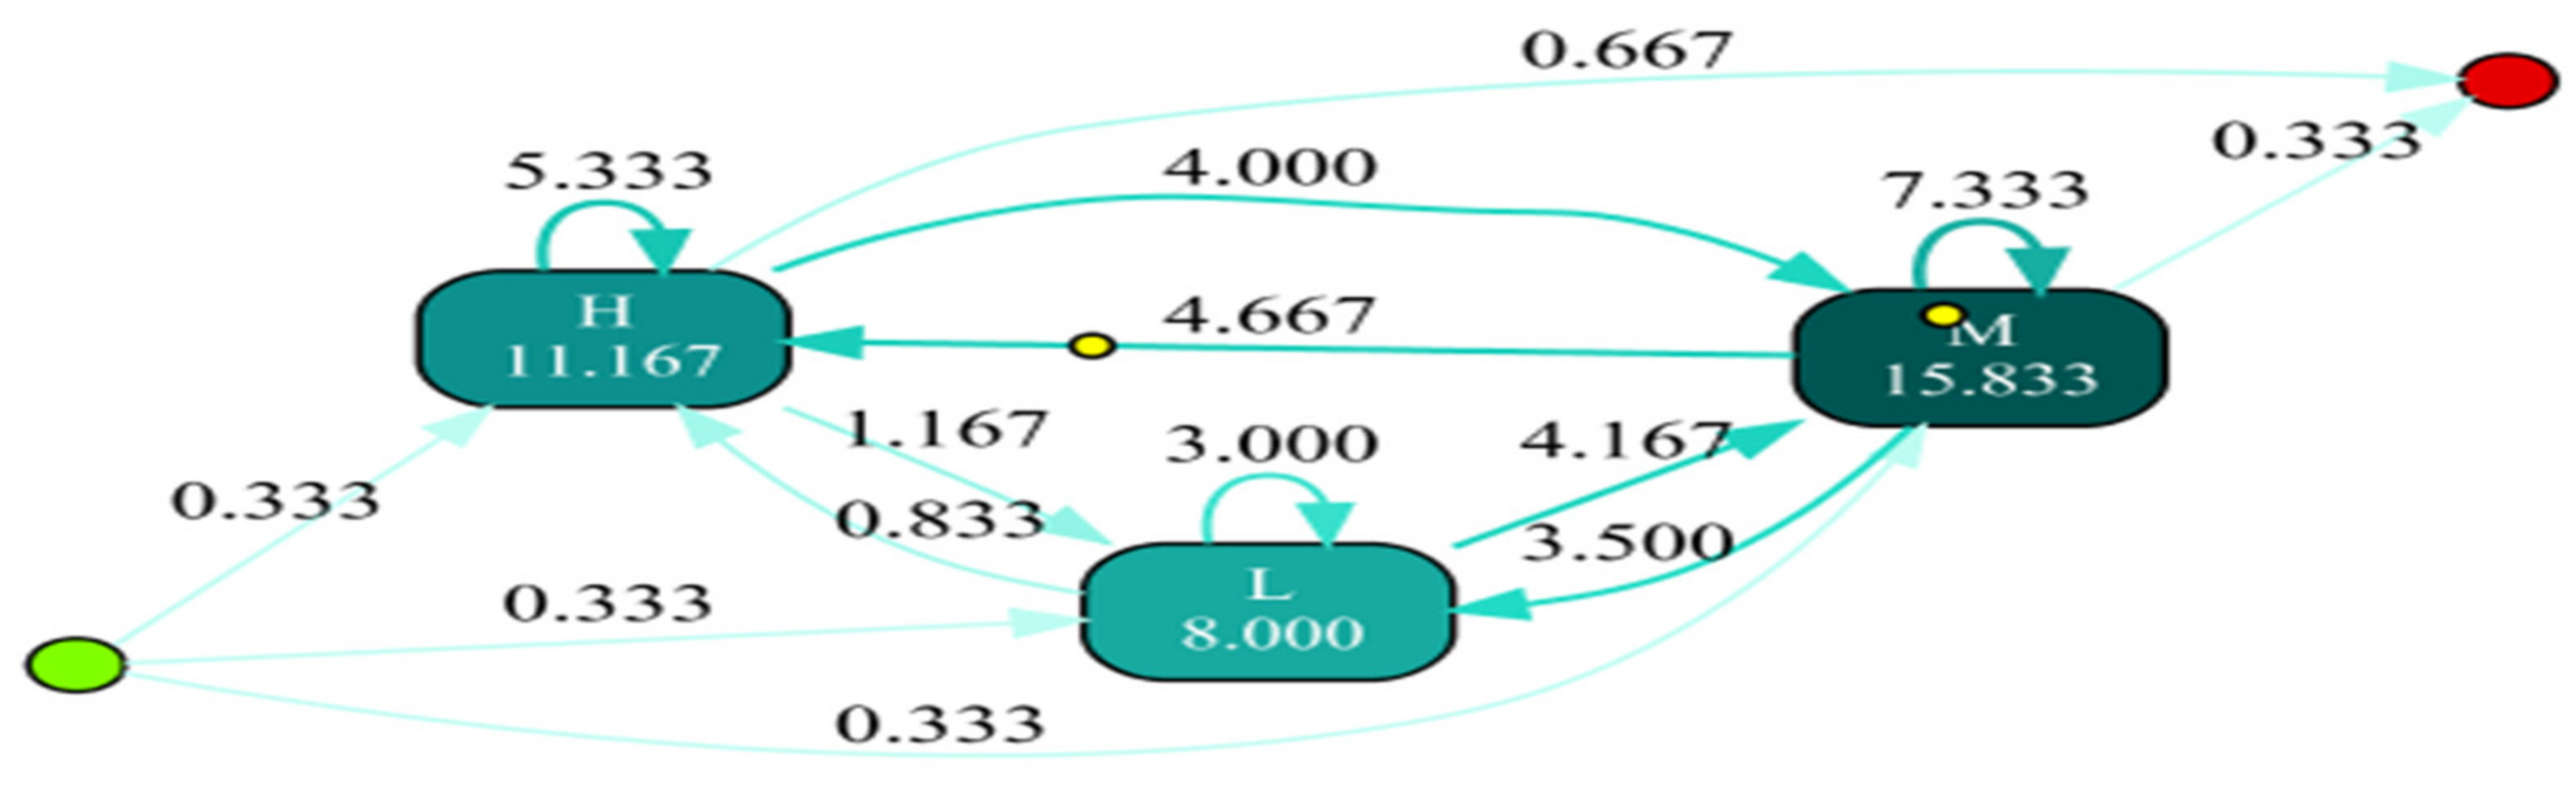
- Experiment 2: Directly Follows visual Miner (DFvM)
- Evaluation Metrics:
- Threats to Validity:
7. Conclusions
Author Contributions
Funding
Institutional Review Board Statement
Informed Consent Statement
Data Availability Statement
Conflicts of Interest
References
- Dutt, A.; Ismail, M.A.; Herawan, T. A Systematic Review on Educational Data Mining. IEEE Access 2017, 5, 15991–16005. [Google Scholar] [CrossRef]
- Romero, C.; Ventura, S. Educational data mining: A survey from 1995 to 2005. Expert Syst. Appl. 2007, 33, 135–146. [Google Scholar] [CrossRef]
- Reimann, P.; Markauskaite, L.; Bannert, M. e-Research and learning theory. Br. J. Educ. Technol. 2014, 45, 528–540. [Google Scholar] [CrossRef]
- Van der Aalst, W. Data Science in Action. In Process Mining; Springer: Berlin/Heidelberg, Germany, 2016; pp. 3–23. [Google Scholar] [CrossRef]
- Pemberton, A.; Moallem, M. The impact of personalized learning on motivation in online learning. In Society for Information Technology & Teacher Education International Conference; Association for the Advancement of Computing in Education (AACE): Waynesville, NC, USA, 2013; pp. 907–914. [Google Scholar]
- Felder, R.M.; Silverman, L.K. Learning and teaching styles in engineering education. Eng. Educ. 1988, 78, 674–681. [Google Scholar]
- Bogarn, A.; Romero, C.; Cerezo, R.; Snchez-Santilln, M. Clustering for improving educational process mining. In Proceedings of the Fourth International Conference on Learning Analytics and Knowledge, Indianapolis, IN, USA, 24–28 March 2014; pp. 11–15. [Google Scholar]
- Reisig, W.; Rozenberg, G. (Eds.) Lectures on Petri Nets I: Basic Models; Lecture Notes in Computer Science; Springer: Berlin/Heidelberg, Germany, 1998; Volume 1491, ISBN 978-3-540-65306-6. [Google Scholar]
- Bogarín, A.; Cerezo, R.; Romero, C. A survey on educational process mining. Wiley Interdiscip. Rev. Data Min. Knowl. Discov. 2017, 8, e1230. [Google Scholar] [CrossRef] [Green Version]
- Van der Aalst, W.M.P. Process Mining: Discovery, Conformance and Enhancement of Business Process; Springer: Berlin/Heidelberg, Germany, 2011; ISBN 978-3-642-19345-3. [Google Scholar]
- Porouhan, P.; Jongsawat, N.; Premchaiswadi, W. Process and deviation exploration through Alpha-algorithm and Heuristic miner techniques. In Proceedings of the 2014 Twelfth International Conference on ICT and Knowledge Engineering, Bangkok, Thailand, 18–21 November 2014; pp. 83–89. [Google Scholar]
- Zhou, X.; Zacharewicz, G.; Chen, D.; Chu, D. A Method for Building Service Process Value Model Based on Process Mining. Appl. Sci. 2020, 10, 7311. [Google Scholar] [CrossRef]
- Martin, N.; De Weerdt, J.; Fernández-Llatas, C.; Gal, A.; Gatta, R.; Ibáñez, G.; Johnson, O.; Mannhardt, F.; Marco-Ruiz, L.; Mertens, S.; et al. Recommendations for enhancing the usability and understandability of process mining in healthcare. Artif. Intell. Med. 2020, 109, 101962. [Google Scholar] [CrossRef]
- Maldonado-Mahauad, J.; Pérez-Sanagustín, M.; Kizilcec, R.F.; Morales, N.; Munoz-Gama, J. Mining theory-based patterns from Big data: Identifying self-regulated learning strategies in Massive Open Online Courses. Comput. Hum. Behav. 2018, 80, 179–196. [Google Scholar] [CrossRef]
- Salazar-Fernandez, J.P.; Sepulveda, M.; Munoz-Gama, J. Influence of student diversity on educational trajectories in engineering high-failure rate courses that lead to late dropout. In Proceedings of the 2019 IEEE Global Engineering Education Conference (EDUCON), Dubai, United Arab Emirates, 8–11 April 2019; pp. 607–616. [Google Scholar]
- Kabra, R.R.; Bichkar, R. Performance Prediction of Engineering Students using Decision Trees. Int. J. Comput. Appl. 2011, 36, 8–12. [Google Scholar]
- Iam-On, N.; Boongoen, T. Generating descriptive model for student dropout: A review of clustering approach. Human-Cent. Comput. Inf. Sci. 2017, 7, 1. [Google Scholar] [CrossRef] [Green Version]
- Jing, L. Data Mining Applications in Higher Education; SPSS Executive Report; SPSS Inc.: Chicago, IL, USA, 2004; Volume 7, pp. 1–20. Available online: http://www.insol.lt/software/modeling/modeler/pdf/Data%20mining%20applications%20in%20higher%20education.pdf (accessed on 8 November 2021).
- Werner, M.; Wiese, M.; Maas, A. Embedding process mining into financial statement audits. Int. J. Account. Inf. Syst. 2021, 41, 100514. [Google Scholar] [CrossRef]
- Hamdan, K.M.; Al-Bashaireh, A.M.; Zahran, Z.; Al-Daghestani, A.; Al-Habashneh, S.; Shaheen, A.M. University students’ interaction, Internet self-efficacy, self-regulation and satisfaction with online education during pandemic crises of COVID-19 (SARS-CoV-2). Int. J. Educ. Manag. 2021, 35, 713–725. [Google Scholar] [CrossRef]
- Viberg, O.; Khalil, M.; Baars, M. Self-regulated learning and learning analytics in online learning environments. In Proceedings of the Tenth International Conference on Learning Analytics & Knowledge, Frankfurt, Germany, 23–27 March 2020; ACM: New York, NY, USA, 2020; pp. 524–533. [Google Scholar]
- Romero, C.; Ventura, S. Educational data mining and learning analytics: An updated survey. WIREs Data Min. Knowl. Discov. 2020, 10, e1355. [Google Scholar] [CrossRef]
- Buijs, J.; Dongen, B.; Aalst, W. On the Role of Fitness, Precision. Generalization and Simplicity in Process Discovery. In On the Move to Meaningful Internet Systems: OTM 2012 Workshops; Meersman, R., Ed.; Lecture Notes in Computer Science; Springer: Berlin/Heidelberg, Germany, 2012; Volume 7565. [Google Scholar] [CrossRef]
- Kas, S.; Post, R.; Wiewel, S. Automated Machine Learning in a Process Mining Context. 2020. Available online: https://icpmconference.org/2020/wp-content/uploads/sites/4/2020/10/ICPM_2020_paper_44.pdf (accessed on 8 November 2021).
- Azeta, A.; Agono, F.; Falade, A.; Azeta, E.; Nwaocha, V. A Digital Twin Framework for Analysing Students’ Behaviours Using Educational Process Mining. 2020, pp. 1–19. Available online: https://www.researchsquare.com/article/rs-51184/v1 (accessed on 8 November 2021).
- Omori, N.J.; Tavares, G.M.; Ceravolo, P., Jr.; Barbon, S. Comparing Concept Drift Detection with Process Mining Software. iSys Revista Brasileira de Sistemas de Informação (Braz. J. Inf. Syst.) 2020, 13, 101–125. [Google Scholar] [CrossRef]
- Okoye, K.; Nganji, J.T.; Hosseini, S. Learning analytics: The role of information technology for educational process innovation. In Proceedings of the International Conference on Bioinspired Computing and Applications (IBICA), Gunupur, India, 16–18 December 2019; AISC 1180. Springer: Cham, Switzerland, 2020; pp. 272–284. [Google Scholar]
- Kurniati, A.P.; Rojas, E.; Hogg, D.; Hall, G.; Johnson, O.A. The assessment of data quality issues for process mining in healthcare using Medical Information Mart for Intensive Care III, a freely available e-health record database. Health Inform. J. 2019, 25, 1878–1893. [Google Scholar] [CrossRef]
- Mukala, P.; Buijs, J.; Leemans, M.; van der Aalst, W. Exploring Students’ Learning Behaviour in MOOCs Using Process Mining Techniques. Computing Conference. 2015, pp. 1–12. Available online: http://bpmcenter.org/wp-content/uploads/reports/2015/BPM-15-10.pdf (accessed on 8 November 2021).
- Hachicha, W.; Ghorbel, L.; Champagnat, R.; Zayani, C.A.; Amous, I. Using Process Mining for Learning Resource Recommendation: A Moodle Case Study. Procedia Comput. Sci. 2021, 192, 853–862. [Google Scholar] [CrossRef]
- Van der Aalst, W. Process mining: Overview and opportunities. ACM Trans. Manag. Inf. Syst. 2012, 3, 1–17. [Google Scholar] [CrossRef]
- Abu Amrieh, E.; Hamtini, T.; Aljarah, I. Preprocessing and analyzing educational data set using X-API for improving student’s performance. In Proceedings of the 2015 IEEE Jordan Conference on Applied Electrical Engineering and Computing Technologies (AEECT), Amman, Jordan, 3–5 November 2015; pp. 1–5. [Google Scholar] [CrossRef]
- Madnaik, S.S. Predicting Students’ Performance by Learning Analytics. Master’s Projects. 2020. Available online: https://scholarworks.sjsu.edu/etd_projects/941 (accessed on 8 November 2021).
- Abu Amrieh, E.; Hamtini, T.; Aljarah, I. Mining educational data to predict student’s academic performance using ensemble methods. Int. J. Database Theory Appl. 2016, 9, 119–136. [Google Scholar] [CrossRef]
- Bharara, S.; Sabitha, A.S.; Bansal, A. Application of learning analytics using clustering data Mining for Students’ disposition analysis. Educ. Inf. Technol. 2018, 23, 957–984. [Google Scholar] [CrossRef]
- Van der Aalst, W.; Weijters, A.T.; Maruster, L.L. Workflow mining: Discovering process models from event logs. IEEE Trans. Knowl. Data Eng. 2004, 16, 1128–1142. [Google Scholar] [CrossRef]
- Bogarín, A.; Cerezo, R.; Romero, C. Discovering learning processes using Inductive Miner: A case study with Learning Management Systems (LMSs). Psicothema 2018, 30, 322–329. [Google Scholar] [CrossRef] [PubMed]
- Leemans, S.J.J.; Fahland, D.; van der Aalst, W.M.P. Discovering Block-Structured Process Models from Event Logs Containing Infrequent Behaviour. In Business Process Management Workshops. BPM 2013. Lecture Notes in Business Information Processing; Lohmann, N., Song, M., Wohed, P., Eds.; Springer: Cham, Switzerland, 2014; Volume 171. [Google Scholar] [CrossRef]
- Nuritha, I.; Mahendrawathi, E. Structural Similarity Measurement of Business Process Model to Compare Heuristic and Inductive Miner Algorithms Performance in Dealing with Noise. Procedia Comput. Sci. 2017, 124, 255–263. [Google Scholar] [CrossRef]
- Naderifar, V.; Sahran, S.; Shukur, Z. A Review on Conformance Checking Technique for the Evaluation of Process Mining Algorithm. TEM J. 2019, 8, 1232–1241. [Google Scholar] [CrossRef]
- Dixit, P.M.; Verbeek, H.M.W.; Buijs, J.C.A.M.; van der Aalst, W.M.P. Interactive data-driven process model construction. In Conceptual Modeling—37th International Conference, ER 2018, Proceedings, Xi’an, China, 22–25 October 2018; Du, X., Li, G., Li, Z., Trujillo, J.C., Ling, T.W., Davis, K.C., Lee, M.L., Eds.; Lecture Notes in Computer Science (including Subseries Lecture Notes in Artificial Intelligence and Lecture Notes in Bioinformatics); Springer: Cham, Switzerland, 2018; pp. 251–265. [Google Scholar]
- Leemans, S.J.; Poppe, E.; Wynn, M.T. Directly Follows-Based Process Mining: Exploration & a Case Study. In Proceedings of the 2019 International Conference on Process Mining (ICPM), Aachen, Germany, 24–26 June 2019; pp. 25–32. [Google Scholar] [CrossRef]


| Feature Number | Feature Characteristics | Type | |
|---|---|---|---|
| 1 | Gender | Male, Female | nominal |
| 2 | Nationality | Kuwait, Lebanon, Egypt, Saudi Arabia, USA, Jordan, Venezuela, Iran, Tunis, Morocco, Syria, Palestine, Iraq, Libya | nominal |
| 3 | Place of birth | nominal | |
| 4 | Educational stage | Lower level, Middle School, High School | nominal |
| 5 | Grade level | 12 grades ranging from G-01 to G-12 | nominal |
| 6 | Section ID | Section-A, B, C | nominal |
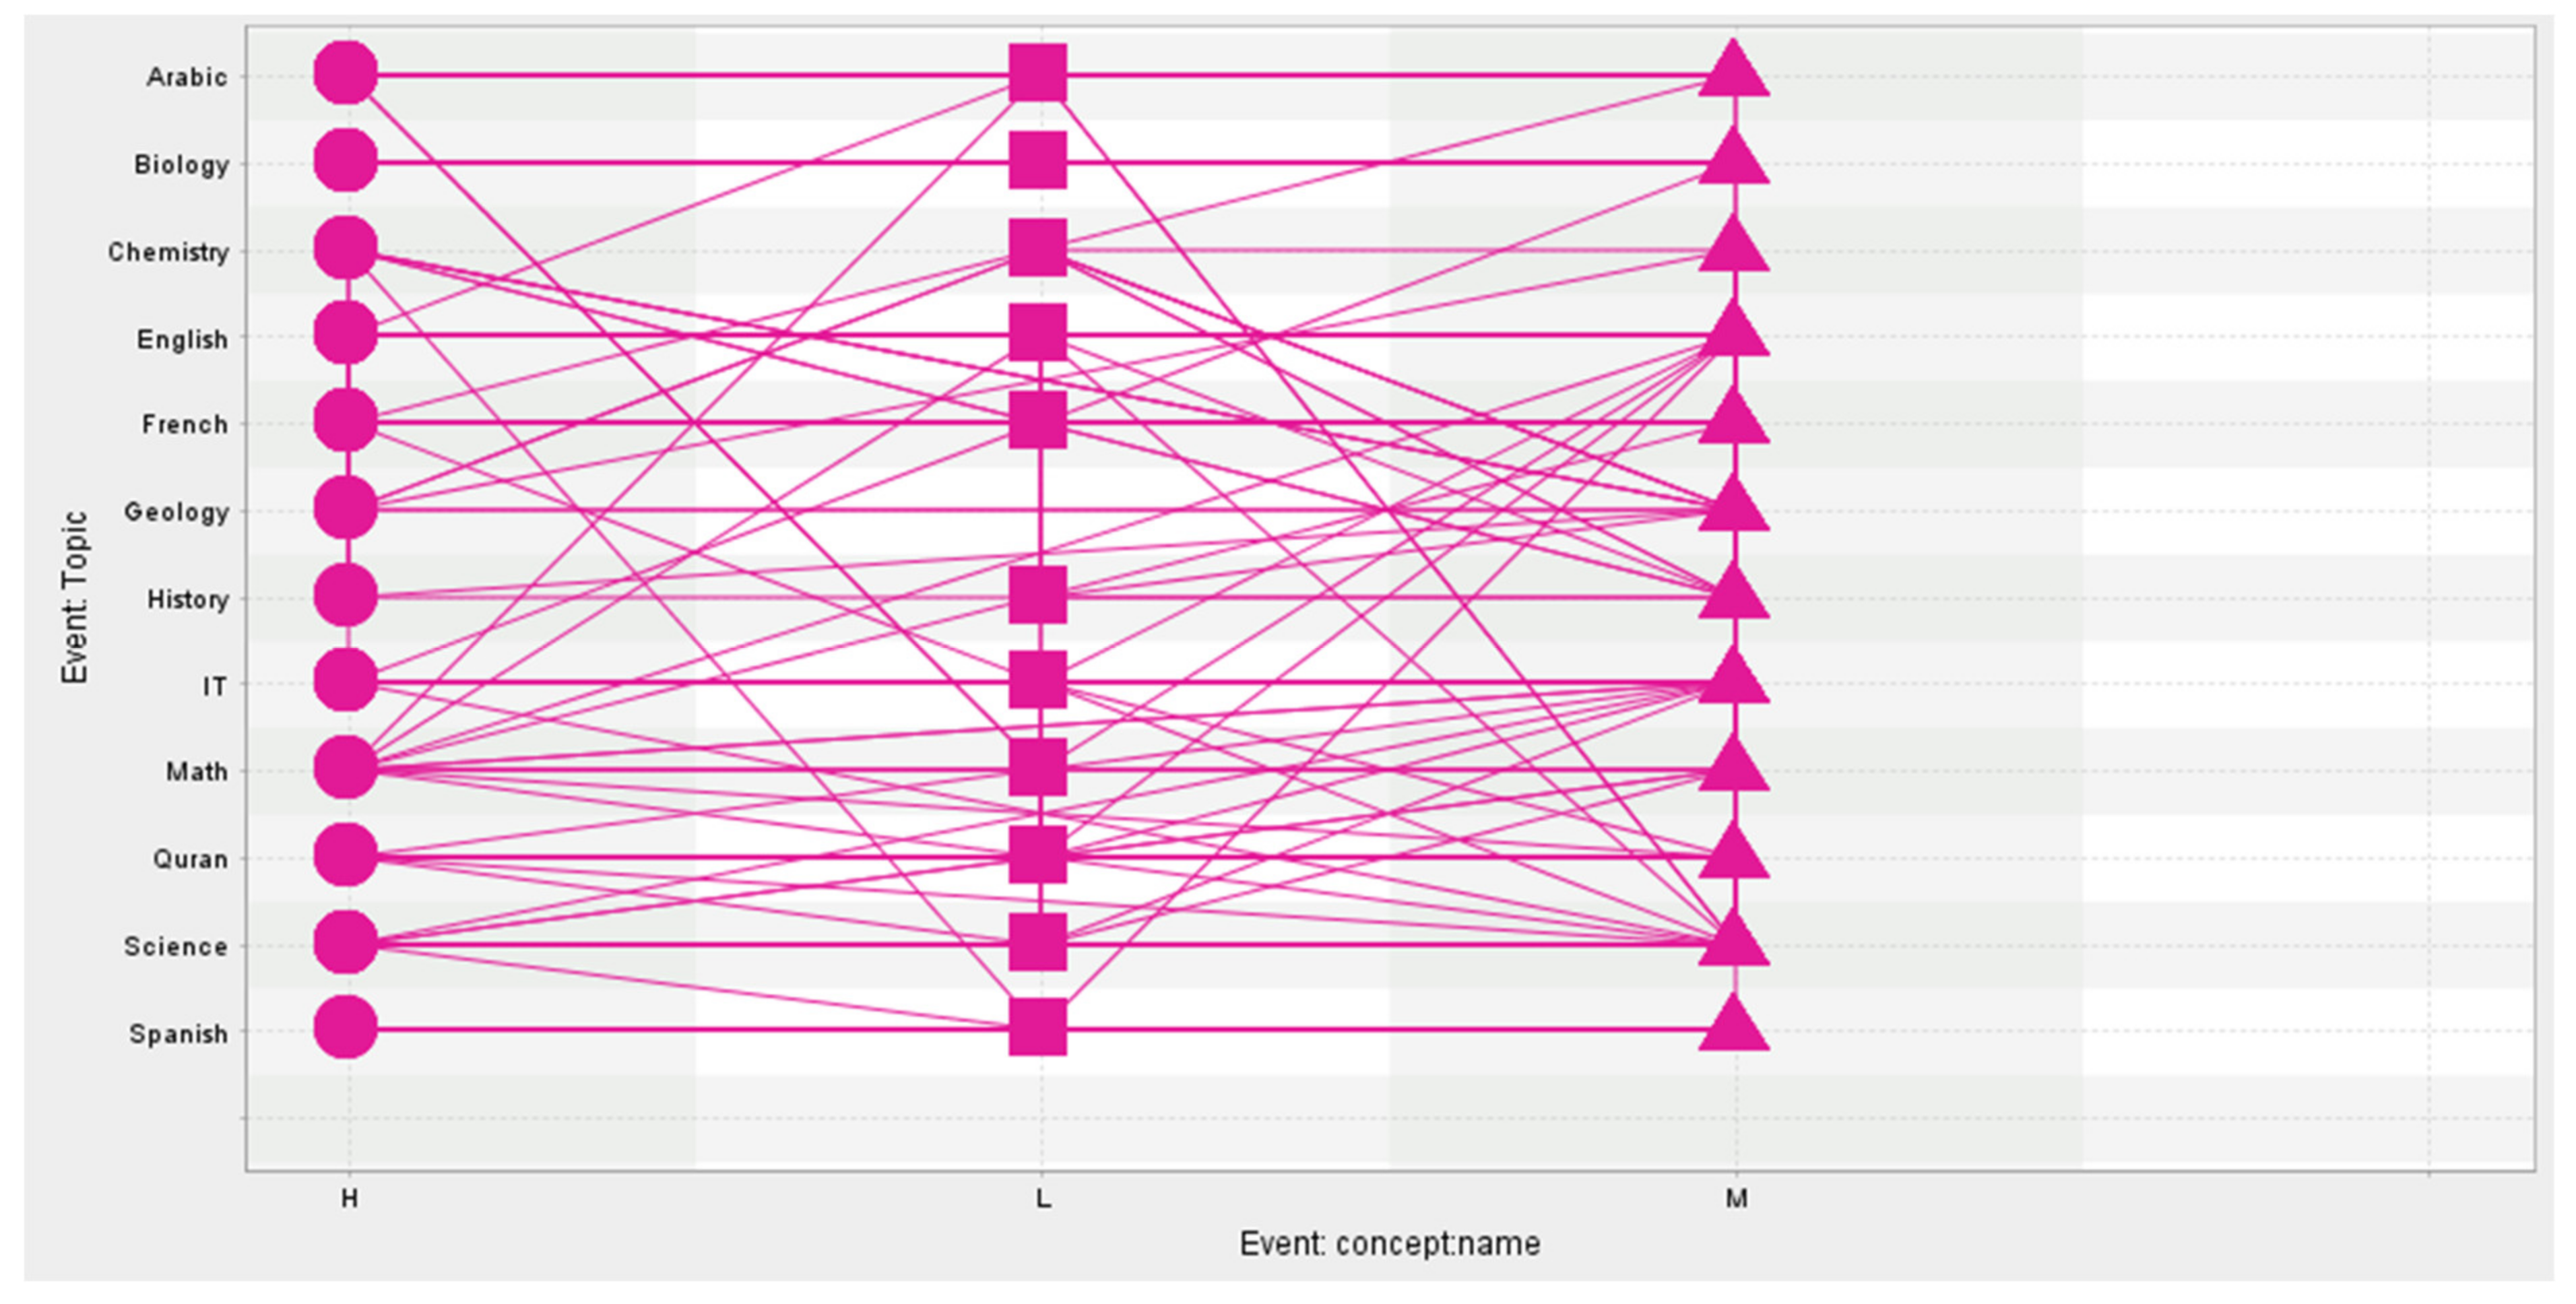
| 7 | Topic | English, Spanish, French, Arabic, IT, Math, Chemistry, Biology, Science, History, Quran, Geology | nominal |
| 8 | Semester | First/Second | nominal |
| 9 | Parent responsible for the student | Mother/Father | nominal |
| 10 | Number of times the student raises their hand during class | (0, 1, 2, … 100) | discrete |
| 11 | Visited resources | 0, 1, 2, … 100 | discrete |
| 12 | Viewing announcements: the number of times the student checks the new announcements | 0, 1, 2, … 100 | discrete |
| 13 | Discussion groups: the number of times the student participates in a discussion | 0, 1, 2, … 100 | discrete |
| 14 | Parents Answering Survey | Yes/No | nominal |
| 15 | Parent satisfaction with the school | Yes/No | nominal |
| 16 | Days the student is absent | Above 7/under 7 | nominal |
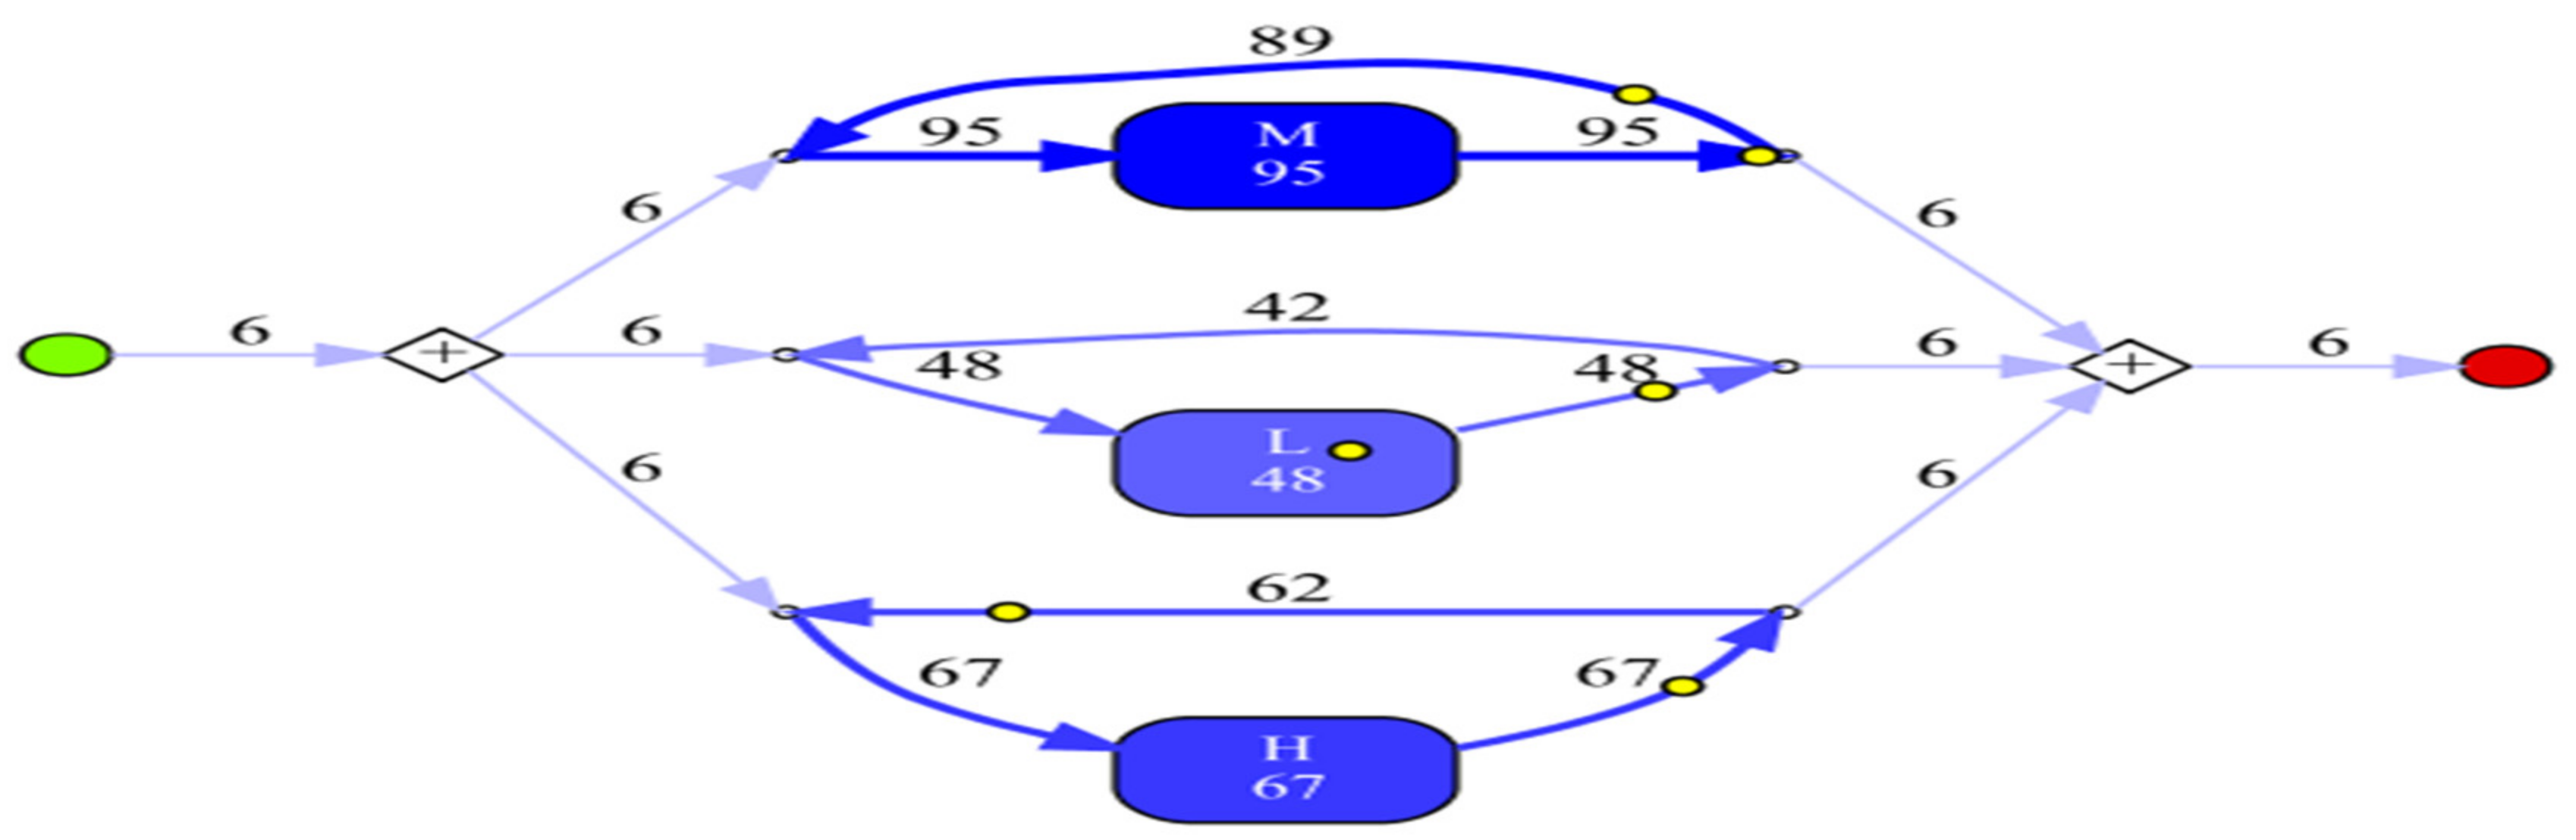
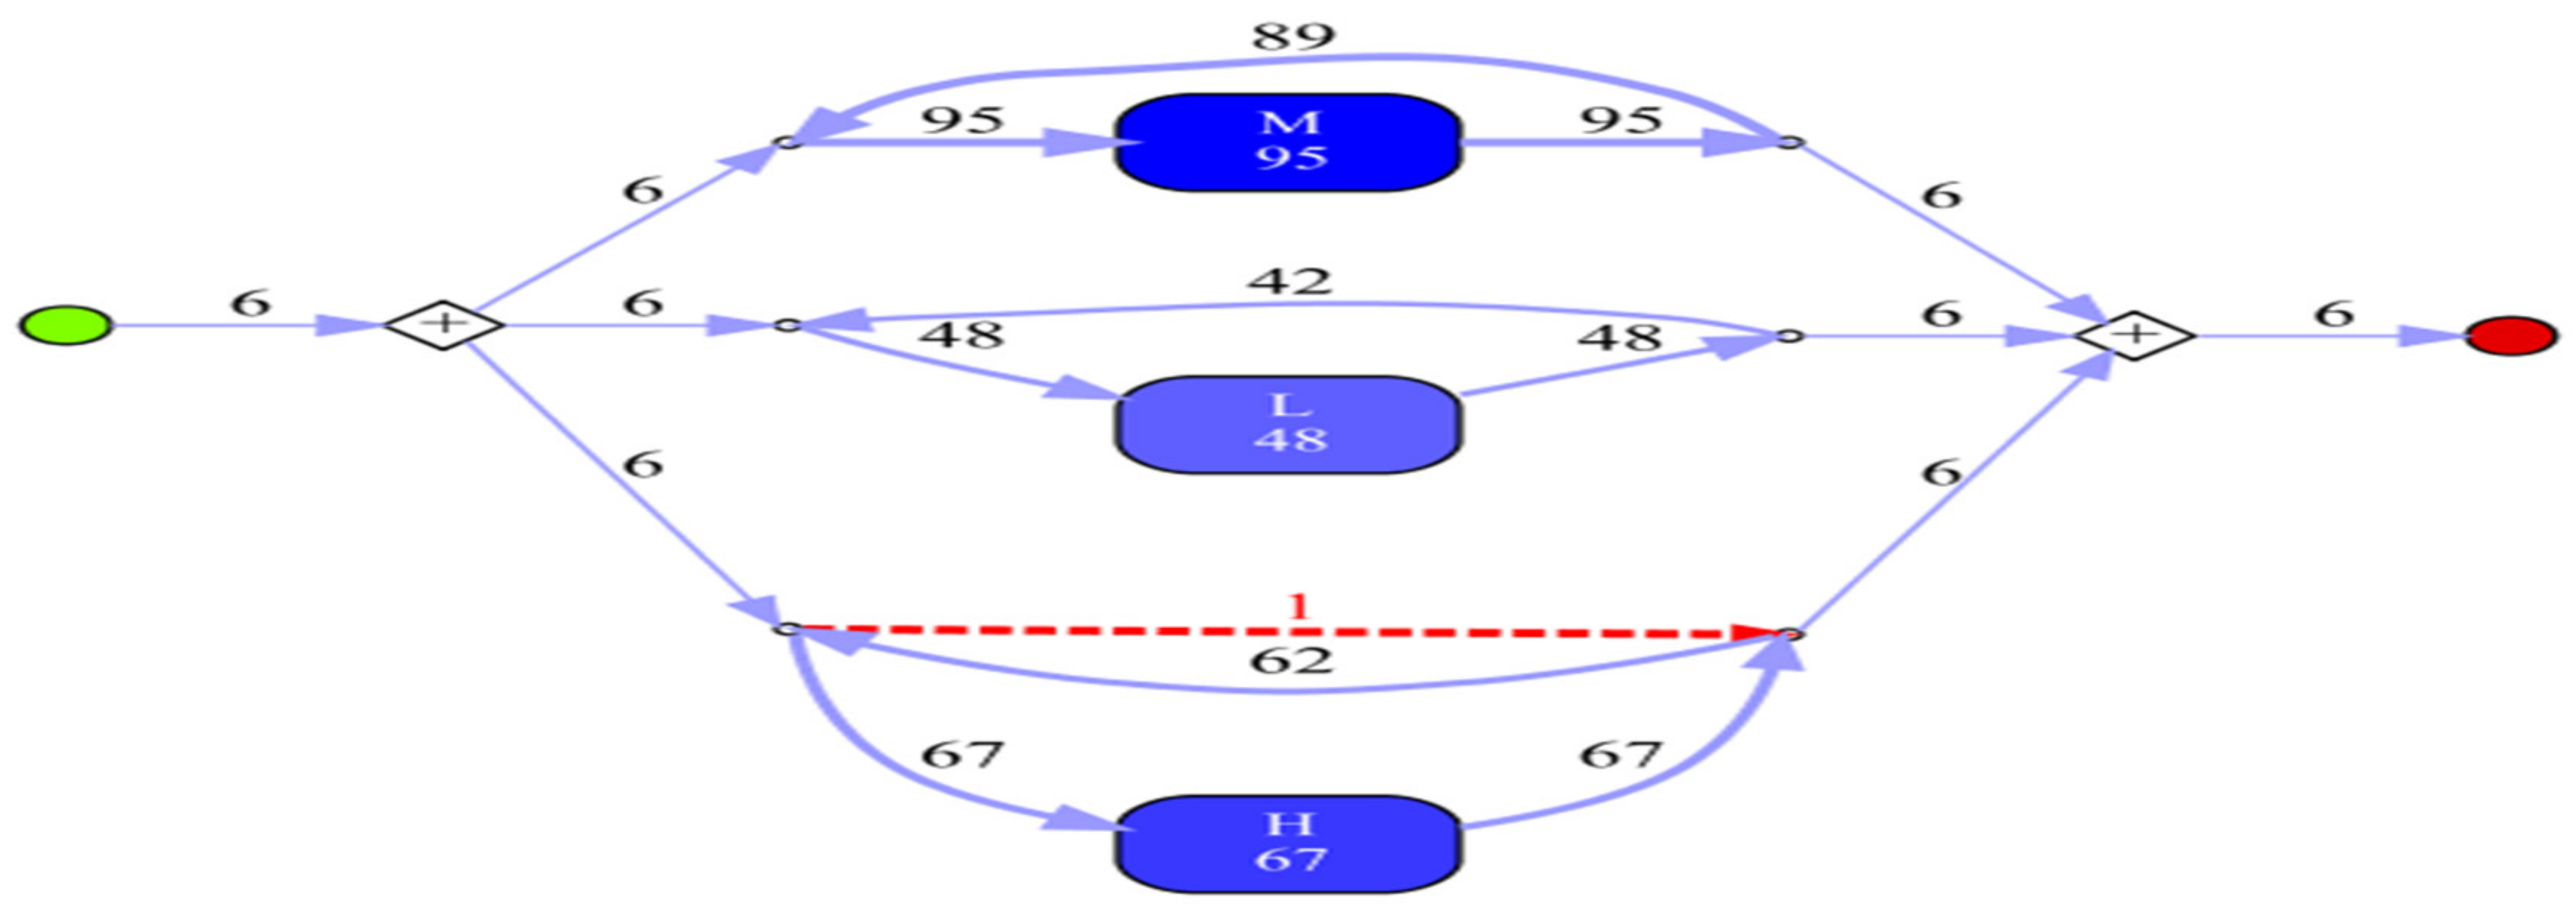
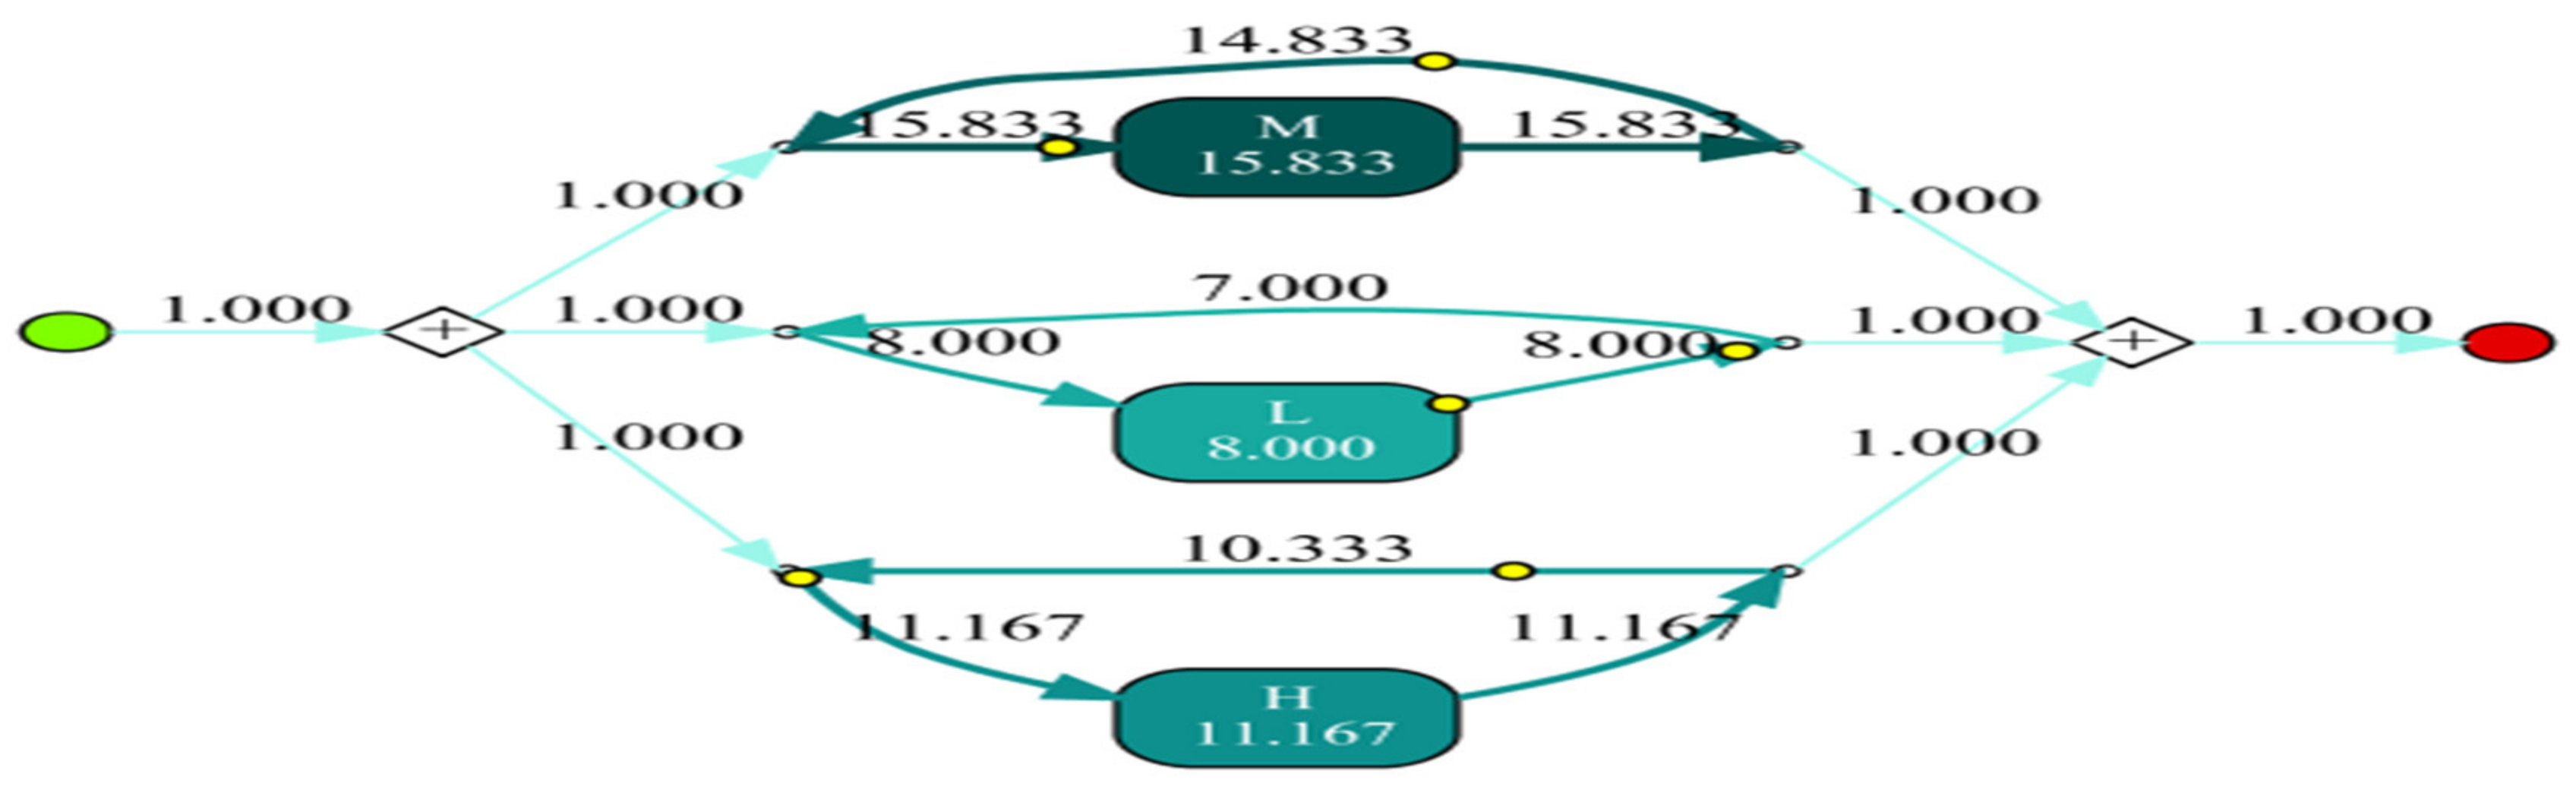
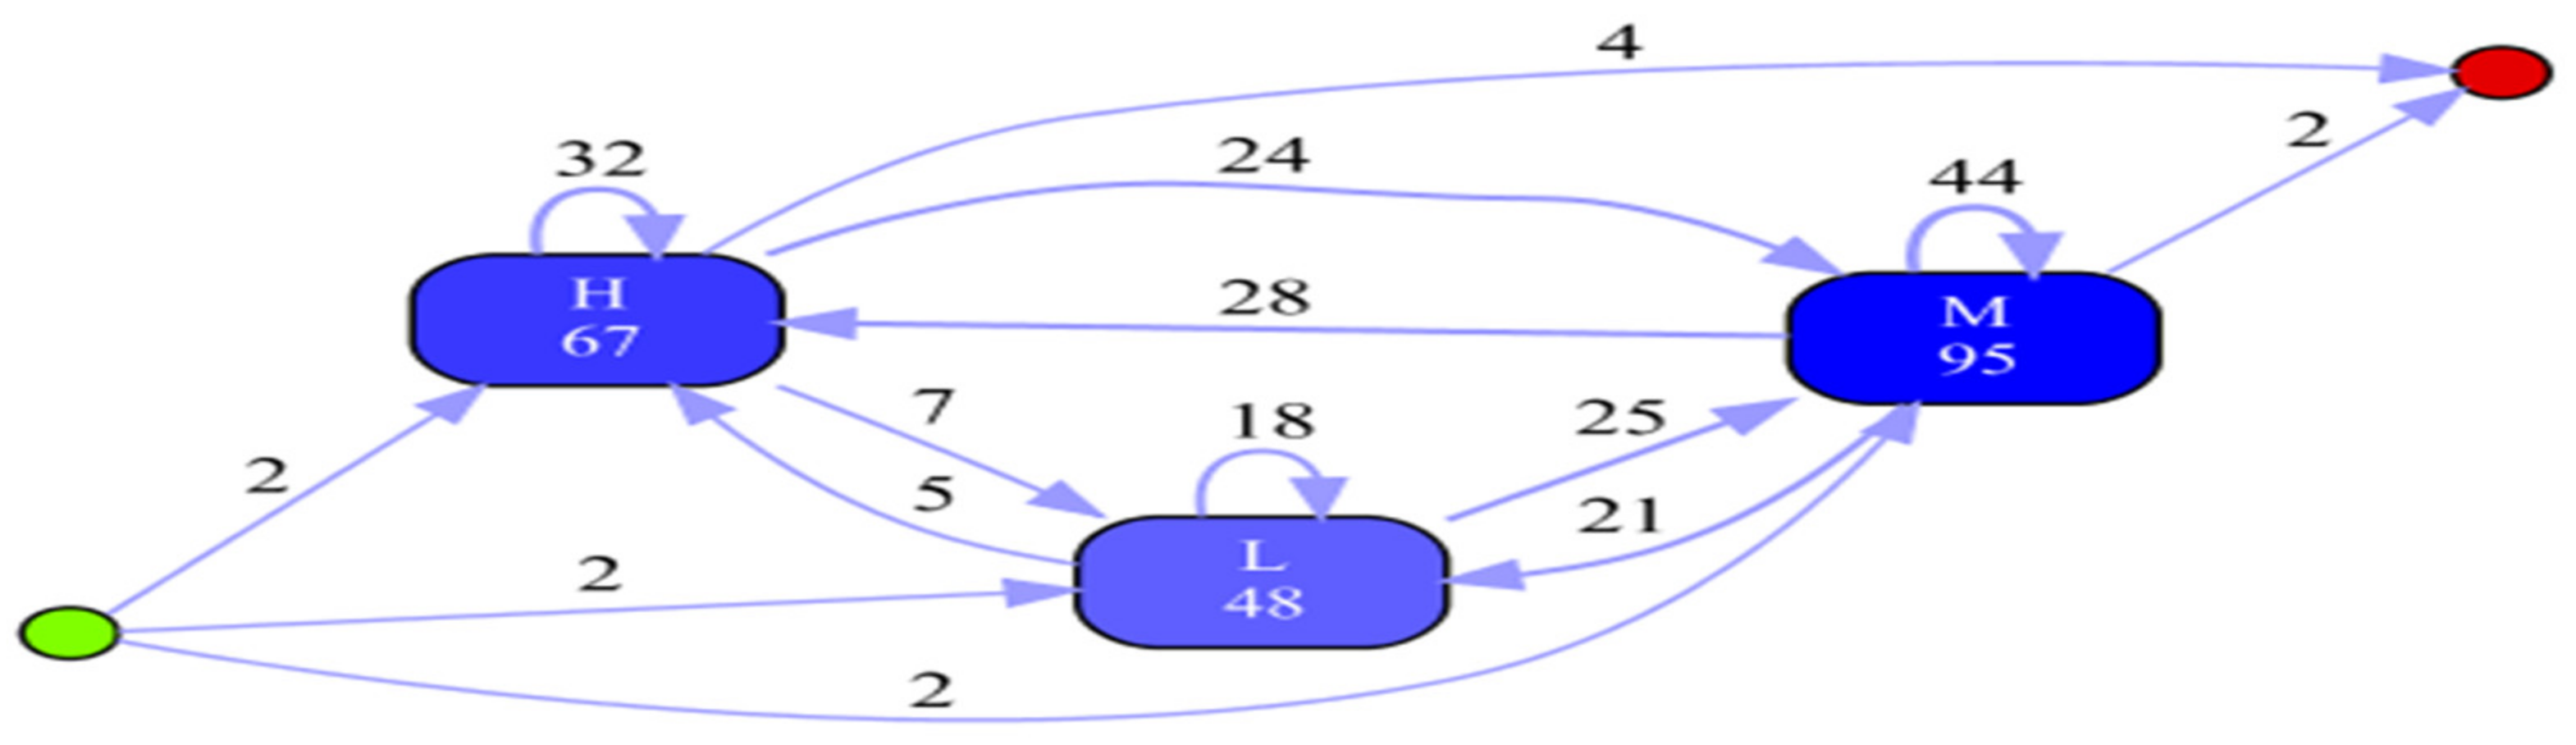
| Total Number of Process Instances: 6; Total Number of Events: 210 All Events | ||
|---|---|---|
| Total number of classes: 3 Class | Absolute occurrences | Relative occurrences |
| M | 95 | 45.238% |
| H | 67 | 31.905% |
| L | 48 | 22.857% |
| Start events | ||
| Total number of classes: 3 Class | Absolute occurrences | Relative occurrences |
| H | 2 | 33.333% |
| L | 2 | 33.333% |
| M | 2 | 33.333% |
| End Events | ||
| Total number of classes: 2 Class | Occurrences (absolute) | Occurrences (relative) |
| H | 4 | 66.667% |
| M | 2 | 33.333% |
| Event Classes Defined by (Event Name AND Lifecycle Transition) All Events | ||
|---|---|---|
| Total number of classes: 3 Class | Absolute occurrences | Relative occurrences |
| M + complete | 95 | 45.238% |
| H + complete | 67 | 31.905% |
| L + complete | 48 | 22.857% |
| Start events | ||
| Total number of classes: 3 Class | Absolute occurrences | Relative occurrences |
| H + complete | 2 | 33.333% |
| L + complete | 2 | 33.333% |
| M + complete | 2 | 33.333% |
| End Events | ||
| Total number of classes: 2 Class | Occurrences (absolute) | Occurrences (relative) |
| H + complete | 4 | 66.667% |
| M + complete | 2 | 33.333% |
| Event Logs | Algorithms | Fitness or Recall | Precision | F1 Score | Execution Time in Sec | Soundness |
|---|---|---|---|---|---|---|
| X-API learning analytics dataset | IvM | 0.986 | 1 | 0.993 | random | yes |
| DFvM | 1 | 1 | 1 | random | yes |
Publisher’s Note: MDPI stays neutral with regard to jurisdictional claims in published maps and institutional affiliations. |
© 2022 by the authors. Licensee MDPI, Basel, Switzerland. This article is an open access article distributed under the terms and conditions of the Creative Commons Attribution (CC BY) license (https://creativecommons.org/licenses/by/4.0/).
Share and Cite
AlQaheri, H.; Panda, M. An Education Process Mining Framework: Unveiling Meaningful Information for Understanding Students’ Learning Behavior and Improving Teaching Quality. Information 2022, 13, 29. https://doi.org/10.3390/info13010029
AlQaheri H, Panda M. An Education Process Mining Framework: Unveiling Meaningful Information for Understanding Students’ Learning Behavior and Improving Teaching Quality. Information. 2022; 13(1):29. https://doi.org/10.3390/info13010029
Chicago/Turabian StyleAlQaheri, Hameed, and Mrutyunjaya Panda. 2022. "An Education Process Mining Framework: Unveiling Meaningful Information for Understanding Students’ Learning Behavior and Improving Teaching Quality" Information 13, no. 1: 29. https://doi.org/10.3390/info13010029
APA StyleAlQaheri, H., & Panda, M. (2022). An Education Process Mining Framework: Unveiling Meaningful Information for Understanding Students’ Learning Behavior and Improving Teaching Quality. Information, 13(1), 29. https://doi.org/10.3390/info13010029