
Linguistic Mathematical Relationships Saved or Lost in Translating Texts: Extension of the Statistical Theory of Translation and Its Application to the New Testament


Abstract
:1. Introduction
1.1. General Features of the Statistical Theory of Language Translation
1.2. Machine Translation and Its Vast Literature
1.3. Purpose and Outilne of the Present Paper
2. Review and Extension of the Statistical Theory of Language Translation to Texts Written in the Same Language
2.1. Mathematical Theory
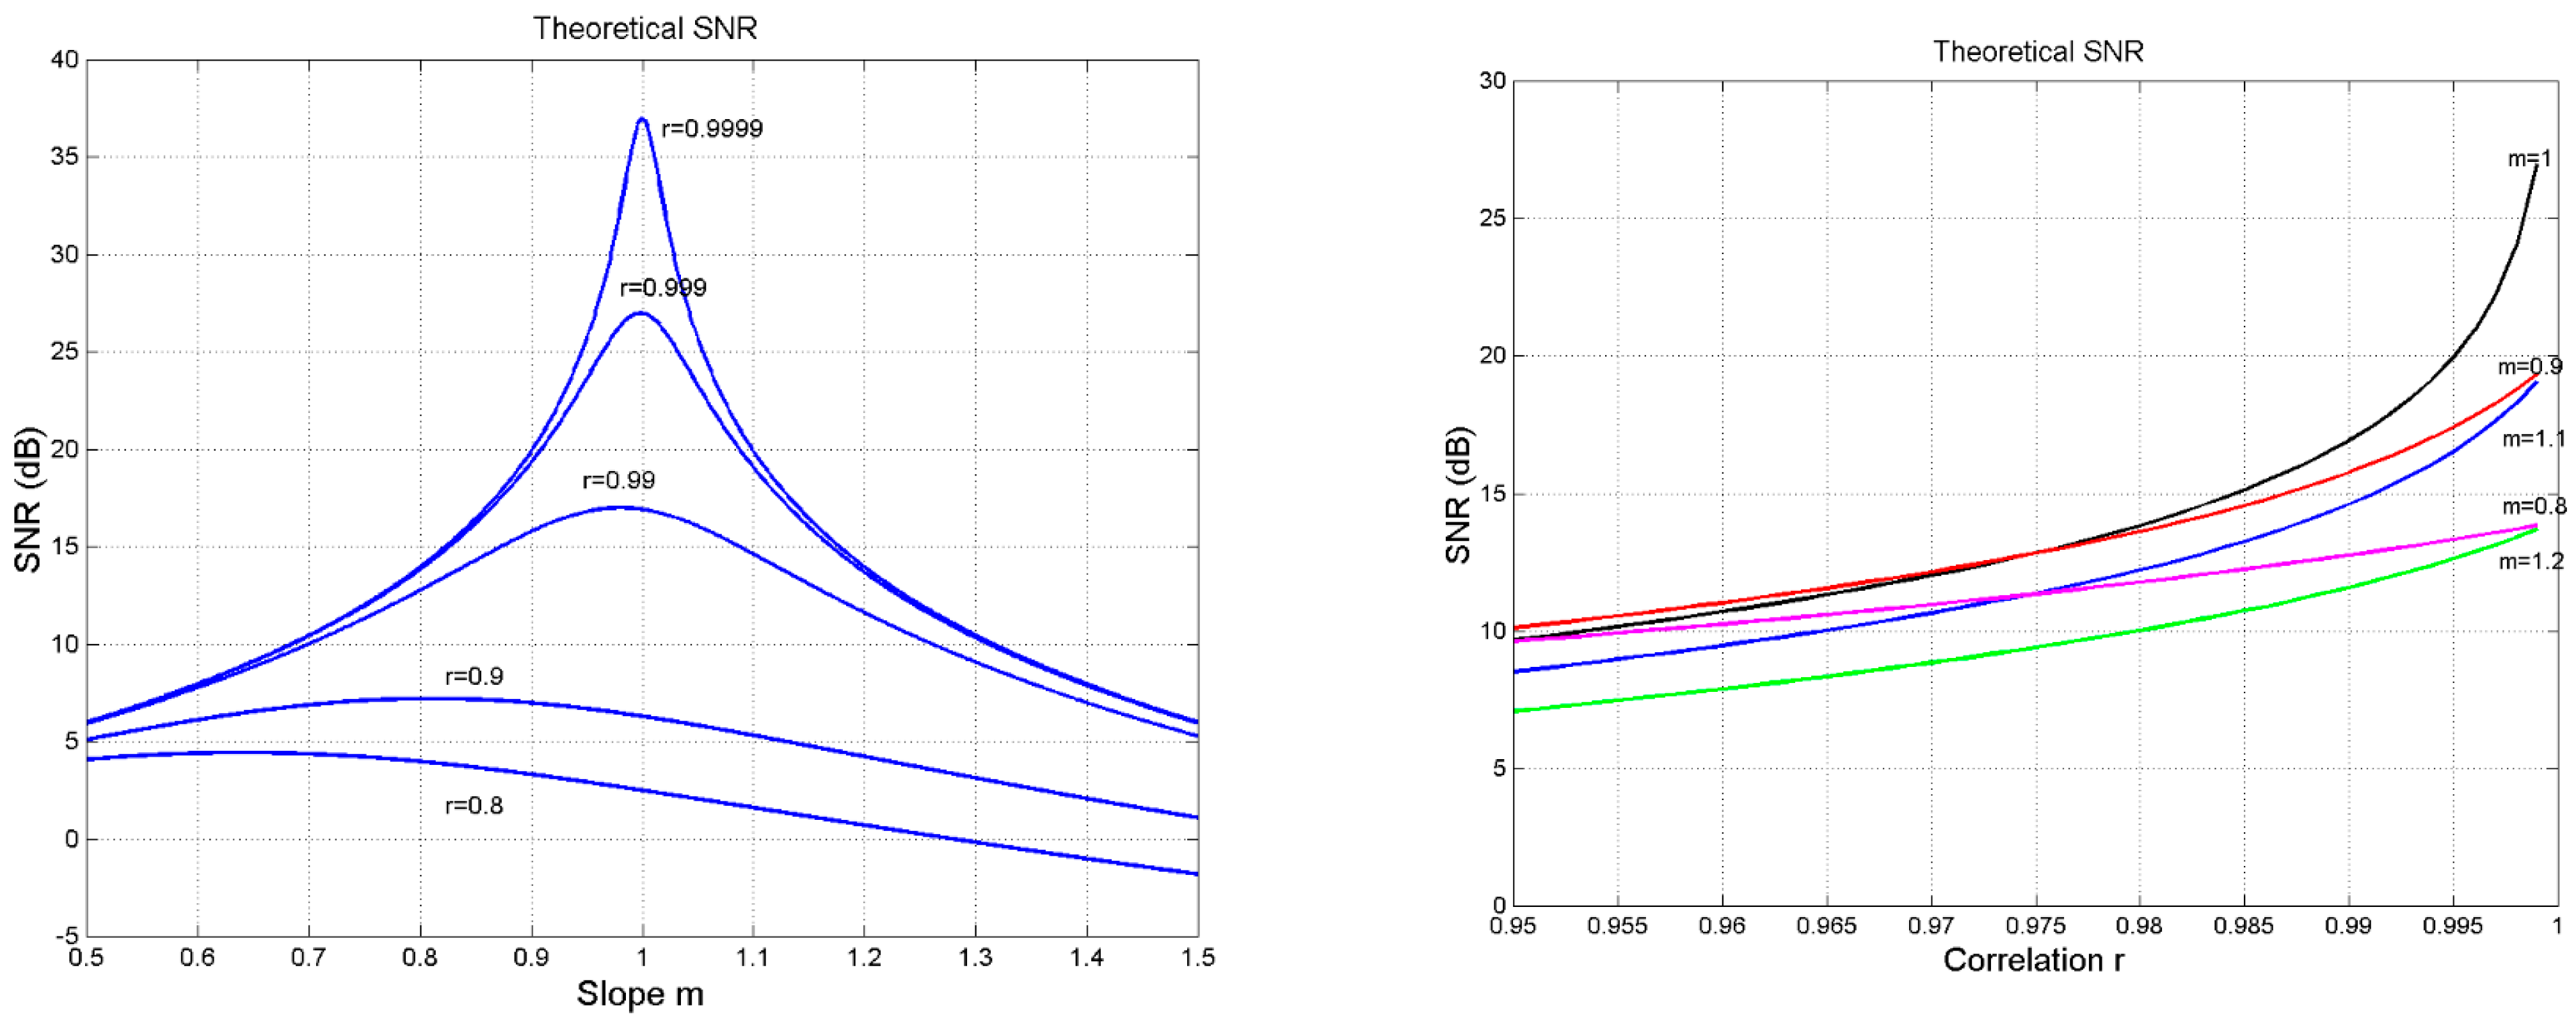
2.2. Sensitivity of the Signal-to-Noise Ratio to Input Parameters
- As , , when . In this region, changes vary rapidly as small variations in give very large variations in (left panel).
- As , for the values of shown, is practically a constant (right panel).
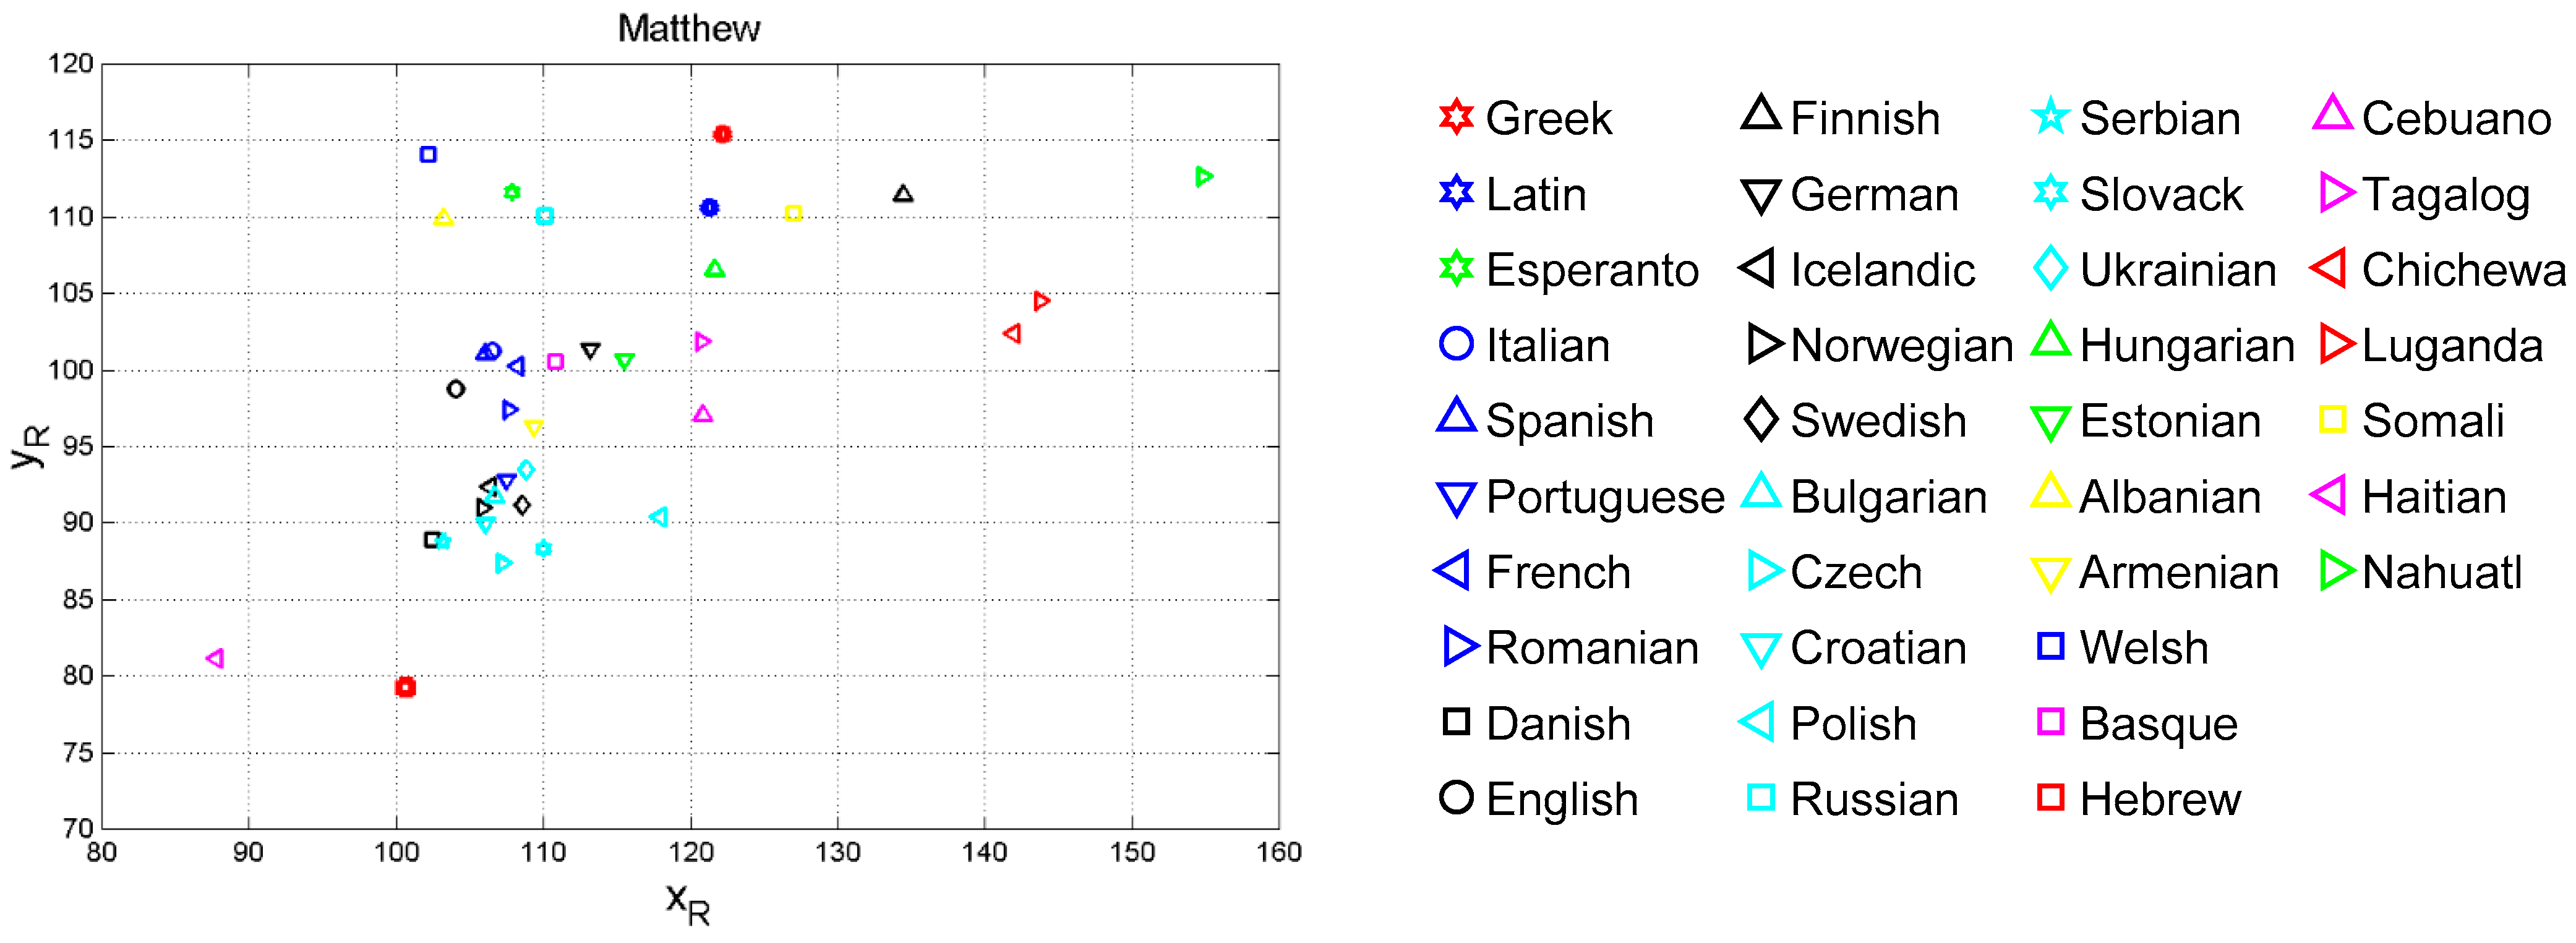
3. Vector Analysis of Translations Based on Deep-Language Variables
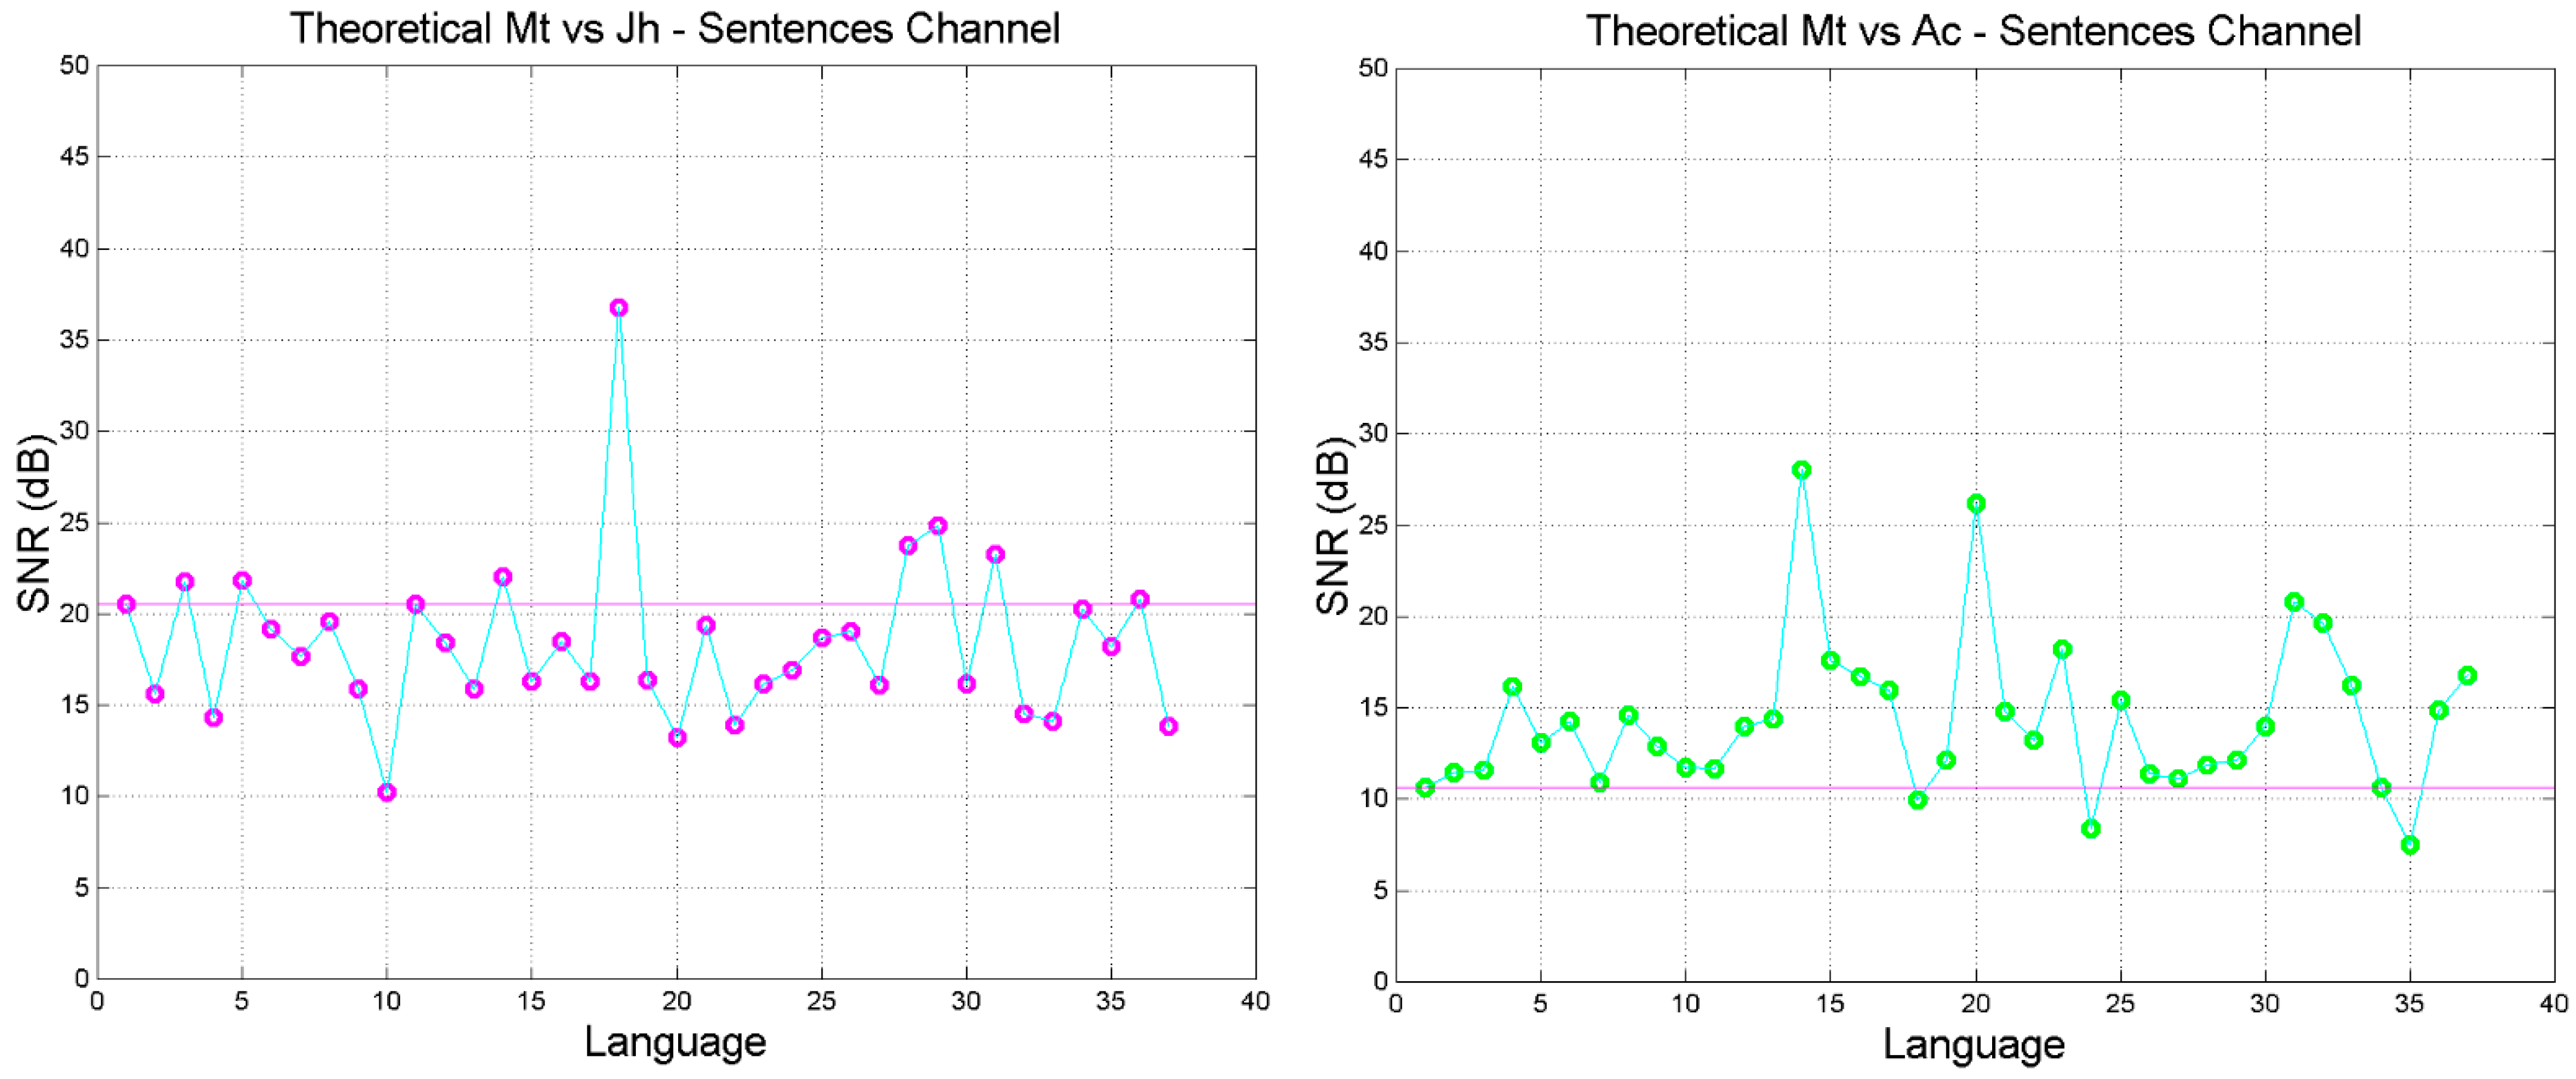
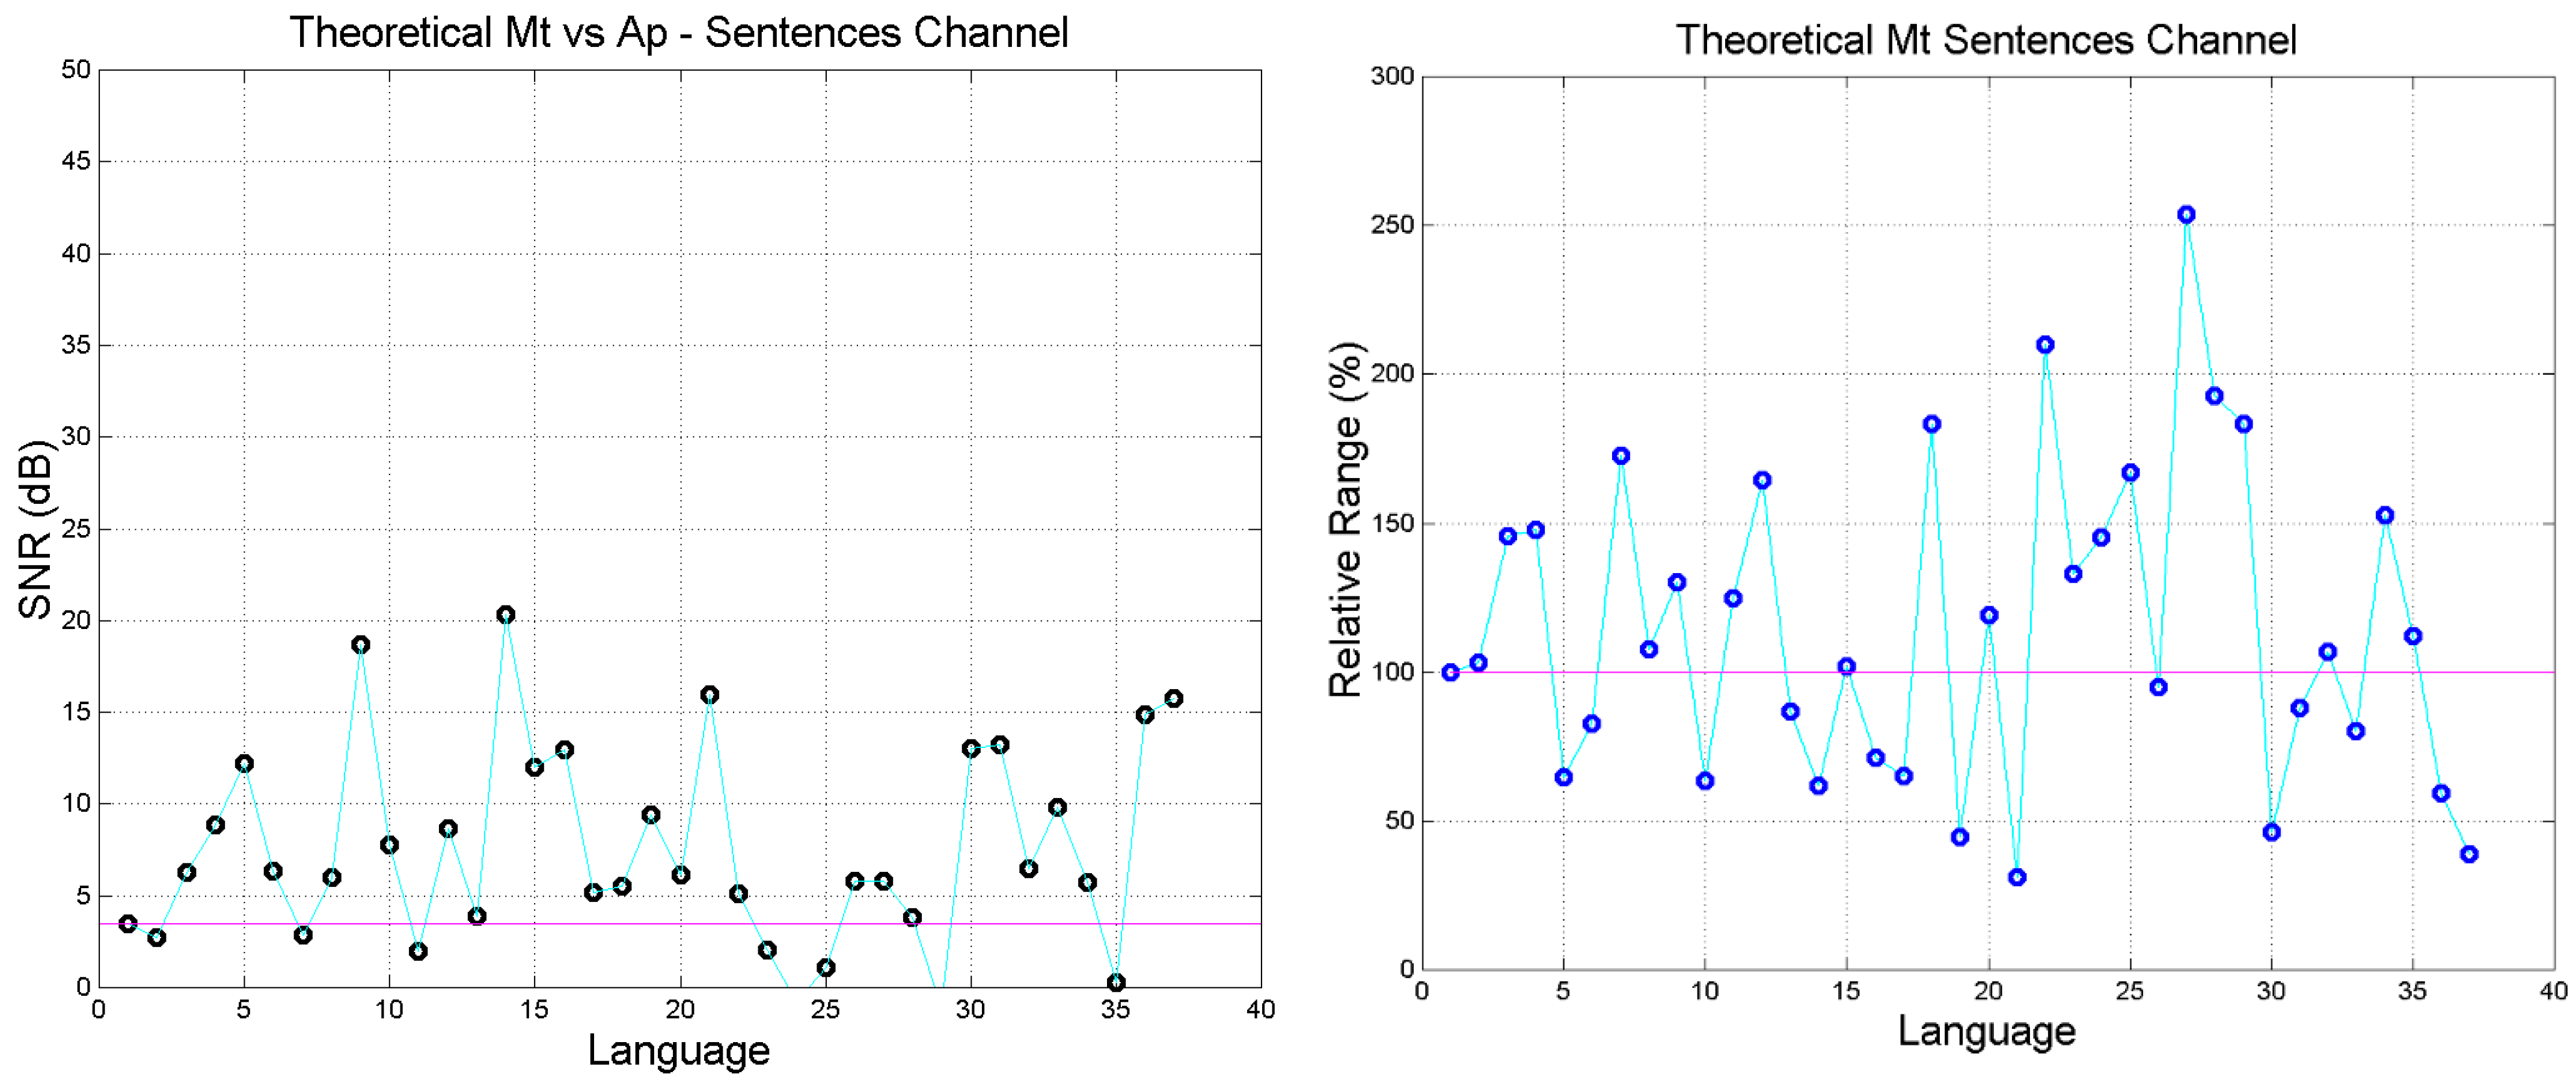
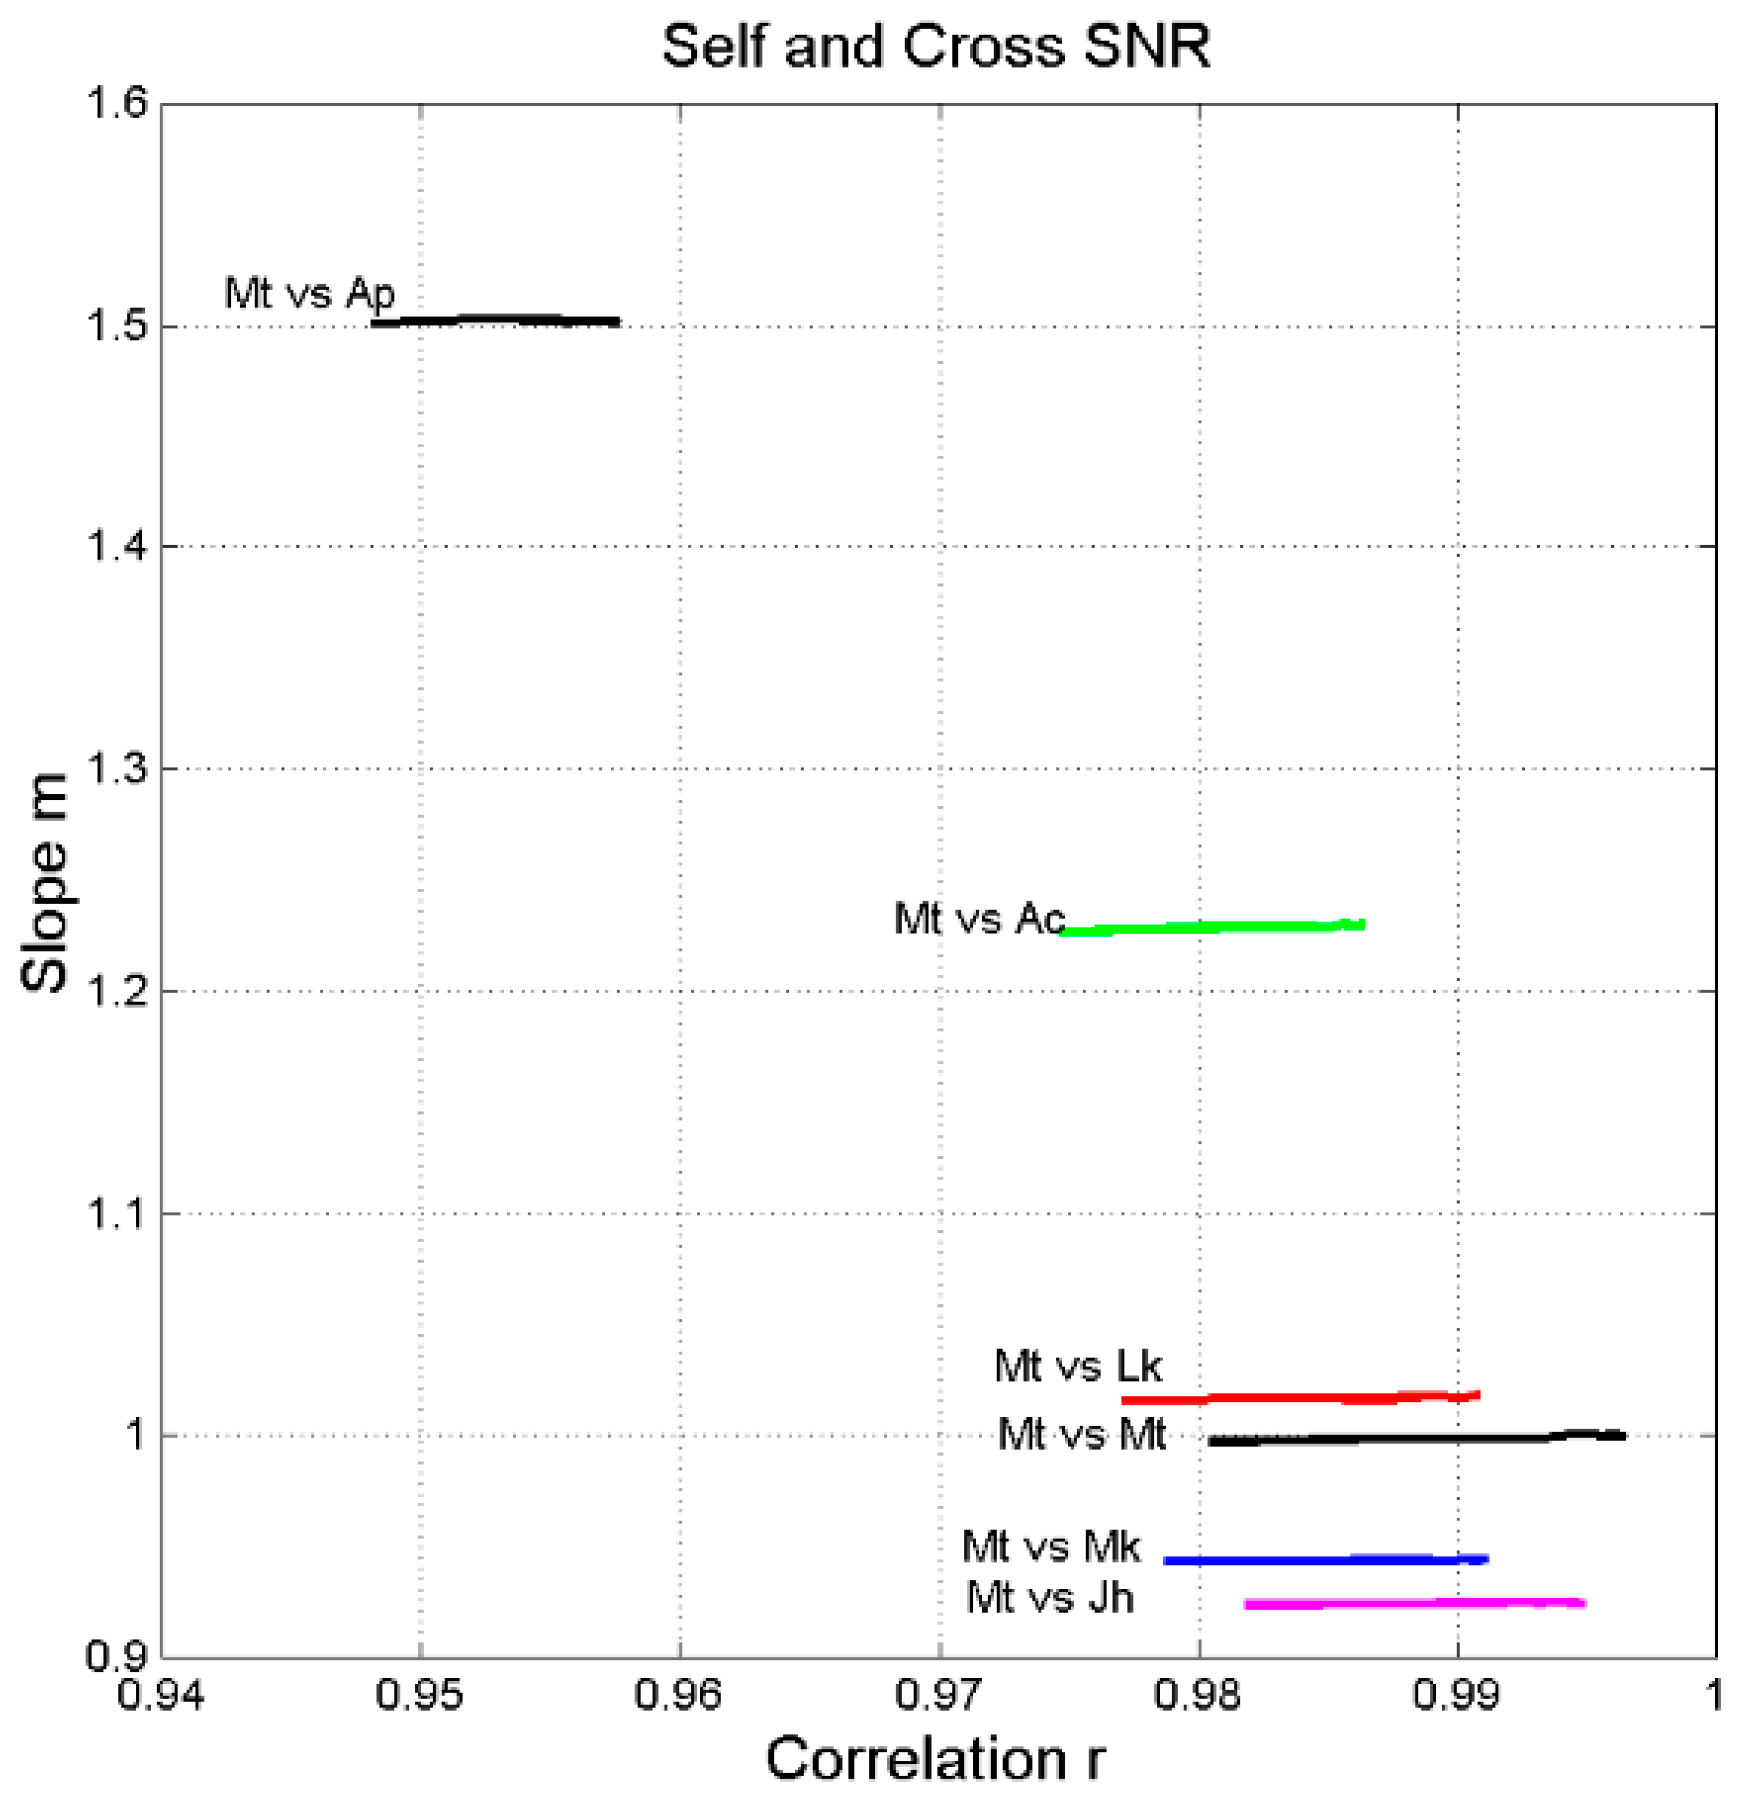
4. The Sentences Channel and Its Theoretical Signal-to-Noise Ratio
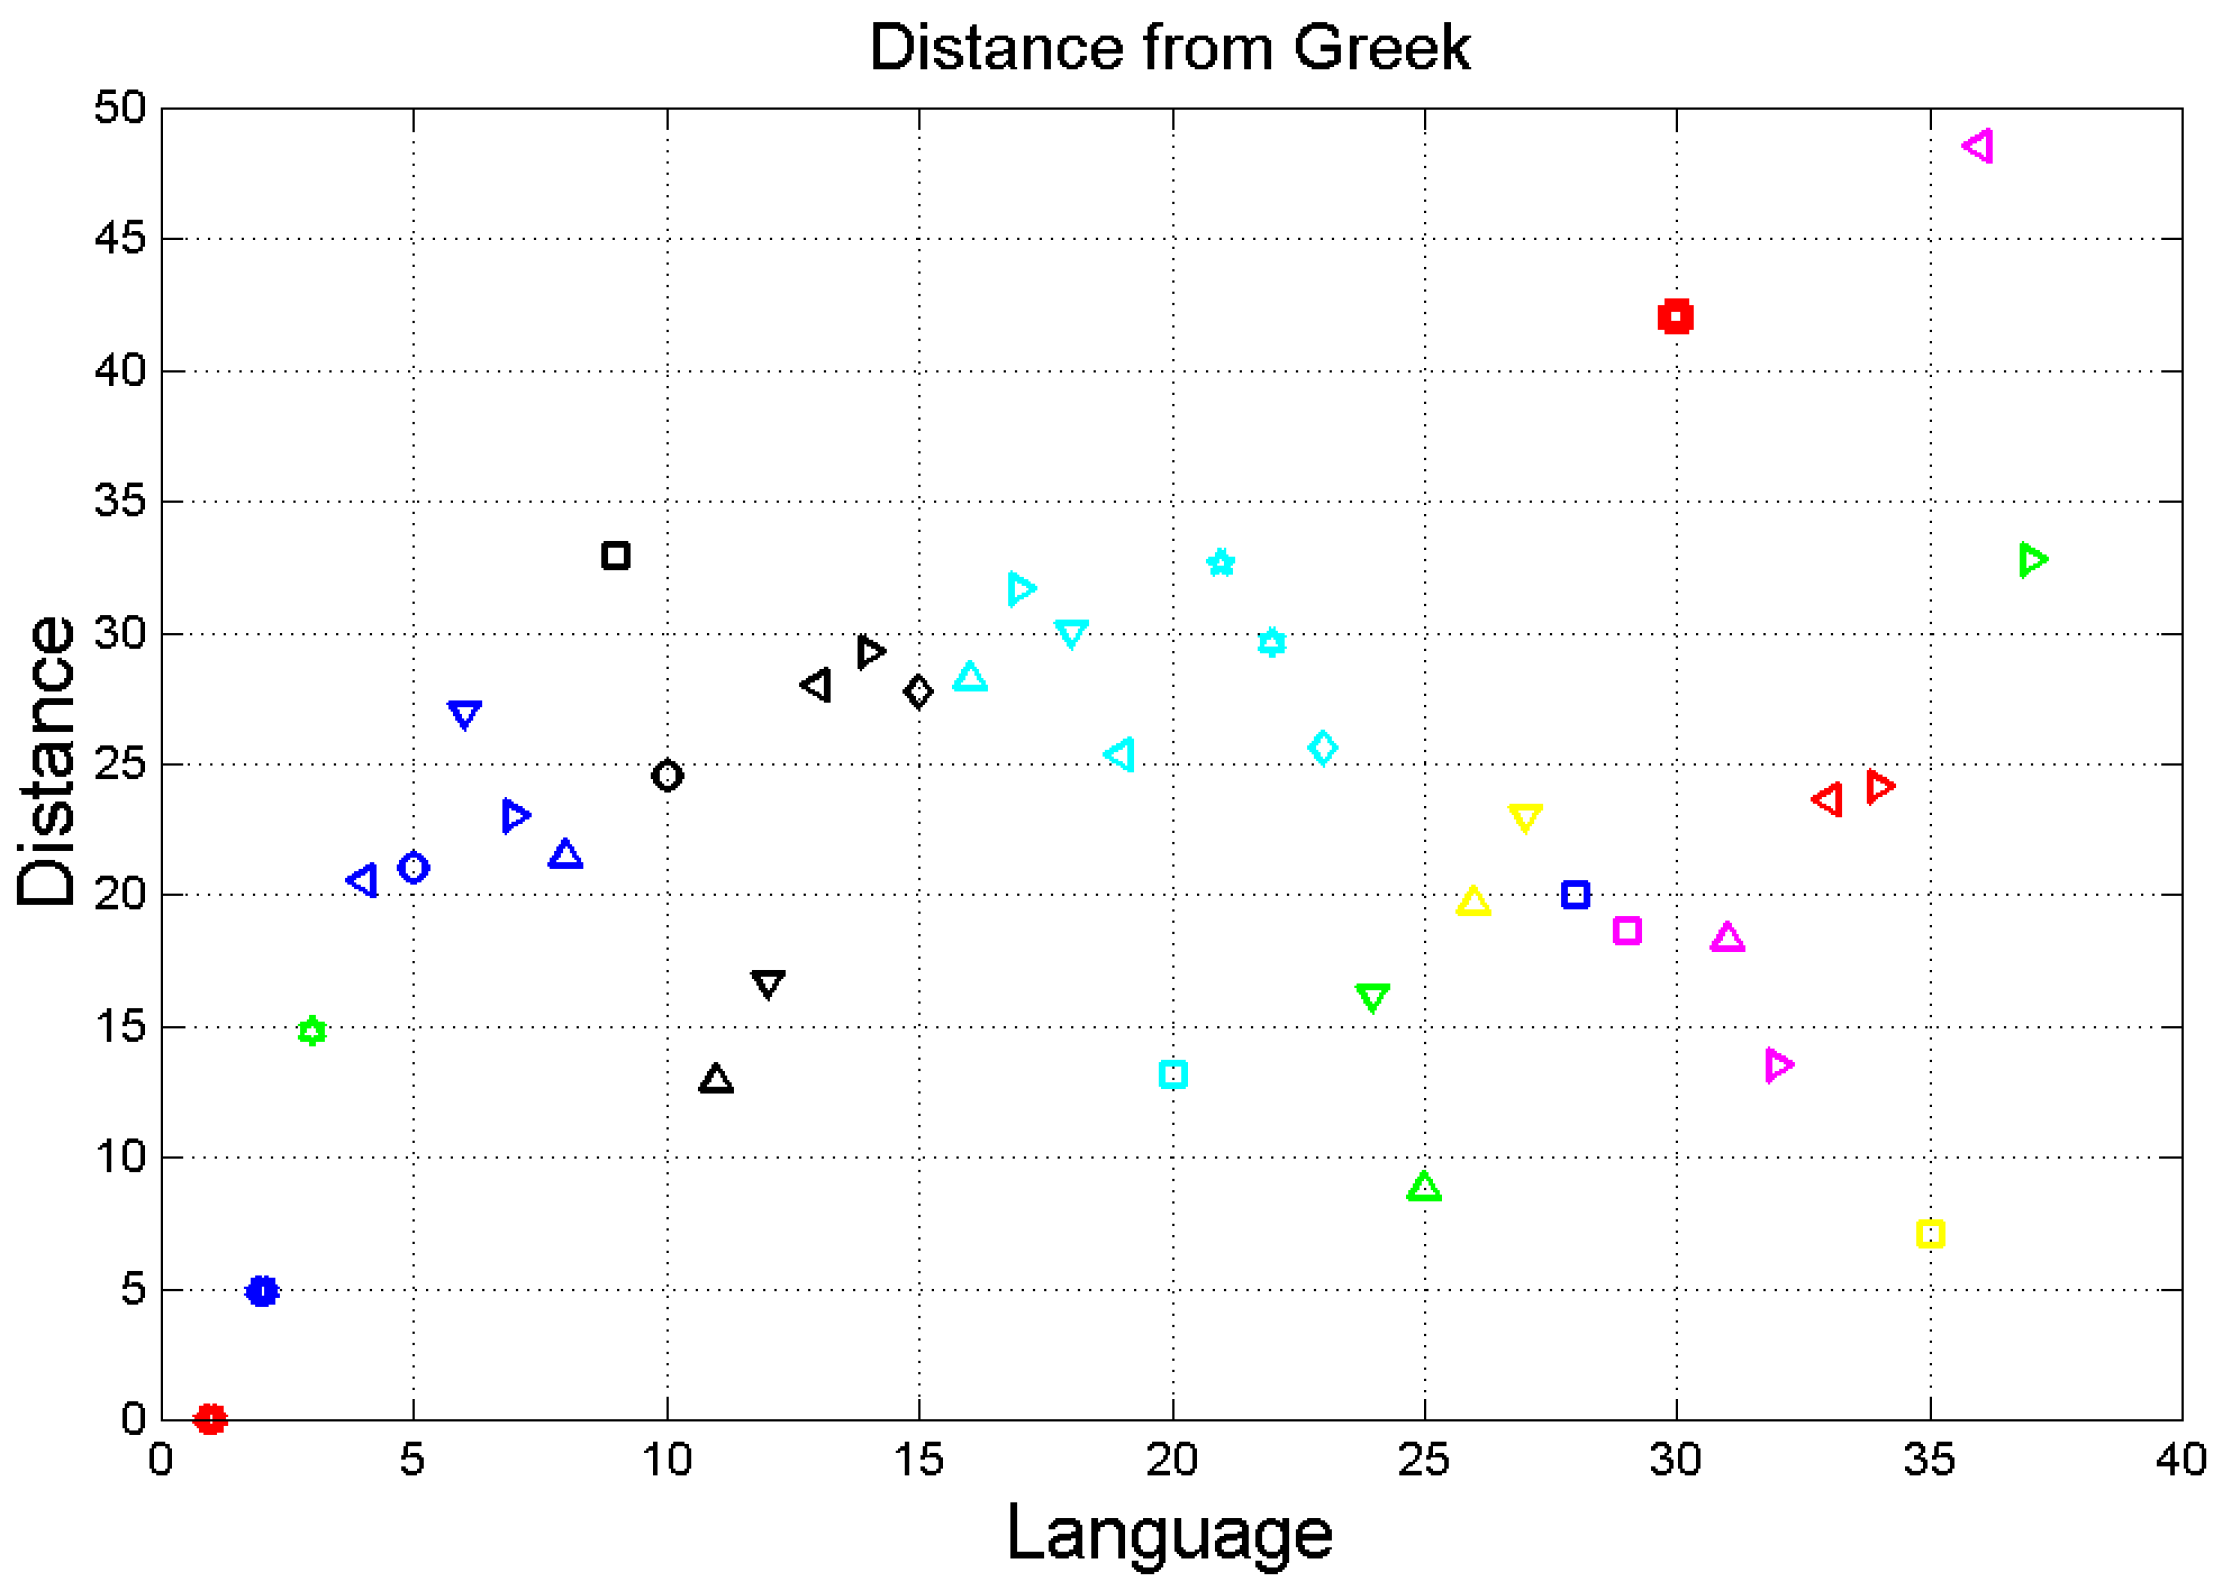
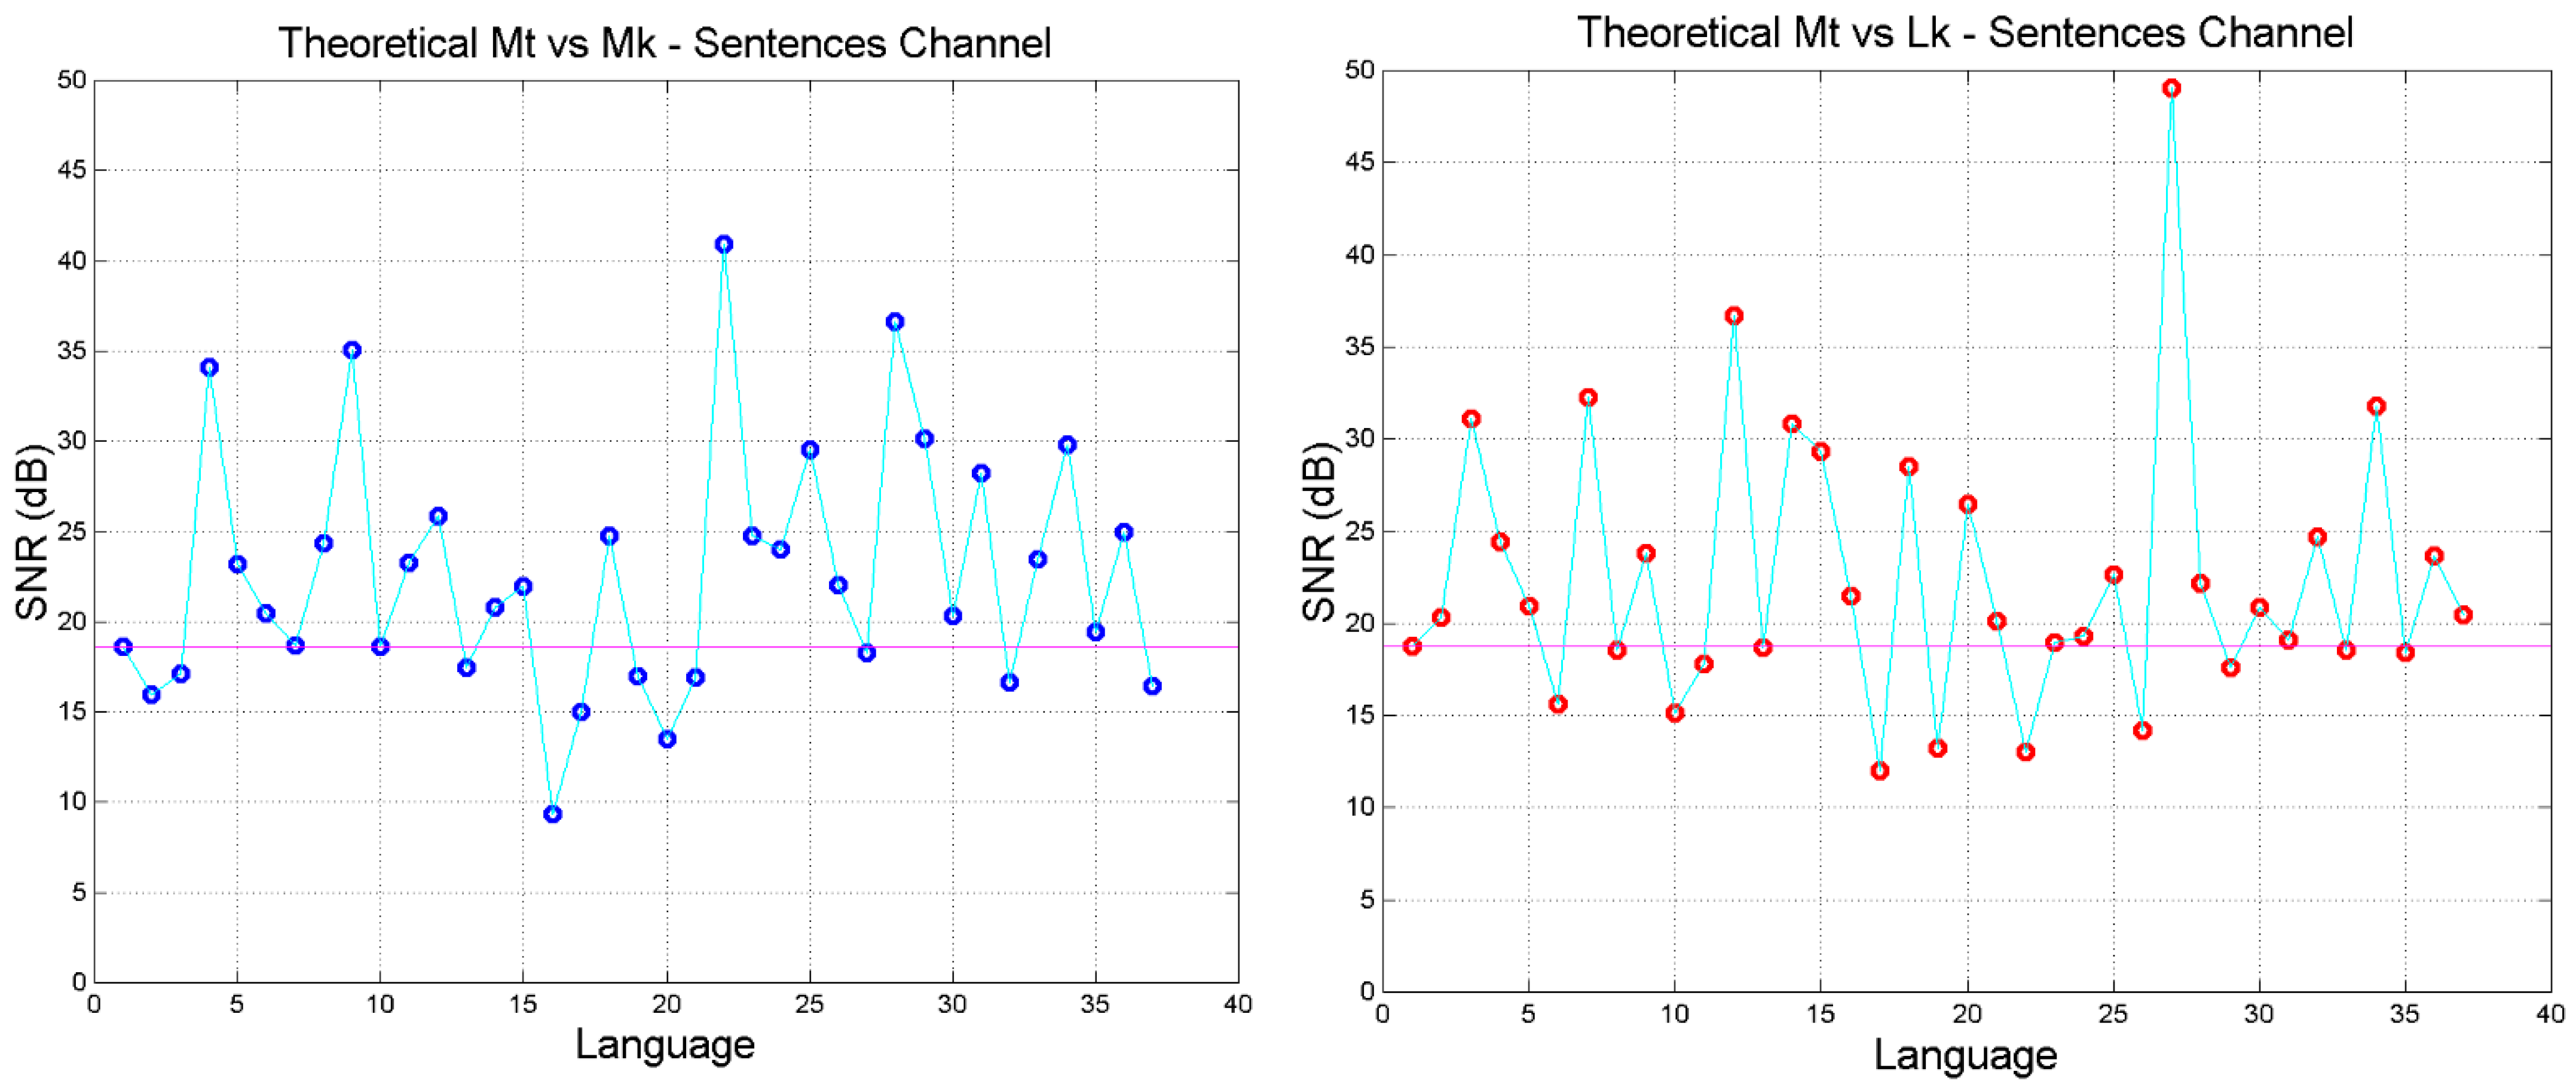
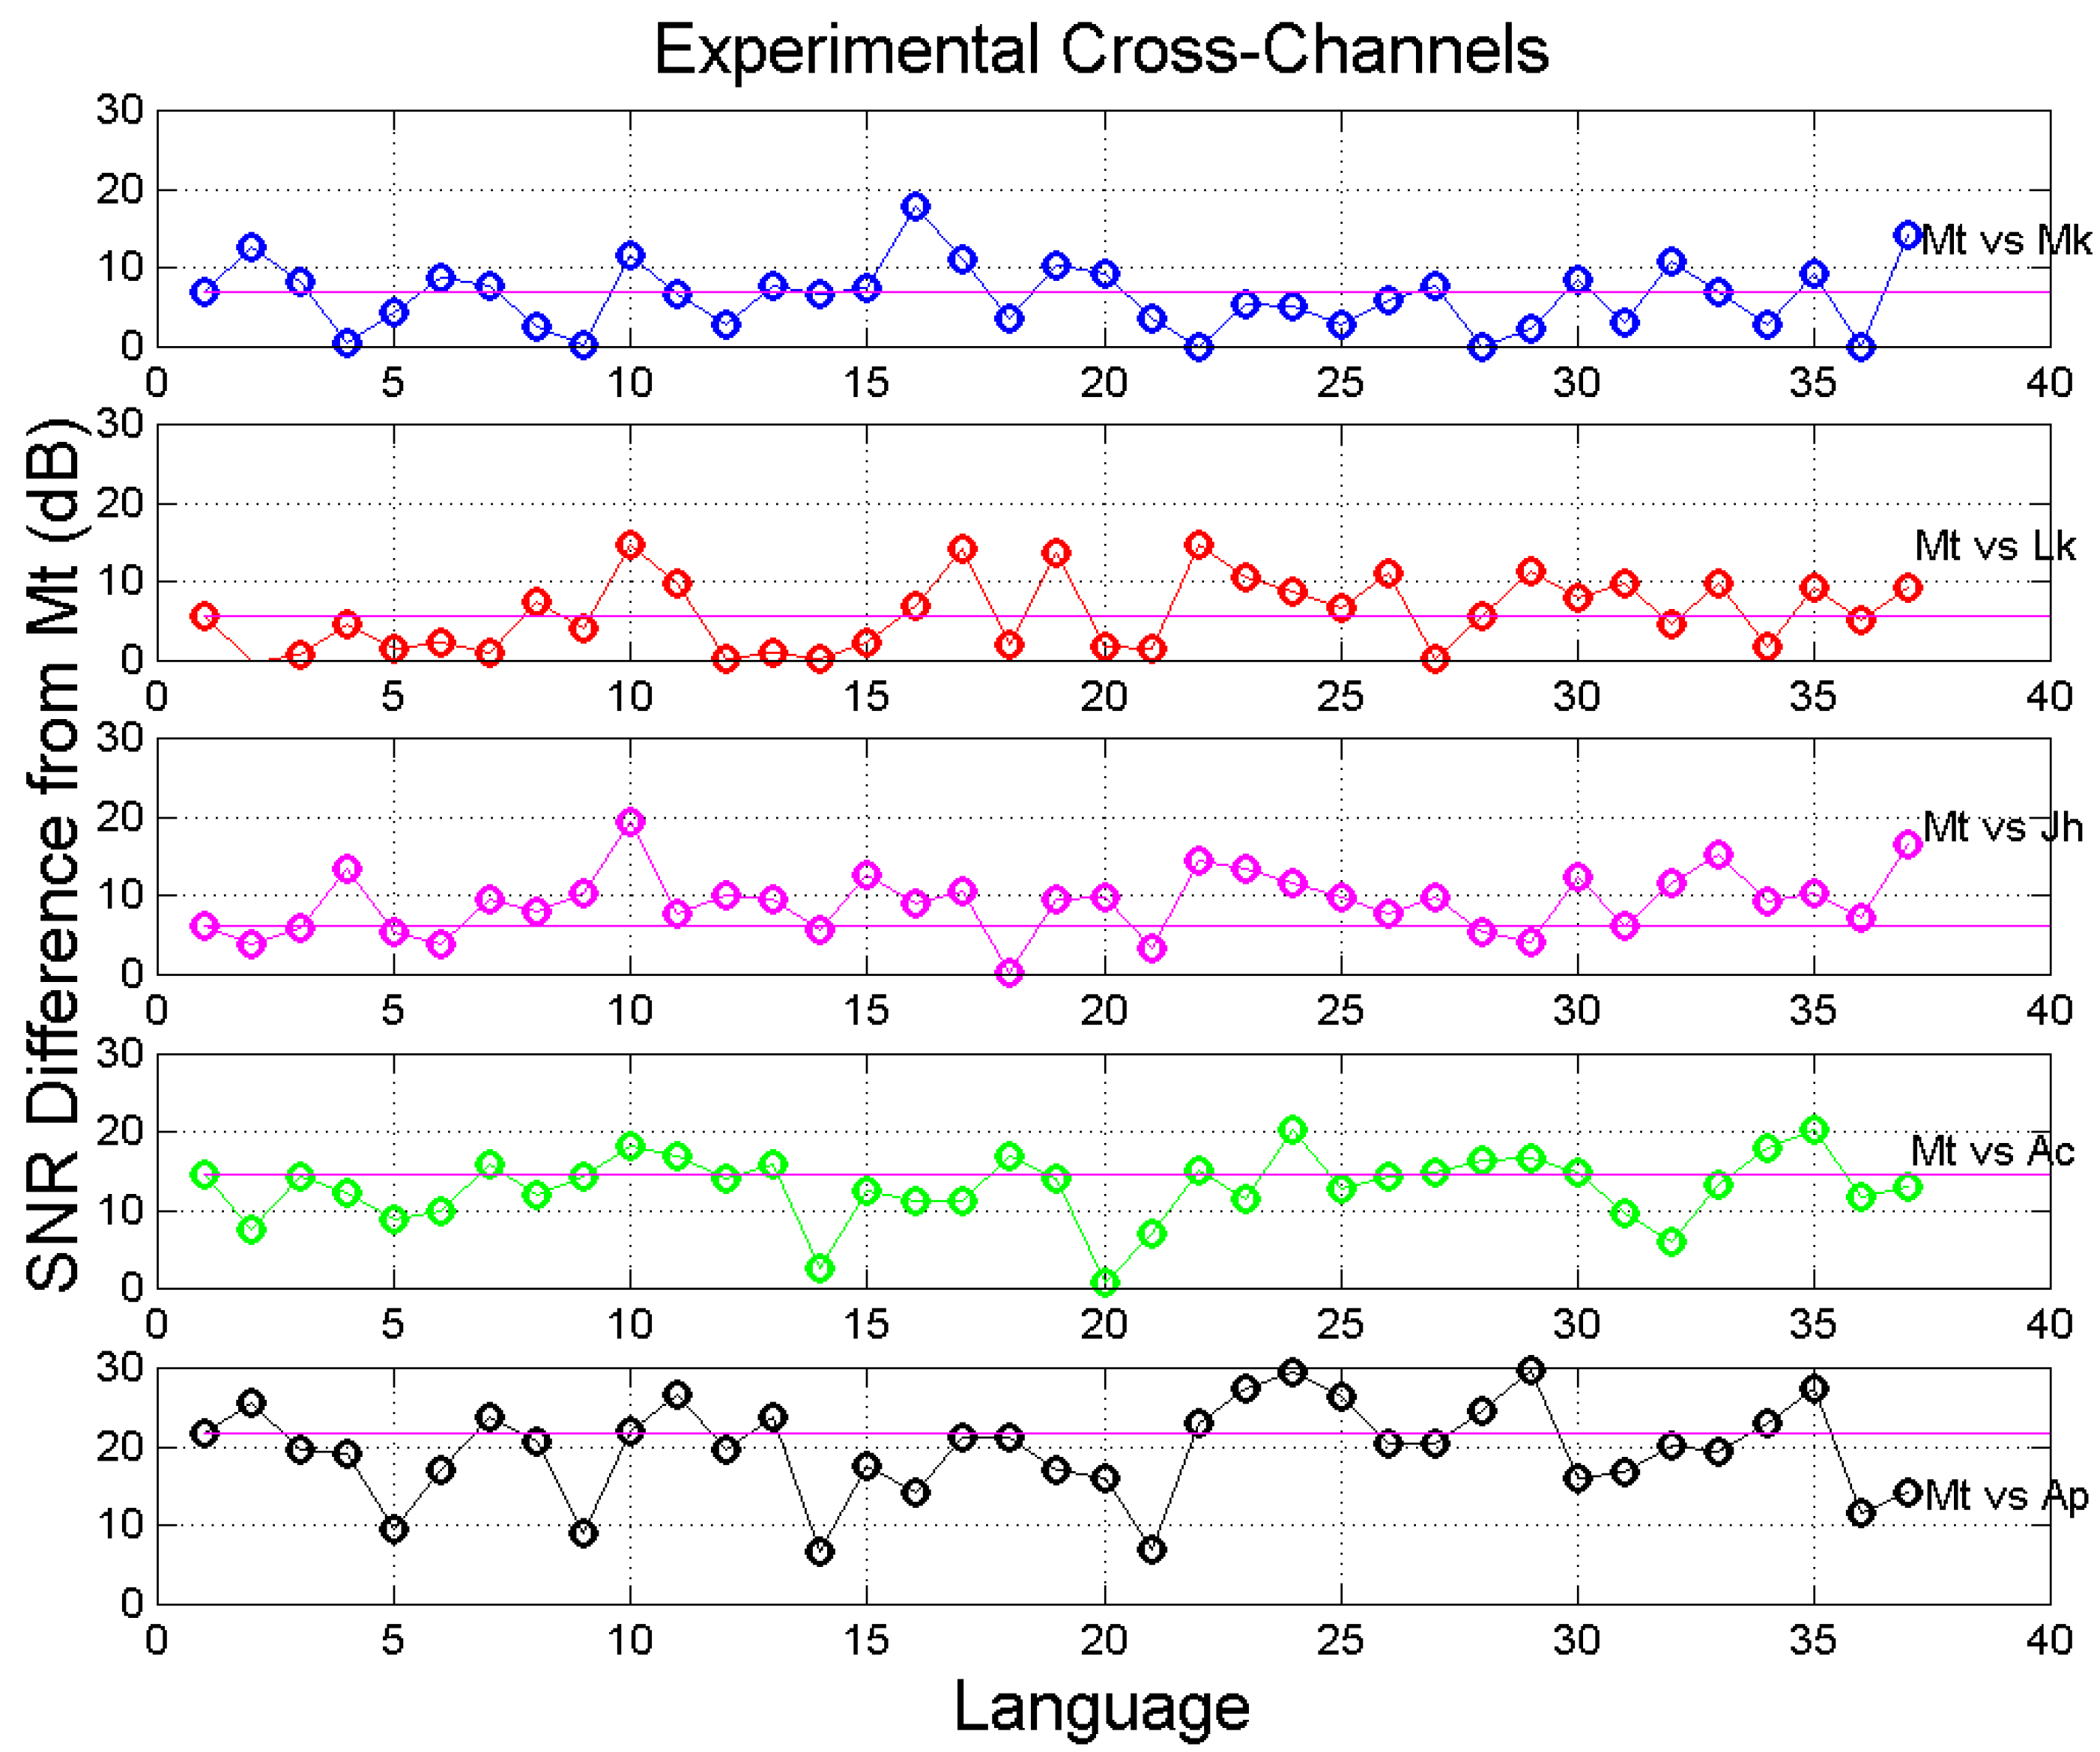
- The signal-to-noise of both self- and cross-channels depends very much on language, with some translations giving significantly larger (more common) or smaller values than the Greek (language no.1).
- Only few translations are very similar to Greek, as their in the cross-channels falls on the magenta line, especially in Mt vs. Mk and Mt vs. Luke. For Mt vs. Mk they are: Romanian (language number 7), English (10), Armenian (27), Somali (35). For Luke: Spanish (8), Icelandic (13), Ukrainian (23), Estonian (24), Cebuano (31), Chichewa (33), Somali (35).
- The range of can be quite different from language to language, and can be biased, i.e., displaced mostly upwards (Mk, Lk, Ac, Ap) or mostly downwards (Jh), compared to Greek.
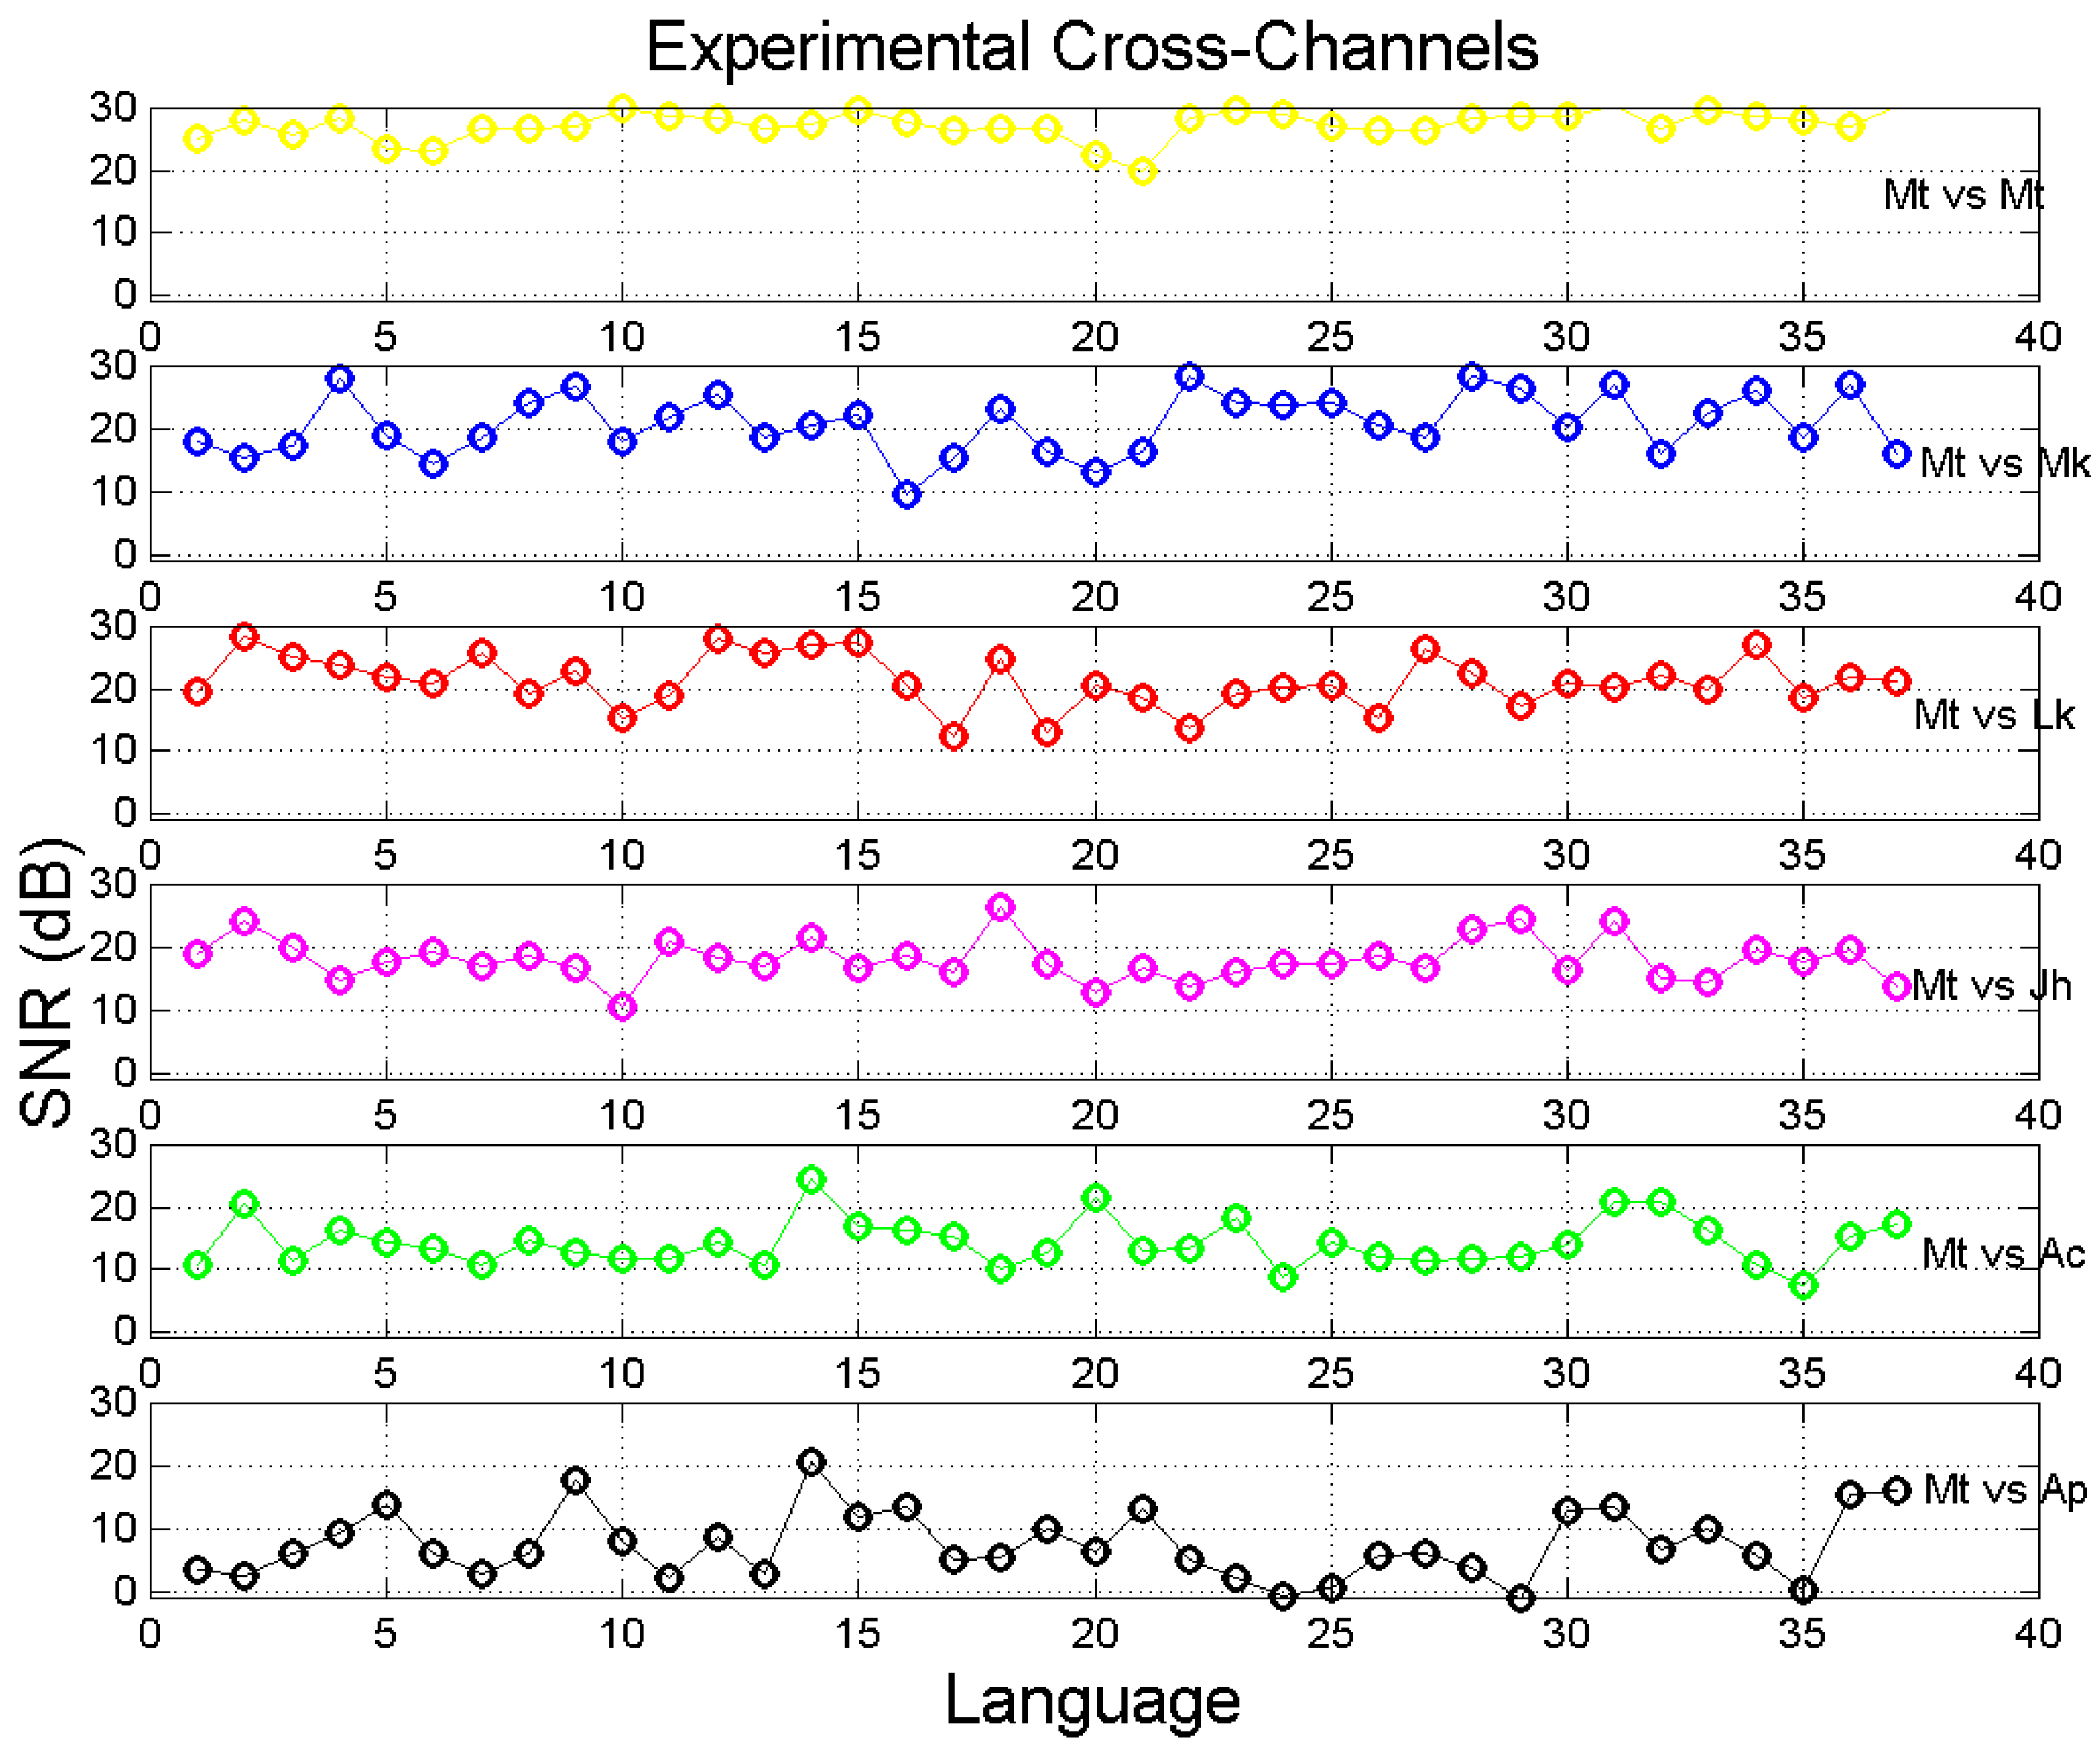
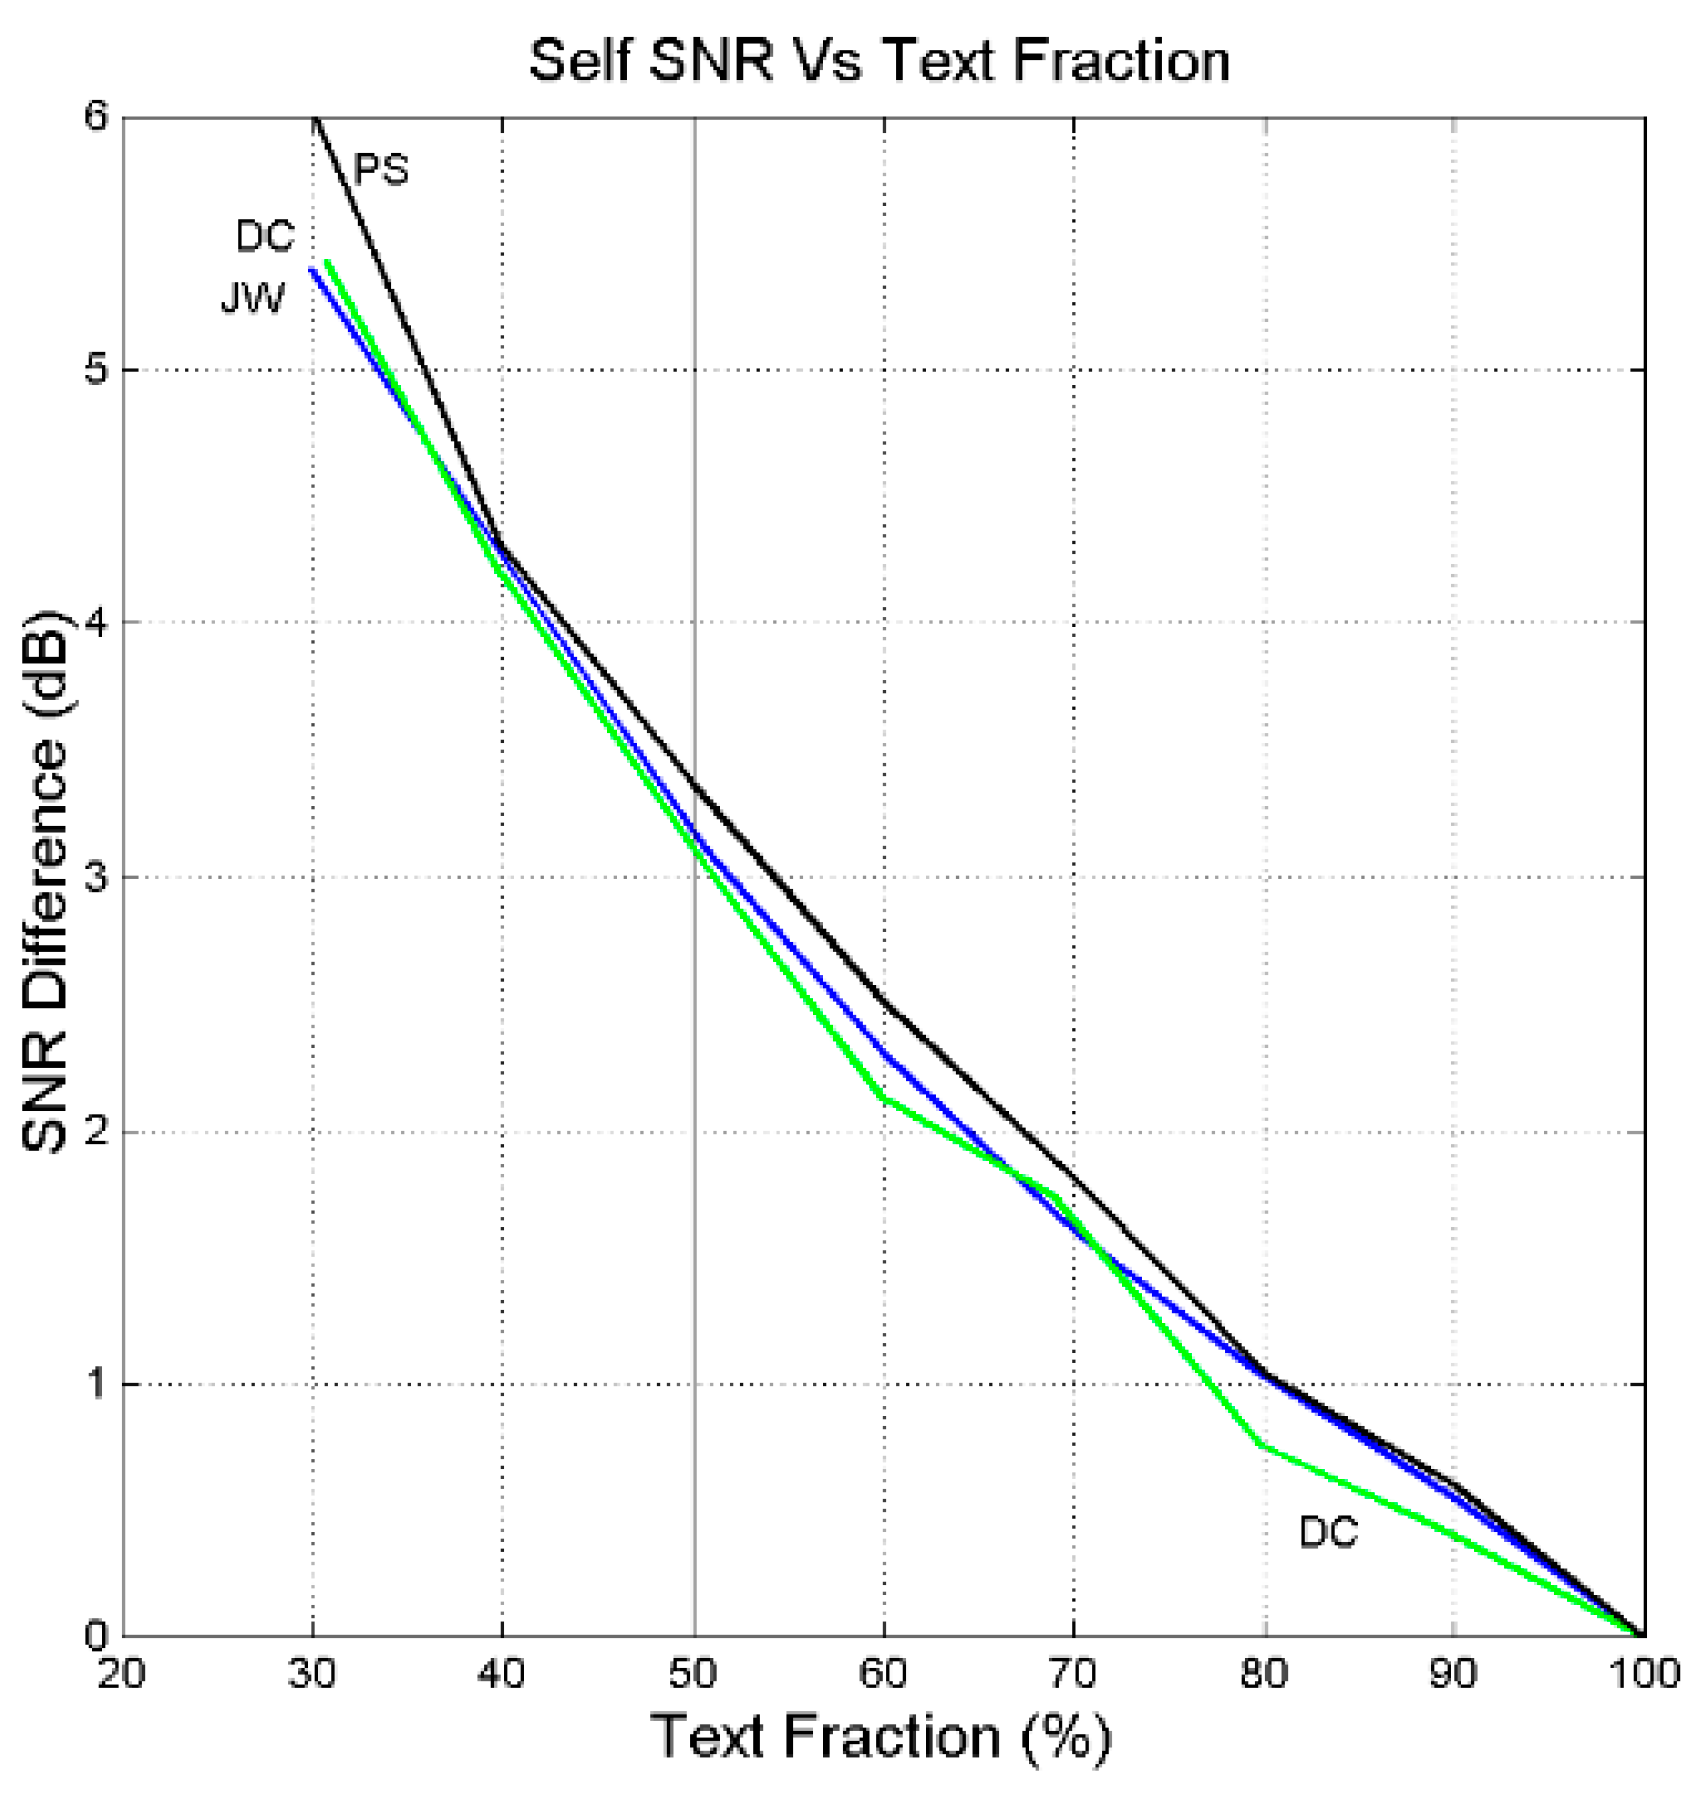
5. The Sentences Channel and Its Experimental Signal-to-Noise Ratio
5.1. Monte Carlo Simulation and Experimental Signal-to-Noise Ratio
- Generate 28 (the number of chapters in Matthew) independent numbers from a discrete uniform probability distribution in the range 1 to 28, with replacement–i.e., a number can be selected more than once.
- “Write” another possible “Matthew” with new 28 chapters corresponding to the numbers of the list randomly extracted; e.g., 23; 3; 16… hence take chapter 23, followed by chapter 3, chapter 16 etc. The text of a chapter can appear twice (with probability ), three times (with probability ), et cetera, and the new Matthew can contain a number of words greater or smaller than the original text, on the average (the differences are small and do not affect the results).
- Calculate the parameters and of the regression line between words (independent variable) and sentences (dependent variable) in the new Matthew.
- Consider the values of so obtained as “experimental” results , to be compared to the theoretical results of Section 4. Notice that it is not necessary to generate also new “Mark”, “Luke” et cetera, because we wish to compare the theoretical results of Section 4 to the results found in this section, therefore the input and must be the same.
- Repeat steps 1 to 5 many times (we did it 5000 times).
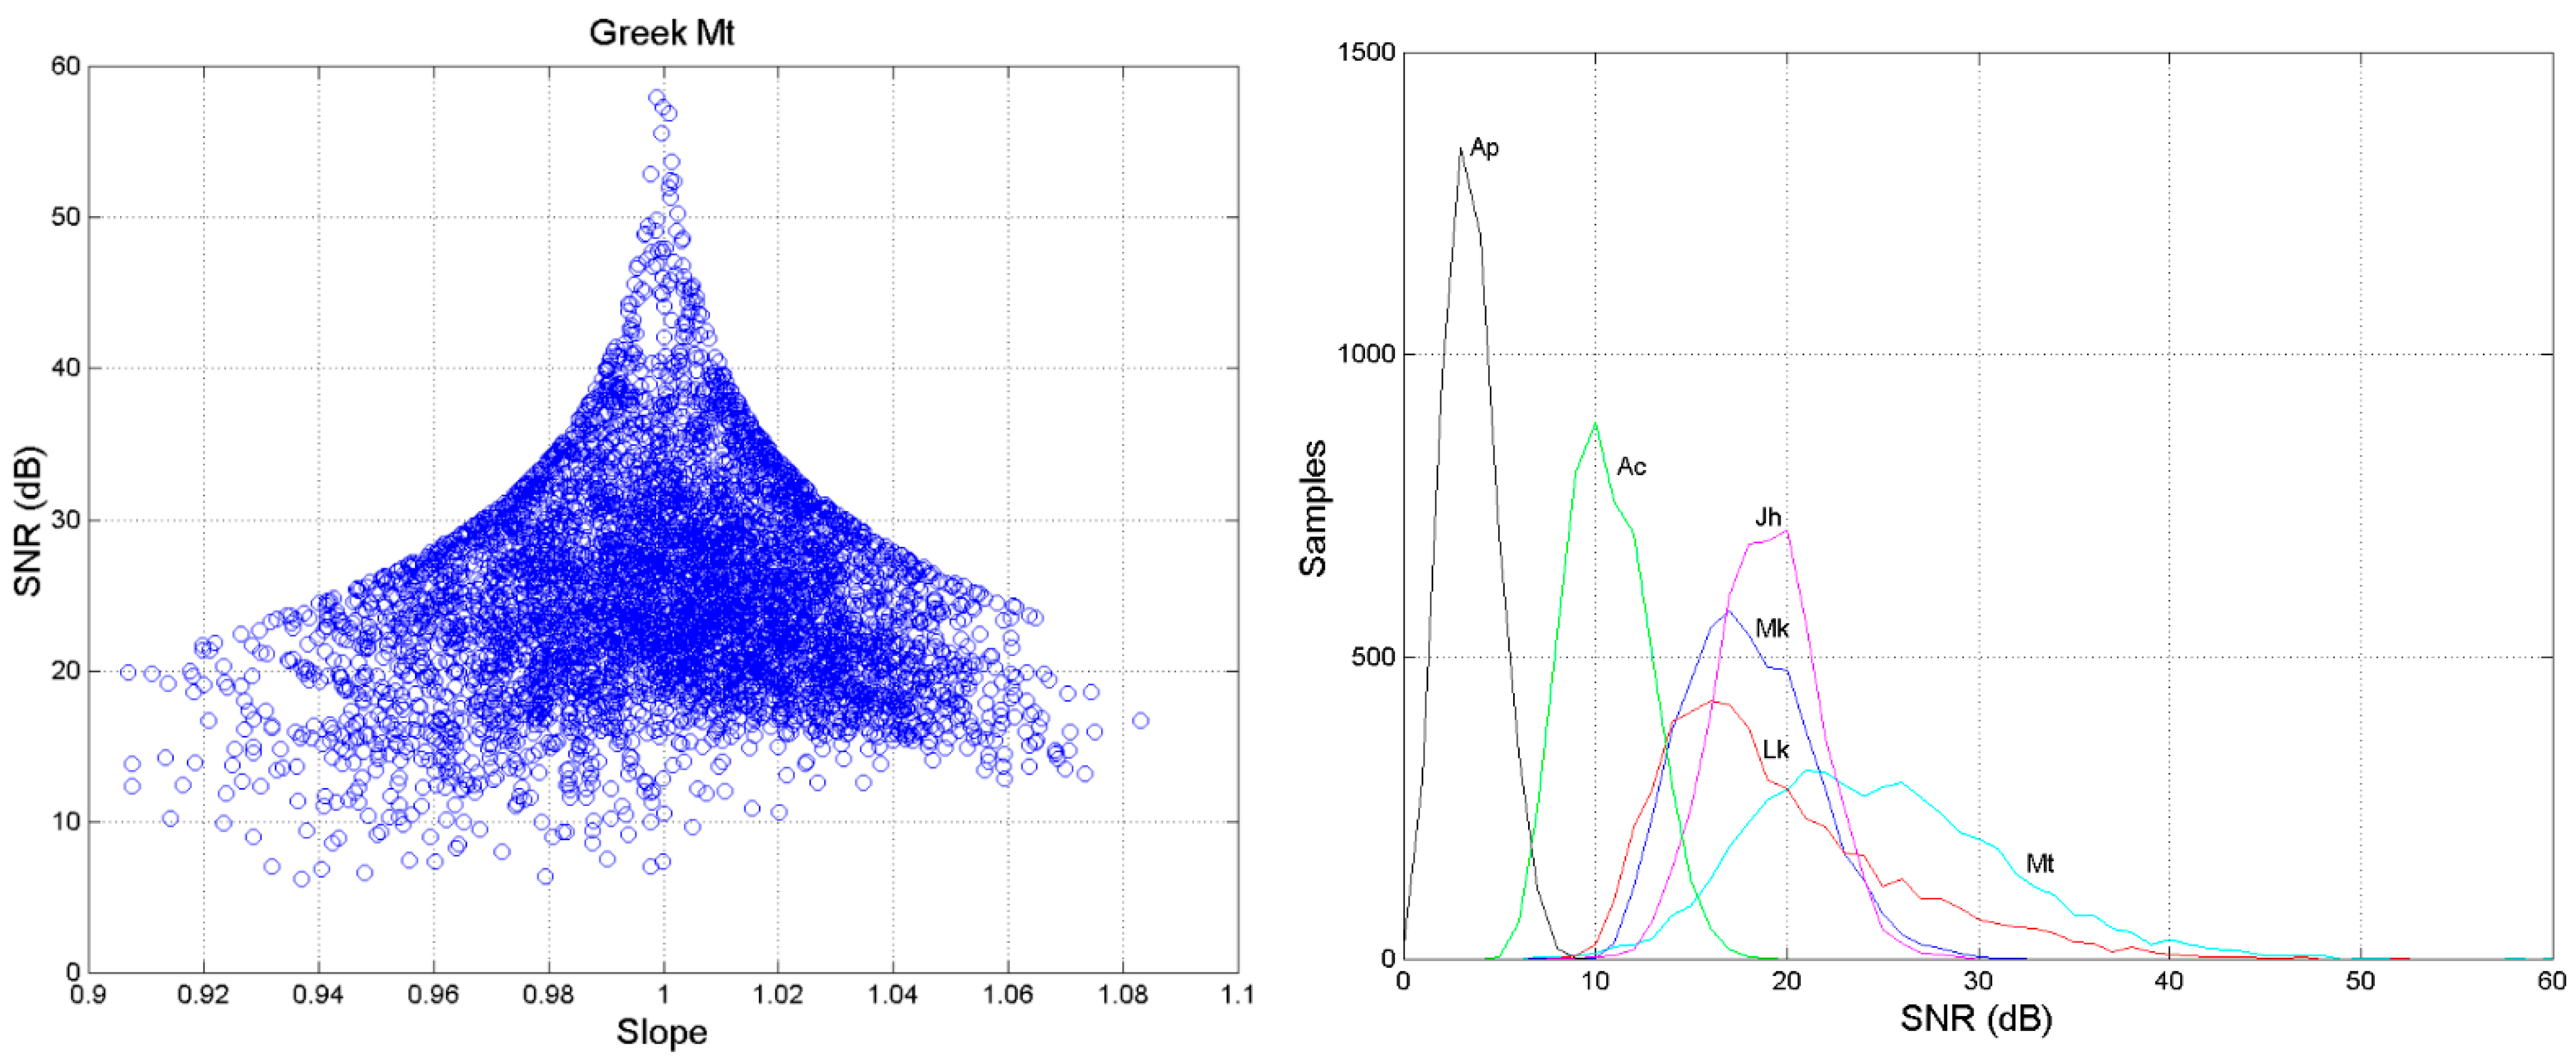
5.2. Experimental versus Theoretical Signal-to-Noise Ratio
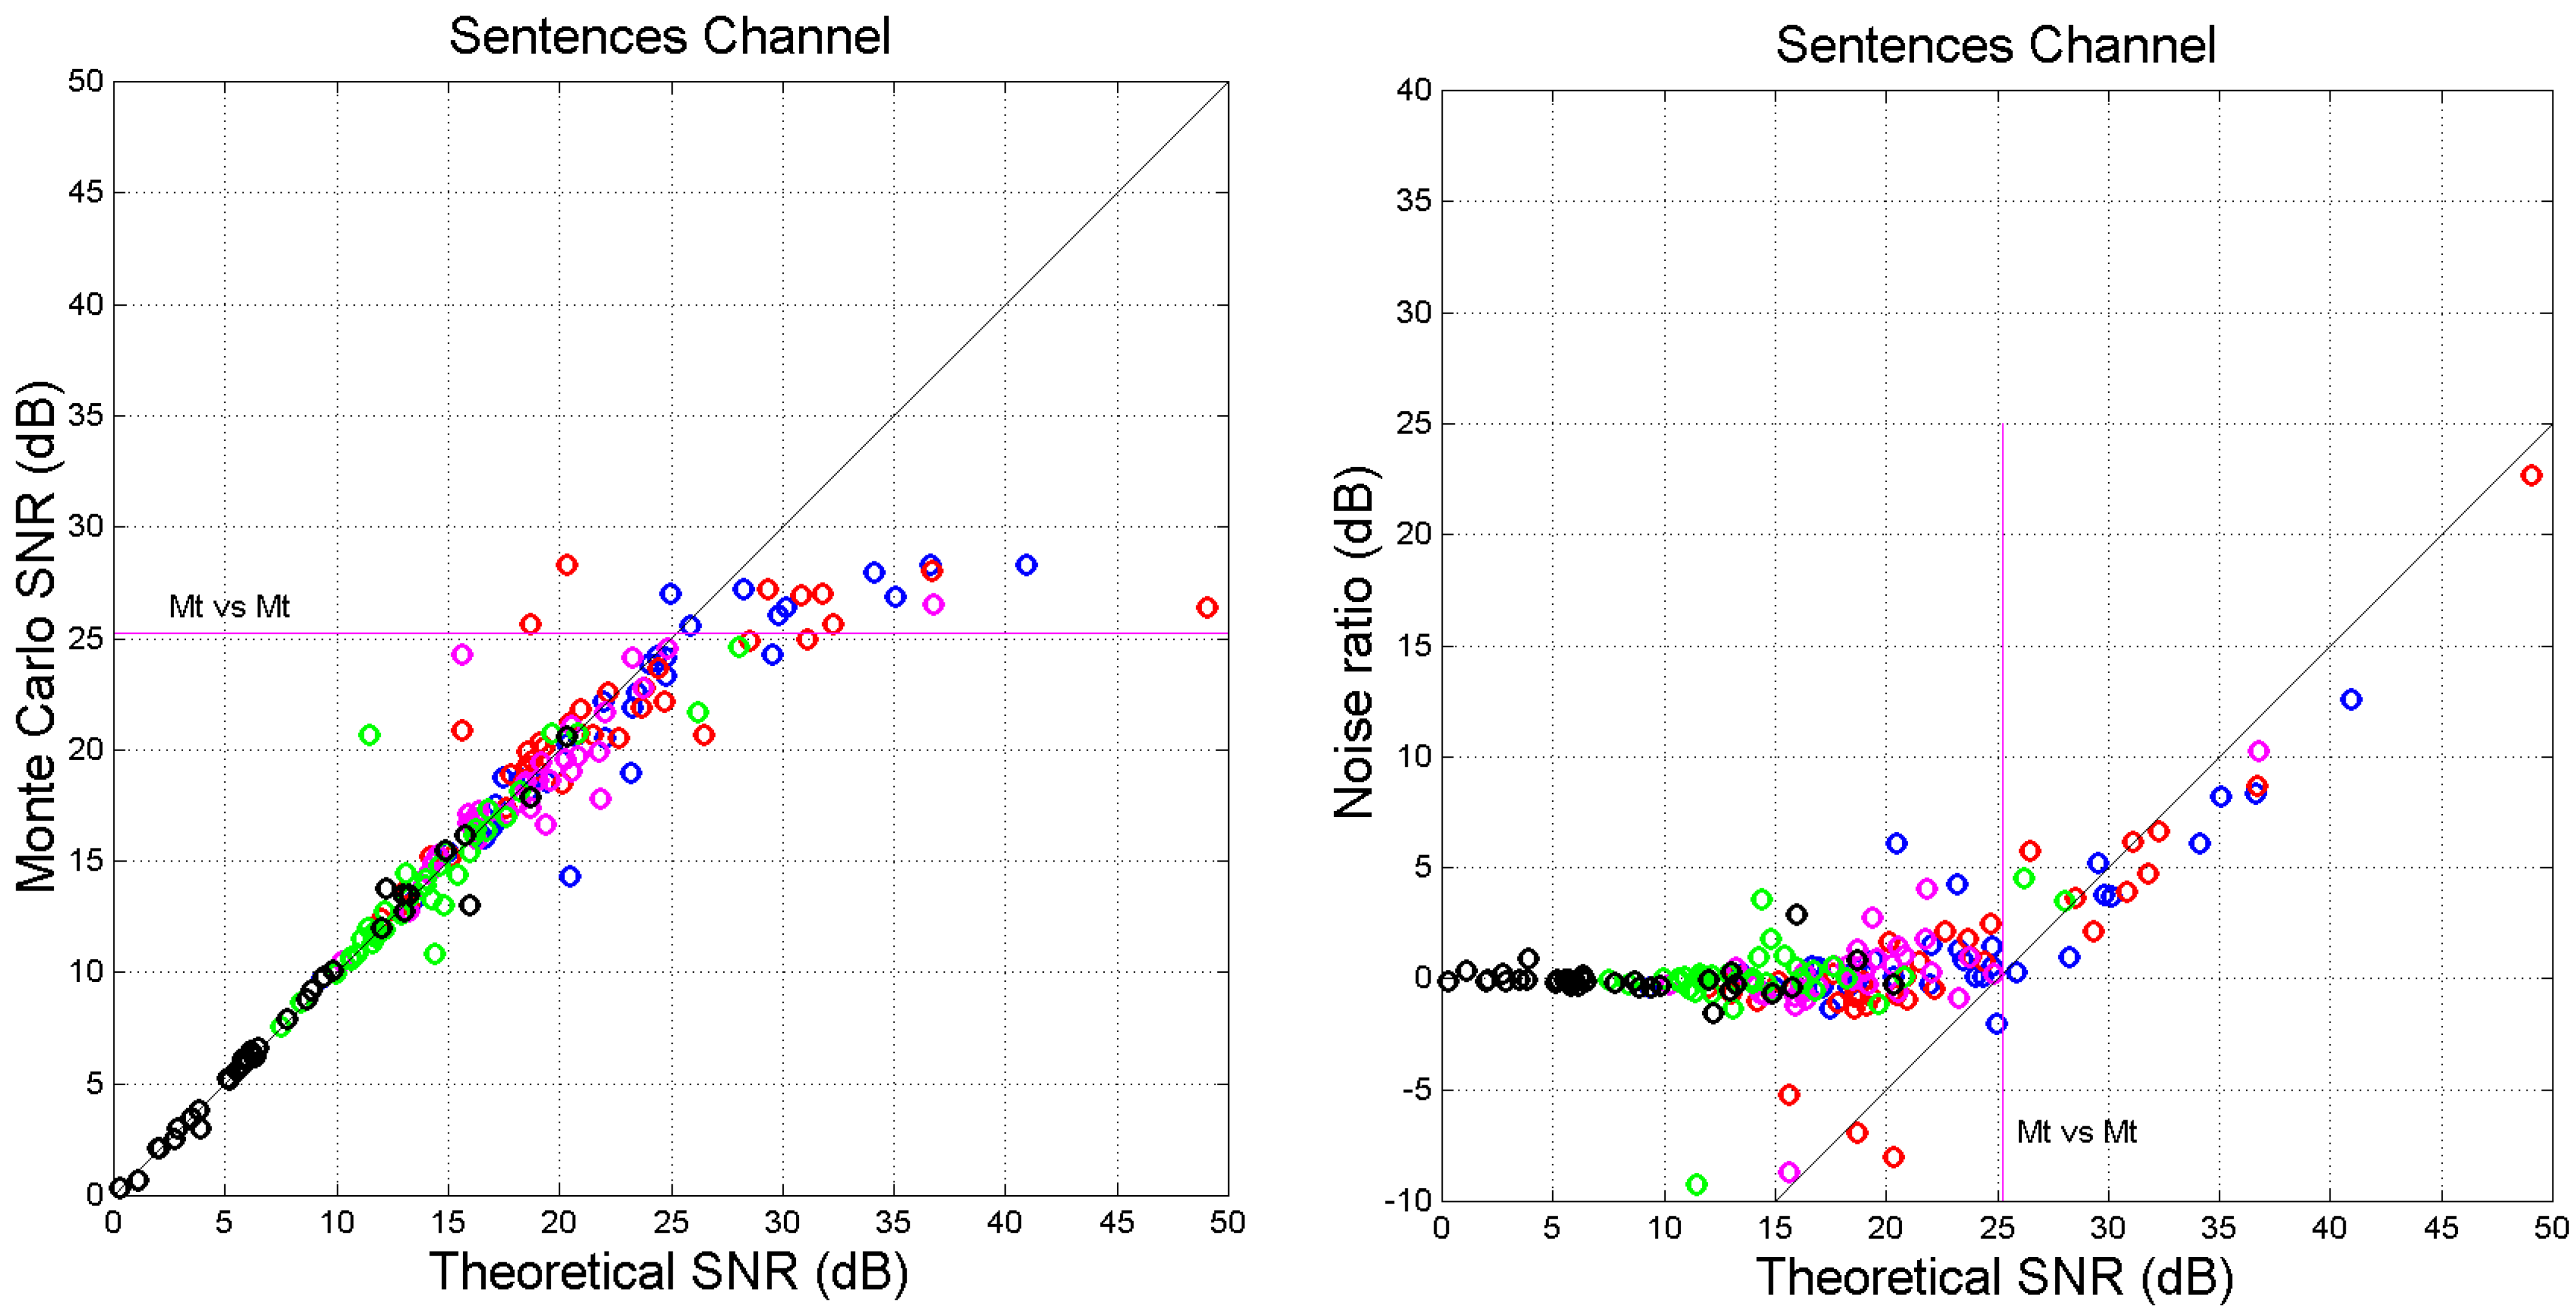
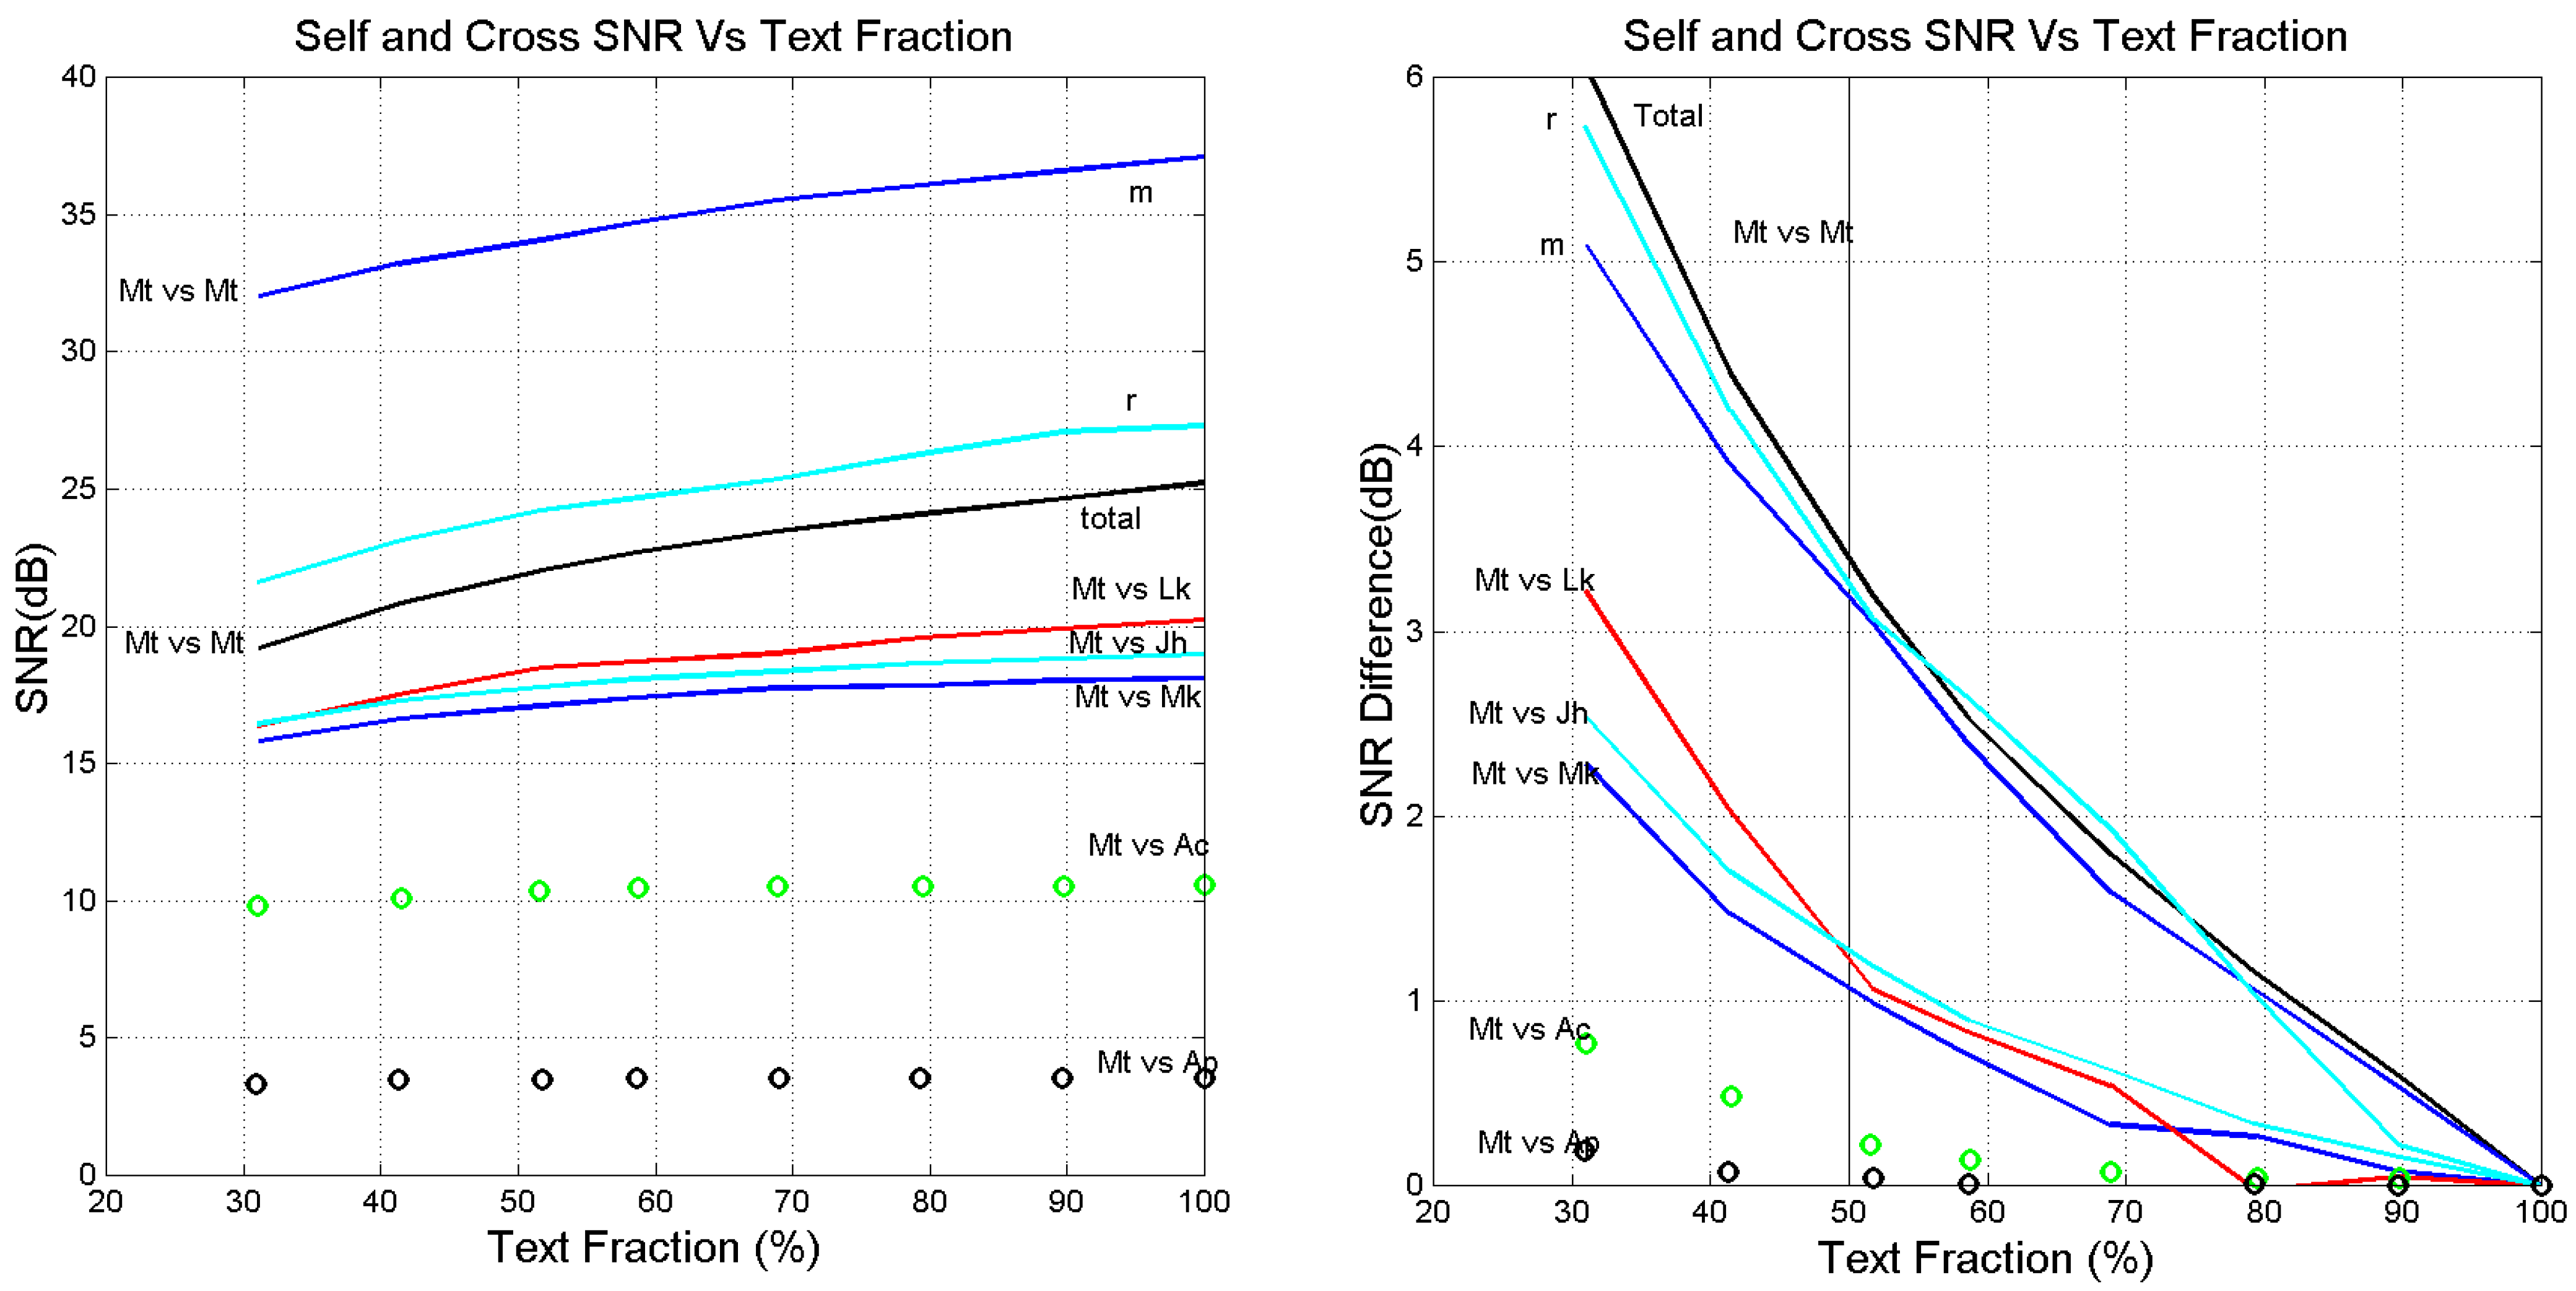
- For several languages, cross-channel maxima are found in Mt vs. Mk and in Mt vs. Lk, in the approximate (ordinate) range dB.
- Very clearly, there is a horizontal asymptote, starting at about this range contains most values of of self-channels (see Table 5).
- Before saturation, (approximately a 45°-line). Therefore, for dB, theory and simulation agree, indicating that the values of slope and correlation coefficient which determine are sufficiently accurate to be used conservatively as input to the theory, without performing a Monte Carlo simulation.
- The difference tends to be constant before saturation; afterwards it increases linearly.
6. Self-and Cross Channels Signal-to-Noise Ratios in Reduced Texts
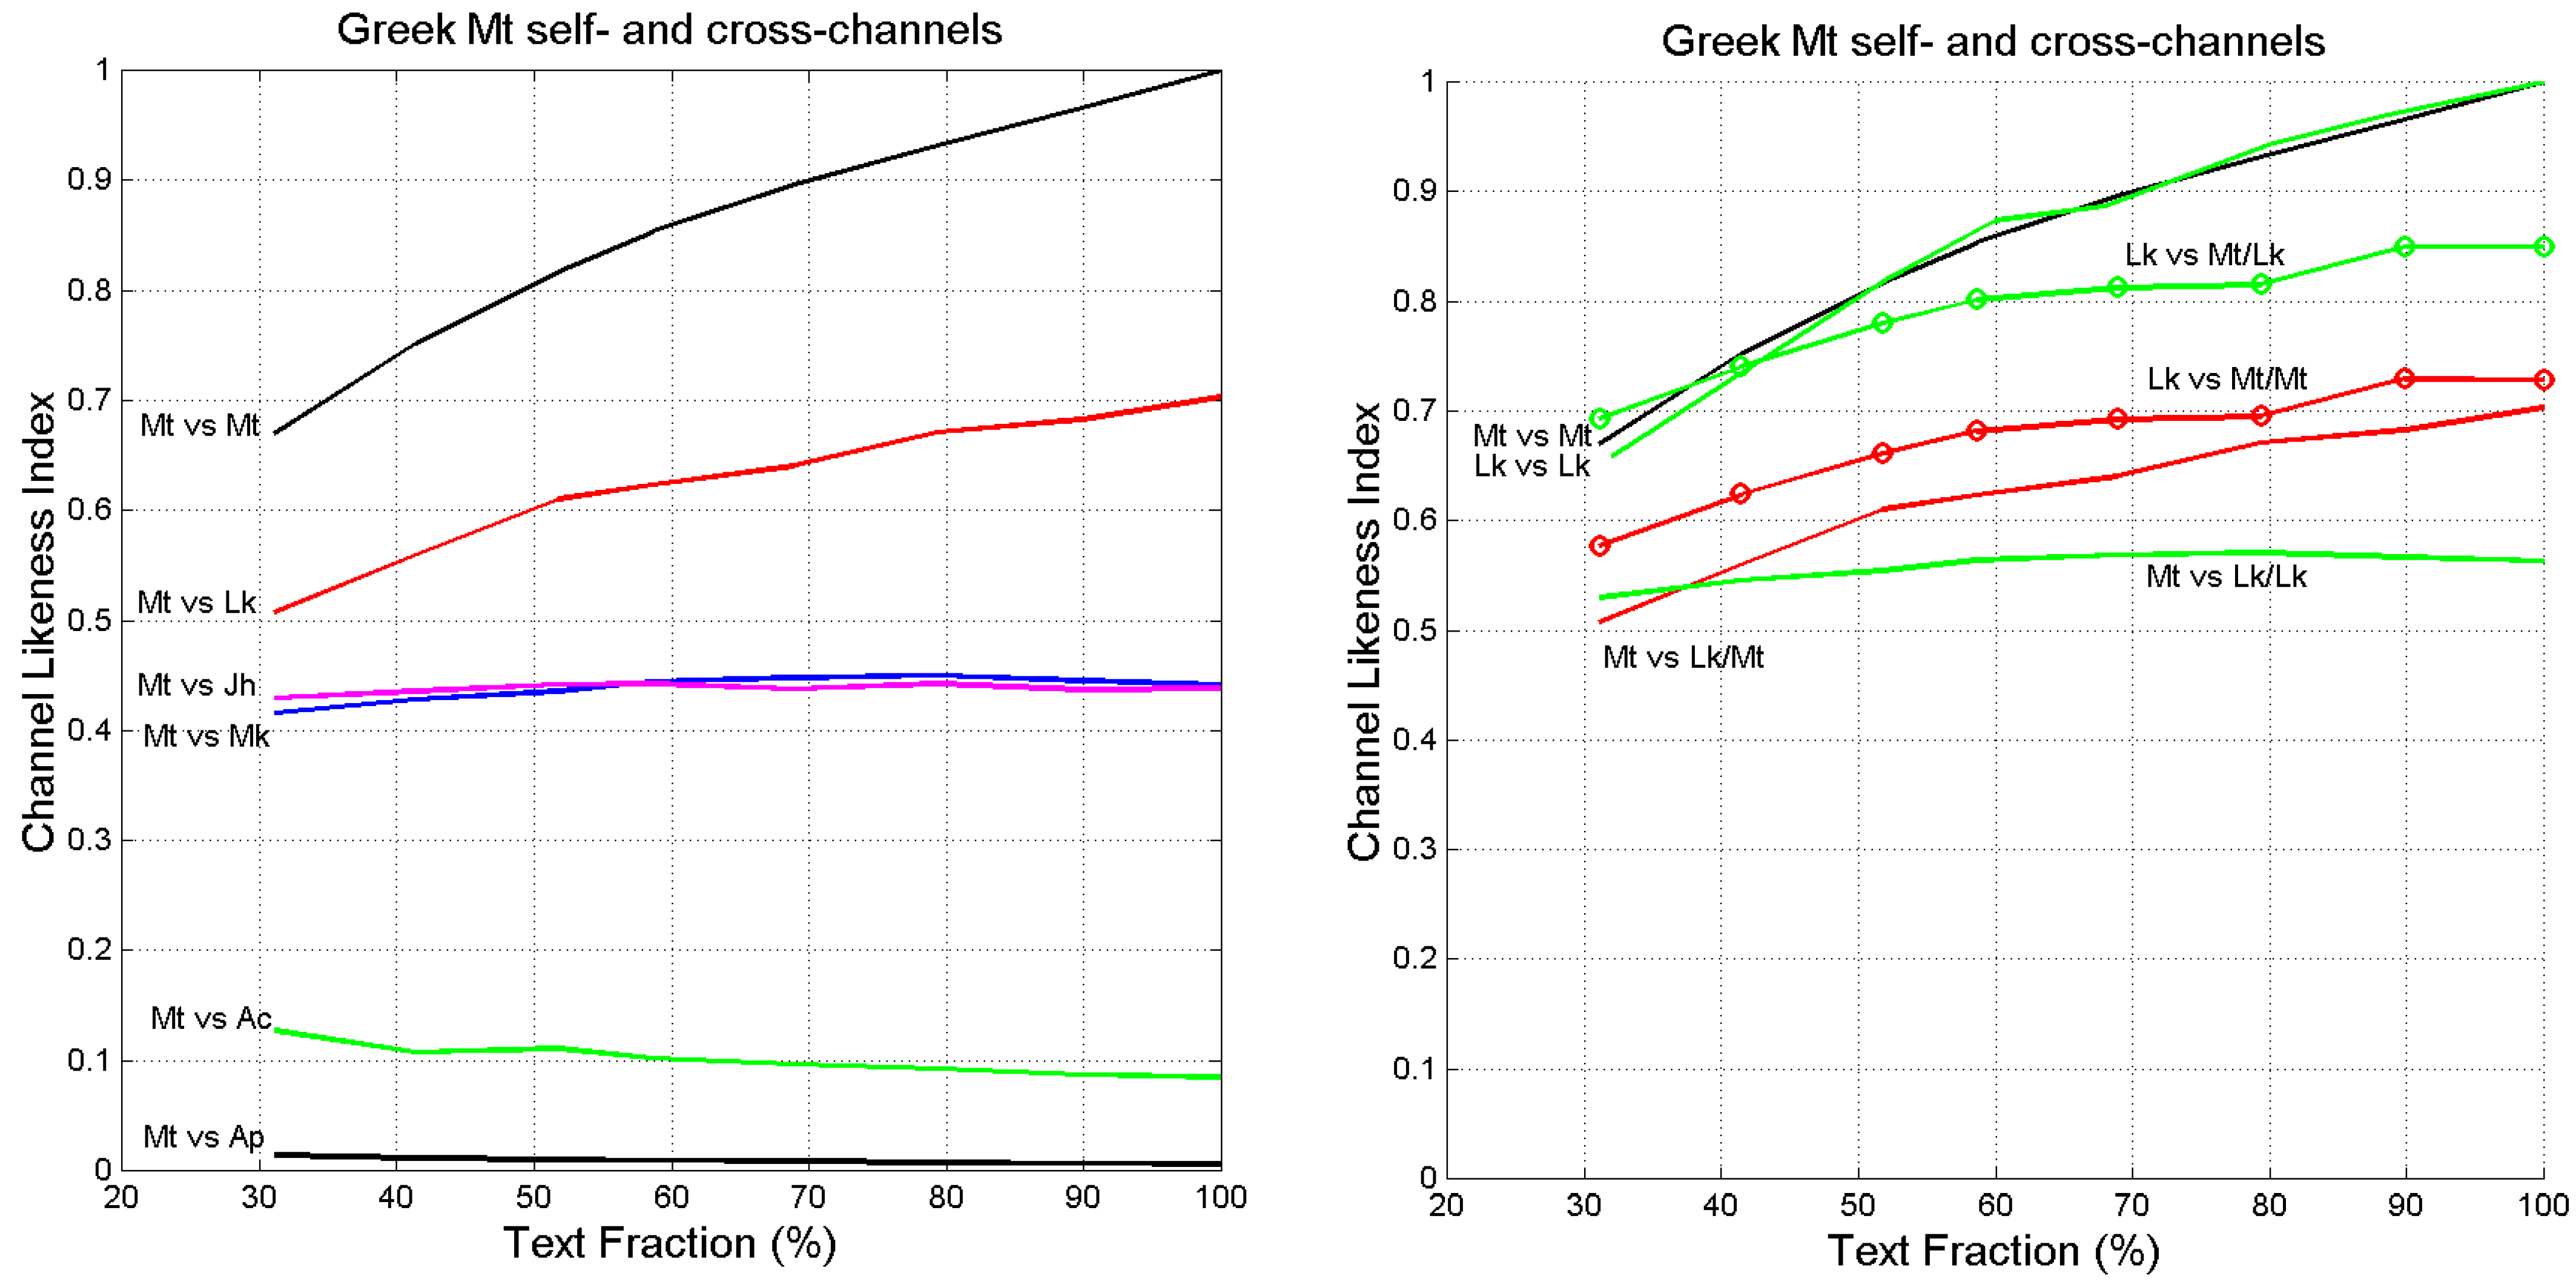
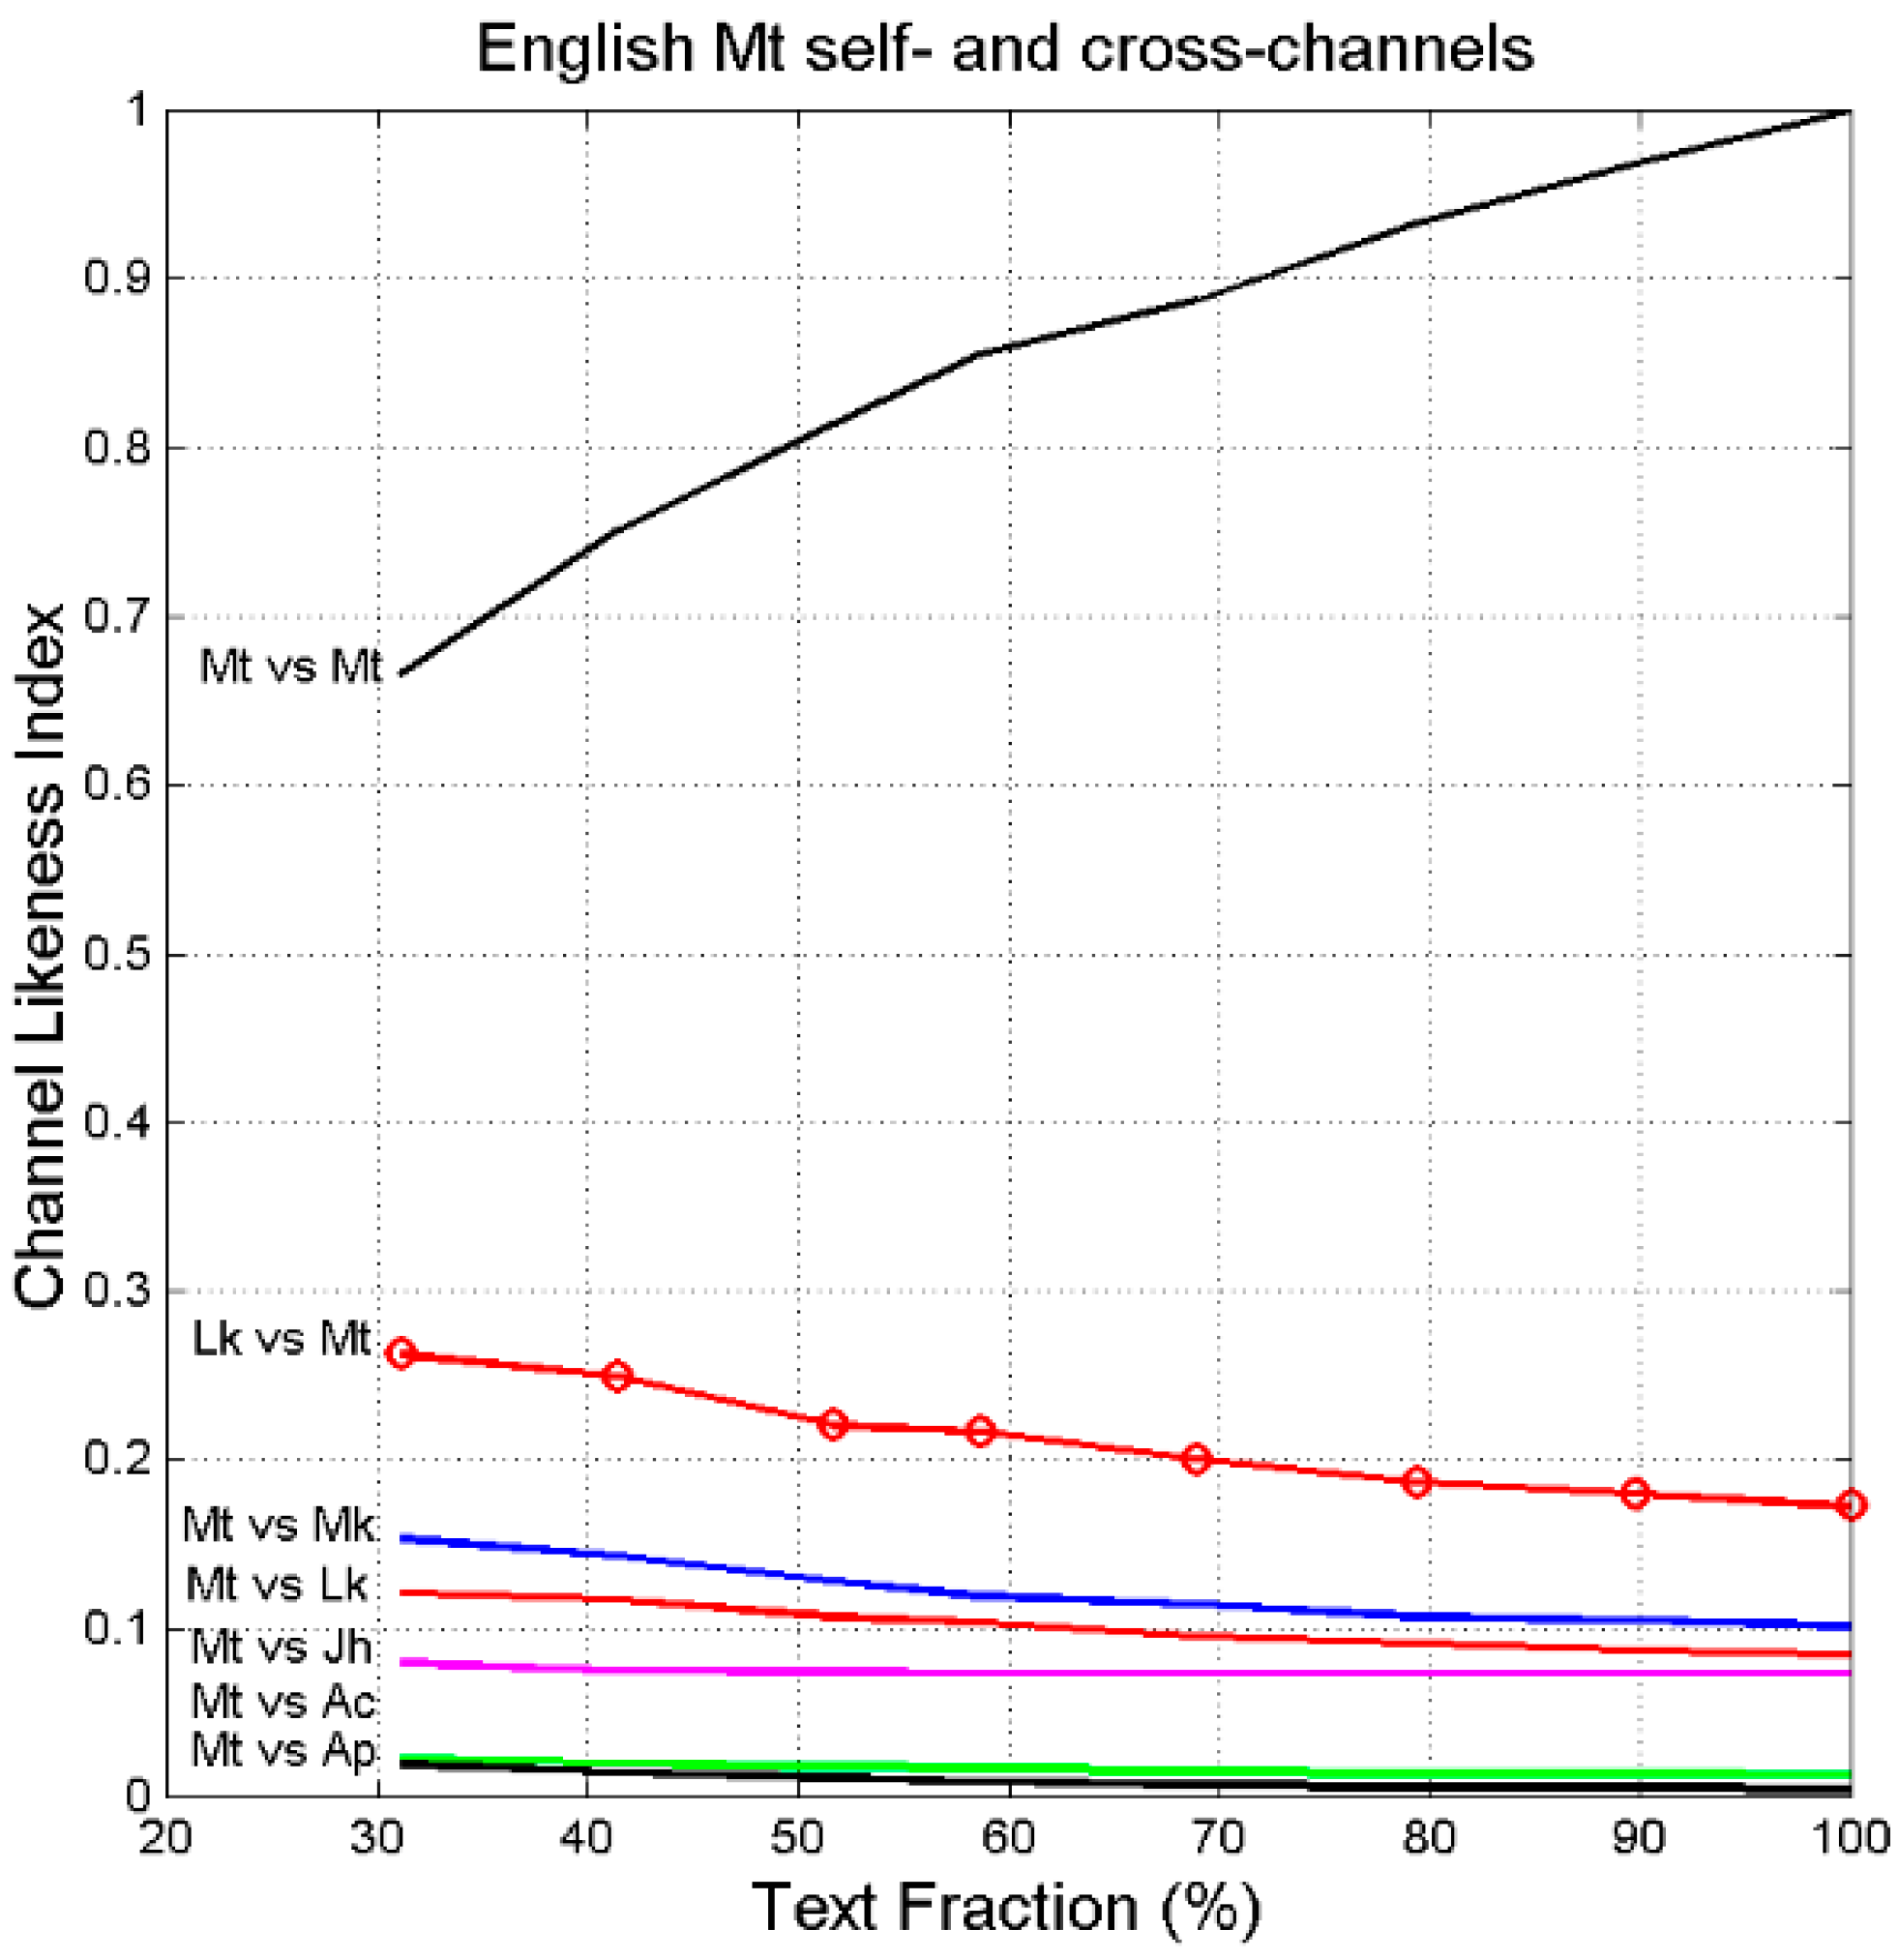
7. Channel Probability of Error and Likeness Index
- (a)
- In the self-channel Mt vs. Mt, , for any text fraction (, therefore 30% of Matthew compared with its full text retains a large likeness.
- (b)
- In the cross-channel Mt vs. Lk, for full-texts (100%), therefore indicating a large likeness when the full Mt is compared to the full Lk.
- (c)
- In the reverse channel Lk vs. Mt/Mt, for (right panel), therefore indicating a larger likeness when Luke is compared to Matthew.
- (d)
- In the cross-channel Lk vs. Mt/Lk (right panel) the likeness index is markedly larger than in the cross-channel Mt vs. Lk/Mt. This finding may support the conjencture, shared by many scholars (see [39]), that Matthew was written before Luke, and that Luke might have known Matthew when he wrote his text.
- (e)
- In the cross-channels Mt vs. Mk and Mt vs. Jh .
- (f)
- In the cross-channels Mt vs. Ac and in Mt vs. Ap .
8. Texts across Time
9. Concluding Remarks
Funding
Institutional Review Board Statement
Informed Consent Statement
Data Availability Statement
Conflicts of Interest
Appendix A. List of Mathematical Symbols
| Symbol | Meaning |
| number of characters per word | |
| fraction of text | |
| likeness index | |
| number of words per interpunction (word interval) | |
| slope of linear regression line | |
| number of interpunctions per sentence | |
| noise source | |
| number of sentences per chapter | |
| number of words per chapter | |
| correlation coefficient | |
| linguistic vector | |
| total noise-to-signal power ratio | |
| regression noise-to-signal power ratio | |
| correlation noise-to-signal power ratio | |
| number of words per sentence | |
| total number of sentences | |
| coordinate in the vector plane | |
| coordinate in the vector plane | |
| input language | |
| output language | |
| total number of words | |
| signal-to-noise power ratio in self- and cross-channels | |
| signal-to-noise power ratio in decibels | |
| experimental signal-to-noise power ratio (Monte Carlo simulation) | |
| regression signal-to-noise power ratio (due to ) | |
| correlation signal-to-noise power ratio (due to ) | |
| theoretical signal-to-noise power ratio |
Appendix B. Variability of Linear Regression Line Parameters
Appendix C. Minimum Probability of Error in Binary Decisions
References
- Matricciani, E. A Statistical Theory of Language Translation Based on Communication Theory. Open J. Stat. 2020, 10, 936–997. [Google Scholar] [CrossRef]
- Matricciani, E. Deep Language Statistics of Italian throughout Seven Centuries of Literature and Empirical Connections with Miller’s 7 ∓ 2 Law and Short-Term Memory. Open J. Stat. 2019, 9, 373–406. [Google Scholar] [CrossRef] [Green Version]
- Elmakias, I.; Vilenchik, D. An Oblivious Approach to Machine Translation Quality Estimation. Mathematics 2021, 9, 2090. [Google Scholar] [CrossRef]
- Proshina, Z. Theory of Translation, 3rd ed.; Far Eastern University Press: Manila, Philippines, 2008. [Google Scholar]
- Trosberg, A. Discourse analysis as part of translator training. Curr. Issues Lang. Soc. 2000, 7, 185–228. [Google Scholar] [CrossRef]
- Warren, R. (Ed.) The Art of Translation: Voices from the Field; Northeastern University Press: Boston, MA, USA, 1989. [Google Scholar]
- Williams, I. A corpus-Based study of the verb observar in English-Spanish translations of biomedical research articles. Target. Int. J. Transl. Stud. 2007, 19, 85–103. [Google Scholar] [CrossRef]
- Wilss, W. Knowledge and Skills in Translator Behaviour; John Benjamins: Amsterdam, The Netherlands; Philadelphia, PA, USA, 1996. [Google Scholar]
- Gamallo, P.; Pichel, J.R.; Alegria, I. Measuring Language Distance of Isolated European Languages. Information 2020, 11, 181. [Google Scholar] [CrossRef] [Green Version]
- Barbançon, F.; Evans, S.; Nakhleh, L.; Ringe, D.; Warnow, T. An experimental study comparing linguistic phylogenetic reconstruction methods. Diachronica 2013, 30, 143–170. [Google Scholar] [CrossRef] [Green Version]
- Petroni, F.; Serva, M. Measures of lexical distance between languages. Phys. A Stat. Mech. Appl. 2010, 389, 2280–2283. [Google Scholar] [CrossRef] [Green Version]
- Gao, Y.; Liang, W.; Shi, Y.; Huang, Q. Comparison of directed and weighted co-occurrence networks of six languages. Phys. A Stat. Mech. Appl. 2014, 393, 579–589. [Google Scholar] [CrossRef]
- Liu, H.; Cong, J. Language clustering with word co-occurrence networks based on parallel texts. Chin. Sci. Bull. 2013, 58, 1139–1144. [Google Scholar] [CrossRef] [Green Version]
- Gamallo, P.; Pichel, J.R.; Alegria, I. From Language Identification to Language Distance. Phys. A 2017, 484, 162–172. [Google Scholar] [CrossRef]
- Pichel, J.R.; Gamallo, P.; Alegria, I. Measuring diachronic language distance using perplexity: Application to English, Portuguese, and Spanish. Nat. Lang. Eng. 2019, 26, 434–454. [Google Scholar] [CrossRef]
- Eder, M. Visualization in stylometry: Cluster analysis using networks. Digit. Scholarsh. Humanit. 2015, 32, 50–64. [Google Scholar] [CrossRef]
- Brown, P.F.; Cocke, J.; Della Pietra, A.; Della Pietra, V.J.; Jelinek, F.; Lafferty, J.D.; Mercer, R.L.; Roossin, P.S. A Statistical Approach to Machine Translation. Comput. Linguist. 1990, 16, 79–85. [Google Scholar]
- Koehn, F.; Och, F.J.; Marcu, D. Statistical Phrase-Based Translation. In Proceedings of the HLT-NAACL 2003, Main Papers, Edmonton, AB, Canada, 27 May 2003; pp. 48–54. [Google Scholar]
- Michael Carl, M.; Schaeffer, M. Sketch of a Noisy Channel Model for the translation process. In Silvia Hansen-Schirra, Empirical Modelling of Translation and Interpreting; Czulo, O., Hofmann, S., Eds.; Language Science Press: Berlin, Germany, 2017; pp. 71–116. [Google Scholar] [CrossRef]
- Shannon, C.E. A Mathematical Theory of Communication. Bell Syst. Techn. J. 1948, 27, 379–423. [Google Scholar] [CrossRef] [Green Version]
- Lavie, A.; Agarwal, A. Meteor: An Automatic Metric for MT Evaluation with High Levels of Correlation with Human Judgments. In Proceedings of the Second Workshop on Statistical Machine Translation, Prague, Czech Republic, 23 June 2007; pp. 228–231. [Google Scholar]
- Banchs, R.; Li, H. AM-FM: A Semantic Framework for Translation Quality Assessment. In Proceedings of the 49th Annual Meeting of the Association for Computational Linguistics: Human Language Technologies, Portland, OR, USA, 19–24 June 2011; Volume 2, pp. 153–158. [Google Scholar]
- Forcada, M.; Ginestí-Rosell, M.; Nordfalk, J.; O’Regan, J.; Ortiz-Rojas, S.; Pérez-Ortiz, J.; Sánchez-Martínez, F.; Ramírez-Sánchez, G.; Tyers, F. Apertium: A free/open-source platform for rule-based machine translation. Mach. Transl. 2011, 25, 127–144. [Google Scholar] [CrossRef]
- Buck, C. Black Box Features for the WMT 2012 Quality Estimation Shared Task. In Proceedings of the 7th Workshop on Statistical Machine Translation, Montreal, QC, Canada, 7–8 June 2012; pp. 91–95. [Google Scholar]
- Assaf, D.; Newman, Y.; Choen, Y.; Argamon, S.; Howard, N.; Last, M.; Frieder, O.; Koppel, M. Why “Dark Thoughts” aren’t really Dark: A Novel Algorithm for Metaphor Identification. In Proceedings of the 2013 IEEE Symposium on Computational Intelligence, Cognitive Algorithms, Mind, and Brain, Singapore, 16–19 April 2013; pp. 60–65. [Google Scholar]
- Graham, Y. Improving Evaluation of Machine Translation Quality Estimation. In Proceedings of the 53rd Annual Meeting of the Association for Computational Linguistics and the 7th International Joint Conference on Natural Language Processing, Beijing, China, 26–31 July 2015; pp. 1804–1813. [Google Scholar]
- Espla-Gomis, M.; Sanchez-Martınez, F.; Forcada, M.L. UAlacant word-level machine translation quality estimation system at WMT 2015. In Proceedings of the Tenth Workshop on Statistical Machine Translation, Lisboa, Portugal, 17–18 September 2015; pp. 309–315. [Google Scholar]
- Costa-jussà, M.R.; Fonollosa, J.A. Latest trends in hybrid machine translation and its applications. Comput. Speech Lang. 2015, 32, 3–10. [Google Scholar] [CrossRef] [Green Version]
- Kreutzer, J.; Schamoni, S.; Riezler, S. QUality Estimation from ScraTCH (QUETCH): Deep Learning for Word-level Translation Quality Estimation. In Proceedings of the Tenth Workshop on Statistical Machine Translation, Lisboa, Portugal, 17–18 September 2015; pp. 316–322. [Google Scholar]
- Specia, L.; Paetzold, G.; Scarton, C. Multi-level Translation Quality Prediction with QuEst++. In Proceedings of the ACL-IJCNLP 2015 System Demonstrations, Beijing, China, 26–31 July 2015; pp. 115–120. [Google Scholar]
- Banchs, R.E.; D’Haro, L.F.; Li, H. Adequacy-Fluency Metrics: Evaluating MT in the Continuous Space Model Framework. IEEE/ACM Trans. Audio Speech Lang. Process. 2015, 23, 472–482. [Google Scholar] [CrossRef]
- Martins, A.F.T.; Junczys-Dowmunt, M.; Kepler, F.N.; Astudillo, R.; Hokamp, C.; Grundkiewicz, R. Pushing the Limits of Quality Estimation. Trans. Assoc. Comput. Linguist. 2017, 5, 205–218. [Google Scholar] [CrossRef] [Green Version]
- Kim, H.; Jung, H.Y.; Kwon, H.; Lee, J.H.; Na, S.H. Predictor-Estimator: Neural Quality Estimation Based on Target Word Prediction for Machine Translation. ACM Trans. Asian Low-Resour. Lang. Inf. Process. 2017, 17, 1–22. [Google Scholar] [CrossRef]
- Kepler, F.; Trénous, J.; Treviso, M.; Vera, M.; Martins, A.F.T. OpenKiwi: An Open Source Framework for Quality Estimation. In Proceedings of the 57th Annual Meeting of the Association for Computational Linguistics: System Demonstrations, Florence, Italy, 28 July–2 August 2019; pp. 117–122. [Google Scholar]
- D’Haro, L.; Banchs, R.; Hori, C.; Li, H. Automatic Evaluation of End-to-End Dialog Systems with Adequacy-Fluency Metrics. Comput. Speech Lang. 2018, 55, 200–215. [Google Scholar] [CrossRef]
- Yankovskaya, E.; Tättar, A.; Fishel, M. Quality Estimation with Force-Decoded Attention and Cross-lingual Embeddings. In Proceedings of the Third Conference on Machine Translation: Shared Task Papers, Belgium, Brussels, 31 October–1 November 2018; pp. 816–821. [Google Scholar]
- Yankovskaya, E.; Tättar, A.; Fishel, M. Quality Estimation and Translation Metrics via Pre-trained Word and Sentence Embeddings. In Proceedings of the Fourth Conference on Machine Translation, Florence, Italy, 1–2 August 2019; pp. 101–105. [Google Scholar]
- Lindgren, B.W. Statistical Theory, 2nd ed.; MacMillan Company: New York, NY, USA, 1968. [Google Scholar]
- Matricciani, E.; Caro, L.D. A Deep-Language Mathematical Analysis of Gospels, Acts and Revelation. Religions 2019, 10, 257. [Google Scholar] [CrossRef] [Green Version]
- Mazza, A. Studi Sulle Redazioni de I Promessi Sposi; Edizioni Paoline: Milan, Italy, 1968. [Google Scholar]
- Giovanni Nencioni, N. La Lingua di Manzoni. Avviamento Alle Prose Manzoniane; Il Mulino: Bologna, Italy, 1993. [Google Scholar]
- Guntert, G. Manzoni Romanziere: Dalla Scrittura Ideologica Alla Rappresentazione Poetica; Franco Cesati Editore: Firenze, Italy, 2000. [Google Scholar]
- Frare, P. Leggere I Promessi Sposi; Il Mulino: Bologna, Italy, 2016. [Google Scholar]
- Papoulis, A. Probability & Statistics; Prentice Hall: Hoboken, NJ, USA, 1990. [Google Scholar]
- Haykin, S. Communication Systems, 4th ed.; John Wiley & Sons: Hoboken, NJ, USA, 2001. [Google Scholar]


| Language | Family | ||||
|---|---|---|---|---|---|
| 1. Greek | Hellenic | 4.896 | 20.270 | 7.182 | 2.825 |
| 2. Latin | Italic | 5.132 | 17.450 | 5.051 | 3.465 |
| 3. Esperanto | Constructed | 4.468 | 19.586 | 4.798 | 4.083 |
| 4. French | Romance | 4.170 | 17.917 | 7.468 | 2.404 |
| 5. Italian | Romance | 4.281 | 17.534 | 5.982 | 2.931 |
| 6. Portuguese | Romance | 4.445 | 14.302 | 5.292 | 2.709 |
| 7. Romanian | Romance | 4.283 | 16.495 | 6.493 | 2.542 |
| 8. Spanish | Romance | 4.246 | 17.605 | 6.091 | 2.903 |
| 9. Danish | Germanic | 4.123 | 14.266 | 5.838 | 2.449 |
| 10. English | Germanic | 4.031 | 17.774 | 6.947 | 2.578 |
| 11. Finnish | Germanic | 5.844 | 15.509 | 4.784 | 3.248 |
| 12. German | Germanic | 4.646 | 16.403 | 5.805 | 2.830 |
| 13. Icelandic | Germanic | 4.381 | 14.363 | 5.331 | 2.706 |
| 14. Norwegian | Germanic | 4.073 | 15.377 | 7.474 | 2.062 |
| 15. Swedish | Germanic | 4.202 | 15.045 | 7.513 | 2.012 |
| 16. Bulgarian | Balto-Slavic | 4.375 | 14.284 | 5.522 | 2.590 |
| 17. Czech | Balto-Slavic | 4.519 | 12.326 | 4.755 | 2.605 |
| 18. Croatian | Balto-Slavic | 4.379 | 13.674 | 5.307 | 2.585 |
| 19. Polish | Balto-Slavic | 5.088 | 11.486 | 4.531 | 2.536 |
| 20. Russian | Balto-Slavic | 4.665 | 18.185 | 4.107 | 4.426 |
| 21. Serbian | Balto-Slavic | 4.196 | 13.943 | 5.614 | 2.484 |
| 22. Slovak | Balto-Slavic | 4.635 | 12.330 | 4.912 | 2.512 |
| 23. Ukrainian | Balto-Slavic | 4.590 | 13.891 | 4.696 | 2.960 |
| 24. Estonian | Uralic | 4.847 | 15.411 | 5.199 | 2.969 |
| 25. Hungarian | Uralic | 5.287 | 15.347 | 4.013 | 3.832 |
| 26. Albanian | Albanian | 4.032 | 21.013 | 6.434 | 3.287 |
| 27. Armenian | Armenian | 4.487 | 15.316 | 5.625 | 2.7261 |
| 28. Welsh | Celtic | 4.071 | 21.863 | 5.603 | 3.911 |
| 29. Basque | Isolate | 4.671 | 15.702 | 4.672 | 3.365 |
| 30. Hebrew | Semitic | 4.125 | 11.261 | 5.359 | 2.103 |
| 31. Cebuano | Austronesian | 4.695 | 15.464 | 8.351 | 1.862 |
| 32. Tagalog | Austronesian | 4.779 | 16.584 | 7.664 | 2.168 |
| 33. Chichewa | Niger-Congo | 6.084 | 12.464 | 6.067 | 2.071 |
| 34. Luganda | Niger-Congo | 6.236 | 12.543 | 5.599 | 2.254 |
| 35. Somali | Afro-Asiatic | 5.308 | 17.137 | 6.003 | 2.872 |
| 36. Haitian | French Creole | 3.343 | 14.351 | 6.181 | 2.326 |
| 37. Nahuatl | Uto-Aztecan | 6.699 | 13.725 | 6.197 | 2.228 |
| Text | Slope | Correlation Coefficient |
|---|---|---|
| Matthew | 0.0508 | 0.9410 |
| Mark | 0.0538 | 0.8985 |
| Luke | 0.0499 | 0.8975 |
| John | 0.0549 | 0.9181 |
| Acts | 0.0413 | 0.8807 |
| Apocalypse | 0.0338 | 0.8063 |
| Channel | |||||
|---|---|---|---|---|---|
| Mt vs. Mt (Self) | 1 | 1 | |||
| Mt vs. Mk | 0.9442 | 25.07 | 0.9940 | 19.70 | 18.59 |
| Mt vs. Lk | 1.0180 | 34.88 | 0.9938 | 18.86 | 18.76 |
| Mt vs. Jh | 0.9253 | 22.54 | 0.9981 | 24.77 | 20.50 |
| Mt vs. Ac | 1.2300 | 12.76 | 0.9890 | 14.72 | 10.62 |
| Mt vs. Ap | 1.5030 | 5.97 | 0.9589 | 7.04 | 3.46 |
| Channel | Average | Standard Deviation |
|---|---|---|
| Mt vs. Mt (self-channel) | 25.26 | 6.84 |
| Mt vs. Mk | 18.17 | 3.40 |
| Mt vs. Lk | 20.25 | 6.26 |
| Mt vs. Jh | 19.05 | 2.69 |
| Mt vs. Ac | 10.60 | 2.13 |
| Mt vs. Ap | 3.48 | 1.41 |
| Channel | Average | Standard Deviation |
|---|---|---|
| Mt | 25.26 | 6.84 |
| Mk | 21.45 | 7.14 |
| Lk | 23.19 | 7.00 |
| Jh | 24.60 | 7.03 |
| Ac | 23.70 | 6.27 |
| Ap | 20.01 | 6.87 |
Publisher’s Note: MDPI stays neutral with regard to jurisdictional claims in published maps and institutional affiliations. |
© 2022 by the author. Licensee MDPI, Basel, Switzerland. This article is an open access article distributed under the terms and conditions of the Creative Commons Attribution (CC BY) license (https://creativecommons.org/licenses/by/4.0/).
Share and Cite
Matricciani, E. Linguistic Mathematical Relationships Saved or Lost in Translating Texts: Extension of the Statistical Theory of Translation and Its Application to the New Testament. Information 2022, 13, 20. https://doi.org/10.3390/info13010020
Matricciani E. Linguistic Mathematical Relationships Saved or Lost in Translating Texts: Extension of the Statistical Theory of Translation and Its Application to the New Testament. Information. 2022; 13(1):20. https://doi.org/10.3390/info13010020
Chicago/Turabian StyleMatricciani, Emilio. 2022. "Linguistic Mathematical Relationships Saved or Lost in Translating Texts: Extension of the Statistical Theory of Translation and Its Application to the New Testament" Information 13, no. 1: 20. https://doi.org/10.3390/info13010020
APA StyleMatricciani, E. (2022). Linguistic Mathematical Relationships Saved or Lost in Translating Texts: Extension of the Statistical Theory of Translation and Its Application to the New Testament. Information, 13(1), 20. https://doi.org/10.3390/info13010020