Article

TraceAll: A Real-Time Processing for Contact Tracing Using Indoor Trajectories

1
Department of Computer Science, Umm Al-Qura University, Makkah 24236, Saudi Arabia
2
Department of Computer Engineering, Umm Al-Qura University, Makkah 24236, Saudi Arabia
3
Department of Computer Science and Statistics, University of Rhode Island, Kingston, RI 02881, USA
4
Faculty of Computers and Artificial Intelligence, Beni-Suef University, Giza 8655, Egypt
*
Author to whom correspondence should be addressed.
Information 2021, 12(5), 202; https://doi.org/10.3390/info12050202
Submission received: 14 March 2021 / Revised: 30 April 2021 / Accepted: 4 May 2021 / Published: 6 May 2021
(This article belongs to the Special Issue Big Spatial Data Management)

Abstract

:
The rapid spread of infectious diseases is a major public health problem. Recent developments in fighting these diseases have heightened the need for a contact tracing process. Contact tracing can be considered an ideal method for controlling the transmission of infectious diseases. The result of the contact tracing process is performing diagnostic tests, treating for suspected cases or self-isolation, and then treating for infected persons; this eventually results in limiting the spread of diseases. This paper proposes a technique named TraceAll that traces all contacts exposed to the infected patient and produces a list of these contacts to be considered potentially infected patients. Initially, it considers the infected patient as the querying user and starts to fetch the contacts exposed to him. Secondly, it obtains all the trajectories that belong to the objects moved nearby the querying user. Next, it investigates these trajectories by considering the social distance and exposure period to identify if these objects have become infected or not. The experimental evaluation of the proposed technique with real data sets illustrates the effectiveness of this solution. Comparative analysis experiments confirm that TraceAll outperforms baseline methods by 40% regarding the efficiency of answering contact tracing queries.

1. Introduction

Recently, infectious diseases, such as Ebola, COVID-19, and SARS, have been increasingly recognized as a serious, worldwide public health concern. Contact tracing activities are considered the most potent anti-infection agents. More specifically, the contact tracing process can be a fast and crucial implementation for reducing the spread of infectious diseases. Additionally, the contact tracing process allows the decision-makers of medical sectors to control the transmission of the disease and apply the quarantine on time.
Indeed, numerous studies have attempted to describe the contact tracing process. In [1], the authors describe the contact tracing process as a set of strategies that emphasize the controlling and monitoring of infectious diseases. From another perspective, in [2,3], the authors describe the contact tracing process as examining cases to prove their infection to all other individuals that were in physical contact with the patients in the recent past, which will lead to establishing the course of the infectious disease.
This paper proposes a technique TraceAll, which traces all the contacts exposed to an infected patient and generates a list of the potentially infected persons. The novelty of TraceAll lies in performing real-time tracing of suspected contacts.
First, the three fundamental parameters that must be defined before the tracing process starts are: (1) tracing period, which represents the incubation period of the virus or disease; (2) exposure time, which represents the exposure period between the infected patient and other individuals, implying that after this period these individuals may become infected; (3) social distance, which represents the average distance between the infected patient and other individuals, meaning that within this distance these individuals may become infected. Then, the infected patient (query user) marks himself as infected, and this represents a query to the technique. Next, the technique starts to inspect all objects that have been nearby the querying user and obtains their trajectories during the configured tracing period. Then, each trajectory obtained represents a suspected case, and the technique investigates it from two perspectives; exposure time and social distance. Next, the technique inspects each trajectory; it starts by identifying the meeting points between the querying user trajectory and other trajectories. Meeting points are points that the two trajectories are meeting each other at the same time at different points or the same point. Then, the technique computes if these trajectories remain with each other for a period equivalent to the configured exposure time within the configured social distance. If these two conditions match, the technique considers the object that owns this trajectory as a potentially infected patient and adds it to the infected patient list.
Indeed, the proposed technique employs two qualitative modes of tracing; (1) D i r e c t and (2) I n D i r e c t . The D i r e c t tracing mode means discovering the first level of contacts that are exposed to an infected patient; on the other hand, the I n D i r e c t tracing mode means iterative tracing for contacts of contacts that are exposed to an infected patient. This work distinguishes itself from other studies by utilizing the trajectories of the suspected individuals that have moved around the infected patient to address the infection transmission and identifies low-risk contacts and high risk-contacts. The proposed technique TraceAll experimentally proves that it is efficient in tracing the suspected contacts by building a novel 3D R-Tree [4,5,6] index structure that answers contact-tracing queries on time. Furthermore, TraceAll exploits D E u c l as a tunable parameter to filter out trajectories that are not around an infected patient, and this parameter proved experimentally to be an effective factor in saving processing time and enhancing the overall performance.
In this paper, the following contributions are made:
  • We develop a novel technique TraceAll for efficiently answering the contact tracing queries.
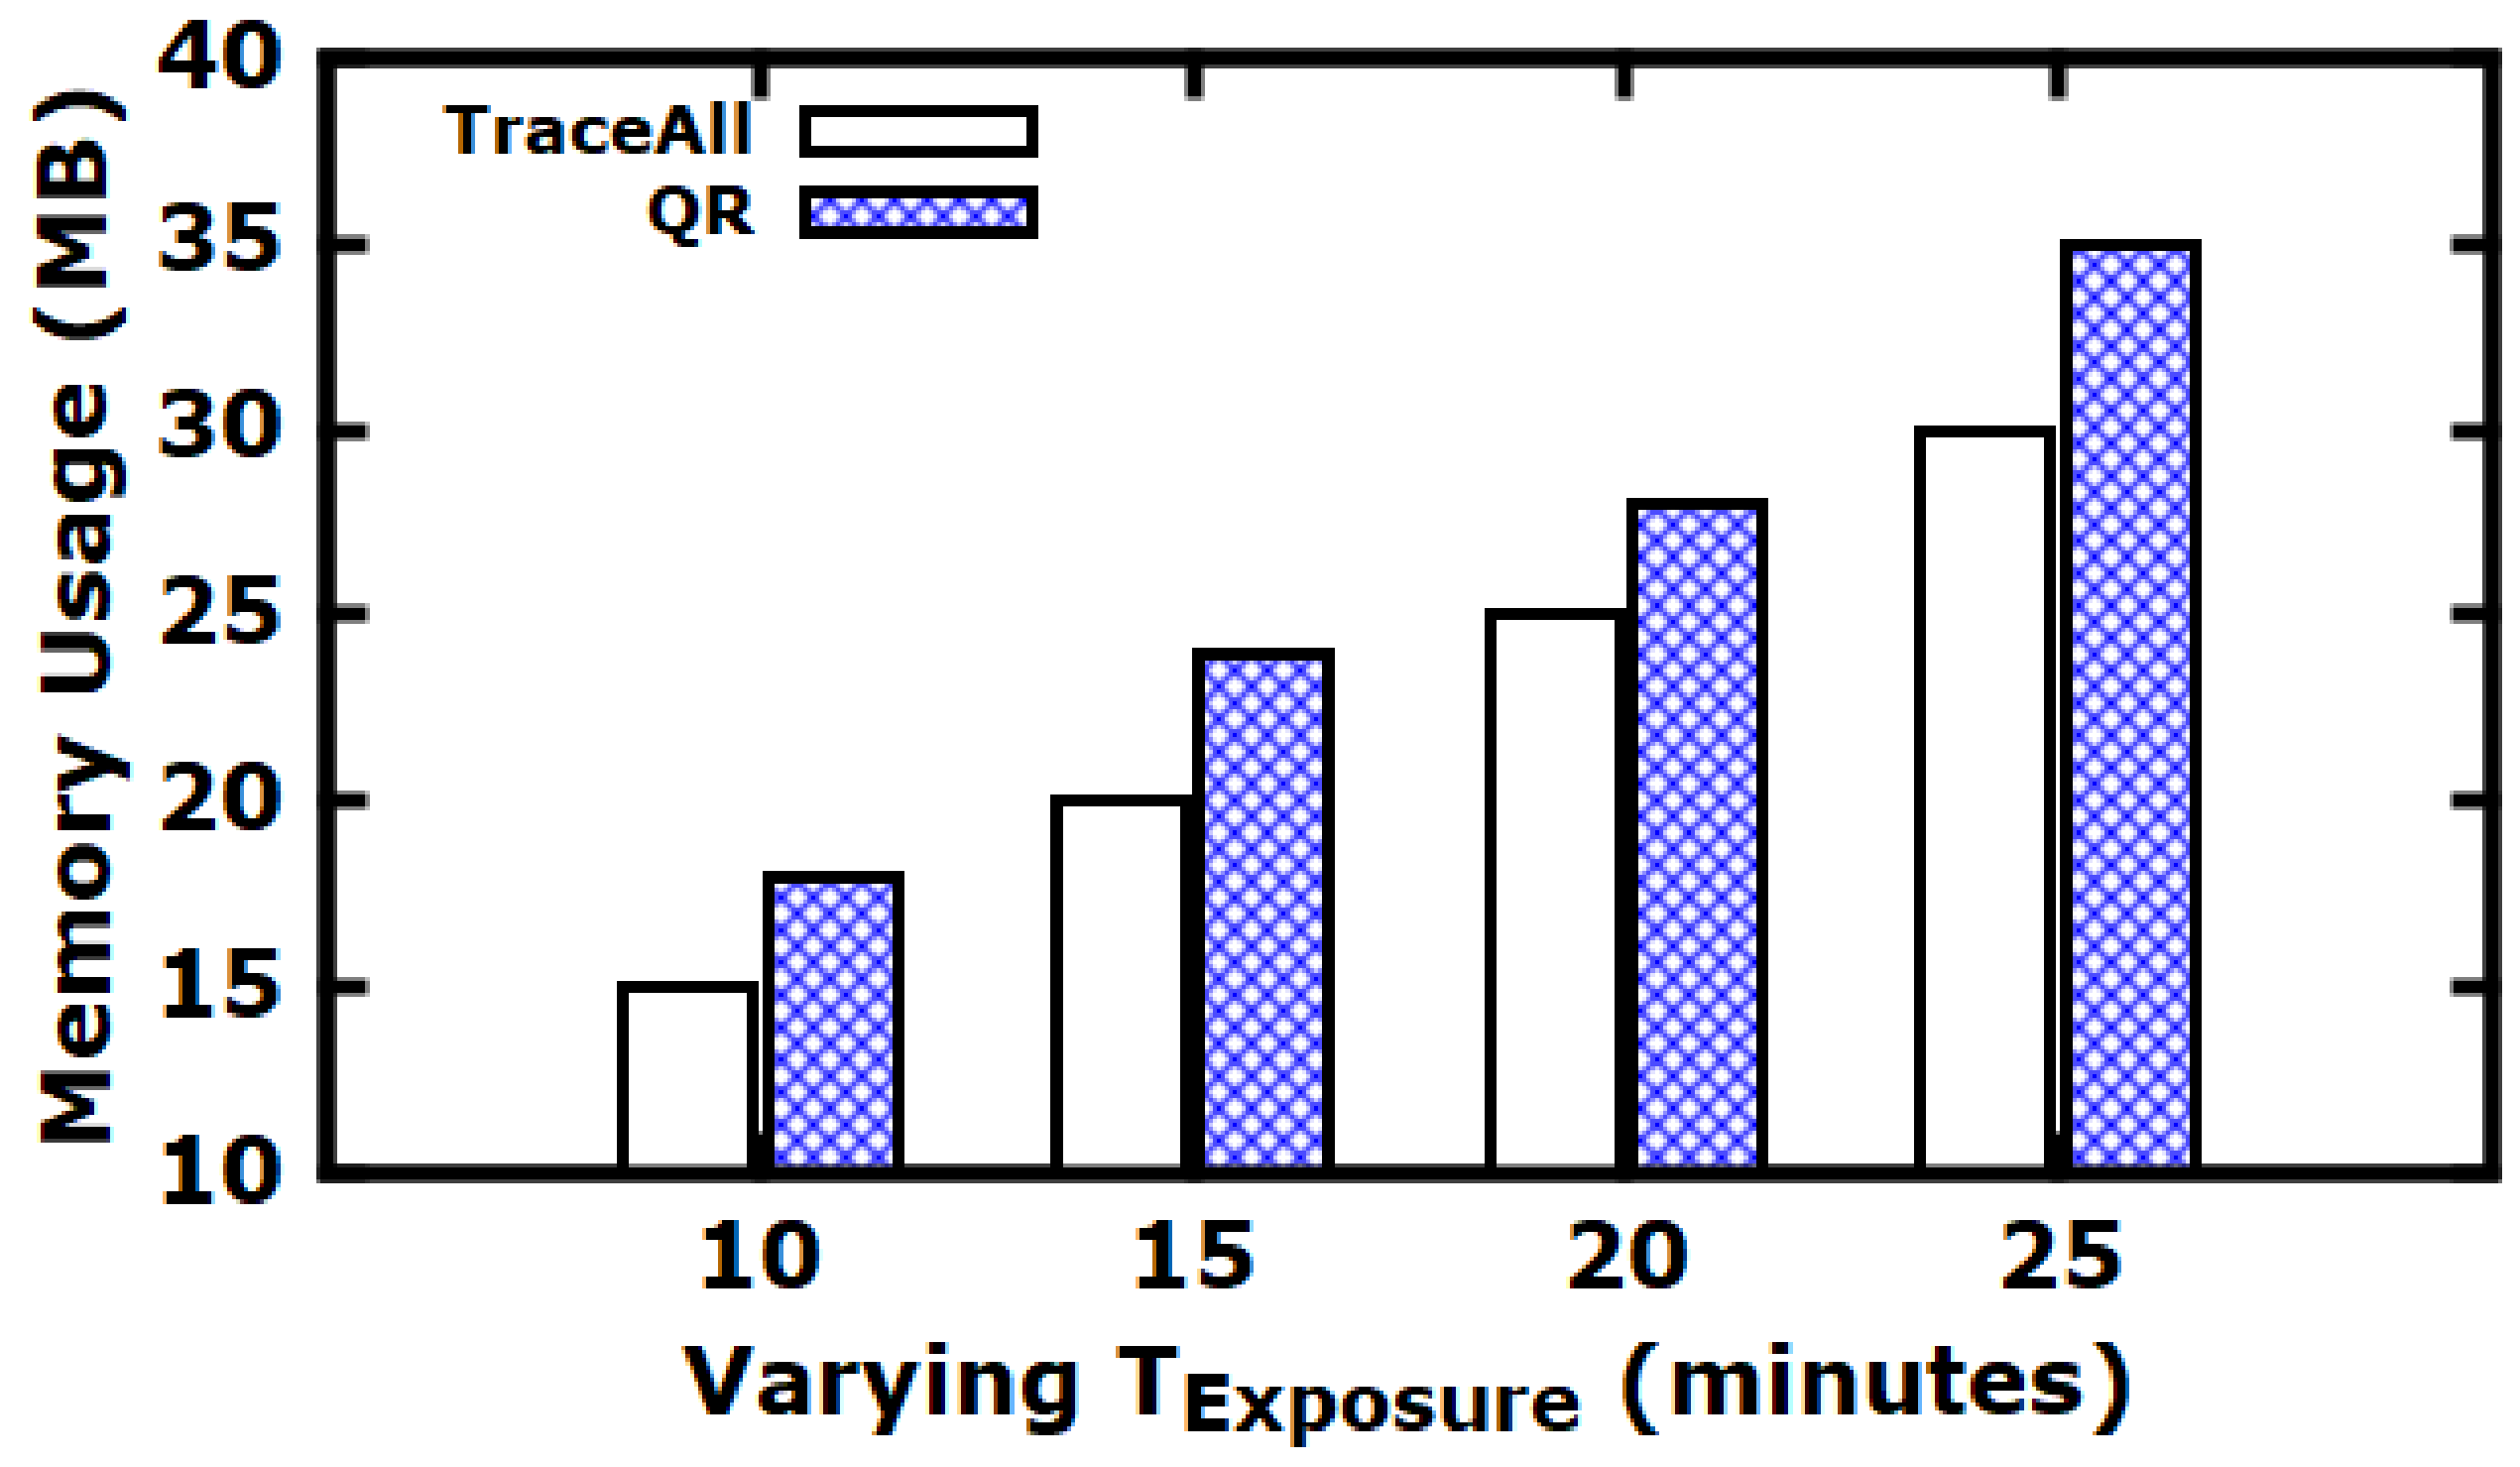
  • We reduce the total processing time to answer the queries by not scanning all the suspected trajectories but scanning only suspected parts.
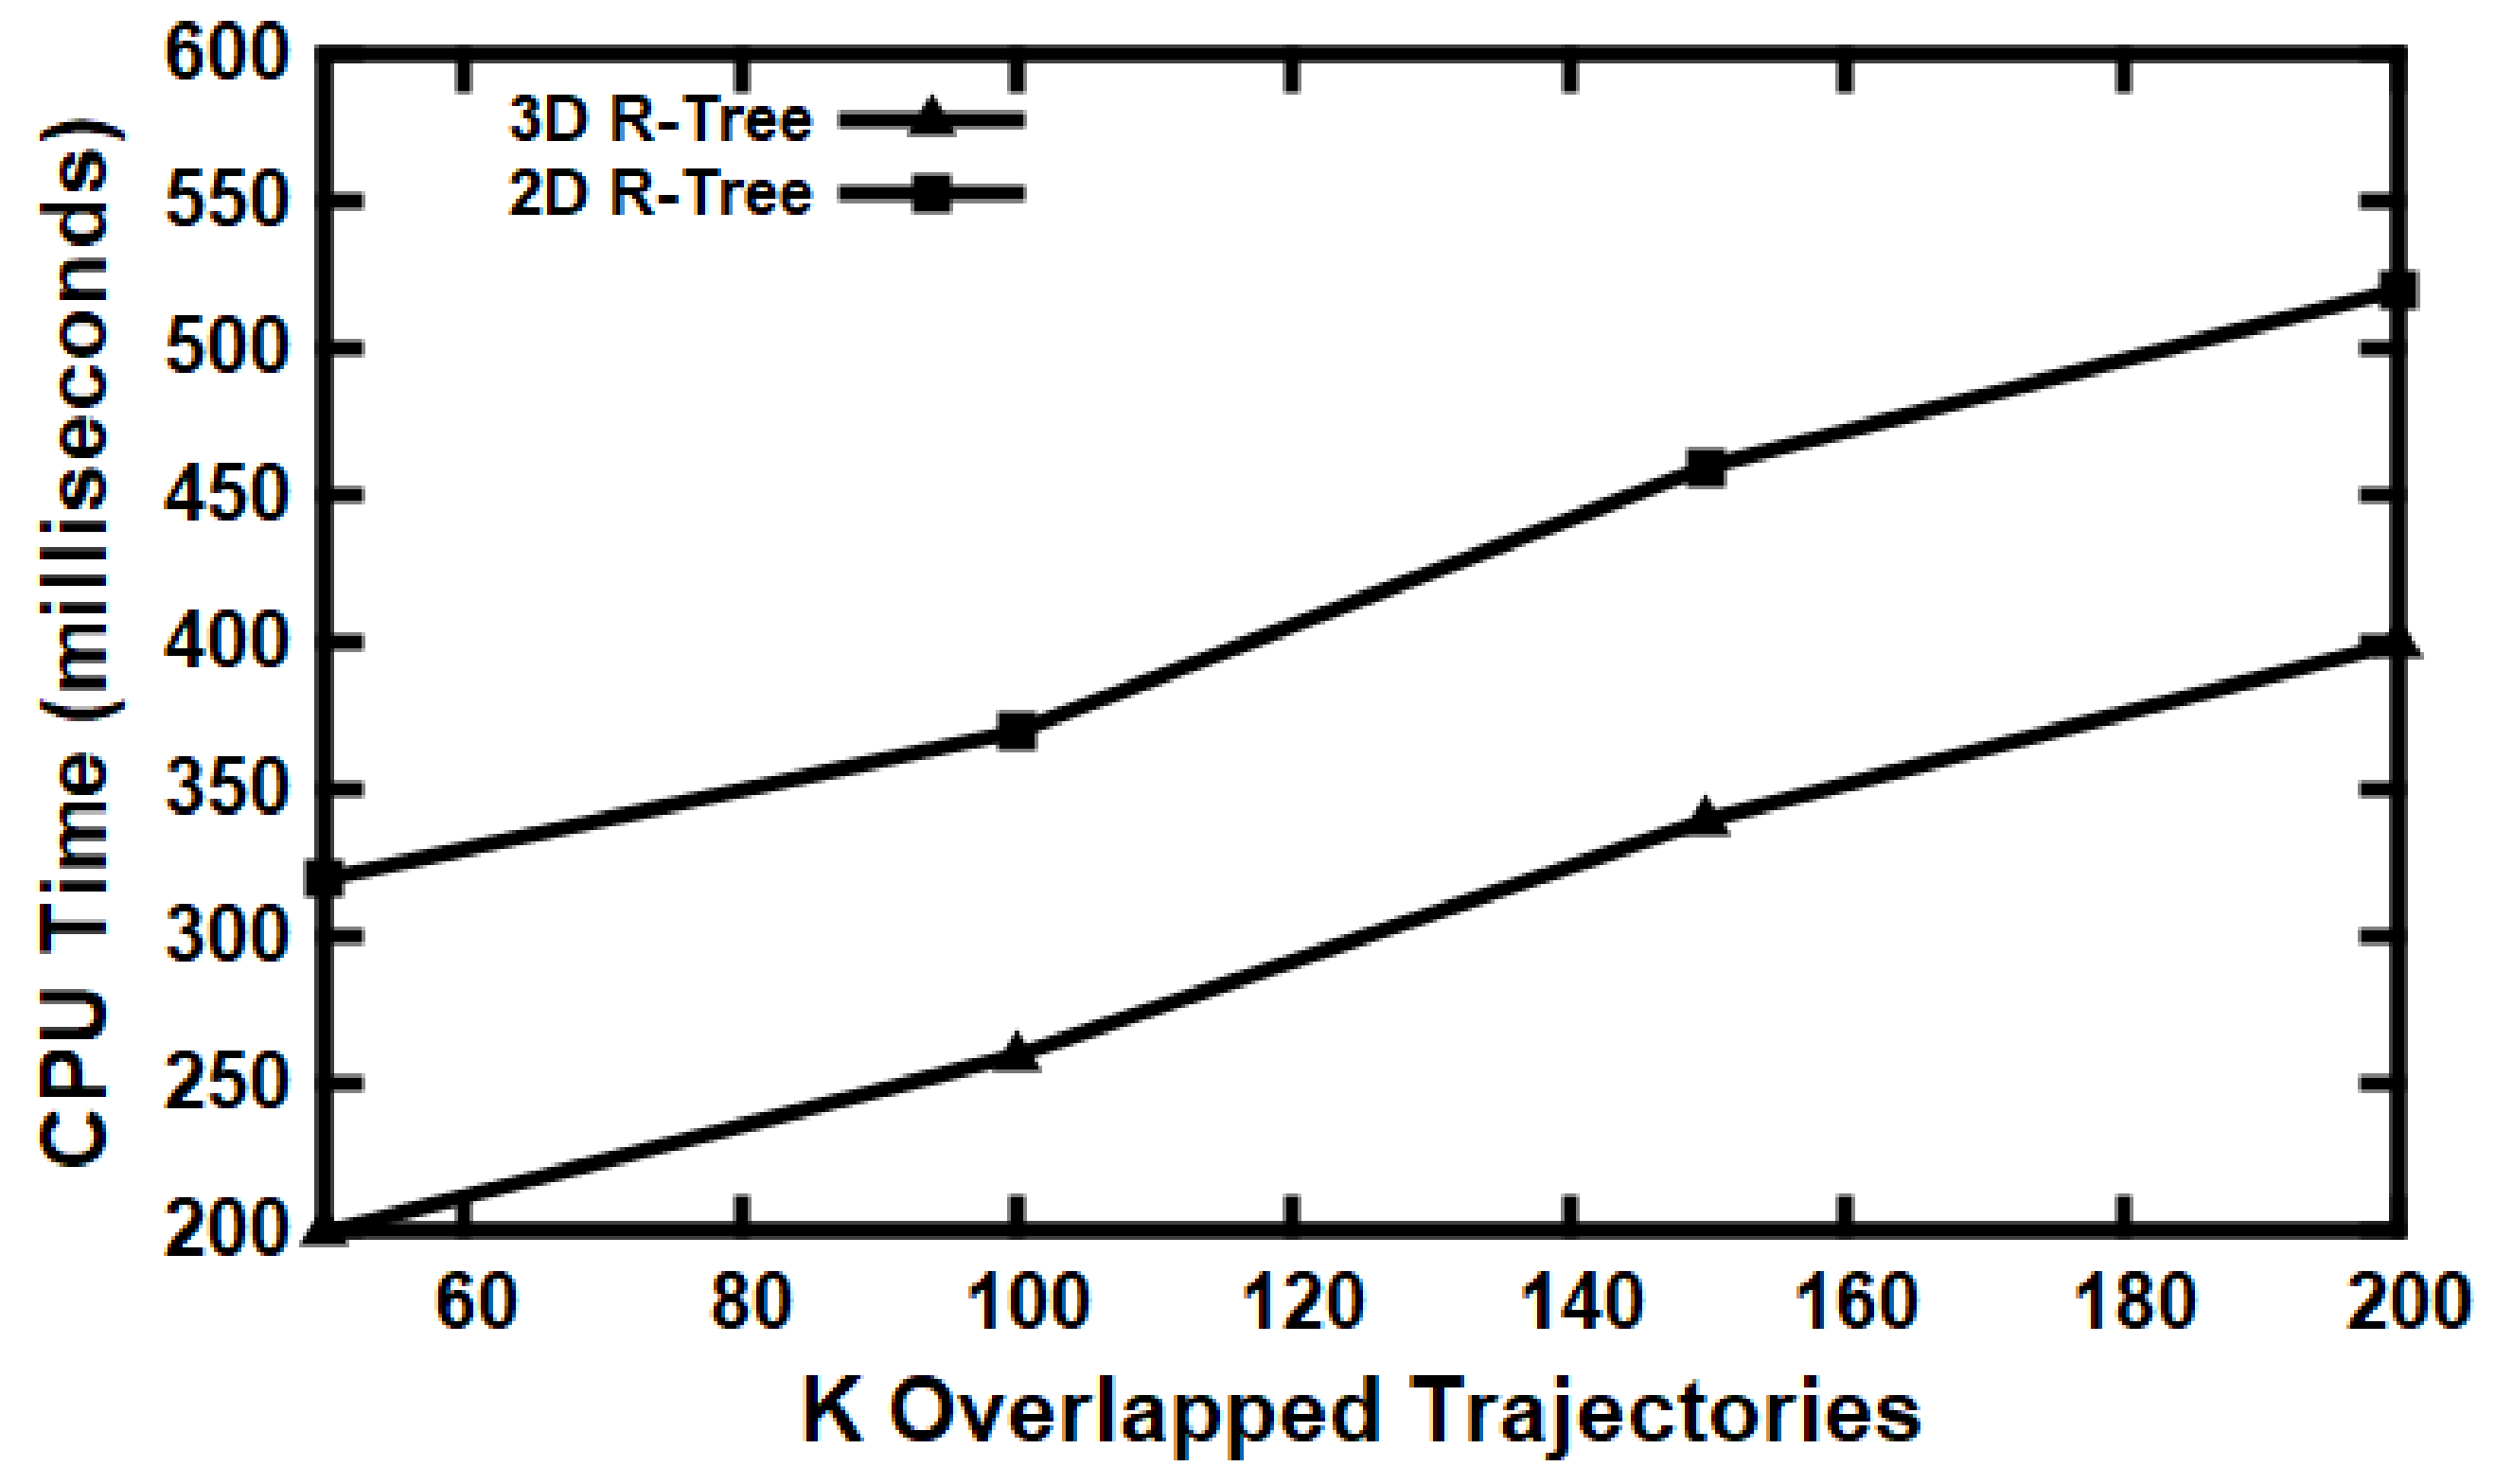
  • We adapt the three-dimensional R-Tree for fast retrieval purposes concerning the trajectories of suspected cases that may hold the infection.
  • We evaluate our technique on real data based on multiple metrics and present that they achieve our objectives.
The rest of this paper is organized as follows. Section 2 describes the previous studies in the area of contact tracing. Section 3 formally defines the problem and explores all the preliminary concepts. The proposed solution is described in Section 4. Section 5 experimentally evaluates our proposed solution. Finally, Section 6 concludes the paper.

2. Related Work

This section systematically reviews the previous studies related to the contact tracing process. More specifically, this work covers two major directions, namely, contact tracing methods and contact tracing applications.

2.1. Contact Tracing Methods

Surveys such as that conducted by [2,7,8,9,10,11,12,13,14,15] have been argued as contact tracing methods.
In [2,10], the authors argue for explanatory definitions for each type of contact tracing process, and these definitions were exploratory and interpretive. The authors classify these definitions into four types: (1) first-order, (2) single-step, (3) iterative, and (4) retrospective. The first-order contact tracing identifies all individuals that came into immediate physical direct contact with the infected patient and asking them to self-isolate and seek medical care. The first-order contact tracing does not care about tracing contacts of contacts. The single-step contact tracing identifies all individuals that came into immediate physical direct contact with the infected patient. Their contacts are traced, and the loop continues until all contacts are identified. The iterative contact tracing applies diagnostic tests to all individuals iteratively through symptom screening before they become infected. The main goal is no further infected patients exist. The retrospective contact tracing is the same as single-step or iterative but working in the reverse order to know who infected the patient.
In [7,8,9,11,12,13], the authors design a model that aims to assess the perfect timing of the contact tracing process. Moreover, the authors investigate three types of delays that need to be eliminated during the contact tracing process: (1) initiation delay of the process, (2) identification delays of the contacts, and (3) hospitalization delays. The model is employed to control the transmission of the Ebola virus, and findings indicate that quick contact tracing can lead to controlling the spread of the epidemic.
In [10], the authors point out the significance of examining the network of contacts for infected or suspicious cases and identifying all disease-transmission pathways. As a result, the authors propose two methods for contact tracing; pairwise-approximation and fully random simulation methods. Interestingly, the authors revealed that a positive correlation was found between the accuracy of contact tracing modeling and the prediction of the reproductive ratio of the disease, and they report that this correlation will help the medical sectors to notify infected and suspicious cases for immediate treatment and self-isolation at an early stage.
In [14,15,16], the authors design contact tracing models by utilizing IOT technologies. In [14], the authors present a contact tracing system model using IoT and blockchain, and moving objects can be tracked using an RFID transceiver and by storing the information on the blockchain to preserve the owner’s privacy until required. This proposed model succeeded in identifying super-spreading persons, animals, events, places, or objects. Furthermore, it can aid the development and implementation of public policies to control the spread of COVID-19 and prepare for any future epidemic or pandemic. In [15,16], the authors design a framework for assisting future designs and the evaluation of IoT-based contact tracing solutions and to enable data-driven collective efforts for combating current and future infectious diseases.
In [17], the authors propose methods that generate the related routes consisting of the sequence of steps necessary to reach precise cultural goals depending on the context. These methods consider the contact tracing process in their work.
In [18,19,20], authors propose deep learning models that can be used in real applications, such as medical diagnosis tasks, automatic driving systems, and object tracing. Nowadays, deep learning methods have shown great advantages in detecting and classifying moving objects for remote sensing image processing and analysis that can be used further for contact tracing activities. In general, deep learning methods face more challenges, such as being difficult to improve in a targeted manner. Furthermore, these models need to consider both optimization and generalization. Moreover, big data-driven deep learning models still have the overfitting problem; the neural network can perform well on the training set but cannot be effectively generalized on the unseen test data.

2.2. Contact Tracing Applications
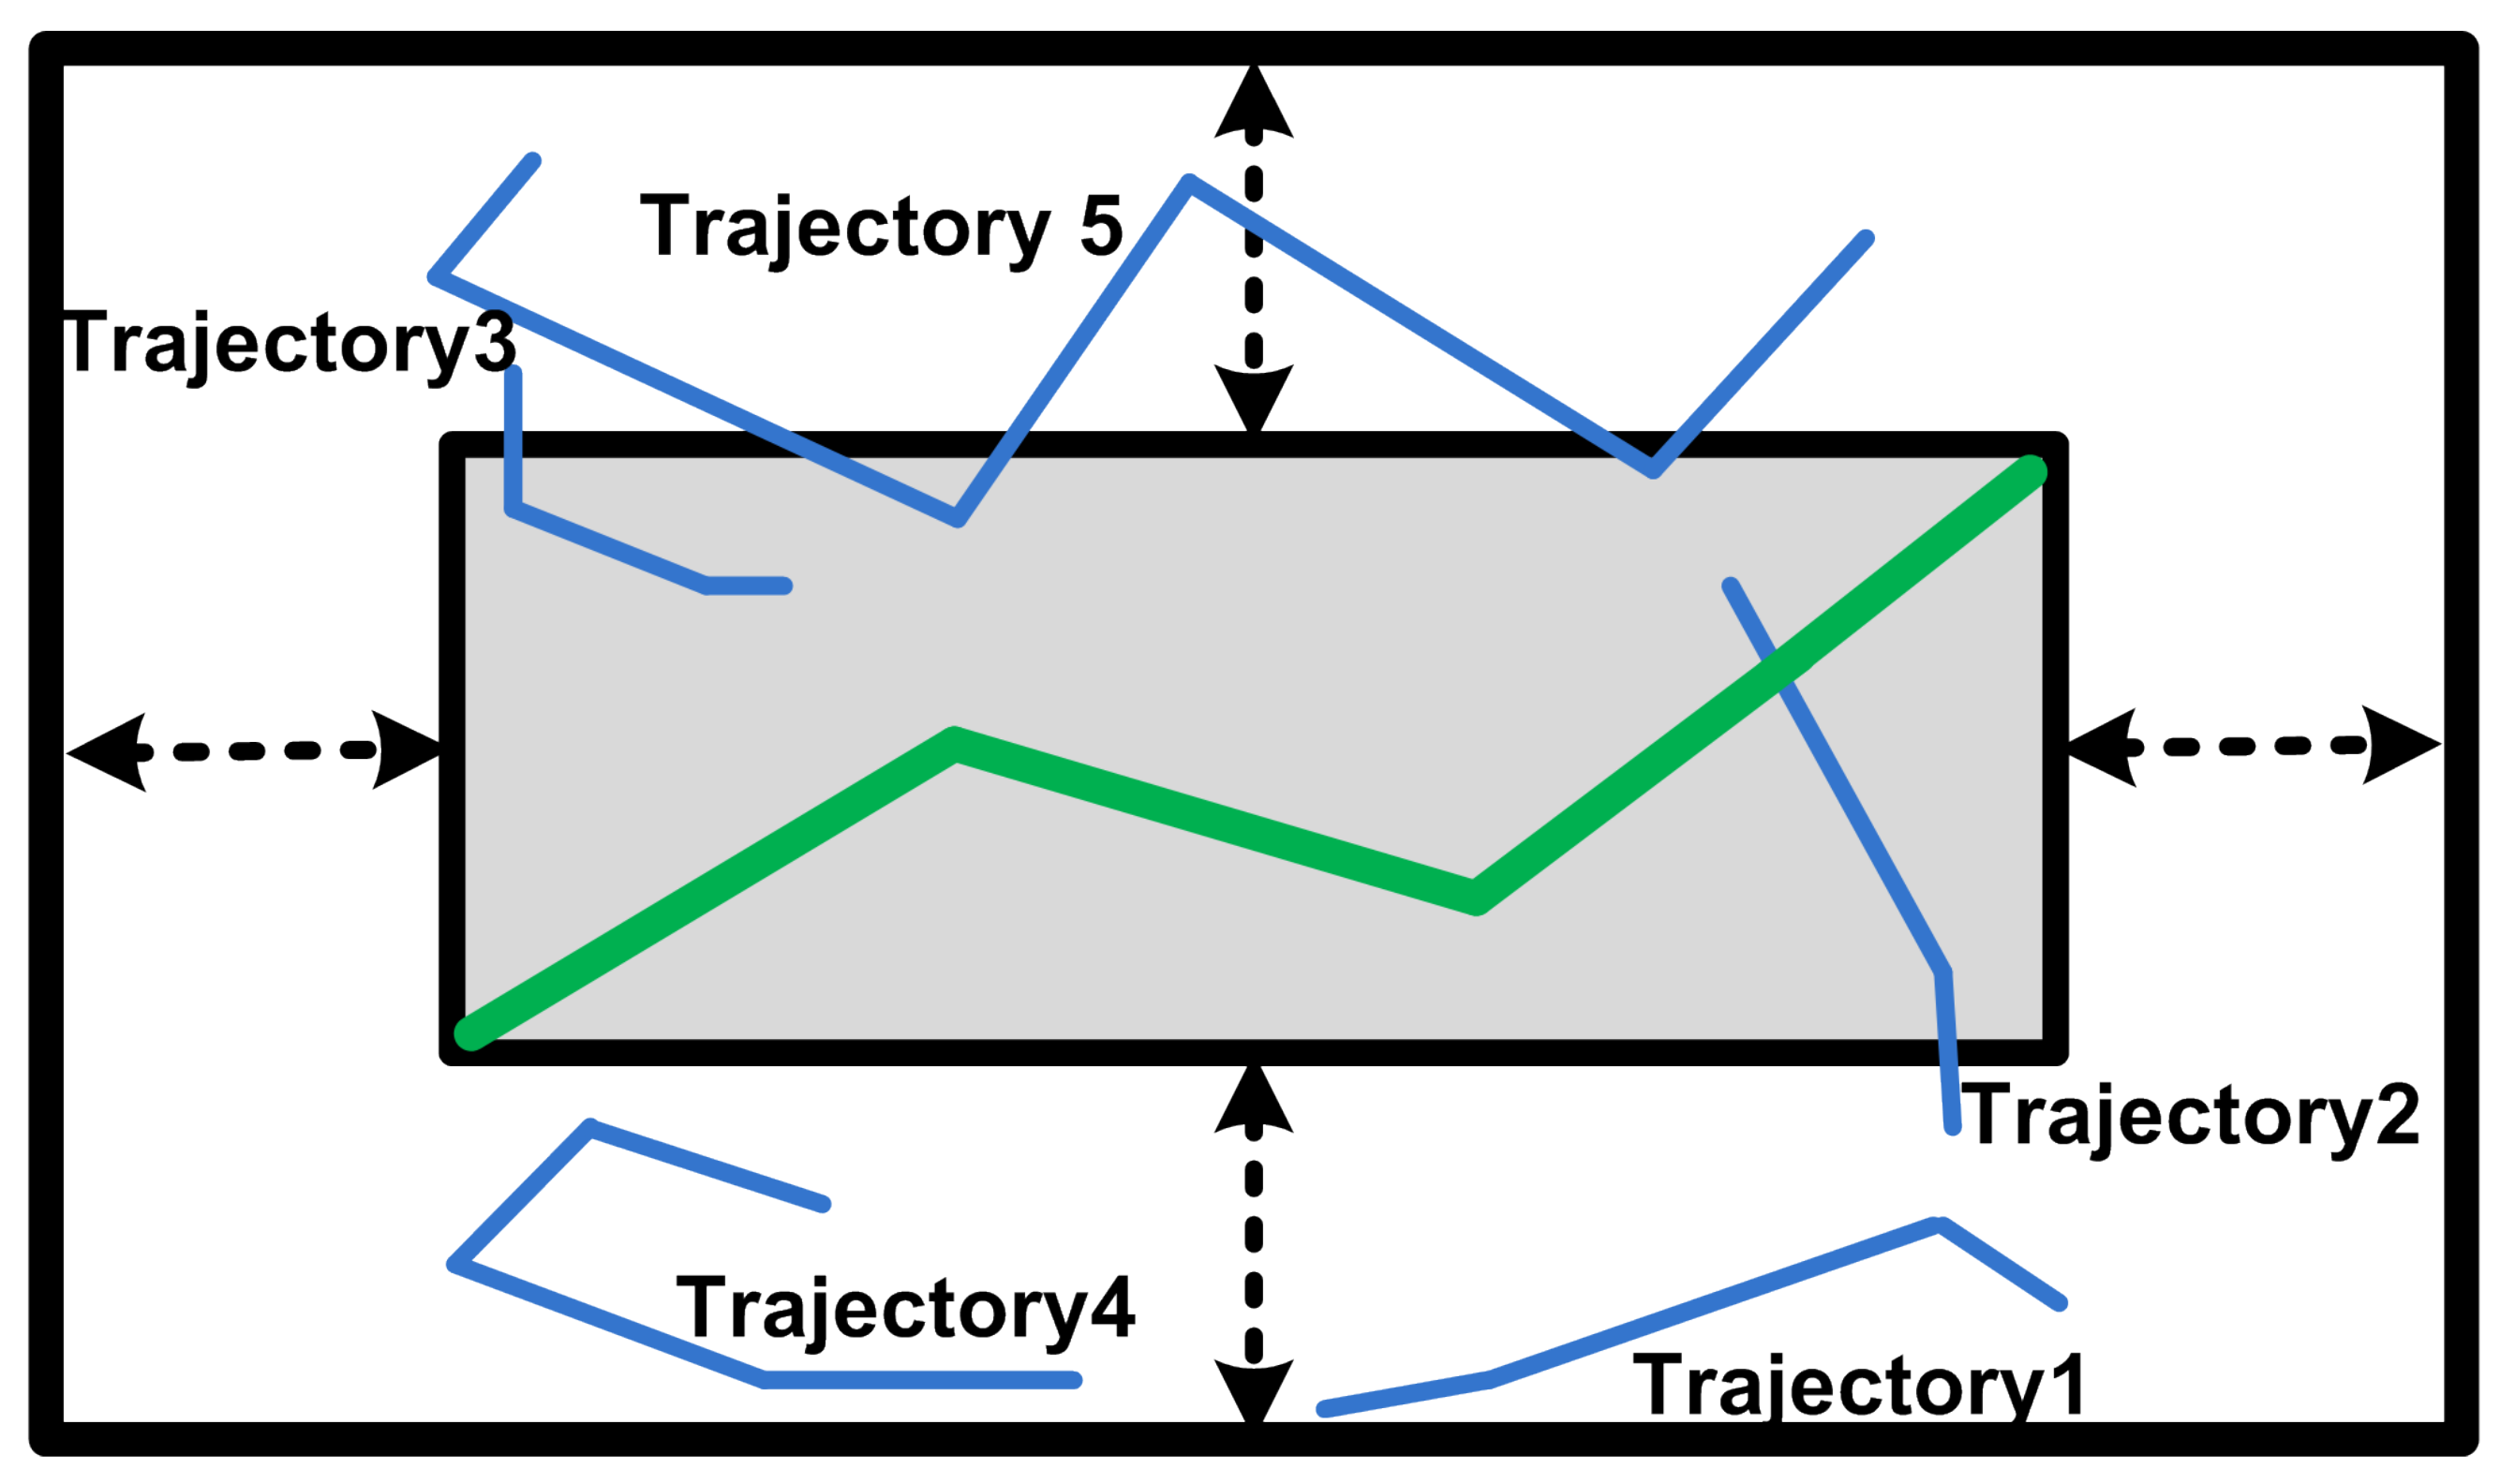
Several studies investigating contact tracing applications have been carried out in [21,22,23,24,25,26,27,28,29,30,31].
In May 2020, the Australian Government launched an application named COVIDSafe to fight the spread of coronavirus (COVID-19). The COVIDSafe application is a mobile application that utilizes Bluetooth technology to identify and find all persons that have been exposed closely to COVID-19 infected patients. First, the user installs the application, and after the application is successfully installed, a unique reference code is generated for this device. Then, COVIDSafe searches for other devices that have the app installed and are in close-proximity, and the application records a note for this contact by signing a digital handshake between these devices. Moreover, COVIDSafe records all information about the user, such as date and time, the proximity of the contact, and mobile phone device information (manufacture number, model number, serial number, operating system). Furthermore, COVIDSafe does not record the locations of the identified users due to privacy concerns. Next, if a user’s diagnostic test is a positive test of COVID-19, this infected user uploads his digital handshake information into the National COVIDSafe Data Store. Then, the official health sectors will call the close contacts of this infected person to instruct them to undertake diagnostic tests. It is critical to note that the COVIDSafe creates two time windows; the first window is 14 days, which is the incubation period of COVID-19, and the second window is 21 days, which includes the incubation period in addition to the time consumed to confirm the diagnosis for positive tests. The second window is created to allow COVIDSafe to carefully monitor and count continuous contacts during the first window. After 21 days, COVIDSafe deletes the contacts [21,22,23].
In May 2020, the Singaporean Government released an application named TraceTogether to trace close contacts of an infected patient. The TraceTogether mainly depends on using Bluetooth technology in the contact tracing process. First, after the application is installed, a unique user ID is created. Then, when two users of the application are connected, the proximity, duration, and device information are logged for 21 days. Once a user becomes an infected patient, the Ministry of Health (MOH) fetches all the contacts connected to the infected patient over the last 14 days [24].
Collectively, these studies [25,26,27] outline a critical role for using Bluetooth technology in the contact tracing process. They argue that this technology is the most suitable for the contact tracing process and proves its efficiency in proximity detection. In addition, they point out that the signal strength can be utilized to detect other devices within 2 m as a measurement of social distancing.
In [28], the authors propose and develop a peer-to-peer smartphone application for contact tracing that preserves user privacy by not considering any personal information about the end-user, such as location. This application permits the users to set checkpoints for the contact tracing based on their recent interactions and inspects their risk level.
The spread of Ebola virus disease in Liberia, Guinea, and Sierra Leone from 2014 to 2016 led to over 28,000 infected cases and over 11,000 deaths. Defining a surveillance plan for fighting the Ebola epidemic in these countries is the main objective. This surveillance plan includes the following activities and considers an effective response: (1) rapid diagnostic tests for suspected cases and other contacts who were in contact with infected individuals, (2) isolation for the infected cases, (3) effective contact tracing, and (4) tracing the transmission chains of the infection. The contact tracing process is considered as the core of this surveillance plan to identify all individuals who were in contact with Ebola-infected patients over the last 21 days (Ebola incubation period). Among the countries mentioned above, Sierra Leone is most affected by Ebola disease, with 8706 infected Ebola cases and 3956 deaths [29,30]. As a result, the authors in [31] utilize smartphone technology and develop a system for tracking contacts of Ebola cases in Sierra Leone. This system is linked with another alert system to notify and report symptomatic contacts to the District Ebola Response Centre. The results state that the application improves the data completeness of the suspected and symptomatic contacts.
A broader perspective was adopted by the authors of [32,33] for using social networking sites (SNS) in the contact tracing process. This is due to the growing popularity and flexible accessibility of these sites. The authors observed that using SNS will help the public health officials in tracing the contacts easily, detecting the outbreak early, controlling the disease, and detecting the high-risk regions early.

3. Problem Setting

This section presents the preliminary concepts that will be used throughout the rest of the paper. Then, the problem statement is discussed.

3.1. Preliminaries

Definition 1.
Exposure Time, T E x p o s u r e is a certain time interval for which a normal individual is exposed to an infected individual.
Definition 2.
Social Distance, D E u c l , is a certain distance for which a normal individual is nearby the infected individual.
Definition 3.
Contact Tracing Query, ( C T Q ), is the query that traces the contacts that have been connected with the infected patient either directly or indirectly within certain T E x p o s u r e and D E u c l .
Definition 4.
Meeting Point is the point where a normal individual meets with an infected individual at the same time, T D i f f ( i n f e c t e d , n o r m a l ) = 0 ; in this work T D i f f is measured in minutes.
Definition 5.
Direct Tracing is the discovery of contacts that have a direct physical connection with an infected person during a specific tracing period; these discovered contacts are named high-risk contacts.
Definition 6.
In-Direct Tracing is the contacts of contacts discovery in an iterative manner for persons that have a direct physical connection with an infected person during a specific tracing period. These discovered contacts are named as low-risk contacts.

3.2. Problem Statement

We are given the tracing period T r a c i n g p e r i o d , exposure time T E x p o s u r e , social spatial- distance for exposure D E u c l , and trajectories data set for objects moved in the space τ O t h e r s . Each trajectory included in τ O t h e r s is a sequence of traveled locations L and timestamps T paired for each location, and each location is represented by longitude and latitude values; τ = {( l 1 , T 1 ), ( L 2 , T 2 ), …, ( L N , T N )}. Let the query user Q u s e r be the object who becomes an infected patient, and its trajectory is τ Q . The τ Q represents the trajectory of the infected patient at a specific time. This is needed to extract a set of contacts C ( C τ O t h e r s ) that are exposed to the Q u s e r during T r a c i n g p e r i o d , and the exposure time consumed is greater than or equal T E x p o s u r e within spatial distance D E u c l . Additionally, this query is flagged by a Boolean flag named T r a c i n g M o d e , and this flag holds two values: (1) direct and (2) indirect. In the case of direct tracing, only contacts connected to the Q u s e r are returned as a result. This type of query is called a snapshot query (first level query). In the indirect case, contacts of contacts connected to the Q u s e r are returned during the tracing period. Initially, the contacts connected to Q u s e r are retrieved as in the direct tracing, and then recursive calls occur for the new retrieved list, where each user in this list is considered as a new Q u s e r . The break condition is the end date of the tracing period, so the recursion depth is represented by the T r a c i n g p e r i o d (count of days), which is a continuous query (multi-level query).
Cardinality of the query:  C suspected contacts that may have the infection. These contacts can be low-risk contacts or high-risk contacts.
Condition of the query: contacts that connect the Q u s e r during T r a c i n g p e r i o d , duration of contact between Q u s e r and other contacts ≥ T E x p o s u r e , and social distance between Q u s e r and other contacts ≤ D E u c l & T r a c i n g M o d e = (direct or indirect).
Illustrative Example: The τ Q record is represented as follows:
(20-August-2020—( L o c a t i o n 1 , 02 : 30 : 00 ) , ( L o c a t i o n 2 , 02 : 35 : 00 ) , ( L o c a t i o n 3 , 02 : 40 : 00 ) , , ( L o c a t i o n N , 02 : 55 : 00 ) ), and the tracing mode is direct. The objective is to get all traces of contacts that connected with Q u s e r starting from 6-August-2020 to 20-August-2020. In addition, on each day, the spatial distance between τ Q and other contacts trajectories is 2 m, and the common time spent between the Q u s e r and other contacts is greater than or equal to 10 min. It is critical to mention that if the tracing mode is indirect, the first list extracted for the Q u s e r needs to be fetched and each user in the list is considered as a new Q u s e r . The list belonging to each fetched Q u s e r needs to be iterated repeatedly until the end date of the tracing period is reached.
The input parameters for the contact tracing query are highlighted in Table 1.

4. Proposed Solution
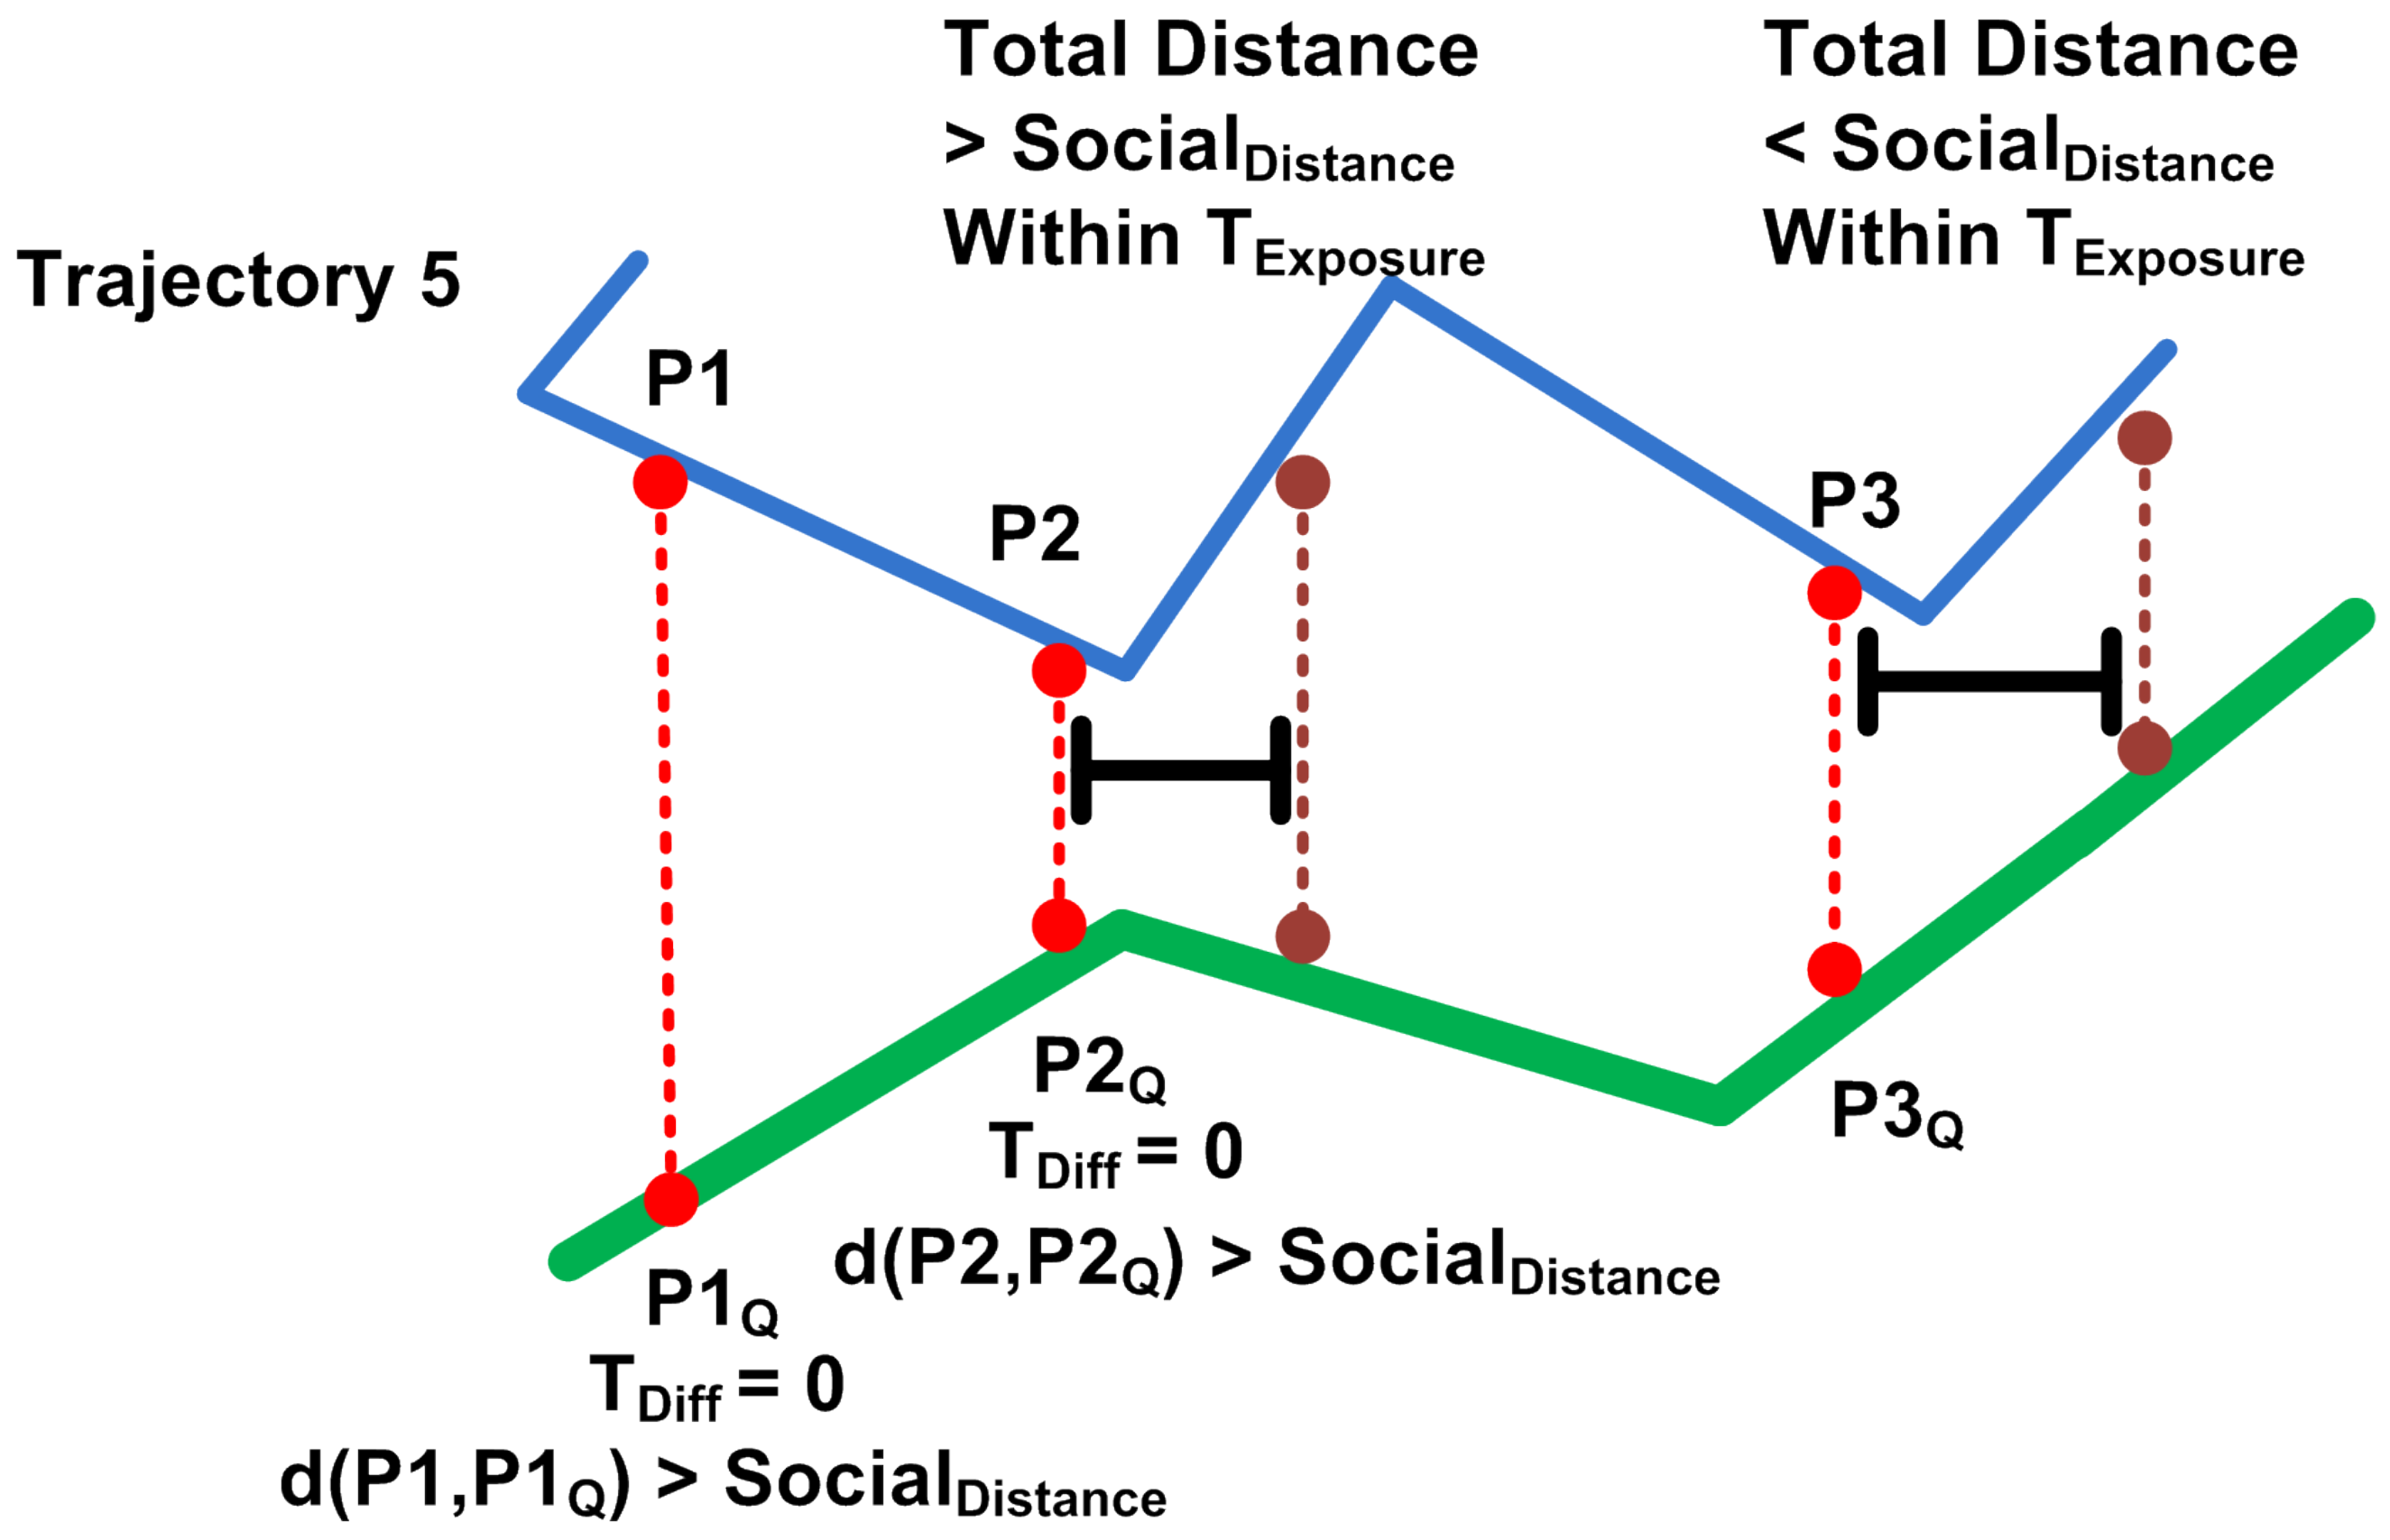
This section describes the proposed technique for retrieving a list of individuals who are exposed to the infected patient and need diagnostic tests.

4.1. Main Idea

The idea of the proposed solution is to retrieve a list of individuals who were exposed to the infected patient within a specific distance and for a certain period. First, the technique extracts all trajectories that moved between the start-time of the infected person trajectory and the end-time of the infected person trajectory. After that, the technique identifies all meeting points between the infected patient (query user) and other extracted trajectories. Meeting points mean that infected and normal persons meet at the same time at different points or the same point. Next, the technique iterates over the trajectories for each iterated trajectory, starting from these meeting points. The technique removes sub-trajectories from the query trajectory and the iterated trajectory. These sub-trajectories start from the meeting point time, and the meeting point time is incremented by the exposure time. After that, the technique computes the average distance between the created sub-trajectories. If the average distance is less than or equal to the identified social distance, the technique returns that the user of this trajectory is infected; otherwise, the technique jumps to the next meeting point and makes the same computations again.
The proposed solution has four major steps that are briefly discussed as follows:
Step 1: Bounds for the Query User’s Trajectory. The objective behind this step is to set bounds for the space-time of the query user’s trajectory. It identifies the start time and end time of the query object’s trajectory. Then, it creates a space region that covers the query user’s trajectory. This region is computed based on the minimum point (minimum longitude, minimum latitude) and maximum point (maximum longitude, maximum latitude) included in the query user’s trajectory. The inner rectangle in Figure 1 presents this step.
Step 2: Identify the Overlapped Region. The objective of this step is to create a region that catches all the trajectories of the nearest neighbors objects that moved around the query object’s trajectory, and these objects can be suspected and infected cases. This region is created by adding the D E u c l to all sides of the region created in step 1. More specifically, this created region contains the region bounds of the query object’s trajectory. The outer rectangle in Figure 1 presents this step.
Step 3: Extracts Overlapped Trajectories. The objective behind this step is to extract all trajectories that have traveled through the overlapped region created in step 2 between the start and the end time of the query object’s trajectory. The objects that own these trajectories are considered as suspected objects that need to be investigated.
Step 4: Extract Infected Trajectories. The objective behind this step is to extract all trajectories of the users in which their infection is confirmed based on disease infection conditions. These trajectories must match two major conditions: (1) distance between the trajectory and the query trajectory is less than or equal to the identified social distance for infection, and (2) the exposure time between the trajectory and the query trajectory is equal to the identified exposure time for infection.

4.2. Solution Overview

This section presents the two main algorithms that describe the full functionality of the proposed technique.
Algorithm 1 illustrates the pseudo-code of the proposed solution for the contact tracing. The algorithm has three input parameters: (a) tracing period T r a c i n g p e r i o d , which represents the incubation period for the disease, (b) time exposure threshold T E x p o s u r e , and (c) social distance D E u c l (if the measured distance is less than this distance, this confirms the infection may transmit from an infected individual to a normal one). The algorithm returns the potentially infected list of users based on their trajectories. First, when the infected patient (query user) raises the flag that he has become infected, the algorithm considers this date of the query as the start date of the tracing and subtracts the tracing period from the start date to generate the tracing end date (lines 13 to 14). In line 15, the algorithm iterates from the tracing start date to the tracing end date, and for each iteration, the algorithm obtains all the trajectories that belong to the infected patient on this day (line 17). In line 18, the algorithm iterates over the query user’s trajectories each day. Then, the algorithm sets boundaries for the iterated query object’s trajectory, and these boundaries concern space and time (line 22).
In line 24, the algorithm creates a region named the overlapped region to catch the trajectories of the nearest neighbors’ objects that moved nearby the query object’s trajectory. This region was created by adding the identified D E u c l to the boundaries created around the query object’s trajectory from all sides. Next, in line 26, the algorithm employs the three-dimensional R-Tree index to retrieve all trajectories included from the start time to the end time of the query object’s trajectory that moved through the overlapped region created in line 24. The algorithm considers these trajectories as suspected, and they need to be investigated from space and time perspectives to confirm the infection based on the disease transmission conditions. The algorithm iterates over these overlapped trajectories, and for each iteration, the algorithm checks the infection exposure criteria between the query object’s trajectory and iterated trajectory. If the iterated trajectory matches the identified criteria, the algorithm includes this trajectory in the infected list; otherwise, it iterates the exposure checks performed by Algorithm 2 (lines 27–32) again. It is critical to note that the algorithm configures the tracing modes before running occurs. If the tracing mode is “InDirect”, the algorithm makes recursive calls to retrieve the contacts of contacts by utilizing the direct tracing in each iteration (lines 35–40). Finally, the algorithm returns the infected list of users and their trajectories.
It is critical to note that for all points discovered with a time difference of zero and spatial distance less than or equal to the identified social distance, the proposed technique considers them as hotspots, which means places with significant risk or danger.
Algorithm 2 describes how the exposure is computed between the infected patient and a normal individual. The result indicates if the infection was transmitted to the normal individual from the infected patient or not. The algorithm receives four parameters: (a) τ 1 , which represents the trajectory of the infected patient; (b) τ 2 , which represents the trajectory of the suspected user; (c) T E x p o s u r e , which represents the identified exposure time period with the same value configured in Algorithm 1; (d) D E u c l , which represents the identified distance with the same value configured in Algorithm 1. The algorithm returns a boolean flag that indicates if this normal individual becomes infected or not. First, the algorithm iterates over both trajectories’ points to ensure if the objects’ of these trajectories meet each other at a specific point. In line 7, the algorithm checks if the time difference between the iterated points is 0 or not. If the time difference is 0, this means that these trajectories are at the same point or different points at the same time. The algorithm makes another check before starting the tracing by checking the distance between the meeting points P o i n t i from τ 1 and P o i n t j from τ 2 . If the distance is greater than the D E u c l , the algorithm does not complete the tracing and continues its iterations for other meeting points; otherwise, the algorithm completes the tracing. Subsequently, in line 9, the algorithm captures the time of P o i n t i and sets the value in a parameter named StartTime. After that, in line 10, the algorithm defines a new parameter named EndTime to store another specific time of a point.
Algorithm 1  TraceAll: Contact Tracer Technique
1:
procedure  Contact_Tracer
2:
INPUT: Tracing Period Tracingperiod, Time Threshold TExposure, Social Distance DEucl.
3:
    /* Overlapped Traces list */
4:
     Let OverlappedTracesList OL ϕ
5:
    /* Infected list */
6:
     Let SuspectedList IL ϕ
7:
    /* Overlapped Region */
8:
     Let OverlappedRegion RegionOverlapped ϕ
9:
    /* Region Bounding Query Trajectory */
10:
     Let Region Bounding τ Q ϕ
11:
    /* Query Trajectories List */
12:
     Let Q L τ ϕ
13:
     TracingStartDate = CurrentDate
14:
     TracingEndDate = CurrentDateTracingperiod
15:
    for TracingStartDate to TracingEndDate do
16:
        /* τ Q Query object’s trajectories */
17:
        Get Q L τ in iterated day
18:
        for each τ Q Q L τ  do
19:
           /* τ O t h e r s Other object’s trajectories */
20:
           Get τ O t h e r s in iterated day
21:
           /*Region created from max&min points τ Q */
22:
           Region τ Q = Bound τ Q
23:
           /*Add social distance to overlapped region*/
24:
           RegionOverlapped = DEucl + Region τ Q
25:
           /*Get traces in overlapped region by R-Tree*/
26:
           OLR-Tree(RegionOverlapped, τ O t h e r s )
27:
           for each oOL do
28:
               isExposed=IsExposed( τ Q ,o)
29:
               if  isExposed = True then
30:
                   add o to IL
31:
               end if
32:
           end for
33:
        end for
34:
    end for
35:
    if TracinMode = InDirect then
36:
        for 0 to Tracingperiod do
37:
           /*Increment IL by fetched contacts*/
38:
           Call Mobility_Tracer
39:
        end for
40:
    end if
41:
end procedure
42:
OUTPUT: Return objects belongs to IL
The algorithm computes the EndTime by adding T E x p o s u r e to the StartTime defined at line 9. Next, the algorithm obtains the sub-trajectory from τ 1 (starting from a point located at the StartTime and extending to the point that exists at the EndTime) and stores the result as a new variable named S u b τ 1 (line 12). Similarly, the algorithm obtains the sub-trajectory from τ 2 (starting from a point located at the StartTime and extending to the point that exists at the EndTime) and stores the result as a new variable named S u b τ 2 (line 14). In line 16, the algorithm computes the average distance between the created sub-trajectories. If the average distance is less than or equal D s o c i a l , the algorithm returns that the τ 2 belongs to an infected individual and breaks the loops; otherwise, the algorithm continues the iterations.
Algorithm 2 Is Exposed
1:
procedure  IsExposed
2:
INPUT: Trajectory 1 τ 1 , Trajectory 2 τ 2 , Time Threshold, TExposure, Social Distance D E u c l .
3:
     let isExposed f a l s e
4:
    for each Pointi τ 1  do
5:
        for each Pointj τ 1  do
6:
           /* Checks if τ 1 a n d τ 2 meets */
7:
           if  TDiff(Pointi, Pointj) = 0
8:
           &dist(Pointi, Pointj) ≤ DEucl then
9:
               StartTime = TimeStamp of Pointi
10:
               EndTime = startTime + TExposure
11:
               /*Points from startTime to EndTime τ 1 */
12:
                Sub τ 1 = Sub-Trajectory from τ 1
13:
               /*Points from startTime to EndTime τ 2 */
14:
               Sub τ 2 = Sub-Trajectory from τ 2
15:
               /* Computes the average distance */
16:
               if dist(Sub τ 1 , Sub τ 2 ) ≤ DEucl then
17:
                   isExposed = true
18:
                   Break loops; Return the result
19:
               end if
20:
           end if
21:
        end for
22:
    end for
23:
end procedure
24:
OUTPUT: Return is Exposed
It is important to bear in mind that the distance between S u b τ 1 and S u b τ 2 when meeting points are discovered is measured based on the Hausdorff distance technique [34,35,36]. The Hausdorff distance technique is described in detail in Section 4.3. Indeed, the technique iterates over points S u b τ 1 , and in each iteration, computes the distance between S u b τ 1 points and S u b τ 2 points, obtains the minimum distance for each point comparison, and finally, produces the maximum of minimum distances generated in each iteration. Likewise, the technique iterates over points S u b τ 2 , and in each iteration, computes the distance between S u b τ 2 points and S u b τ 1 points, obtains the minimum distance for each point comparison, and finally, produces the maximum of minimum distances generated in each iteration. In the end, the technique produces the maximum for scores obtained from S u b τ 1 and S u b τ 2 , and this distance is considered the total distance between S u b τ 1 and S u b τ 2 .
In this work, we adapt the Hausdorff technique to cope with the proposed cases. The adaption is made by considering if the distance between any two points exceeds the D E u c l , the Hausdorff technique stops scanning other points and returns to Algorithm 2 that the calculated distance between the compared sub-trajectories is greater than D E u c l , which saves more processing time.
Figure 1 illustrates how the proposed technique bounds the query object’s trajectory and creates the overlapped region. First, it searches for the minimum point and maximum point in the query object’s trajectory. The maximum point means maximum longitude and latitude through the query object’s trajectory, and the minimum point means minimum longitude and latitude through the query object’s trajectory. Next, it calculates the height and width of the rectangle region that surrounds the query object’s trajectory. According to the rectangle boundaries created around the query object’s trajectory, the technique starts to create the overlapped region by adding the identified “social distance” D E u c l to all sides of the created rectangle and generates a larger rectangle to be the overlapped region.
Figure 2 provides an overview of how the proposed technique catches the nearest neighbor’s trajectories that move around the query object’s trajectory and considers them as suspected cases. First of all, the system exploits the overlapped region that resulted from Figure 1 and employs a three-dimensional R-Tree to perform a range query to obtain all trajectories located in the overlapped region that are also between the start and the end time of the query object’s trajectory. In particular, the three dimensions here mean two dimensions of space and one dimension for time. More specifically, R-Tree is a tree index structure used to handle spatial data objects efficiently. The main idea of the R-Tree structure is to group nearby spatial objects and store them in a minimum bound rectangle (MBR) in the next level of the tree (the R character in the word R-Tree stands for the rectangle). This work chooses R-Tree because it is much faster in nearest-neighbor queries and window queries, such as “inside”, “covers”, and “contains”.
Figure 3 provides a detailed overview of the breakdown of the tracing process, according to three fundamental properties; meeting points, social distance, and exposure time. Furthermore, Figure 3 presents the intercorrelations among these properties. After getting the overlapped trajectories from Figure 2, the proposed technique starts to inspect each overlapped trajectory. Figure 3 describes three cases for inspection to detect if this trajectory belongs to an infected patient or not. In the first case, in point P1, the proposed technique detects that the time difference between P1 and the corresponding point P 1 Q in the query object’s trajectory is zero, but the distance between these two points is greater than the identified social distance D E u c l , so the technique continues scanning other parts of the trajectories. In the second case, the technique detects that the time difference between point P2 and the corresponding point P 2 Q in the query object’s trajectory is zero, and after that, the technique checks the distance between these points and finds that the distance is less than the identified social distance. As a result, the technique starts to capture the sub-trajectories from both trajectories (query object’s trajectory and trajectory 5) to compare them. These sub-trajectories were created by selecting a part from each trajectory, starting from points with time difference zero until the point at a time after adding the identified “exposure time”. Then, the technique computes the average distance between these sub-trajectories; in this case, the technique finds that the average distance is greater than the identified social distance, so the technique continues scanning other parts of the trajectories. In case 3, it is the same as case 2, except that the average distance between the created sub-trajectories is less than the identified social distance, and the technique identifies that this trajectory belongs to an infected user.
The robustness of our proposed solution lies in answering contact tracing queries efficiently and in a responsive time manner. Furthermore, the flexibility in retrieving the contacts and flexibility to configure the incubation period of the disease allows the end-user to easily control the contact tracing process in real-time.

4.3. Hausdorff Distance Calculation.

The Hausdorff technique measures how far two subsets of points are from each other with respect to metric space. The Hausdorff working is as follows: Given two point sets A and B, as per Equation (1), the Hausdorff distance between A and B scans each point of A, finds the closest neighbor point from B, and the most mismatched point of A (the point that is farthest from any point of B) identifies the result of h ( A , B ) as per Equation (2). Moreover, if h ( A , B ) = d , then each point of A must be within distance d of some point of B, and there is also some point of A (the most mismatched point) that is exactly distance d from the nearest point of B. The key equations of the Hausdorff technique are described as follows:
H ( A , B ) = m a x ( h ( A , B ) , h ( B , A ) )
where,
h ( A , B ) = max   min a b , a A , b B
Figure 4 represents an illustrative example of how the Hausdorff metric works. It computes the distances between two point sets A and B. First, the Hausdorff metric iterates over the points in set B and computes the distance between each point in B and each point in A. For each iteration, the Hausdorff metric takes the minimum and, at the final step, takes the maximum score of the minimum distances, as shown in Figure 4a,b. The result of this step is 1.9 . Secondly, the Hausdorff metric iterates over the points in set A and computes the distance between each point in A and each point in B. For each iteration, the Hausdorff metric takes the minimum, and at the final step, the Hausdorff takes the maximum score of the minimum distances, as shown in Figure 4c–e. The result of this step is 2.3 . Finally, the Hausdorff metric produces a maximum value of ( 1.9 , 2.3 ) , which is 2.3, so the final result of H a u s d o r f f ( A , B ) = 2.3 .

4.4. Summary

This section presents our proposed solution, which follows up the suspected cases exposed to the infected patient. The solution investigates the trajectories of these suspected cases from two factors: social distance and exposure time. Based on specific values for these factors, the proposed technique identifies if these suspected cases are being infected or not. It starts by scanning the trajectory that belongs to every suspected case. After that, the technique identifies the meeting points between the suspected case and an infected patient. Next, for each meeting point, the technique obtains the distance between the meeting point projected on the suspected case trajectory and infected patient trajectory. If the distance is less than or equal to the identified social distance, the technique continues to cut off sub-trajectories from the suspected case trajectory and infected patient trajectory. These sub-trajectories started from the meeting point time until the exposure period was added.Next, the average distance between created sub-trajectories is computed. If the average distance is less than or equal to the identified social distance, the technique considers this suspected case as infected. Finally, the system generates a list of infected patients and produces it.

5. Experiments

This section evaluates experimentally our proposed solution and reports the results.

5.1. Experimental Setup

5.1.1. Data Set

All experiments conducted in this study utilized the real data set UJIIndoorLoc [37], which describes the indoor movements inside the University of Jaume. This data set represents buildings of the University. Each building contains 4 or more floors, and the total area that the data set covers is around 110 , 000 m 2 . This data set was collected by WLAN fingerprint positioning technologies and was created in 2013, with almost 19,937 total training reference records. The Wi-Fi fingerprint can be captured by wireless access points (WAPS) as well as the corresponding received signal strengths (RSSI). The data set consists of 529 attributes, with 520 of them representing the Wi-Fi fingerprint readings, in addition to the following attributes: (1) Longitude; (2) Latitude; (3) Floor, which describes the altitude inside the building; (4) Building_Id, to identify the building; (5) Space_Id, to identify the space (office, corridor, classroom); (6) Relative position concerning space, which holds two values inside and outside (in front of the door); (7) User_Id, which represents a unique user identifier; (8) Phone_Id, which represents the android device identifier; (9) Timestamp, which represents when the capture is taken.
These parameters (User_Id, Longitude, Latitude) were extracted from the UJIIndoorLoc data set to represent the trace for each person in the building for processing by TraceAll.

5.1.2. Environment Settings

The proposed solution was implemented using Java programming language with JDK version 11. All experiments were executed on a PC with an Intel(R) Core(TM) i7 processor and 16GB RAM and run on Windows 10.

5.2. Performance Metrics

This work selected the memory overhead and CPU processing time as performance metrics to evaluate the robustness and performance of the proposed technique TraceAll. These selected metrics were chosen based on similar techniques that utilize the trajectory on the contact tracing process, and these metrics aim to evaluate the efficiency of the contact tracing query processing [38,39,40]. Indeed, the memory overhead metric here represents the memory resources consumed in order to complete the contact tracing process. On the other hand, the CPU processing time metric here represents the total amount of time for which a central processing unit (CPU) was used for processing the contact tracing query.

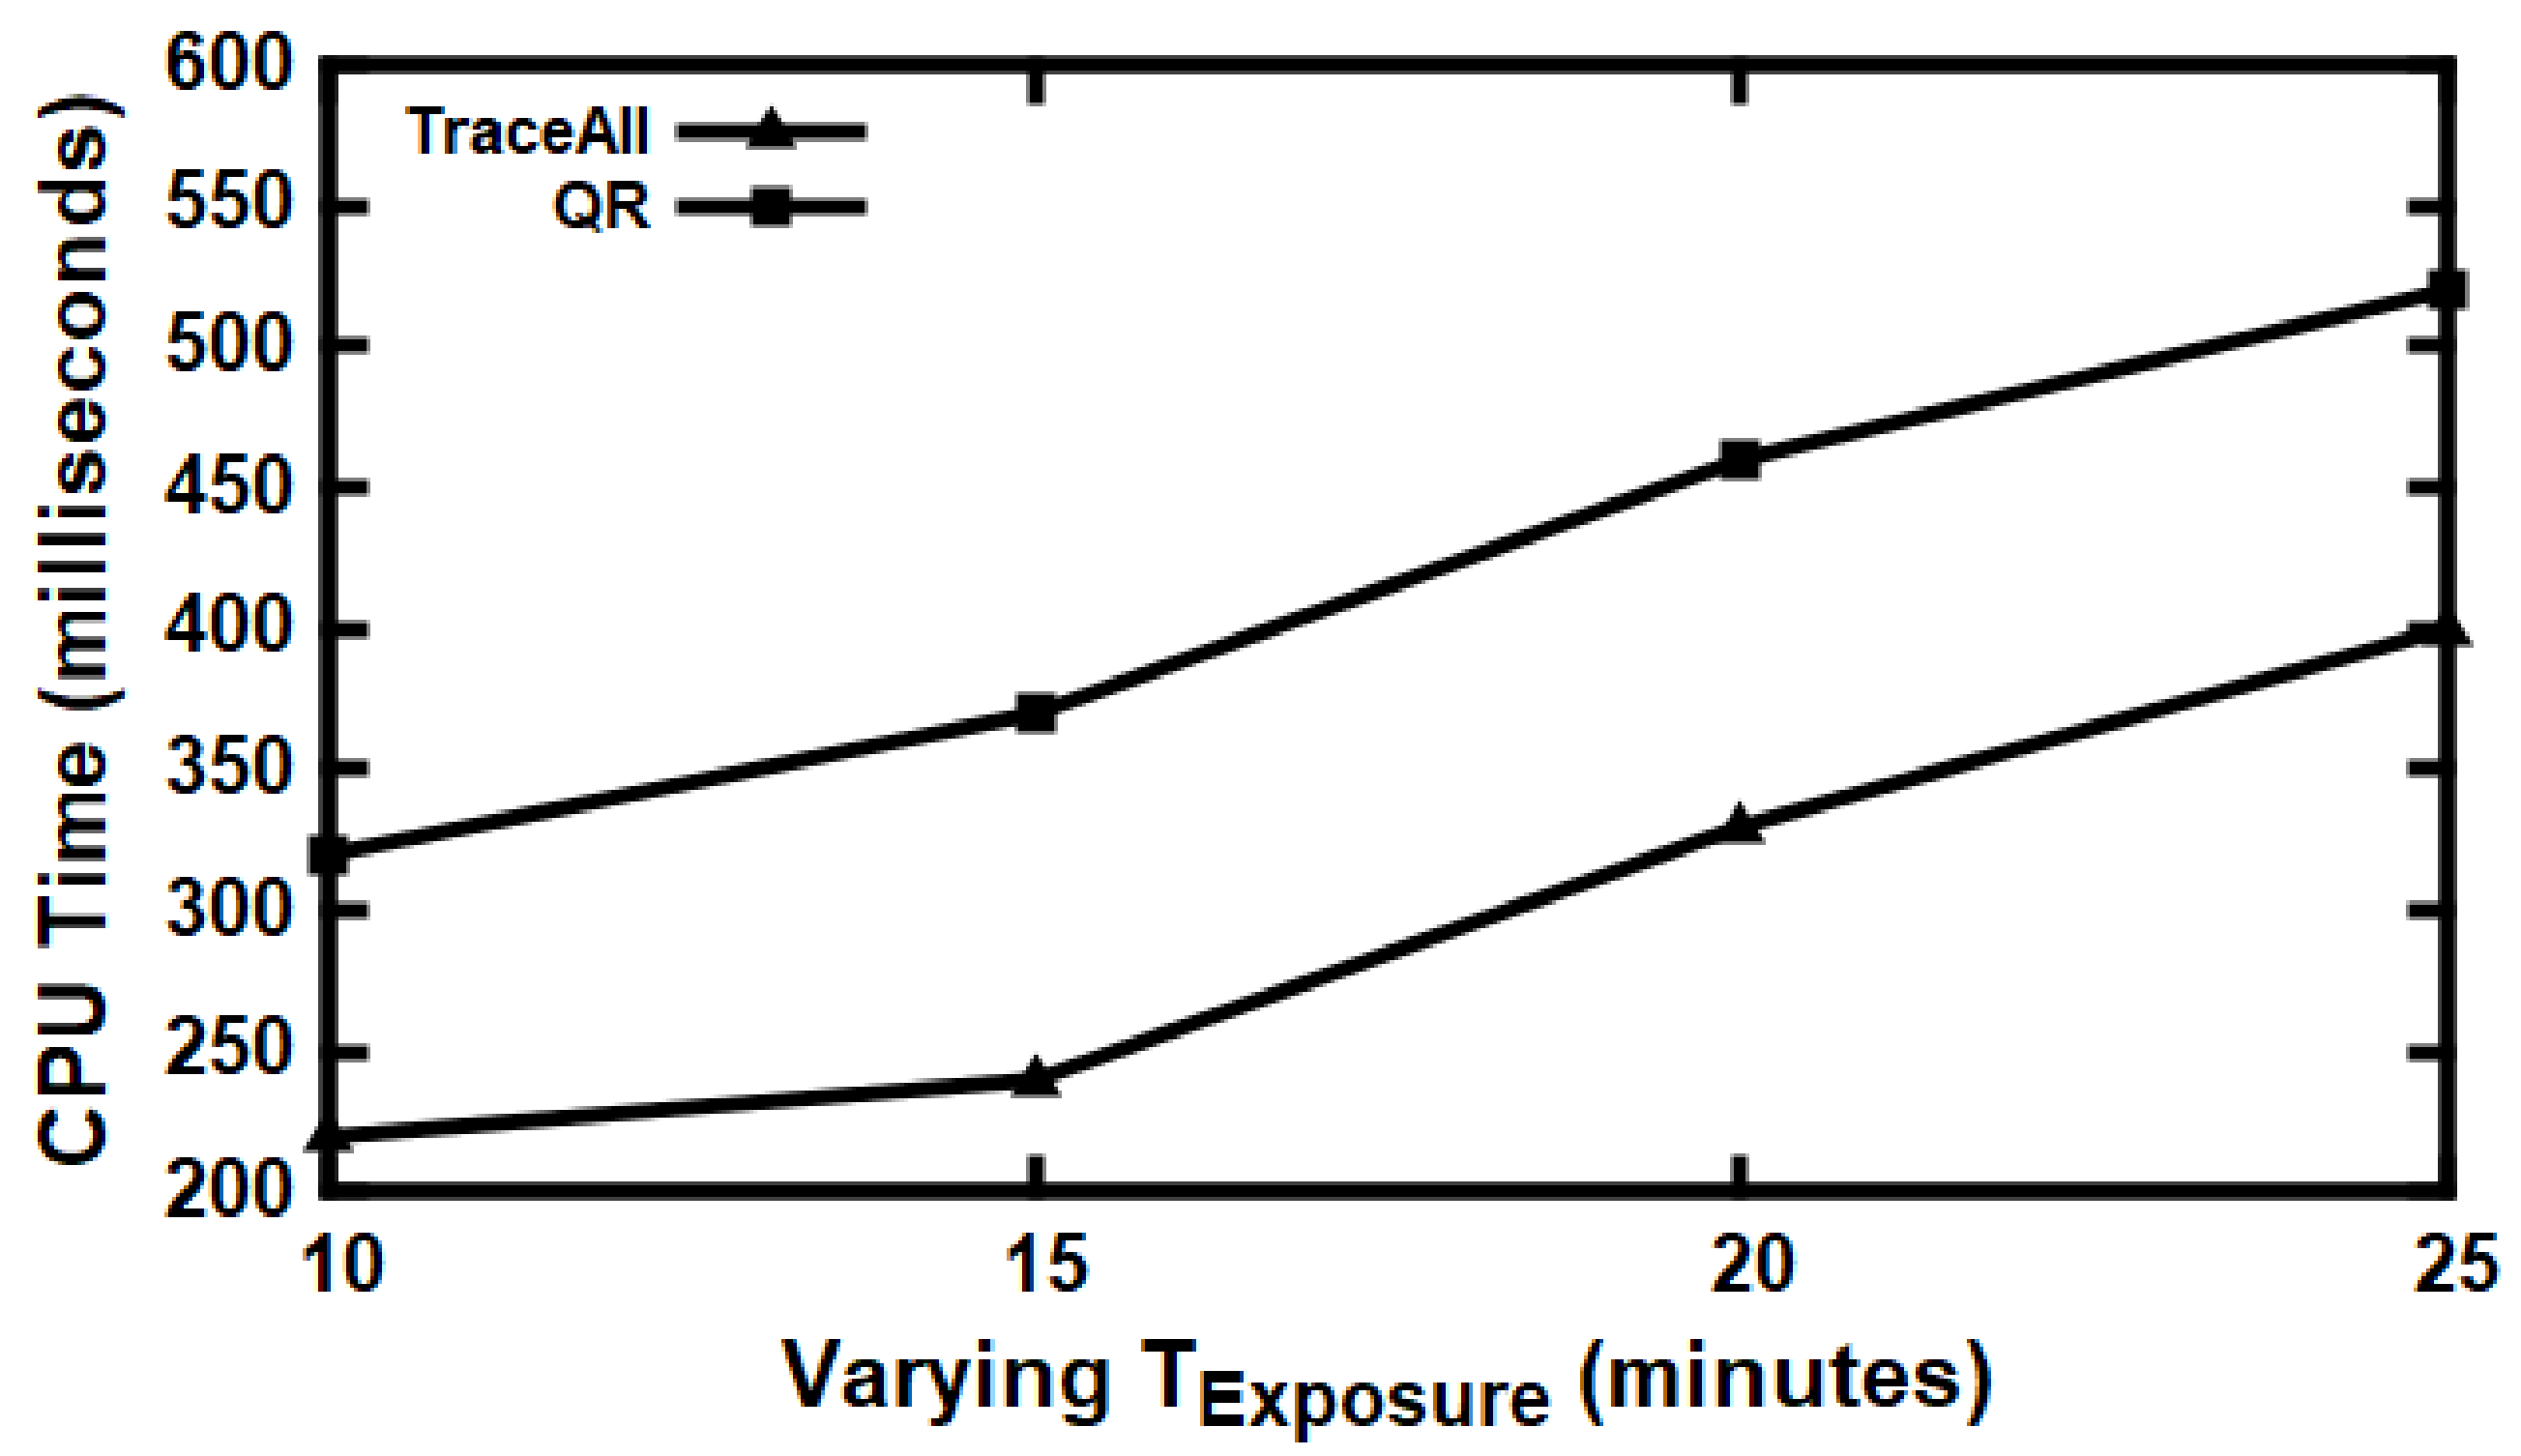
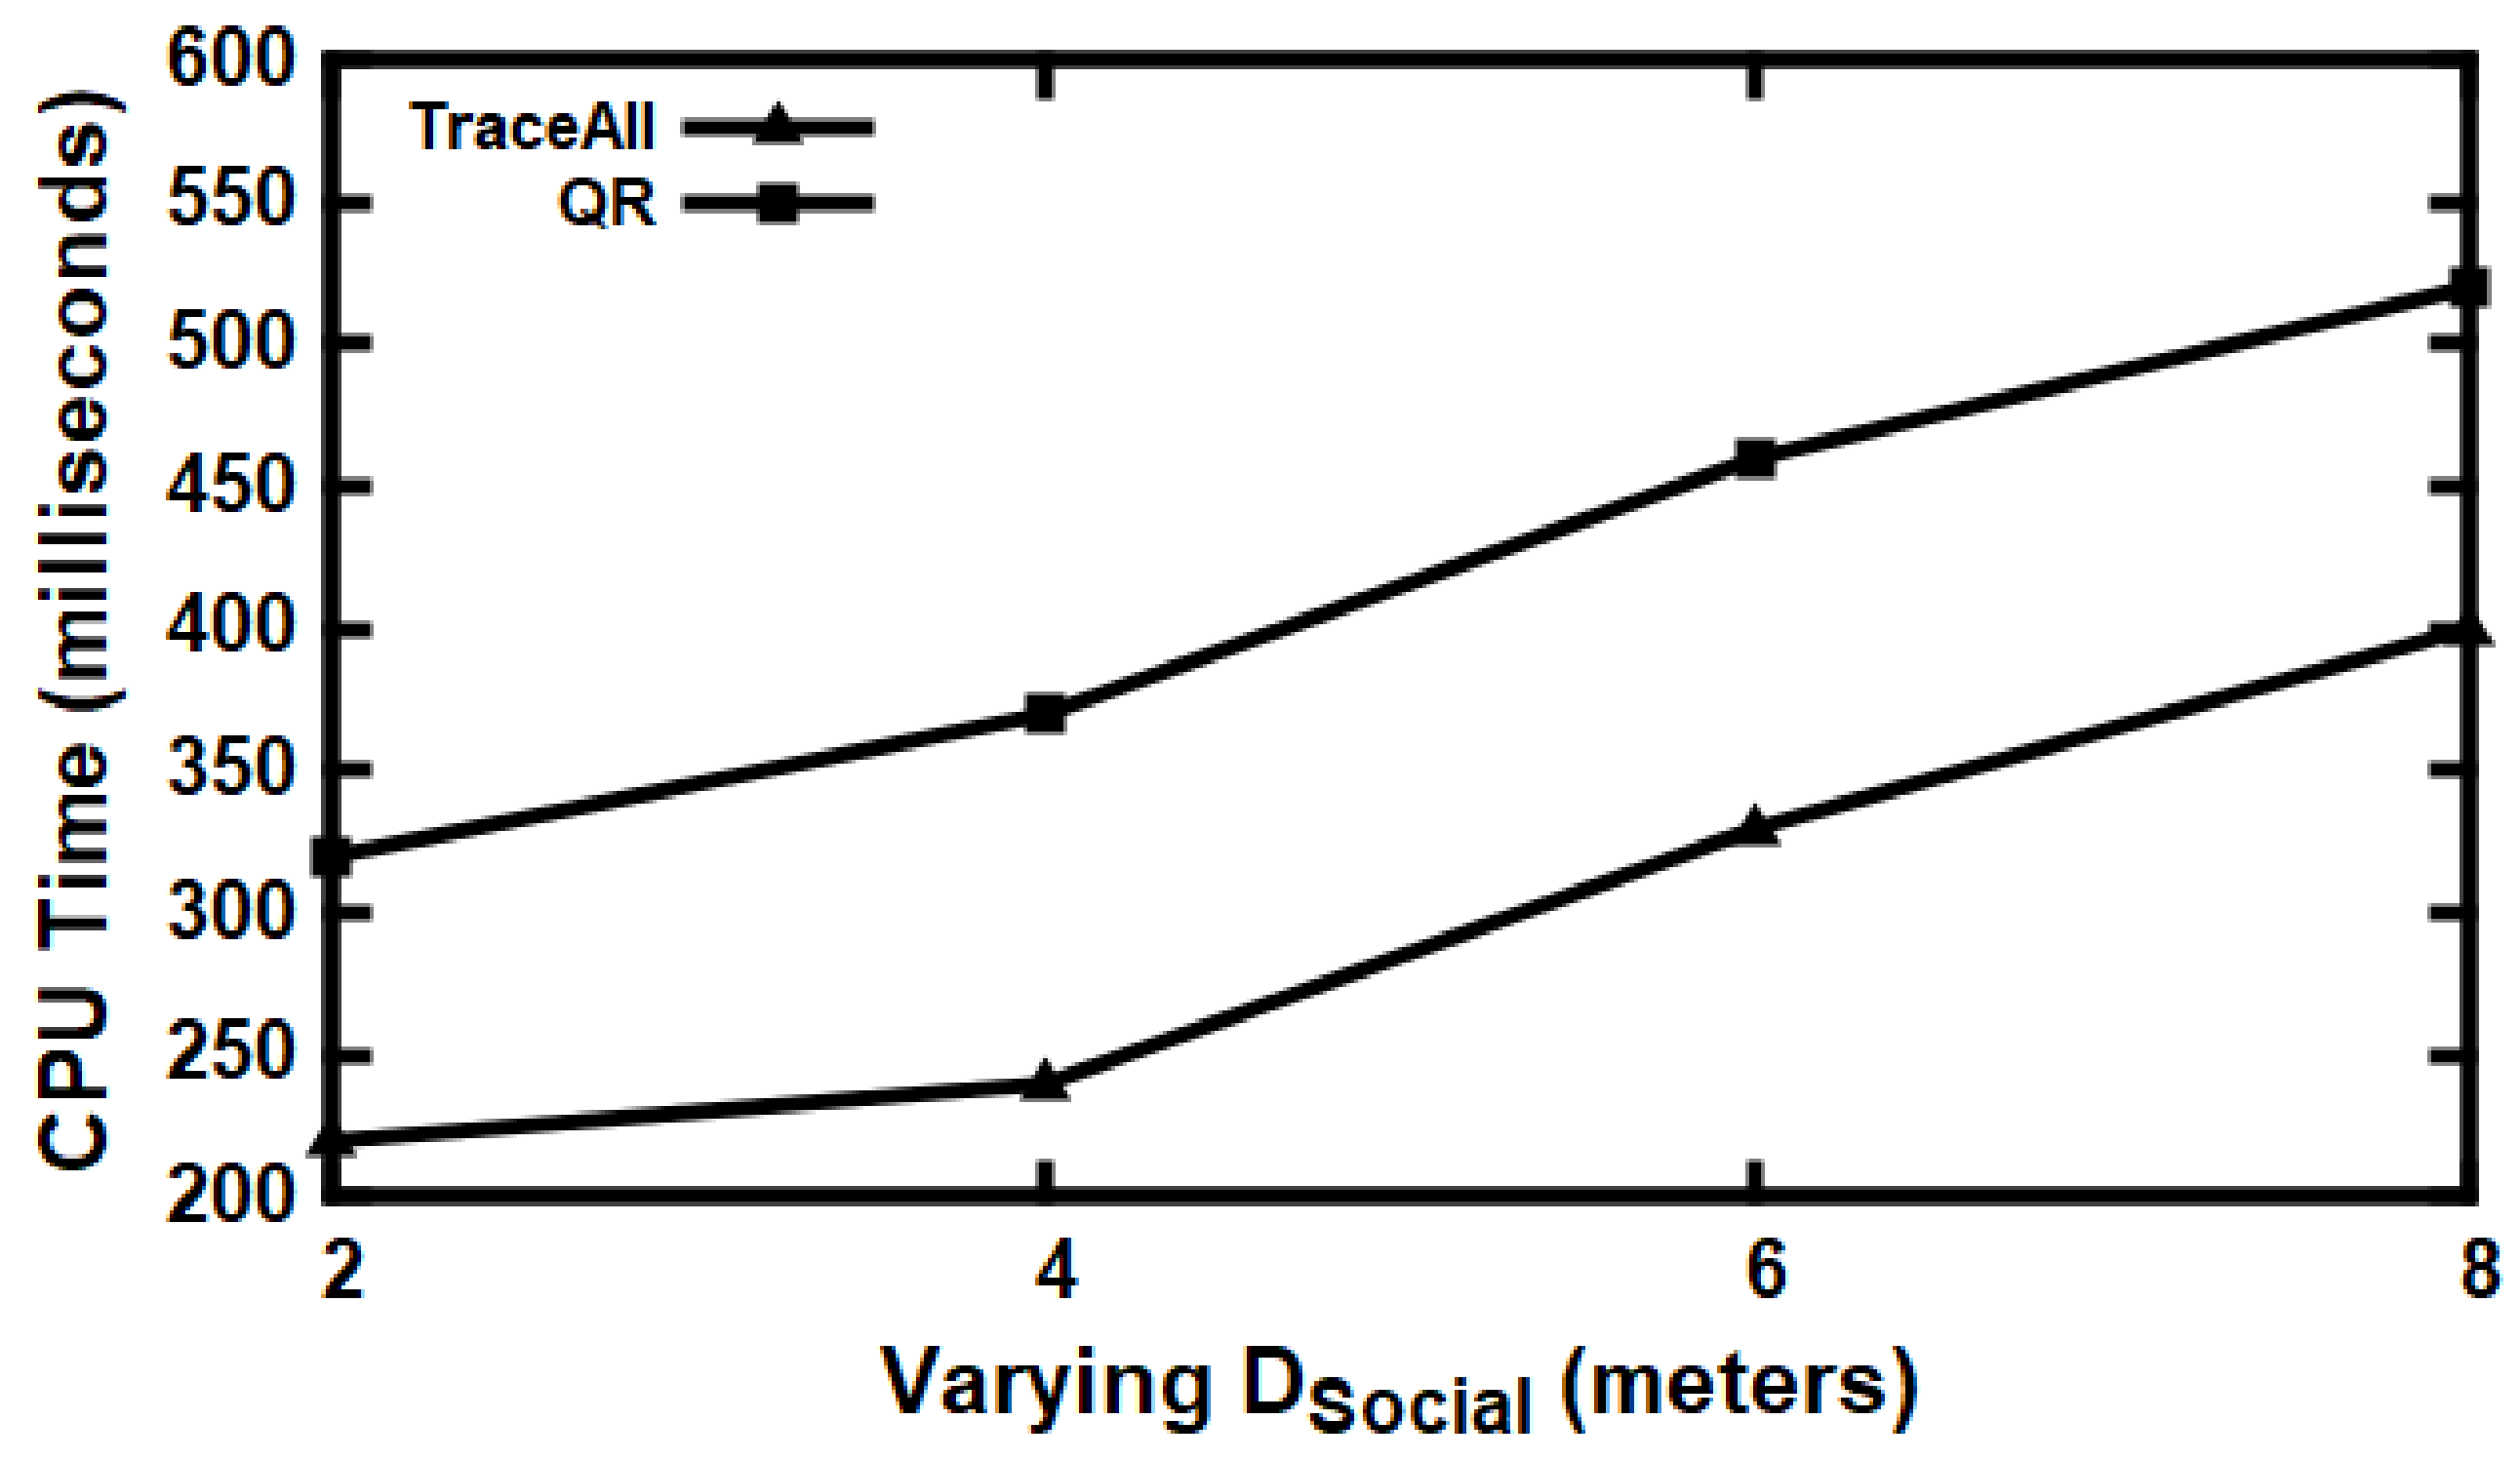
5.3. Experimental Evaluation

Next, we report our findings.
Exp 1: Effect of Choosing Hausdorff. In this experiment, Figure 5 compares the Hausdorff technique against the Frechet technique [41] in measuring the distance used in our proposed solution. The x-axis describes the varying number of points in the query object’s trajectory. The y-axis represents the average CPU time used in milliseconds. The comparison was made against a trajectory with a length of 60 points. The results show that the Hausdorff metric consumed less time than the Frechet technique. Additionally, the Hausdorff metric confirms its sensitivity to the position. In conclusion, the results of the tests proved that the Hausdorff technique is a good choice for comparing distances.
Exp 2: Effect of 3D R-Tree. This experiment inspects the impact on processing time when using the three-dimensional R-Tree for selecting overlapped trajectories (three- dimensional here means space (x,y) and time). This experiment compares the 3D R-Tree against the 2D R-Tree with an added function to retrieve overlapped trajectories that fall in the time range between the start and the end time of the query object’s trajectory. Figure 6 describes this comparison. The x-axis describes the number of overlapped trajectories discovered relative to the total number of caught trajectories, and the y-axis represents the average time consumed in milliseconds. The results present that the 3D R-Tree took less time than running the 2D R-Tree while only including trajectories between the start and end time of the query object’s trajectory. The 3D R-Tree also proves a fast retrieval for the overlapped trajectories.

Baseline Comparisons

This sub-section considers the QR-tree index proposed in [38] as a baseline for comparisons. This index was selected because it is used to answer contact tracing queries with respect to social distance and exposure time factors, which are utilized to confirm the infection transmissions.
Next, we report our findings.
Exp 3: Effect of Exposure Period on Memory. In this experiment, Figure 7 shows the impact of increasing the exposure time of the memory overhead. The x-axis presents the varying of T E x p o s u r e in minutes, while the y-axis presents the memory usage in megabytes. Overall, the graph demonstrates that memory usage rose significantly when T E x p o s u r e increased. This is because when the exposure time increased, more scans were needed while confirming the infection. It is observed that the proposed technique consumed less memory usage than the QR-Tree, and the justification behind this is that when the T E x p o s u r e increased, more points needed to be retrieved from different blocks, linking them to trajectories. Next, a complete scan of trajectories was completed for the entire exposure period to confirm infection, while in the proposed technique, the scan is only done at the meeting points as this saves memory from the overhead of accessing different points and trajectories.
Exp 4: Effect of Exposure Period on CPU Time. In this experiment, Figure 8 compares the proposed technique with the QR-tree when the exposure time increases against CPU processing time. The figure measures the time consumed to answer C T Q in terms of the proposed technique and the QR-tree and highlights the results. The x-axis presents the variation of T E x p o s u r e in minutes, while the y-axis presents the CPU processing time taken in milliseconds. The figure illustrates that the QR-tree took more time to answer C T Q than the proposed technique. The tests were repeated several times to confirm the results. The justification behind this is that the QR-tree must retrieve and check the same time buckets for each point and then group points from both trajectories and compare them until the end of T E x p o s u r e while the proposed approach utilizes the verification of social distance to filter out noisy points and save time.
Exp 5: Effect of Social Distance on Memory. In this experiment, Figure 9 provides information about the impact of increasing social distance on memory usage and overhead. The x-axis presents the variation of D S o c i a l in meters, while the y-axis presents the memory usage in megabytes. Generally, Figure 9 compares the QR-tree against TraceAll when the D E u c l is increasing. It is noted that the QR-tree consumed more memory than TraceAll. This is because, for the QR-tree, when D E u c l increased, a huge amount of inputs and outputs occurred in order to access many blocks containing points belonging to accessed trajectories, while, in the proposed solution, the overlapped trajectories were only retrieved once.
Exp 6: Effect of Social Distance on Processing Time. Figure 10 shows the CPU consumption with respect to the change of D E u c l . The x-axis presents the variation of D E u c l in meters, while the y-axis presents the CPU processing time taken in milliseconds. This figure compares the CPU consumption for TraceAll against the QR-tree index to answer C T Q . The most striking observation to emerge from the comparison was that an increase of D E u c l by 2 m would lead to an approximately twofold increase of CPU time for both the QR-tree and the proposed technique. Additionally, it is observed that the proposed technique consumed less time than the QR-tree. This is because the number of points scanned among two compared trajectories will decrease, while in the QR-tree, when the D E u c l increases, the growth of the number of blocks that need to be accessed will gradually increase.

5.4. Experiments Summary

The issue of infection transmission has received considerable critical attention, so investigating the social distance and exposure time is a continuing concern within the contact tracing process during the infection transmission. In particular, the three-dimensional R-Tree is becoming an instrument in fast retrieval of nearest overlapped trajectories of suspected objects within a specific time range and particular distance. Indeed, the Hausdorff metric proved to be important regarding the distance measurement and sensitivity to locations. Additionally, the adaptation to the Hausdorff technique led to significant performance enhancements. Furthermore, several experiments have been performed against the baseline method to answer contact tracing queries with respect to common parameters used, such as social distance and exposure time. This section introduced four experiments that compared the proposed technique with baseline methods based on performance metrics. Overall, these experiments present the efficiency and quality of the proposed technique against the selected baseline methods. Finally, the results confirm the efficiency of our proposed solution.

6. Conclusions

In this paper, we presented the TraceAll technique to answer contact-tracing queries that help in fighting infectious diseases. The TraceAll technique was designed to fetch all contacts that connect either directly or indirectly to the infected patient. The method considers direct contacts as high-risk individuals and in-direct contacts as low-risk individuals. First, TraceAll extracts the trajectories of the users that moved nearby the infected patient within the determined distance. Then, TraceAll iterates over these trajectories. For each trajectory, TraceAll compares it against the trajectory of the infected patient to identify the meeting points and determine if the two trajectories were exposed to each other for a time and distance that allowed the infection to be transmitted. As a result, if the two trajectories were exposed to each other for the identified time and identified distance, TraceAll considers the object that owns this trajectory as a potentially infected patient that needs to undergo an immediate diagnostic test. Indeed, TraceAll ensures an efficient answering of queries by employing a novel 3D R-Tree index for fast retrieval of the trajectories that satisfy infection transmission conditions. In addition, this is employed to use a tunable parameter to filter out trajectories that are unneeded during the tracing process. Empirical studies proved the scalability, efficiency and accuracy of the proposed solution TraceAll. Finally, TraceAll proves to be efficient in answering contact tracing queries and handling big query throughput.

Author Contributions

Conceptualization, L.A., S.B., M.A., and A.H.; Formal analysis, M.A., L.A.; Funding acquisition, L.A.; Investigation, L.A.; Methodology, M.A. and A.H.; Project administration, A.H. and L.A.; Resources, L.A.; Supervision, L.A. and A.H.; Validation, L.A., S.B. and A.H.; Writing—original draft, M.A.; Writing—review & editing, L.A., S.B. and A.H. All authors have read and agreed to the published version of the manuscript.

Funding

This research was funded by King Abdulaziz City for Science & Technology (KACST) grant number 5-20-01-007-0006.

Institutional Review Board Statement

Not applicable.

Informed Consent Statement

Not applicable.

Acknowledgments

This work was supported by King Abdulaziz City for Science and Technology (KACST), Kingdom of Saudi Arabia, for the COVID-19 Research Grant Program under Grant no. 5-20-01-007-0006.

Conflicts of Interest

The authors declare no conflict of interest.

References

  1. Vazquez-Prokopec, G.M.; Montgomery, B.L.; Horne, P.; Clennon, J.A.; Ritchie, S.A. Combining contact tracing with targeted indoor residual spraying significantly reduces dengue transmission. Sci. Adv. 2017, 3. [Google Scholar] [CrossRef] [Green Version]
  2. Eames, K.T.D. Contact tracing strategies in heterogeneous populations. Epidemiol. Infect. 2007, 135, 443–454. [Google Scholar] [CrossRef]
  3. Armbruster, B.; Brandeau, M.L. Contact tracing to control infectious disease: When enough is enough. Health Care Manag. Sci. 2007, 10, 341–355. [Google Scholar] [CrossRef] [Green Version]
  4. Zhang, Z.T. Optimization of History Tree in 3DR-Tree Index Structure. Appl. Mech. Mater. 2013, 347–350, 2521–2523. [Google Scholar] [CrossRef] [Green Version]
  5. Guttman, A. R-Trees: A Dynamic Index Structure for Spatial Searching. In Proceedings of the 1984 ACM SIGMOD International Conference on Management of Data, Boston, MA, USA, 18–21 June 1984. [Google Scholar]
  6. Shi, Y.; Hendawi, A.M.; Fattah, H.; Ali, M. RxSpatial: Reactive Spatial Library for Real-Time Location Tracking and Processing. In Proceedings of the International Conference on Management of Data, San Francisco, CA, USA, 26 June–1 July 2016; pp. 2165–2168. [Google Scholar]
  7. Shahtori, N.M.; Ferdousi, T.; Scoglio, C.; Sahneh, F.D. Quantifying the impact of early-stage contact tracing on controlling ebola diffusion. Math. Biosci. Eng 2018, 15, 1165–1180. [Google Scholar] [CrossRef] [PubMed] [Green Version]
  8. Dixon, M.G.; Schafer, I.J. Ebola Viral Disease OutbreakWest Africa, 2014. Ann. Emerg. Med. 2015, 65, 114–115. [Google Scholar]
  9. Eames, K.T.D.; Keeling, M.J. Contact tracing and disease control. Proc. R. Soc. Lond. B Biol. Sci. 2003, 270, 2565–2571. [Google Scholar] [CrossRef] [PubMed] [Green Version]
  10. Fraser, D.K.C.; Heesterbeek, H. The effectiveness of contact tracing in emerging epidemics. PLoS ONE 2006, 1, 1–7. [Google Scholar]
  11. Anglemyer, A.; Moore, T.H.M.; Parker, L.; Chambers, T.; Grady, A.; Chiu, K.; Parry, M.; Wilczynska, M.; Flemyng, E.; Bero, L. Digital contact tracing technologies in EPIDEMICS: A rapid review. Cochrane Database Syst. Rev. 2020, 8. [Google Scholar] [CrossRef]
  12. Braithwaite, I.; Callender, T.; Bullock, M.; Aldridge, R.W. Automated and Partially-automated Contact TRACING: A rapid systematic review to inform the control of covid-19. Lancet Digit. Health 2020, 2, e607–e621. [Google Scholar] [CrossRef]
  13. Juneau, C.E.; Briand, A.S.; Pueyo, T.; Collazzo, P.; Potvin, L. Effective Contact Tracing for Covid-19: A Systematic Review. Available online: https://www.medrxiv.org/content/10.1101/2020.07.23.20160234v2 (accessed on 20 September 2020).
  14. Garg, L.; Chukwu, E.; Nasser, N.; Chakraborty, C.; Garg, G. Anonymity Preserving IoT-Based COVID-19 and Other Infectious Disease Contact Tracing Model. IEEE Access 2020, 8, 59402–159414. [Google Scholar] [CrossRef]
  15. Hu, P. IoT-based Contact Tracing Systems for Infectious Diseases: Architecture and Analysis. Available online: https://arxiv.org/pdf/2009.01902.pdf (accessed on 20 September 2020).
  16. Lombardi, M.; Pascale, F.; Santaniello, D. Internet of Things: A General Overview between Architectures, Protocols and Applications. Information 2021, 12, 87. [Google Scholar] [CrossRef]
  17. Amato, F.; Moscato, F.; Moscato, V.; Pascale, F.; Picariello, A. An agent-based approach for recommending cultural tours. Pattern Recognit. Lett. 2020, 131, 341–347. [Google Scholar] [CrossRef]
  18. Zheng, Q.; Yang, M.; Yang, J.; Zhang, Q.; Zhang, X. Improvement of Generalization Ability of Deep CNN via Implicit Regularization in Two-Stage Training Process. IEEE Access 2018, 6, 15844–15869. [Google Scholar] [CrossRef]
  19. Hamida, A.B.; Benoit, A.; Lambert, P.; Amar, C.B. 3-D Deep Learning Approach for Remote Sensing Image Classification. IEEE Trans. Geosci. Remote Sens. 2018, 56, 4420–4434. [Google Scholar] [CrossRef] [Green Version]
  20. Zheng, Q.; Yang, M.; Tian, X.; Jiang, N.; Wang, D. A full stage data augmentation method in deep convolutional neural network for natural image classification. Discrete Dyn. Nat. Soc. 2020. [Google Scholar] [CrossRef]
  21. Woodley, M. RACGP Releases COVIDSafe Factsheet. Royal Australian College of General Practitioners. Available online: https://www1.racgp.org.au/newsgp/professional/racgp-releasescovidsafe-fact-sheet (accessed on 20 September 2020).
  22. Australian Government Department of Health: COVIDSafe App. Available online: https://www.health.gov.au/resources/apps-and-tools/covidsafe-app (accessed on 20 September 2020).
  23. Maddocks. The COVIDSafe Application Privacy Impact Assessment. 2020. Available online: https://www.health.gov.au/sites/default/files/documents/2020/04/covidsafe-application-privacy-impact-assessment-covidsafe-application-privacy-impactassessment.pdf (accessed on 20 September 2020).
  24. Help Speed up Contact Tracing with Tracetogether. Available online: https://www:gov:sg/article/help-speed-upcontact-tracing-with-tracetogether (accessed on 20 September 2020).
  25. Berke, A.; Bakker, M.; Vepakomma, P.; Larson, K.; Pentland, A.S. Assessing disease exposure risk with location histories and protecting privacy: A cryptographic approach in response to a global pandemic. arXiv 2020, arXiv:2003.14412. [Google Scholar]
  26. Reichert, S.B.L.; Scheuermann, B. Decentralized Contact Tracing Using a DHT and Blind Signatures. Available online: https://eprint.iacr.org/2020/398.pdf (accessed on 20 September 2020).
  27. Lee, Y. Taiwan’s Carrot-and-Stick Approach to Virus Fight Wins Praise, but Strains Showing. Available online: https://www.reuters.com/article/us-health-coronavirus-taiwan-quarantine-idUSKBN21E0EE (accessed on 20 September 2020).
  28. Yasaka, T.M.; Lehrich, B.M.; Sahyouni, R. Peer-to-Peer Contact Tracing: Development of a Privacy-Preserving Smartphone App. App. JMIR Mhealth Uhealth 2020, 8, e18936. [Google Scholar] [CrossRef] [Green Version]
  29. World Health Organization. Contact Tracing during an Outbreak of Ebola Virus Disease. 2014. Available online: https://apps.who.int/iris/bitstream/handle/10665/159040/9789290232575.pdf (accessed on 20 September 2020).
  30. World Health Organization. Surveillance Strategy during Phase 3 of the Ebola Response. 2015. Available online: https://reliefweb.int/sites/reliefweb.int/files/resources/WHO_EVD_Guidance_Sur_15.1_eng.pdf (accessed on 20 September 2020).
  31. Danquah, L.O.; Hasham, N.; MacFarlane, M.; Conteh, F.E.; Momoh, F.; Tedesco, A.A.; Jambai, A.; Ross, D.A.; Weiss, H.A. Use of a mobile application for Ebola contact tracing and monitoring in northern Sierra Leone: A proof-of-concept study. BMC Infect. Dis. 2019, 19, 1–12. [Google Scholar] [CrossRef] [PubMed]
  32. Stein, M.L.; Rump, B.O.; Kretzschmar, M.E.E.; Steenbergen, J.E.V. Social Networking Sites as a Tool for Contact Tracing: Urge for Ethical Framework for Normative Guidance. Public Health Ethics 2014, 7, 57–60. [Google Scholar] [CrossRef]
  33. Mandeville, K.L.; Harris, M.; Thomas, H.L.; Chow, Y.; Seng, C. Using social networking sites for communicable disease control: Innovative contact tracing or breach of confidentiality? Public Health Ethics 2014, 7, 47–50. [Google Scholar] [CrossRef]
  34. Mcmullen, P. The Hausdorff distance between compact convex sets. Mathematika 1984, 31, 76–82. [Google Scholar] [CrossRef]
  35. Atallah, M.J. A linear time algorithm for the Hausdorff distance between convex polygons. Inform. Process. 1983, 17, 207–209. [Google Scholar] [CrossRef] [Green Version]
  36. Kim, I.S.; Mclean, W. Computing The Hausdorff Distance Between Two Sets Of Parametric Curves. Available online: http://koreascience.or.kr/article/JAKO201334064306689.pdf (accessed on 20 September 2020).
  37. Torres-Sospedra, J.; Montoliu, R.; Martínez-Usó, A.; Avariento, J.P.; Arnau, T.J.; Benedito-Bordonau, M.; Huerta, J. UJIIndoorLoc: A New Multi-building and Multi-floor Database for WLAN Fingerprint-based Indoor Localization Problems. In Proceedings of the 2014 International Conference on Indoor Positioning and Indoor Navigation (IPIN), Busan, South Korea, 27–30 October 2014. [Google Scholar]
  38. Ali, M.E.; Eusuf, S.S.; Islam, K.A. An Efficient Index for Contact Tracing Query in a Large Spatio-Temporal Database. arXiv 2020, arXiv:2006.12812. [Google Scholar]
  39. Lee, W.K.H.; Chung, Y.D. Safe contact tracing for COVID-19: A method without privacy breach using functional encryption techniques based-on spatio-temporal trajectory data. PLoS ONE 2020, 15, e0242758. [Google Scholar]
  40. Cao, F.K.Y.; Masatoshi, Y. PCT-TEE: Trajectory-based Private Contact Tracing System with Trusted Execution Environment. Available online: https://arxiv.org/pdf/2012.03782.pdf (accessed on 20 September 2020).
  41. Alt, H.; Godau, M. Computing The Frechet Distance Between Two Polygonal Curves. Int. J. Comput. Geom. Appl. 1995, 5, 75–91. [Google Scholar] [CrossRef]
Figure 1. Overlapped region.
Information 12 00202 g001
Figure 2. Overlapped trajectories.
Information 12 00202 g002
Figure 3. Computing exposure.
Information 12 00202 g003
Figure 4. Hausdorff example.
Information 12 00202 g004
Figure 5. Comparison of results using Hausdorff vs. Frechet.
Information 12 00202 g005
Figure 6. Effect of 3D R-Tree.
Information 12 00202 g006
Figure 7. Effect of exposure period on memory.
Information 12 00202 g007
Figure 8. Effect of exposure period on CPU time.
Information 12 00202 g008
Figure 9. Effect of social distance on memory.
Information 12 00202 g009
Figure 10. Effect of social distance on CPU time.
Information 12 00202 g010
Table 1. CTQ input parameters example.
Parameter NameValue
T r a c i n g p e r i o d 14 days
T E x p o s u r e 10 min
D E u c l 2 m
T r a c i n g M o d e Direct
Publisher’s Note: MDPI stays neutral with regard to jurisdictional claims in published maps and institutional affiliations.

