Article

Bridging Ride and Play Comfort

by
Zeliang Zhang
1,*,†,‡,
Kang Xiaohan
1,†,‡,
Mohd Nor Akmal Khalid
1,2,‡ and
Hiroyuki Iida
1,2,‡
1
School of Information Science, Japan Advanced Institute of Science and Technology, Nomi 923-1292, Ishikawa, Japan
2
Research Center for Entertainment Science, Japan Advanced Institute of Science and Technology, Nomi 923-1292, Ishikawa, Japan
*
Author to whom correspondence should be addressed.
Current address: School of Information Science, Japan Advanced Institute of Science and Technology, 1-1 Asahidai, Nomi 923-1211, Ishikawa, Japan.
These authors contributed equally to this work.
Information 2021, 12(3), 119; https://doi.org/10.3390/info12030119
Submission received: 16 February 2021 / Revised: 2 March 2021 / Accepted: 4 March 2021 / Published: 10 March 2021
(This article belongs to the Section Information Theory and Methodology)

Abstract

:
The notion of comfort with respect to rides, such as roller coasters, is typically addressed from the perspective of a physical ride, where the convenience of transportation is redefined to minimize risk and maximize thrill. As a popular form of entertainment, roller coasters sit at the nexus of rides and games, providing a suitable environment to measure both mental and physical experiences of rider comfort. In this paper, the way risk and comfort affect such experiences is investigated, and the connection between play comfort and ride comfort is explored. A roller coaster ride simulation is adopted as the target environment for this research, which combines the feeling of being thrill and comfort simultaneously. At the same time, this paper also expands research on roller coaster rides while bridging the rides and games via the analogy of the law of physics, a concept currently known as motion in mind. This study’s contribution involves a roller coaster ride model, which provides an extended understanding of the relationship between physical performance and the mental experience relative to the concept of motion in mind while establishing critical criteria for a comfortable experience of both the ride and play.

1. Introduction

A roller coaster is a type of amusement ride that employs elevated tracks designed with steep slopes, tight turns and sometimes inversions. The first known roller coaster was designed in 1884. As a popular form of entertainment, roller coasters are deeply loved and enjoyed by many people. Being a combination of games and rides, roller coasters provide a sense of entertainment (mentally) and a riding experience (physically).
In a game-playing context, people feel and ascertain something based on the brain’s signals [1,2]. Therefore, emphasis is placed on the correlation between the physical laws of nature and the cerebral sensation and performance. Through the association of play experience with natural physics, a working model can be simulated where data can be collected to determine a mental model’s relationship with the real-world experiences. This research explores such a relationship by comparing the comfort experienced in play and the ride.
General information on and regulations of roller coasters were utilized to model and emulate the actual behaviors of the roller coaster ride. Tracing the relevant changes of such a roller coaster model was analyzed in the context of both natural physics and game refinement (GR) theory [3]. GR theory regards perfecting the game-playing experience [4,5] and finding ideal game settings [6,7], serving as the foundation that bridges natural physics and physics in mind (called motion in mind [8]). As such, a better understanding of the underlying mechanisms and regulations of human life can be established; moreover, new applications of GR theory present themselves.
This study’s primary goal is to expand the horizon of riding comfort by bridging play comfort to physical performance and mental experience via roller coasters. The motivation to consider a roller coaster as the target for this research is that it provides the necessary facility to achieve such a purpose, adopting the motion in mind concept proposed by Iida and Khalid [8]. The contribution of this study is twofold. First, the roller coaster ride model provides an extended understanding of mental comforts via the concept of motion in mind from a game-playing perspective. This situation involves measuring the rate of information change throughout a simulated roller coaster ride. Secondly, the concept of motion in mind also provides preliminary insights into the physical performance associated with the ride comfort. This condition is achieved by bridging motion in mind to motion in physics.

2. Literature Review

2.1. Ride Comfort

The issue of vehicle ride comfort is not only related to individual satisfaction with the driving experience, but also to the driver’s safety and long-term health due to the deterioration of driving environments and performance [9]. However, in recent years, with the rapid development of intelligent consumer technology, there have been increased demand for intelligent and networked vehicles, where the vehicles’ new function becomes a necessary attribute to enforce safety. As such, more attention has been given to passenger comfort.
A standard car is concerned with improving the vehicle structure and its power train parameters for a comfortable driving experience. In contrast, smart cars are integrated with perception algorithms, decision planning, vehicle control, and other aspects to improve every passengers’ riding experience [10]. The driving comfort of intelligent vehicles can be divided into two levels: driving performance and riding performance.
Driving performance refers to the intelligent response of the vehicle to the driver’s input, such as steering and braking, acceleration and the control of the vehicle movement state [11]. Such a study was conducted by Lv et al. [12], where a co-design optimization approach was proposed using an unsupervised learning algorithm to automatically adapt autonomous vehicles’ driving style via a cyber-physical system framework. The study showed that an optimized plant and controller provide optimal performance under aggressive, moderate and conservative driving styles.
Riding performance refers to the vibration response of intelligent vehicles caused by partial input, such as road irregularity vehicle vibration and vehicle pitch caused by acceleration and deceleration [13]. Such a study was done by Zhou and Chen [9], where complex interactions among a long-span bridge, all vehicles in the traffic flow and wind excitations were modeled, including the whole-body vibration response, which was applied to a prototype long-span cable-stayed bridge and traffic system. The influences of dynamic interactions, the presence of other vehicles, and wind excitation on rider comfort were also numerically evaluated.
In traditional autonomous driving, environment sensing and system monitoring are highly required. Vehicle dynamics model with tandem suspension had previously been modeled and simulated via non-linear characteristic components and various road excitation inputs, where annoyance rate was presented as a quantitative correlation between objective and subjective indications of ride comfort [14]. Some recent studies on autonomous driving involve passenger-aware path planning where deployment should encompass not only computational and sensory aspects of a ride but also the passenger state (i.e., stress, urgency, etc.) in its decision-making and planning procedures [10]. A study by Powell and Palacín [15] found that passenger tolerance and comfort vary between different physiology and psychology where the acceptability level depends strongly on the rate of change of the acceleration (jerk).
In another research vein, a vehicle’s jerkiness provides useful information to identify aggressive drivers [16]. Two jerk-based metrics (positive and negative jerk) were used to account according to the frequency of use of the gas and brake pedals, in which the study found that sizeable negative jerk was more identifiable with aggressive driving behaviors. Although research on ride comfort mainly focuses on making a rider comfortable or optimizing for a comfortable ride experience, the rider’s entertainment experience is rarely emphasized. Moreover, while ensuring safety, the roller coaster ride is an extreme example of ride entertainment, which is the selling point that bridges both rides and games.

2.2. Roller Coaster

Roller coasters have been a terrifying and exhilarating ride for thrill-seekers for centuries. A roller coaster is a large motorized recreational facility sought after by people in amusement parks and theme parks [17]. The earliest incarnation was an ice slide in St. Petersburg, Russia, in 1750 [18]. Fifty years later, a Frenchman brought the idea to Paris by building a more permanent structure out of rails and wheels. Most roller coaster rides begin with a lift hill, where a chain connects with the train and carries the riders to the first and tallest incline. As the train reaches the crest of the hill, the chain pushes the train over the hill. Then, gravity takes over and pulls the train down the hill into a controlled free fall.
The maximum speed of the existing roller coaster can reach 206 km/h [19]. The key to the roller coaster’s design and manufacture is to ensure the highest safety under high speed and high stimulation. This condition requires that the roller coaster’s speed and acceleration must be within the range that the riders can withstand, and the static and dynamic loads on each component must be within its strength range. Research showed that the average person could bear the acceleration of up to 6G in a short time [19,20]. If the acceleration exceeds 8G, the physiological function or internal organ will likely be damaged. The riding experience can be improved through reasonable control of speed and other physical quantities while minimizing its riders’ biomechanical effects.

2.3. Motions in Mind

Analogical links between motions in physics and motions in mind had been previously established based on the notions of winning rate (or velocity) v and winning hardness m [8]. The correspondence between the physics model and the game progress models is established as in Table 1. Such correspondence enables physics in mind in various games, specifically on three quantities: potential energy, momentum and force.
The momentum ( p ) in the game refers to the competitive balance of a game, which involves the degree of challenge needed (m) and effort given (v) to drive the game progression [8], given by (1). Meanwhile, the potential energy ( E p ) in the game is defined as the game playing potential or the expected game information required to finish a game [8]. It was derived from the analogy of gravitational potential energy given by (3), where the analogical link was adopted by linking kinematics formula of displacement h = y = 1 2 a t 2 and g = a , resulting into (3). The third derivative of the game progress model described by Iida and Khalid [8] indicates the change of accelerated velocity (or jerk [20]) of the solved uncertainty [4], where the motion with a constant jerk (j) is approximate in the domain of board games as (4).
p = m v
U = m g h
E p = m a ( 1 2 a t 2 ) = 1 2 m a 2 t 2 = 2 m v 2
j = n ( n 1 ) ( n 2 ) T 3 3 B D 3 .

2.4. Thrill Feeling

Under the premise of ensuring safety, improving rider engagement is an estimable topic in recent years. Riders were unable to sense or feel the speed of the ride intuitively. For example, when riding a train or bus, the general perception is the process of uniform decelerating (slowing down) at a certain speed when arriving. Such an experience is bland and, most likely, not fun at all. However, the experience of acceleration and its changes (say jerk) can be felt. In the physical world, passengers feel the acceleration via force, while the jerk is felt through both positive and negative forces (inertia). When the subway starts and stops, it is often accompanied by much jerkiness [15]. If a passenger accidentally falls in a train ride, the acceleration after starting is much larger than when it is just started, but it is more “soft” and less likely to cause injury. Therefore, when designing the elevator’s power system, the elevator should be slowly accelerated, and when the train track turns, the straight rail cannot be directly connected to the large angle curved rail.
Such velocity changes (acceleration) have been considered concerning the feeling of thrills [8], which is typically observed in sophisticated games. However, it is unclear whether such a phenomenon can also be kept in a real-world situation, especially in the context of ride comfort. The extend of the accelerated changes (jerk) was also previously explored, which relates to motivation retention [4]. Thus, the thrilling experience is regarded as the bridge between motion in the real world and motion in mind.

3. Methodology

3.1. Ride Comfort in Physics

Motion control applications include passenger elevators and machining tools. Limiting vertical jerk is considered essential for elevator riding convenience. ISO 18738 specifies measurement methods for elevator ride quality and rules that specify acceptable or unacceptable ride quality levels. It is reported that most passengers rate a vertical jerk of 2.0 m/s 3 as acceptable and 6.0 m/s 3 as intolerable. As for human body capacity, 0.7 m/s 3 is the recommended limit [21].
In motion control, the design focus is on straight, linear motion, with the need to move a system from one steady position to another (point-to-point motion). Meanwhile, the design concern from a jerk perspective is the vertical jerk, where the jerk from tangential acceleration is virtually zero since linear motion is non-rotational. The primary design goal for motion control is to minimize the transition time without exceeding speed, acceleration, or jerk limits, and the third-order motion-control profile with quadratic ramping and de-ramping phases in velocity.
Because the human body feels acceleration, when a coaster car is speeding up, the actual force acting on the body is the seat pushing the body forward. However, the force is felt in front of the body because of the body’s inertia, pushing into the seat. The force of accelerated push was always felt coming from the opposite direction of the actual force accelerating the body. This force (for simplicity’s sake, called the acceleration force) feels the same as the force of gravity that pulls you toward Earth.
The main principle of a roller coaster ride is that it can reach the highest height through the conveying machinery, but when the highest point is reached, there is no power output, and the roller coaster entirely relies on the potential energy of gravity to move. Such an acceleration force is measured in G-force, where 1G is equal to the acceleration force due to gravity of the Earth’s surface (9.8 m/s 2 , or 32 ft/s 2 ).

3.2. Data Collection

3.2.1. Physics in Roller Coaster Data Collection

The acceptable limit of force applied to the human body is typically up to about 6G, based on the top 11th high G-force roller coaster in the world (Table 2). For this study, the data from the top 11th high G-force roller coaster are adopted, which are also categorized as the top 50 most popular roller coasters for 2020 (Table A1) voted by Theme Park insider [22].

3.2.2. Excitement in Roller Coaster Data Collection

Data collected from the real-world roller coaster have included some physics indexes. However, some of the roller coasters are very old, and it is challenging to compare the player’s excitement level solely based on such data. As such, it is necessary to simulate how the physics settings reflect the excitement. Hence, the RollerCoaster Tycoon game was adopted to deal with this situation.
RollerCoaster Tycoon Classic is a construction and management simulation video game developed by Origin8 Technologies and published by Atari. The game combines features that were first seen in RollerCoaster Tycoon and RollerCoaster Tycoon 2, both amusement park management simulators created by Chris Sawyer for the PC [23]. The game was released worldwide for iOS and Android in December 2016 [24], while a version for Microsoft Windows and macOS was released in September 2017 [25].
Among the many game’s goals (i.e., improving the park, managing guests, and others), the goal that prominently aligned with this study is the ride’s data metric that maximizes excitement without making the ride too intense or nauseating. Furthermore, the data set includes both the player excitement and physics data [26]. In this study, the game was adopted to redesign the real-world roller coaster where the result concluded from the ride statistics, such as excitement rating and other physics indexes (velocity, maximum G-force, minimum G-force), were collected for further analysis. This condition assumes that the number of riders of the roller coaster rides is always high (best-case scenario).

3.3. Experimental Setups

The experiment was designed in two stages. Firstly, the data of the roller coaster rides collected from all around the world were analyzed from the perspective of real-world physics, where the potential energy (denoted as E q ), momentum (denoted as p ), and force (denoted as F) were computed by Equations (5)–(7), respectively. Secondly, three-dimensional roller coaster simulation data were collected via the statistical data obtained from the RollerCoaster Tycoon game through the recreation of the real-world roller coaster rides by approximating the data available from Table 2.
E q = m g h
p = m v
F = m a .
These two experiments aimed to establish the relationships between potential energy, momentum, and force of real-world physics and the simulated one. Furthermore, those relationships are then analyzed further based on the concept of motion in mind to extend the understanding of physical and mental comforts in ride using roller coaster (both real and simulated) as the bridge for excitement and thrills experience, from the perspective of information sciences. It is important to note that real-world roller coaster data is adopted into the RollerCoaster Tycoon game as the simulation environment for further analysis.

4. Experimental Results and Discussion

4.1. Evolution of Roller Coaster and Physics Motion

People deeply love roller coasters as a popular entertainment facility since 1885. The roller coaster development had changed between 1976 to 2016, in which the results have been shown based on the top 11th high G-force roller coaster, and their respective physic measures were computed and given in Table 3 and illustrated as in Figure 1. It can be observed that energies in this period are linearly rising, which shows that the ride experience requires tremendous energy as the year progresses. Also, roller coaster development paid much attention to providing users with an immersive experience based on the momentum that does not change and stabilizes around 150 kg/m/s, which was found to be the momentum that was the greatest since more users possess the ability to enjoy such a roller coaster ride. Overall, the roller coaster design has not changed too much from 1976 to 2016.
From the force perspective, it can be found that the force is decreasing as the year progresses. It was observed that the latest roller coaster rides pursue the sense of thrill from the ride and pursue enrichment of the play experience. Observing the G-force changes throughout the years, it was found that G-force tends to decrease. At the early time of building the roller coaster, the only thing designers focused on is the thrilling feeling.
However, after the year 2010, more aspects of the ride have been paid attention to, in which the G-force increases and leaves space for entertainment design, such as theme design, role-playing, and immersive plot as part of the riding experience. In contrast to such a condition, some roller coaster rides also have longer length and duration (length ≥ 1000 m and duration ≥ 3:00 min). This situation demonstrates that there had been variations in the recent roller coaster design, and different aspects of the ride had been explored in the facility’s development.

4.2. Comparison of Physical Roller Coaster and Roller Coaster in Mind

According to the previous section, it is found that the thrill feeling is reflected by acceleration, but the thrill felt does not directly relate to the player engagement. In the following sections, the link between thrill feeling and the player engagement in the roller coaster is established via real-world physics and the concept of motion in mind.
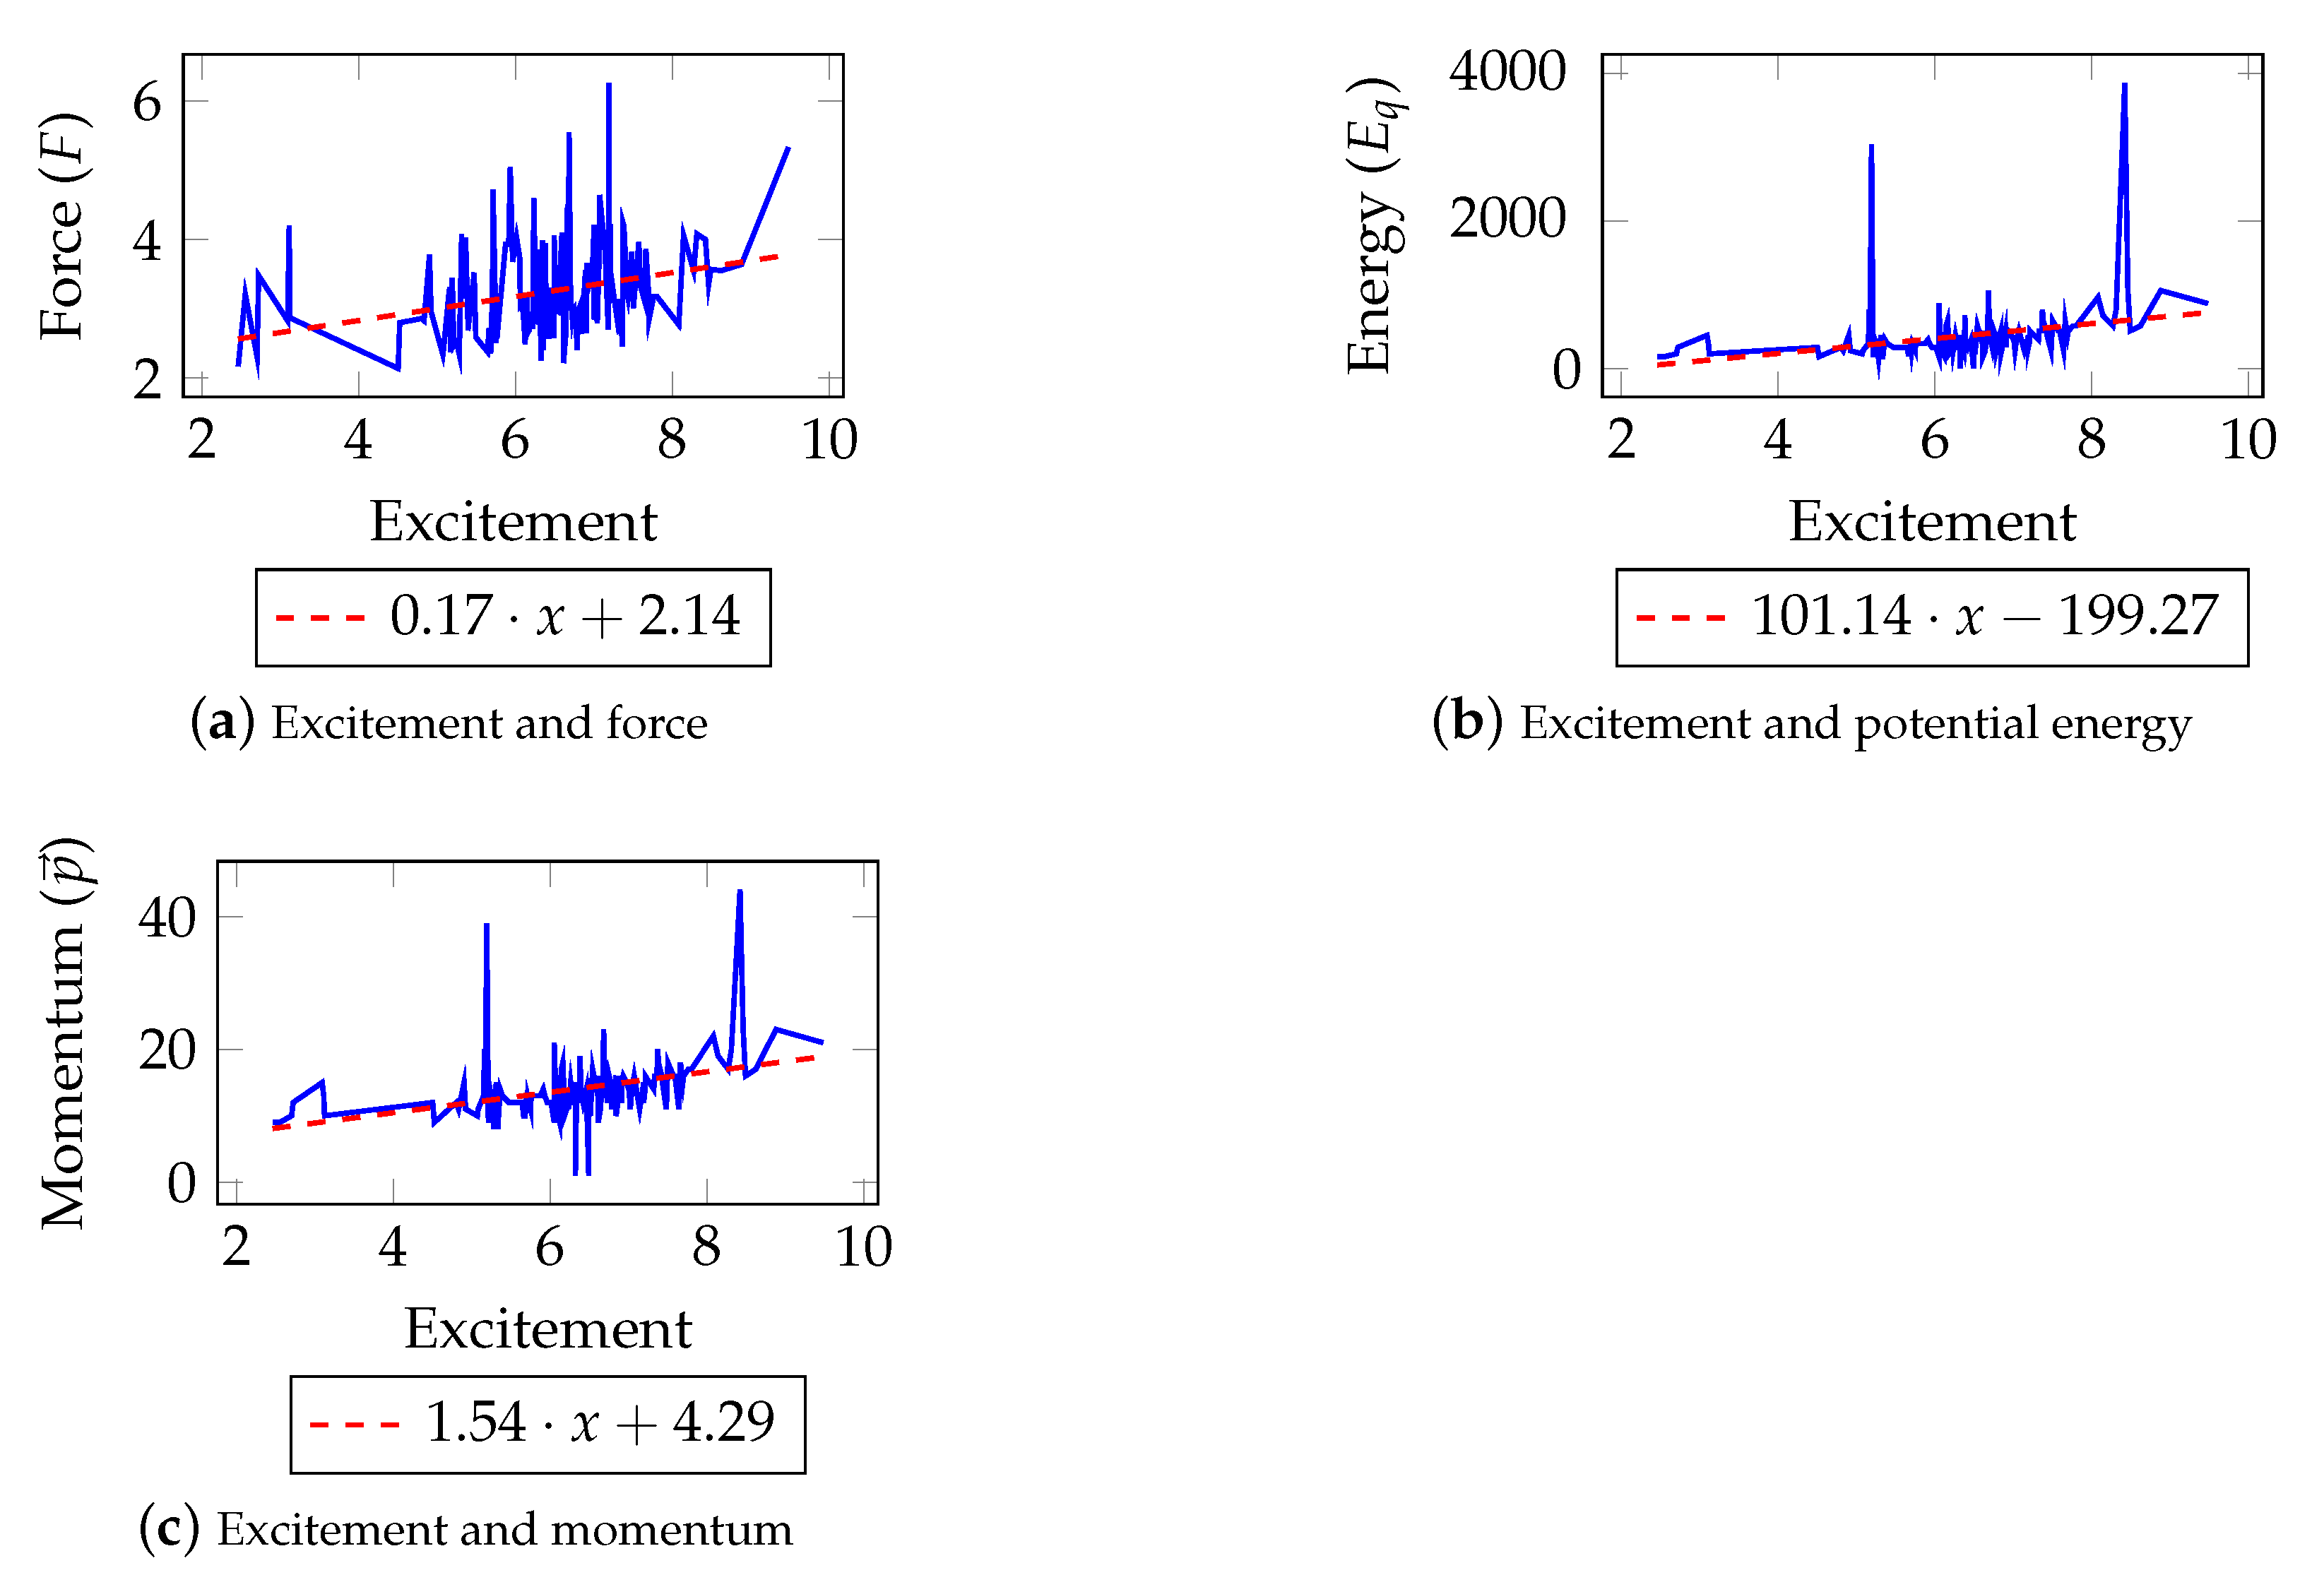
According to the data from Table 2, the physical motions with an increase of excitement are illustrated as in Figure 2. It can be observed that potential energy, force, and momentum were increasing with varying degrees. Among the three physical measures, the potential energy showed significant increases with the increasing excitement based on the linear data regression (Figure 2b). This trend was followed by momentum, albeit lower in magnitude (Figure 2c), while the force was much lower (Figure 2a). Nevertheless, the overall directions of all the physical measures are directly proportional to the excitement (Excitement E q > p > F ).
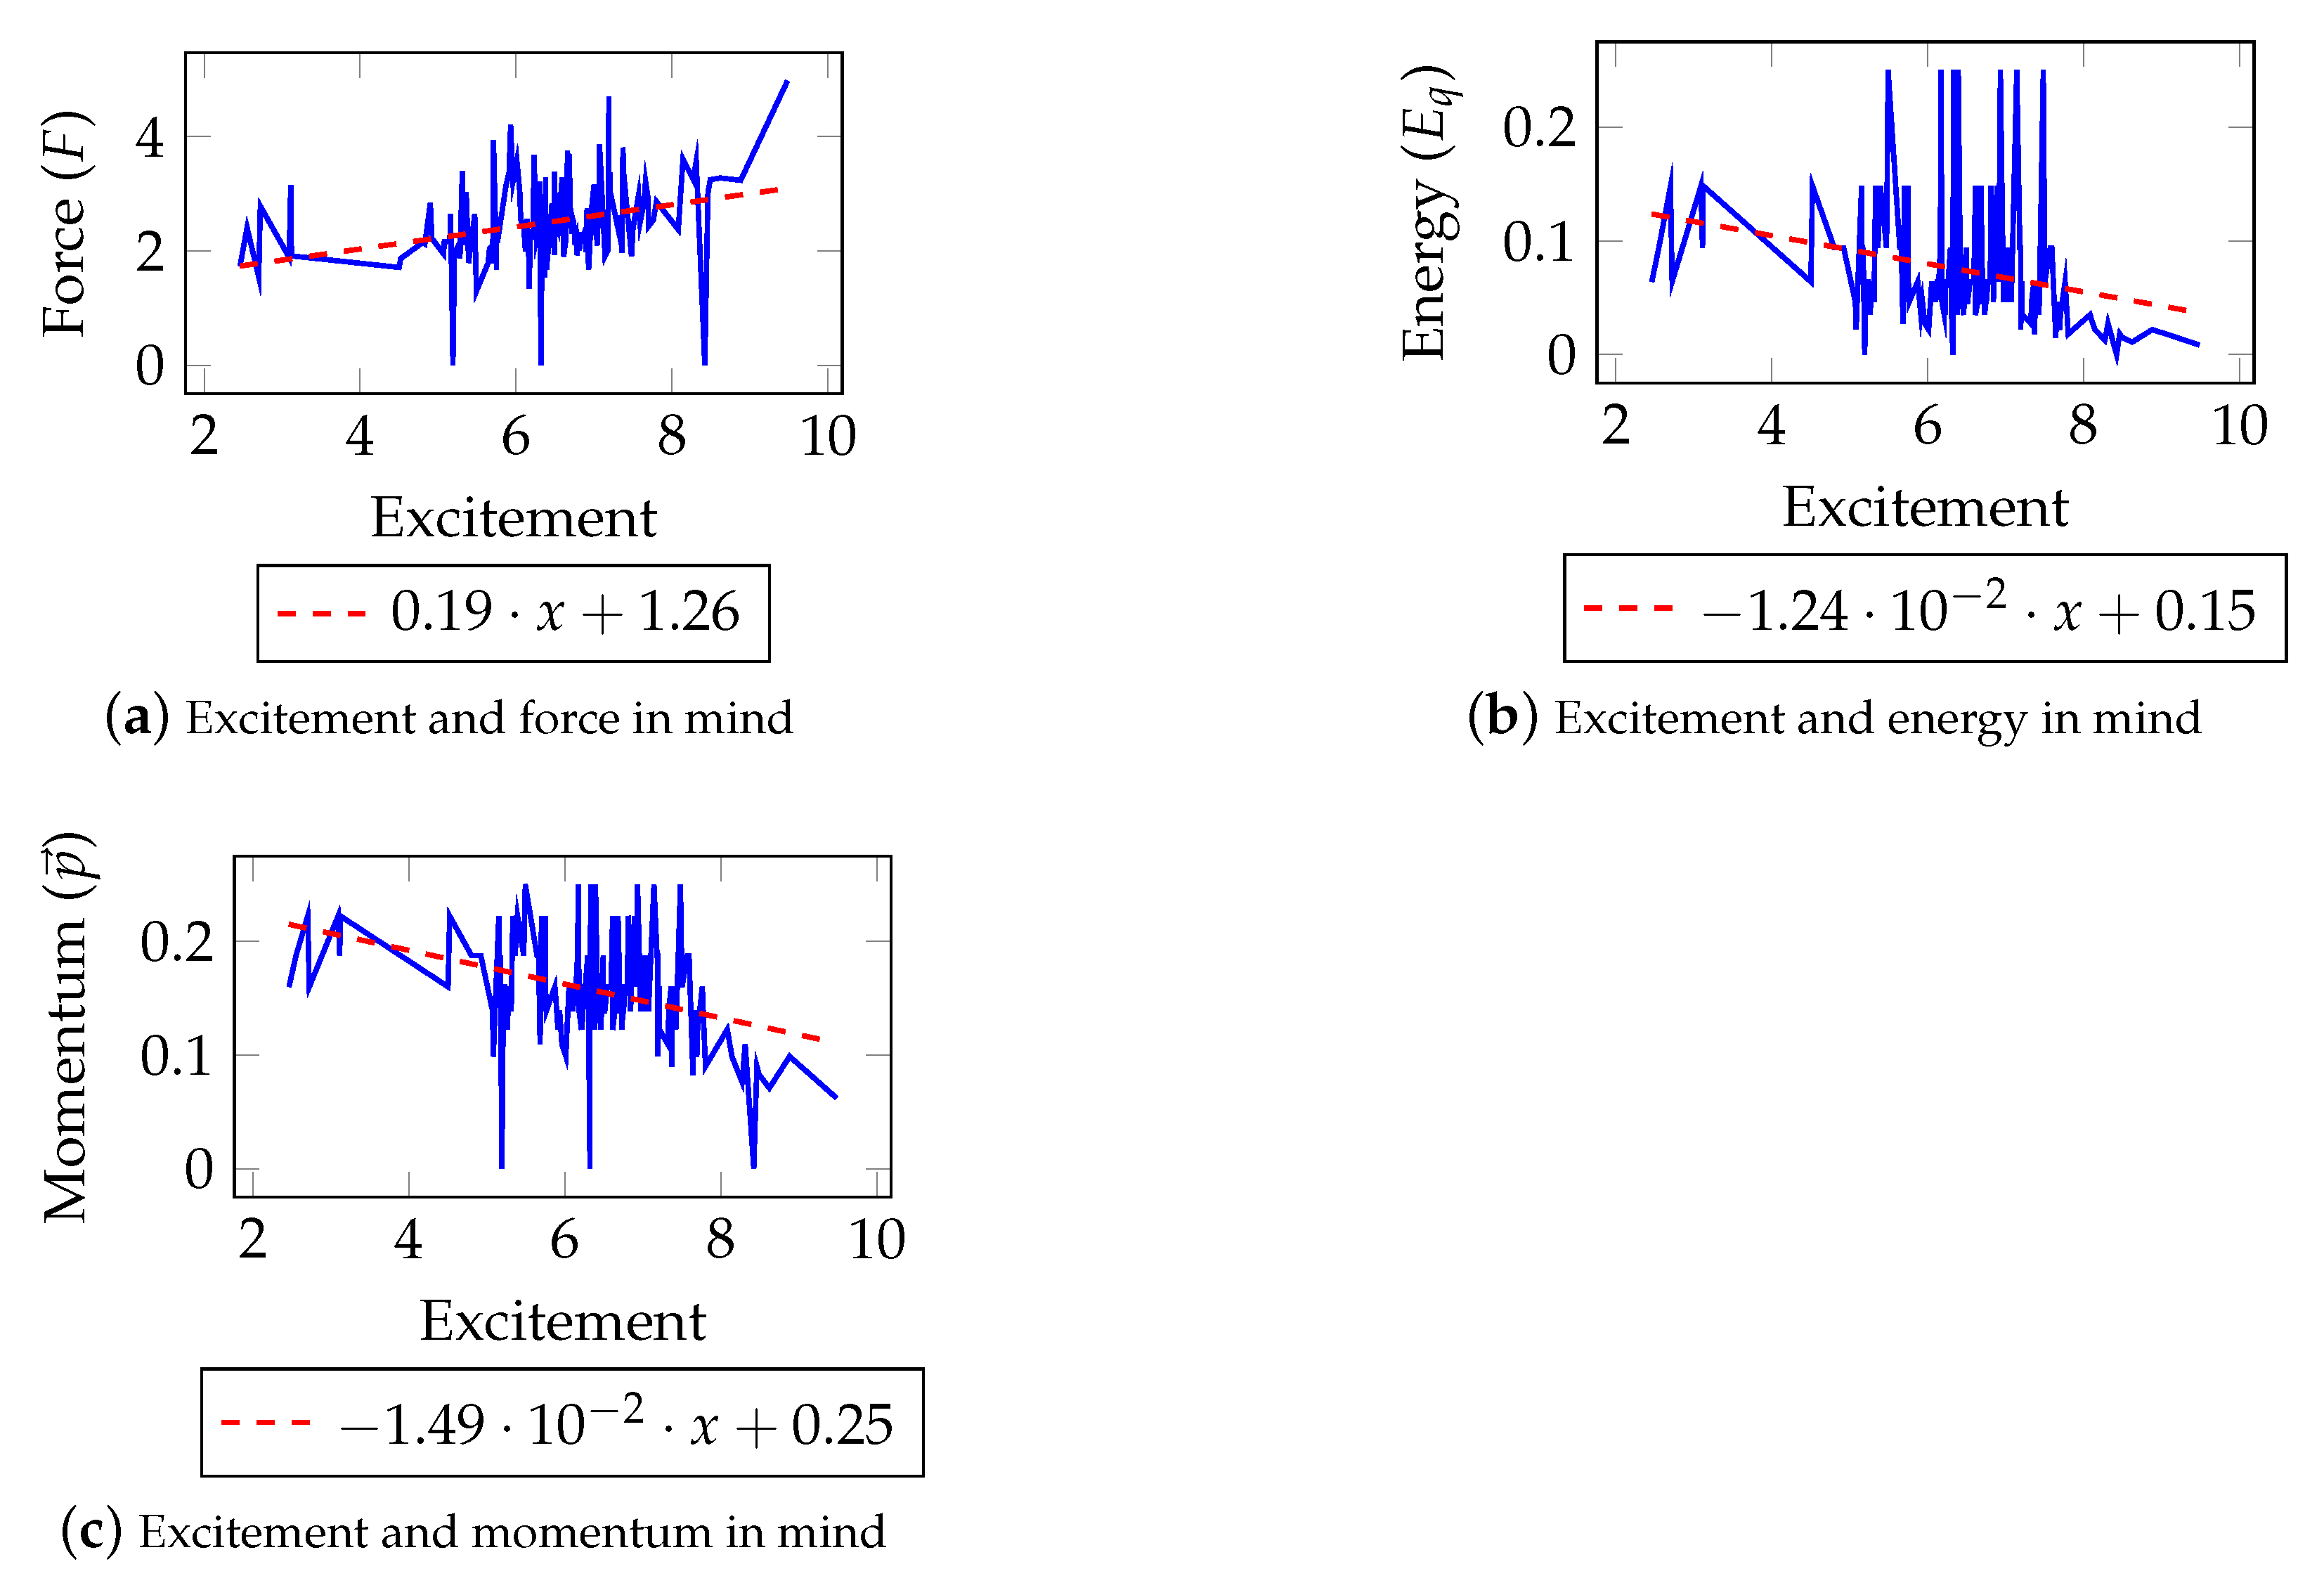
Meanwhile, considering the concept of motion in mind in the framing of roller coaster ride, the player is expected to experience a sense of thrill in the game-playing process. Based on the player satisfaction model [27], a method to express the thrill feeling in game-playing can be elicited where the N in roller coasters was found, which corresponds to the drops in the ride. The player’s feelings will be stimulated at each reversal. Based on this situation, the motions in mind measures are illustrated in Figure 3. It can be observed that the amount of potential energy in mind and the momentum in mind similarly decreases while having a high fluctuation when the excitement is between five and eight (x-axis). Concurrently, force in mind was observed with an increasing trend with some fluctuation, which increased further when excitement rises.
Such situations demonstrate the differences between natural physics and physics of the mind, where motion in the mind had a different sense of “gravity” that impacted the potential energy in mind and momentum in mind measures. In essence, the “gravity” may be associated with the player’s perceptions of the current situation (i.e., reward or pleasure). Establishing a reliable measure of the “gravity” in mind may be a game-changer in promoting a comfortable playing experience.

4.3. The Link between Natural Physic and Physic of the Mind

The initial riding in the roller coaster involves reaching the highest height through the conveying machinery. However, when the roller coaster reaches the highest point, there is no power output, and the roller coaster relies entirely on the potential energy of gravity to move. Thus, a physical roller coaster moves by gravity from high to low while having increasing velocity ( v = g t ). In other words, a physical roller coaster relies on unidirectional velocity change.
In contrast, the roller coaster in mind moves by tackling uncertainty from an unstable state to a stable one where the frequency rate of seesaw turnover or up-down of the uncertainty played a crucial role in making the ride experience exciting. As such, a roller coaster in mind has both increase and decrease velocity (bidirectional). This situation describes the rate of uncertainty change that corresponds to acceleration, which relates to the thrilling sense that a player felt (concurrent with what a rider felt) due to the rapid evolution of pace between advantageous and adverse conditions throughout the play (or ride) experience.
Motions in natural physic were based on the real velocity and acceleration, whereas the motions in mind were mainly based on the parameter defined as the turnover frequency (N). According to the data, the relationship between both sides was established, as shown in Table 4. According to Iida and Khalid [8] and Xiaohan et al. [27], F ( N ) corresponds to the player’s effort to move in the game (work), p ( N ) corresponds to fascination or seesaw in the game (play), and E p ( N ) corresponds to the difficulty of entrancement and player satisfaction.
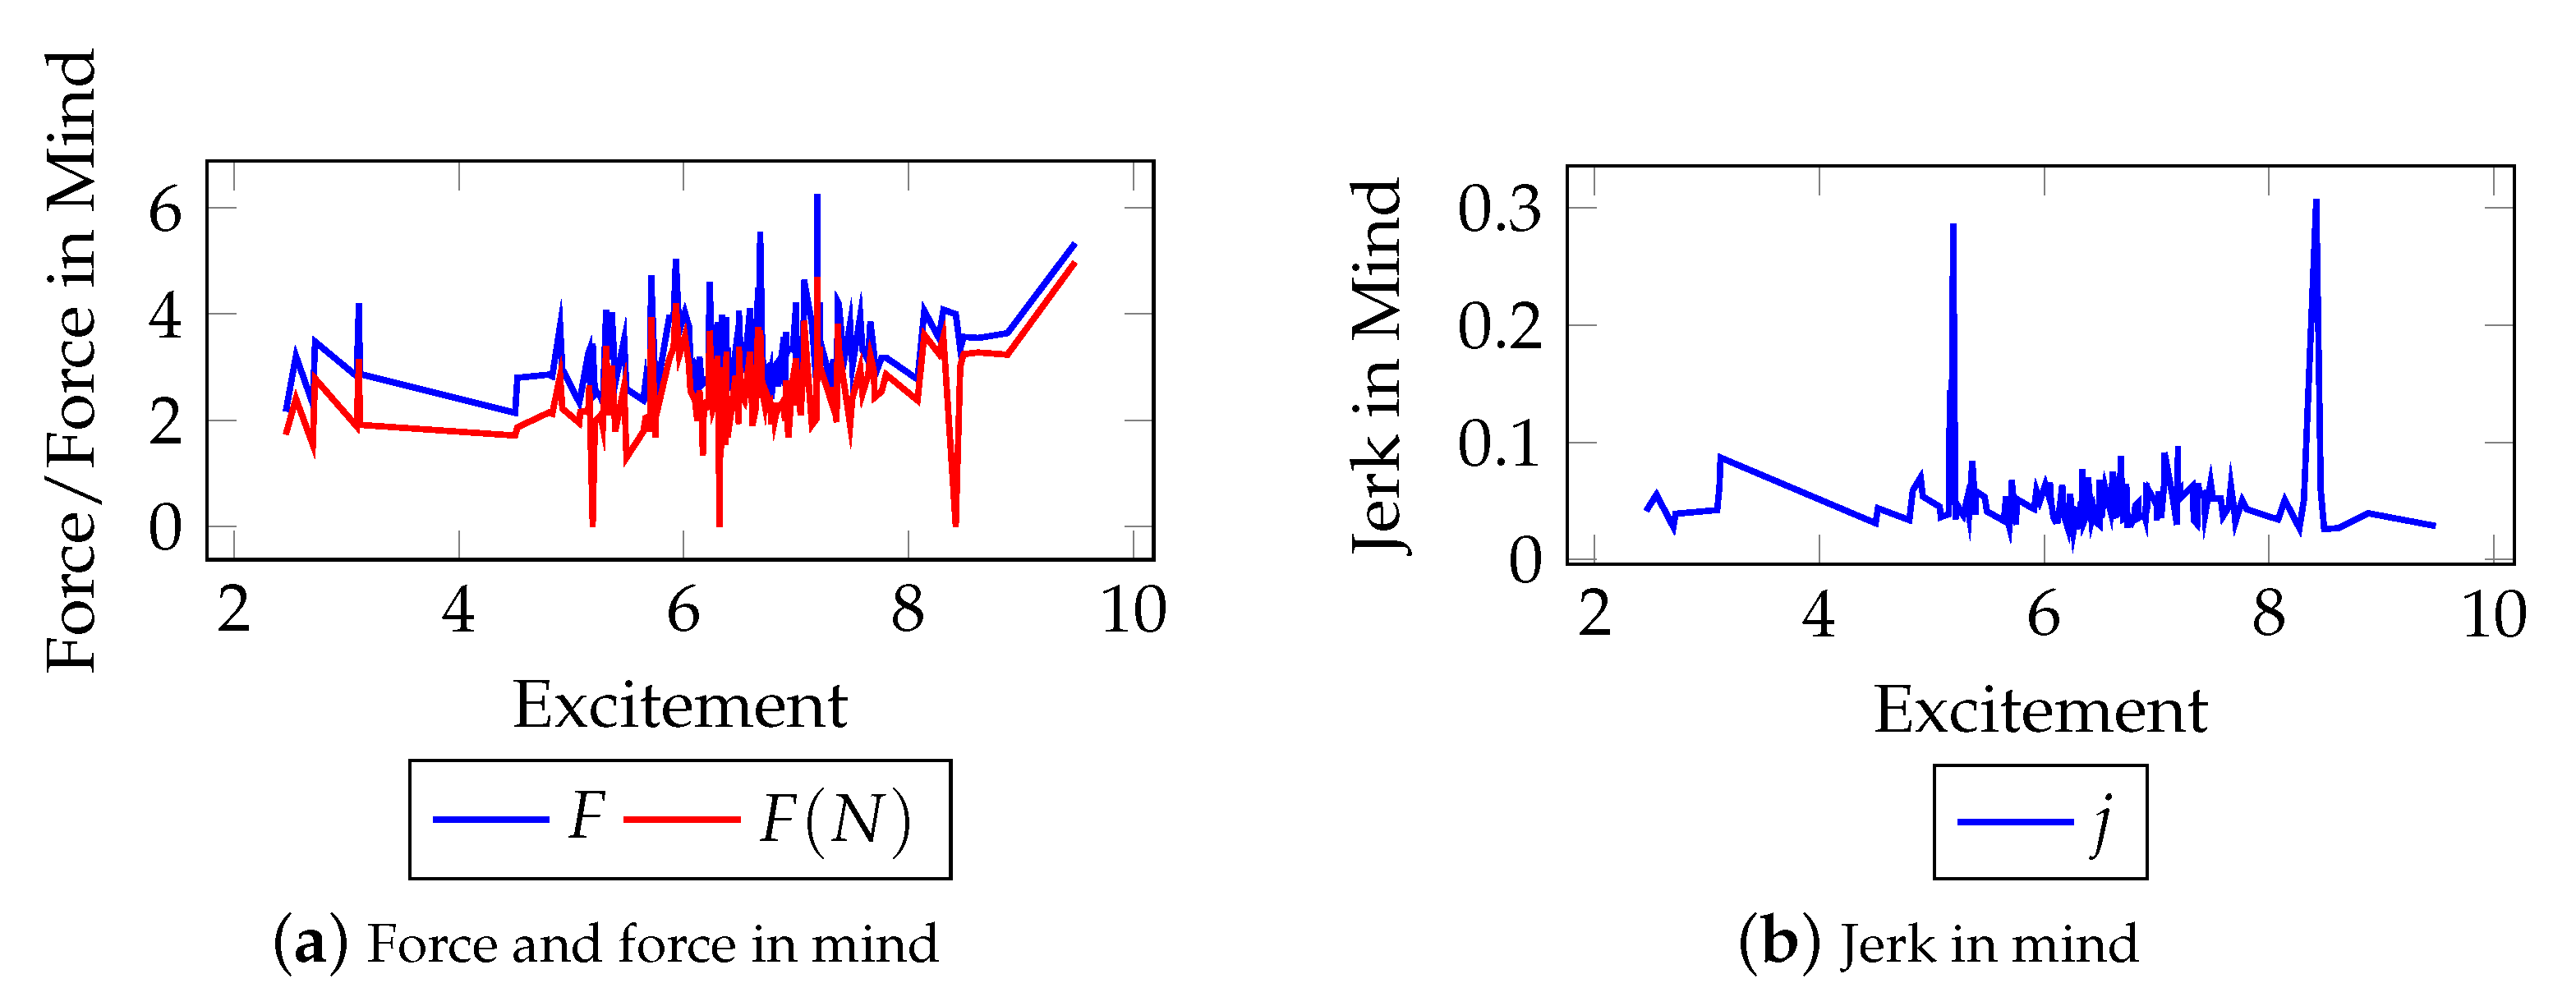
Here, it is conjectured that F = F ( N ) when the user’s effort is equaled to the force given upon by the game and the user can comfortably enjoy it. The user and the game synchronize their rhythm, where the user experiences an equal force with force expressed from the game. From the results illustrated in Figure 2a and Figure 3a, it can be seen that there is an interval overlap between F and F ( N ) at excitement value [ 5 , 8 ] where F F ( N ) 0 ± 0.44 (Figure 4a). Further inspection of the F ( N ) revealed that the jerk at excitement value of about five and eight was observed to be highest, whereas the fluctuation is the most frequent at excitement value between five and eight (Figure 4b). Such a moment demonstrates that the experience in both ride and play is considered comfortable by the user.
However, there were moments where F F ( N ) > 0 , which demonstrates the situation where force expected to be felt by the user is overwhelming and could make the user feel uncomfortable, due to “surprise” (sudden change of j). In contrast, there was no moment where F F ( N ) < 0 , which implies that the ride’s force experience is comfortable, and the player’s ability to perceive such a force is acceptable, making the ride experience to be perceived as boring or dull.
Based on the results of F = F ( N ) , it can be inferred that there is a close approximation of the natural force (F) and the force in mind ( F ( N ) ), where the difference can be observed based on the occurrence of the jerk (j). According to the findings, some excitement levels are associated with frequent fluctuating measures, demonstrating that the changes of acceleration (thrills) and jerk (surprise) were expected to some extent. Interestingly, those results implied that bridging between physical and mental comfort existed, and jerk played an essential mental comfort element.

5. Concluding Remarks

This study had expanded the research that bridges ride comfort and play comfort, where the roller coaster is utilized to establish the links between physical performance and mental experience (called the motion in mind). It was found that the roller coaster from 1976 to 2016 had evolved from being a pure thrill ride into an exciting ride experience, which was demonstrated by the changes of the potential energy, momentum, and force of such a ride experience. Such an experience was achieved by considering the trade-off between the physics indexes or the rides’ physical properties.
Furthermore, the link between ride comfort and play comfort relative to the natural physic’s motion and motion in mind was established according to the changes of ride speed (and direction), which can be reflected by the overlapping of the physical force and force in mind. The measure of F F ( N ) was an essential indicator of the comfort expected both in the ride’s physical and mental aspects. Additionally, analogical links based on its excitement stability were tabulated to determine the comfort trade-off expected from a ride. Finally, it was found that jerk is an element that existed within the comfort of play experience and should be avoided in the physical ride’s comfort. Such a condition implies that play experience had a different influence on the ride’s comfort when compared to the physical ones.
However, further investigation is needed to explore the extent of the jerk’s influence on the ride’s comfort and experience. Potential future directions can be explored in defining the settings of a comfortable ride in various types and modes of transportation and applying the riding comfort in autonomous vehicles in conjunction with other state-of-the-art algorithms.

Author Contributions

Conceptualization, Z.Z., K.X. and H.I.; Data curation, Z.Z. and K.X.; Formal analysis, Z.Z., K.X., M.N.A.K. and H.I.; Funding acquisition, H.I.; Investigation, Z.Z. and K.X.; Methodology, Z.Z., K.X., and H.I.; Project administration, H.I.; Resources, H.I.; Software, Z.Z. and K.X.; Supervision, H.I.; Validation, Z.Z., K.X., M.N.A.K. and H.I.; Visualization, Z.Z., K.X., M.N.A.K. and H.I.; Writing—original draft, Z.Z., K.X., M.N.A.K. and H.I.; Writing—review & editing, Z.Z., K.X., M.N.A.K. and H.I. All authors have read and agreed to the published version of the manuscript.

Funding

This research is funded by a grant from the Japan Society for the Promotion of Science, in the framework of the Grant-in-Aid for Challenging Exploratory Research (Grant Number: 19K22893).

Data Availability Statement

Publicly available datasets were analyzed in this study. This data can be found here https://www.kaggle.com/nolanbconaway/rollercoaster-tycoon-rides/ (accessed on 23 November 2020) and tabulated as in (Table A1 in Appendix A).

Conflicts of Interest

The authors declare no conflict of interest.

Appendix A. Top 50 Most Popular Roller Coasters Ride

Table A1. Top 50 most popular roller coasters.
NamegVelocity * Δ Height Length Duration **Year
Fury 3254.0153.097.52012.33:002015
El Toro4.4110.053.61341.11:422006
Steel Vengeance1.0119.161.01749.62:302018
Outlaw Run 109.449.4895.21:272013
Superman The Ride3.6123.967.41645.92:352000
Top Thrill Dragster 193.1128.0853.40:302003
Iron Rattler3.6112.752.1995.51:522013
Thunderbird1.096.642.7925.11:182015
Wicked Cyclone1.088.533.21011.91:372015
Nitro4.3130.066.01644.02:202001
Phoenix 72.421.9975.42:001985
Twisted Timbers1.086.933.81024.42:002018
Twisted Cyclone1.080.530.5731.51:482018
Copperhead Strike 80.525.0992.12:242019
Manta3.790.134.41023.82:352009
Dragon Khan4.3104.649.11269.51:451995
Millennium Force4.5149.791.42010.22:202000
Space Mountain3.748.327.4974.12:302005
Mystic Timbers 85.030.0995.02:002017
Mako 117.561.01450.8 2016
Leviathan4.5148.193.31672.13:282012
Tatsu 99.833.81097.92:002006
Montu3.896.639.01214.03:001996
Space Mountain 71.032.01051.02:152005
Blue Fire3.8100.038.01056.02:302009
Time Traveler 81.027.4920.51:572018
De Vliegende Hollander3.070.022.5420.03:452007
Diamondback4.2128.765.51610.03:002009
Nemesis3.580.531.7716.01:201994
Jurassic Park The Flying Dinosaur 99.837.81124.0 2016
Apollo’s Chariot4.1117.064.01488.02:151999
Intimidator 3055.0144.891.41554.53:002010
GhostRider3.190.132.91381.72:401998
Xcelerator4.0132.062.5671.21:022002
Cheetah Hunt4.096.639.61350.04:002011
Lightning Racer3.682.227.41034.22:202000
Afterburn4.599.834.4901.02:471999
Big Thunder Mountain 65.012.01500.03:561992
Mamba3.5120.762.51706.93:001998
The Voyage4.0107.846.91963.52:452006
SheiKra4.0112.761.0971.72:202005
Storm Runner4.2120.754.9792.50:502004
Expedition Everest3.080.524.41348.42:502006
*: km/h; g: G-force; : in meters; **: in minutes and seconds.

References

  1. Subhani, A.R.; Likun, X.; Malik, A.S. Association of autonomic nervous system and EEG scalp potential during playing 2D grand turismo 5. In Proceedings of the 2012 Annual International Conference of the IEEE Engineering in Medicine and Biology Society, San Diego, CA, USA, 28 August–1 September 2012; pp. 3420–3423. [Google Scholar]
  2. Beaudoin-Gagnon, N.; Fortin-Côté, A.; Chamberland, C.; Lefebvre, L.; Bergeron-Boucher, J.; Campeau-Lecours, A.; Tremblay, S.; Jackson, P.L. The FUNii Database: A Physiological, Behavioral, Demographic and Subjective Video Game Database for Affective Gaming and Player Experience Research. In Proceedings of the 2019 8th International Conference on Affective Computing and Intelligent Interaction (ACII), Cambridge, UK, 3–6 September 2019; pp. 1–7. [Google Scholar]
  3. Iida, H.; Takahara, K.; Nagashima, J.; Kajihara, Y.; Hashimoto, T. An application of game-refinement theory to Mah Jong. In Proceedings of the International Conference on Entertainment Computing, Eindhoven, The Netherlands, 1–3 September 2004; pp. 333–338. [Google Scholar]
  4. Naying, G.; Primanita, A.; Khalid, M.N.A.; Hiroyuki, I. A Key Factor to Maintain Engagement: Case Study Using ‘Login System’. In Proceedings of the Sriwijaya International Conference on Information Technology and Its Applications (SICONIAN 2019), Palembang, Indonesia, 16 November 2019; pp. 492–497. [Google Scholar]
  5. Gao, Y.; Li, W.; Xiao, Y.; Khalid, M.N.A.; Iida, H. Nature of Attractive Multiplayer Games: Case Study on China’s Most Popular Card Game—DouDiZhu. Information 2020, 11, 141. [Google Scholar] [CrossRef] [Green Version]
  6. Jiangzhou, L.; Primanita, A.; Khalid, M.N.A.; Hiroyuki, I. Analyzing The Improvement Process of Table Tennis Using The Game Refinement Theory. In Proceedings of the Sriwijaya International Conference on Information Technology and Its Applications (SICONIAN 2019), Palembang, Indonesia, 16 November 2019; pp. 437–442. [Google Scholar]
  7. Xinyue, L.; Luping, F.; Khalid, M.N.A.; Iida, H. Finding appropriate settings for fairness and engagement of a newly designed game: A case study using Japanese crossword game ‘MyoGo Renju’. Entertain. Comput. 2020, 34, 100358. [Google Scholar] [CrossRef]
  8. Iida, H.; Khalid, M.N.A. Using games to study law of motions in mind. IEEE Access 2020, 8, 138701–138709. [Google Scholar] [CrossRef]
  9. Zhou, Y.; Chen, S. Vehicle ride comfort analysis with whole-body vibration on long-span bridges subjected to crosswind. J. Wind. Eng. Ind. Aerodyn. 2016, 155, 126–140. [Google Scholar] [CrossRef] [Green Version]
  10. Elbanhawi, M.; Simic, M.; Jazar, R. In the passenger seat: Investigating ride comfort measures in autonomous cars. IEEE Intell. Transp. Syst. Mag. 2015, 7, 4–17. [Google Scholar] [CrossRef]
  11. McCall, J.C.; Trivedi, M.M. Driver behavior and situation aware brake assistance for intelligent vehicles. Proc. IEEE 2007, 95, 374–387. [Google Scholar] [CrossRef]
  12. Lv, C.; Hu, X.; Sangiovanni-Vincentelli, A.; Li, Y.; Martinez, C.M.; Cao, D. Driving-style-based codesign optimization of an automated electric vehicle: A cyber-physical system approach. IEEE Trans. Ind. Electron. 2018, 66, 2965–2975. [Google Scholar] [CrossRef] [Green Version]
  13. Nahvi, H.; Fouladi, M.H.; Nor, M.M. Evaluation of whole-body vibration and ride comfort in a passenger car. Int. J. Acoust. Vib. 2009, 14, 143–149. [Google Scholar]
  14. Yang, Y.; Ren, W.; Chen, L.; Jiang, M.; Yang, Y. Study on ride comfort of tractor with tandem suspension based on multi-body system dynamics. Appl. Math. Model. 2009, 33, 11–33. [Google Scholar] [CrossRef]
  15. Powell, J.; Palacín, R. Passenger stability within moving railway vehicles: Limits on maximum longitudinal acceleration. Urban Rail Transit 2015, 1, 95–103. [Google Scholar] [CrossRef] [Green Version]
  16. Feng, F.; Bao, S.; Sayer, J.R.; Flannagan, C.; Manser, M.; Wunderlich, R. Can vehicle longitudinal jerk be used to identify aggressive drivers? An examination using naturalistic driving data. Accid. Anal. Prev. 2017, 104, 125–136. [Google Scholar] [CrossRef]
  17. He, X.Y.; He, H.W.; Hu, Z.Y. Modeling and Simulation of a roller coaster. Appl. Mech. Mater. 2015, 719, 262–267. [Google Scholar] [CrossRef]
  18. Cartmell, R. The Incredible Scream Machine: A History of the Roller Coaster; Popular Press: Bowling Green, OH, USA, 1987. [Google Scholar]
  19. Pendrill, A.M.; Eager, D. Velocity, acceleration, jerk, snap and vibration: Forces in our bodies during a roller coaster ride. Phys. Educ. 2020, 55, 065012. [Google Scholar] [CrossRef]
  20. Eager, D.; Pendrill, A.M.; Reistad, N. Beyond velocity and acceleration: Jerk, snap and higher derivatives. Eur. J. Phys. 2016, 37, 065008. [Google Scholar] [CrossRef]
  21. ISO. Mechanical Vibration and Shock: Evaluation of Human Exposure to Whole-Body Vibration. Part 1, General Requirements: International Standard ISO 2631-1: 1997 (E); ISO: Geneva, Switzerland, 1997. [Google Scholar]
  22. What Are the World’s Best Roller Coasters? Available online: https://www.themeparkinsider.com/rollercoasters/ (accessed on 16 November 2020).
  23. Productions, V.S. Roller Coaster Tycoon. Hasbro Interact. 1999. [Google Scholar]
  24. Classic ‘RollerCoaster Tycoon’ Comes to IOS and Android. Available online: https://www.engadget.com/2016-12-22-rollercoaster-tycoon-classic-ios-android.html (accessed on 16 November 2020).
  25. RollerCoaster Tycoon Classic is Sliding onto Steam. Available online: https://www.destructoid.com/rollercoaster-tycoon-classic-is-sliding-onto-steam-463532.phtml (accessed on 23 November 2020).
  26. RollerCoaster Tycoon Data. Available online: https://www.kaggle.com/nolanbconaway/rollercoaster-tycoon-rides/ (accessed on 23 November 2020).
  27. Xiaohan, K.; Khalid, M.N.A.; Iida, H. Player Satisfaction Model and its Implication to Cultural Change. IEEE Access 2020, 8, 184375–184382. [Google Scholar] [CrossRef]
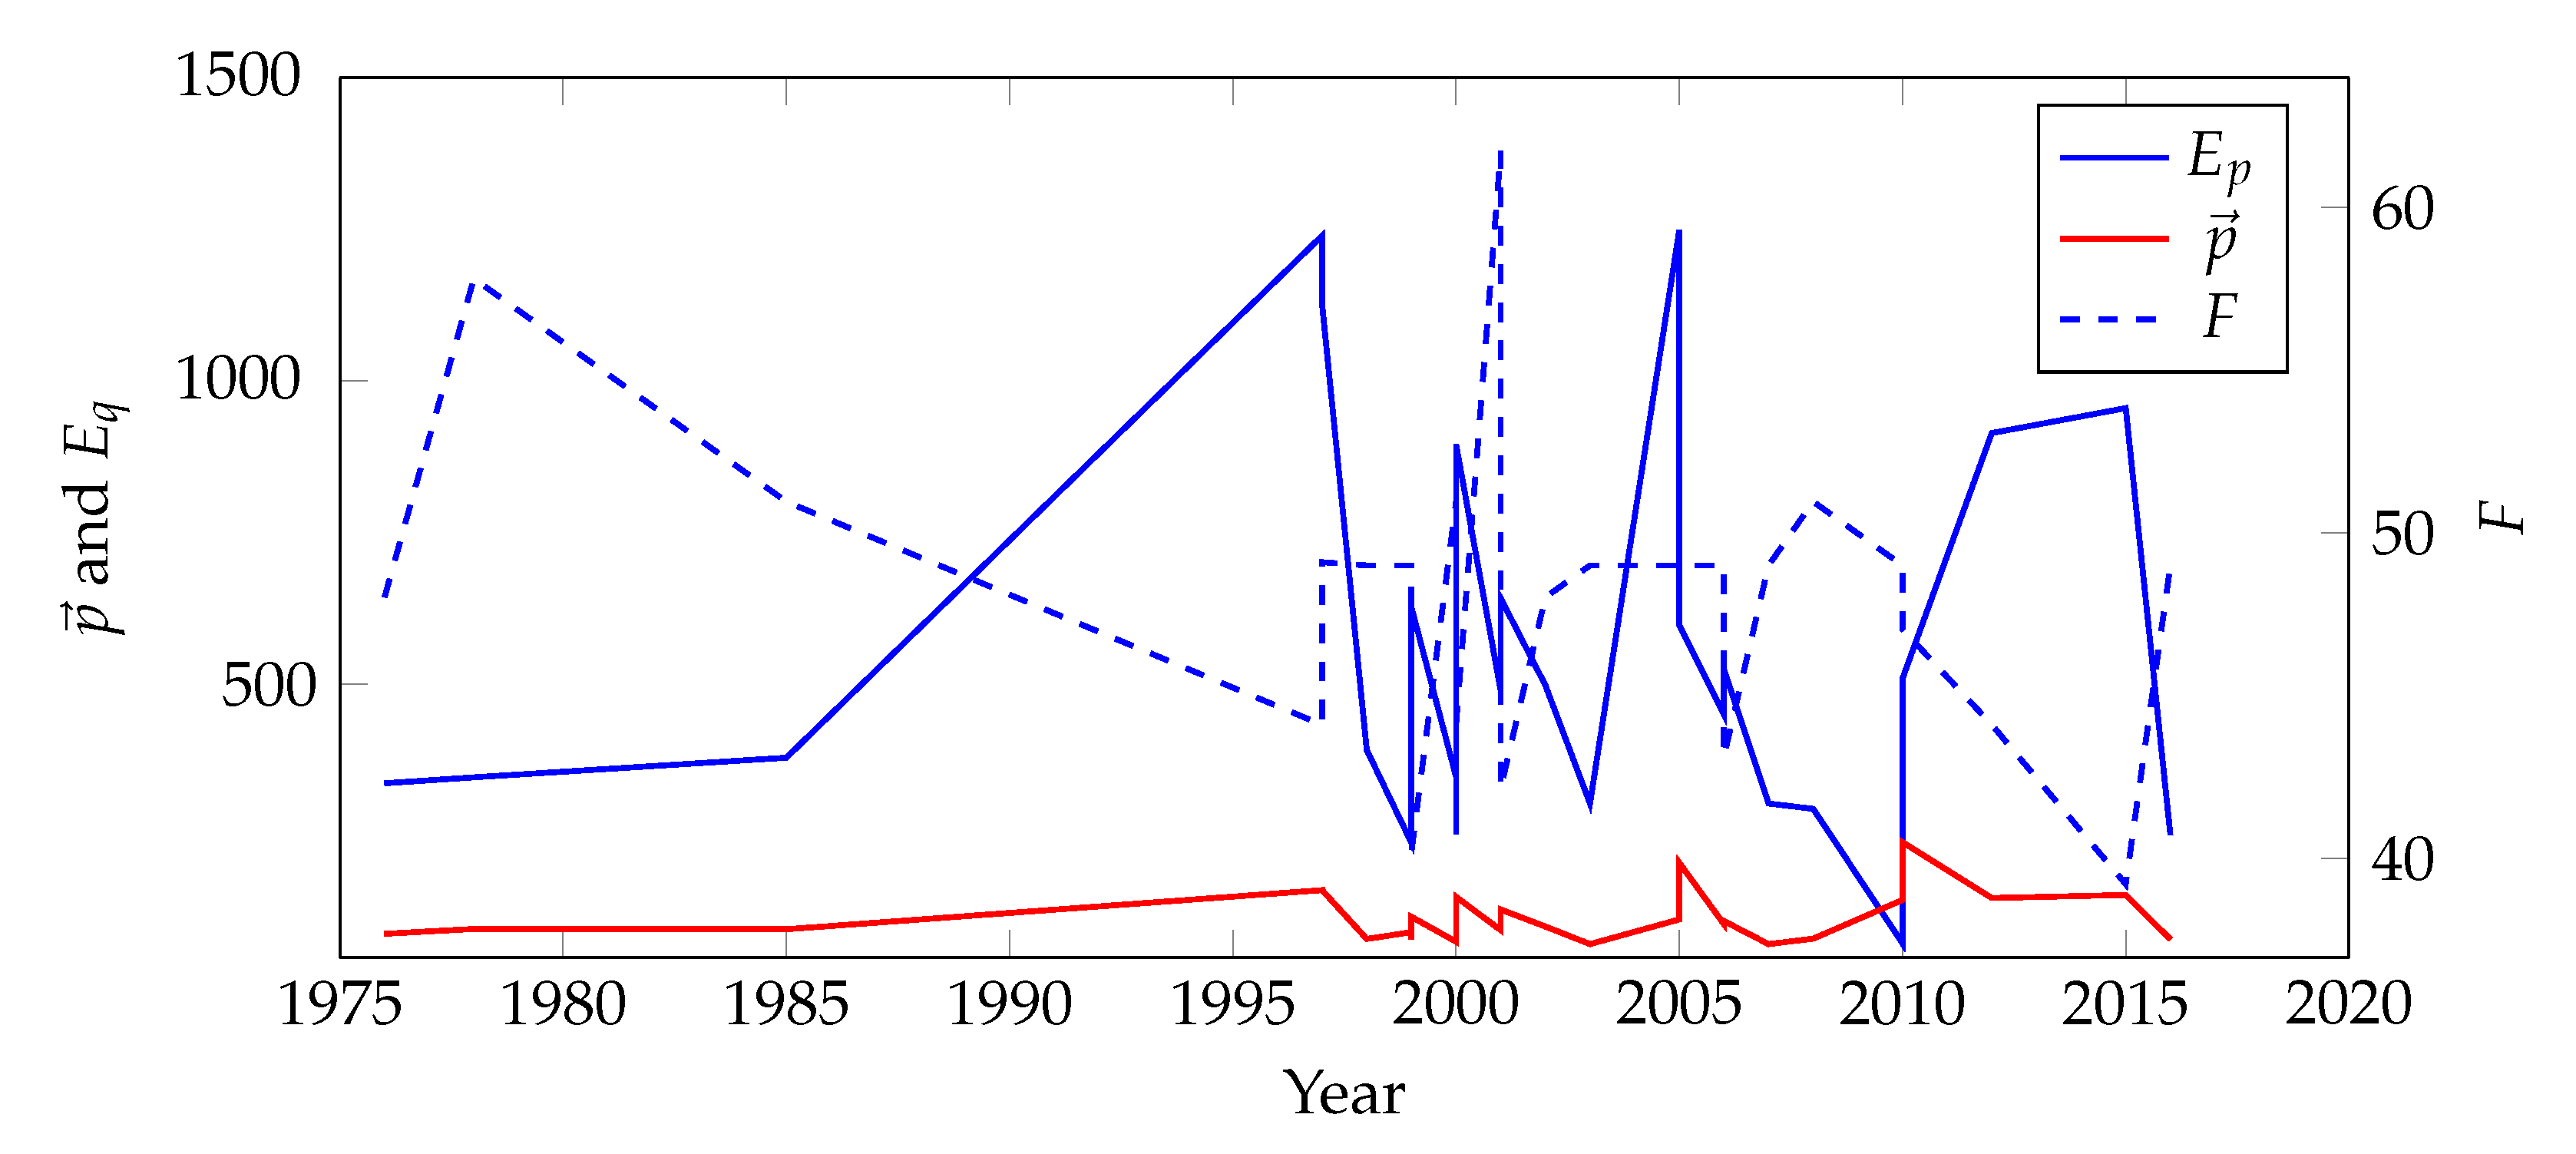
Figure 1. Motions changes of the roller coaster ride during different periods.
Information 12 00119 g001
Figure 2. The dynamics of computed physical roller coaster based on increasing excitement and (a) Force, (b) Energy, and (c) Momentum.
Information 12 00119 g002
Figure 3. The dynamics of computed physical roller coaster based on increasing excitement and (a) Force in mind, (b) Energy in mind, and (c) Momentum in mind.
Information 12 00119 g003
Figure 4. Bridging ride and play comfort via measure of (a) forces and (b) jerk in mind.
Information 12 00119 g004
Table 1. Analogical link between game and physics [8].
NotationGame ContextNotationPhysics Context
ysolved uncertaintyxdisplacement
tprogress or lengthttime
vwin ratevvelocity
mwin hardnessMmass
aaccelerationggravitational acceleration
E p potential energyUpotential energy
Table 2. The top 11th high G-force roller coaster.
RankgVelocity (km/h) Δ Height (m)Length (m)Duration NameYear
1st6.395.0050.0 3:34Tower of Terror2001
2nd5.997.0035.41097.32:00Shock Wave1978
3rd5.281.0030.1844.02:20Euro-Star2008
3rd5.296.5038.71279.61:13Mindbender1985
3rd5.276.0035.5285.01:48Speed of Sound2000
4th5.0109.9054.6381.02:02Diving Machine G52000
4th5.0206.00127.4950.40:28Kingda Ka2005
4th5.080.5040.0309.01:30invertigo1998
4th5.0112.7061.0971.72:20SheiKra2005
4th5.091.7024.41037.21:22Rock ‘n’ Roller Coaster1999
4th5.072.0031.0787.01:50Suspended Looping Coaster2003
4th5.080.0025.7670.01:30Typhoon2016
4th5.072.0031.0787.01:50Vortex2007
4th5.0105.0046.0150.00:50X Coaster2006
4th5.090.0025.8996.01:15Xpress2000
4th5.0144.8091.41554.53:00Intimidator 3052010
5th4.980.0032.0823.02:00Batman (Model)1999
5th4.989.0034.41053.72:12Revolution1976
6th4.8240.0052.02000.01:32Formula Rossa2010
6th4.9101.0050.9891.22:52The Odyssey2002
7th4.5150.0091.42010.22:20Millennium Force2000
7th4.5148.0093.31672.13:28Leviathan2012
7th4.5161.00126.5376.40:28Superman: Escape From Krypton1997
7th4.5160.90115.0376.40:28Tower of Terror II1997
8th4.4110.0053.61341.11:42El Toro2006
9th4.3129.0065.51644.12:20Nitro2001
10th4.1117.0064.01488.02:15Apollo’s Chariot1999
11th4.0153.0097.52012.33:00Fury 3252015
g: G-force; : minutes:seconds.
Table 3. The top 11th high G-force roller coaster.
NameF * p E q Length (m)Duration Year
Tower of Terror6.395.050.0 3:342001
Shock Wave5.997.035.41097.32:001978
Euro-Star5.281.030.1844.02:202008
Mindbender5.296.538.71279.61:131985
Speed of Sound5.276.035.5285.01:482000
Diving Machine G55.0109.954.6381.02:022000
Kingda Ka5.0206.0127.4950.40:282005
invertigo5.080.540.0309.01:301998
SheiKra5.0112.761.0971.72:202005
Rock ‘n’ Roller Coaster5.091.724.41037.21:221999
Suspended Looping Coaster5.072.031.0787.01:502003
Typhoon5.080.025.7670.01:302016
Vortex5.072.031.0787.01:502007
X Coaster5.0105.046.0150.00:502006
Xpress5.090.025.8996.01:152000
Intimidator 3055.0144.891.41554.53:002010
Batman (Model)4.980.032.0823.02:001999
Revolution4.989.034.41053.72:121976
Formula Rossa4.8240.052.02000.01:322010
The Odyssey4.9101.050.9891.22:522002
Millennium Force4.5150.091.42010.22:202000
Leviathan4.5148.093.31672.13:282012
Superman: Escape From Krypton4.5161.0126.5376.40:281997
Tower of Terror II4.5160.9115.0376.40:281997
El Toro4.4110.053.61341.11:422006
Nitro4.3129.065.51644.12:202001
Apollo’s Chariot4.1117.064.01488.02:151999
Fury 3254.0153.097.52012.33:002015
* : G-force; : minutes:seconds.
Table 4. Analogical link between motions in mind and physics.
EnergyMomentumForce
LowHighLowHighLowHigh
E p ( N ) High
Low
p ( N ) High
Low
F ( N ) High
Low
⇑: high excitement; ⇓: low excitement; ⇕: unstable.
Publisher’s Note: MDPI stays neutral with regard to jurisdictional claims in published maps and institutional affiliations.