Article

TextQ—A User Friendly Tool for Exploratory Text Analysis

1
Cyber Science Department, United States Naval Academy, Annapolis, MD 21402, USA
2
Sociology Department, Queens College, City University of New York, Queens, NY 11367, USA
*
Author to whom correspondence should be addressed.
Information 2021, 12(12), 508; https://doi.org/10.3390/info12120508
Submission received: 15 October 2021 / Revised: 2 December 2021 / Accepted: 2 December 2021 / Published: 7 December 2021
(This article belongs to the Special Issue Information Technology: New Generations (ITNG 2020 & 2021))

Abstract

:
As the amount of textual data available on the Internet grows substantially each year, there is a need for tools to assist with exploratory data analysis. Furthermore, to democratize the process of text analytics, tools must be usable for those with a non-technical background and those who do not have the financial resources to outsource their data analysis needs. To that end, we developed TextQ, which provides a simple, intuitive interface for exploratory analysis of textual data. We also tested the efficacy of TextQ using two case studies performed by subject matter experts—one related to a project on the detection of cyberbullying communication and another related to the user of Twitter for influence operations. TextQ was able to efficiently process over a million social media messages and provide valuable insights that directly assisted in our research efforts on these topics. TextQ is built using an open access platform and object-oriented architecture for ease of use and installation. Additional features will continue to be added to TextQ, based on the needs and interests of the installed base.

1. Introduction

1.1. Background and Motivation

The amount of textual data produced continues to grow at astronomical rates. Forbes Magazine estimated in 2018 that 456,000 tweets were sent every minute on Twitter; 293,000 statuses were updated on Facebook; 16 million text messages were sent; 156 million emails were sent; and 600 new page edits were made to Wikipedia [1]. By August 2021, according to Statista there were 5.7 million Google searches, 12 million iMessage messages, 668,000 discord messages, 575,000 tweets posted and 167 million TikTok videos watched every minute [2]. No doubt the volume of data will continue to grow, and both researchers and companies require tools to help analyze and make sense of these data, much of which is in the form of unstructured text. Data science is a growing field, as companies, governmental agencies and research teams seek to process and understand the data that most impacts them. However, as of 2020 there was an estimated shortage of data scientists, with up to 250,000 positions going unfilled [3].
In this article we describe a new tool—TextQ—that is designed to assist non-technical users with exploratory analysis of textual data. TextQ allows users to run preliminary analyses and includes built in support describing how the text analysis process works. Of primary concern is the potential for data mismanagement, when sweeping conclusions are drawn from incomplete data or the output of data analytical tools is misinterpreted. To address this concern, TextQ also provides users with information about the limitations of the analyses performed.
TextQ is in an early stage of development, with the primary software architecture established and basic tools available. The software is built in Python using open access libraries, and thus there is no barrier to installation and use for individuals and groups that are not well-resourced. Over time additional tools will be added (including machine learning), and the underlying philosophy will remain the same—to lower the barrier to entry for textual data analysis—allowing more democratic access for the analysis of the vast quantities of data that are generated every day around the world while maintaining analytic quality.
In Section 2 we discuss the primary interface of the TextQ application as well as its flexibility for management of disparate data input. In Section 3 we discuss the software architecture, provide data on runtime efficiency, and present two case studies. The first case study involves analysis of a collection of text messages collected as part of a study of cyberbullying activity among youth ages 10–14. The second is a dataset containing tweets that Twitter determined to be part of a Russian influence operation against the United States. This data set was subsequently released by Twitter for research purposes. Both projects involved analysis of results by those with non-technical backgrounds. In Section 4 we summarize the results of the current project and describe future directions in the development of TextQ.

1.2. Related Work

There is no shortage of articles describing software solutions for text analysis. Alexa and Zuell offered a review of available software for text analysis in 2000 [4]. Wiechmann and Fuhs provided an update in 2006 [5], referring to the process as “Concordancing.” With the introduction of MySpace and then Facebook, social media became prevalent around 2004. The software available at (and before) that time was primarily focused on the analysis of longer, and more structured, textual data.
More recently, Diesner introduced ConText in 2014 [6]. There are commercial products as well, such as Linguistic Inquiry and Word Count (LIWC), which reads a given text and counts the percentage of words that reflect different emotions, thinking styles, social concerns, and parts of speech [7]. Additionally, authors have also provided tutorials for developing your own text analysis software [8].
Several websites provide basic functionality, such as word counts (countwordsfree.com, accessed on 5 November 2021) or wordclouds (mentimeter.com or wordclouds.com, accessed on 5 November 2021). However, online tools cannot be used to analyze large volumes of text (millions of records). These systems time-out during the upload process or only allow for small text entry directly into a webform. Furthermore, we did not find any online tool with the filtering and preprocessing capability of TextQ.
While this article does not purport to be an exhaustive study of all available tools, we have noticed limitations in the software that is available. In almost all cases, the software tools are designed for use by individuals who have a specific need or task in mind—for example, coding a dataset to test a hypothesis in the social sciences. These tools also assume a baseline level of user understanding regarding the terms and applicability of text analysis. TextQ on the other hand, is designed for unsupervised exploratory text analysis by a subject matter expert with limited to no background in text mining. In other words, TextQ can provide common-sense insights for someone working with a collection of textual data, as well as provide more sophisticated tools and filtering options for those who have more explicit needs or wish to perform more complex tasks.

2. Materials and Methods

2.1. Software and Hardware

The current build of TextQ is built using Python version 3.9.5. Natural language processing used the Natural Language Toolkit (nltk, version 3.6.2). WordCloud for Python (v 1.8.1) was used to generate WordCloud output. wxPython (v 4.1.1) was used for the development of the interactive GUI interface. Development and runtime testing was done on a MacBook Pro with a 2.3 GHz 8-Core Intel Core i9 processor with 32 GB of RAM. The operating system is macOS Big Sur (Version 11.6).

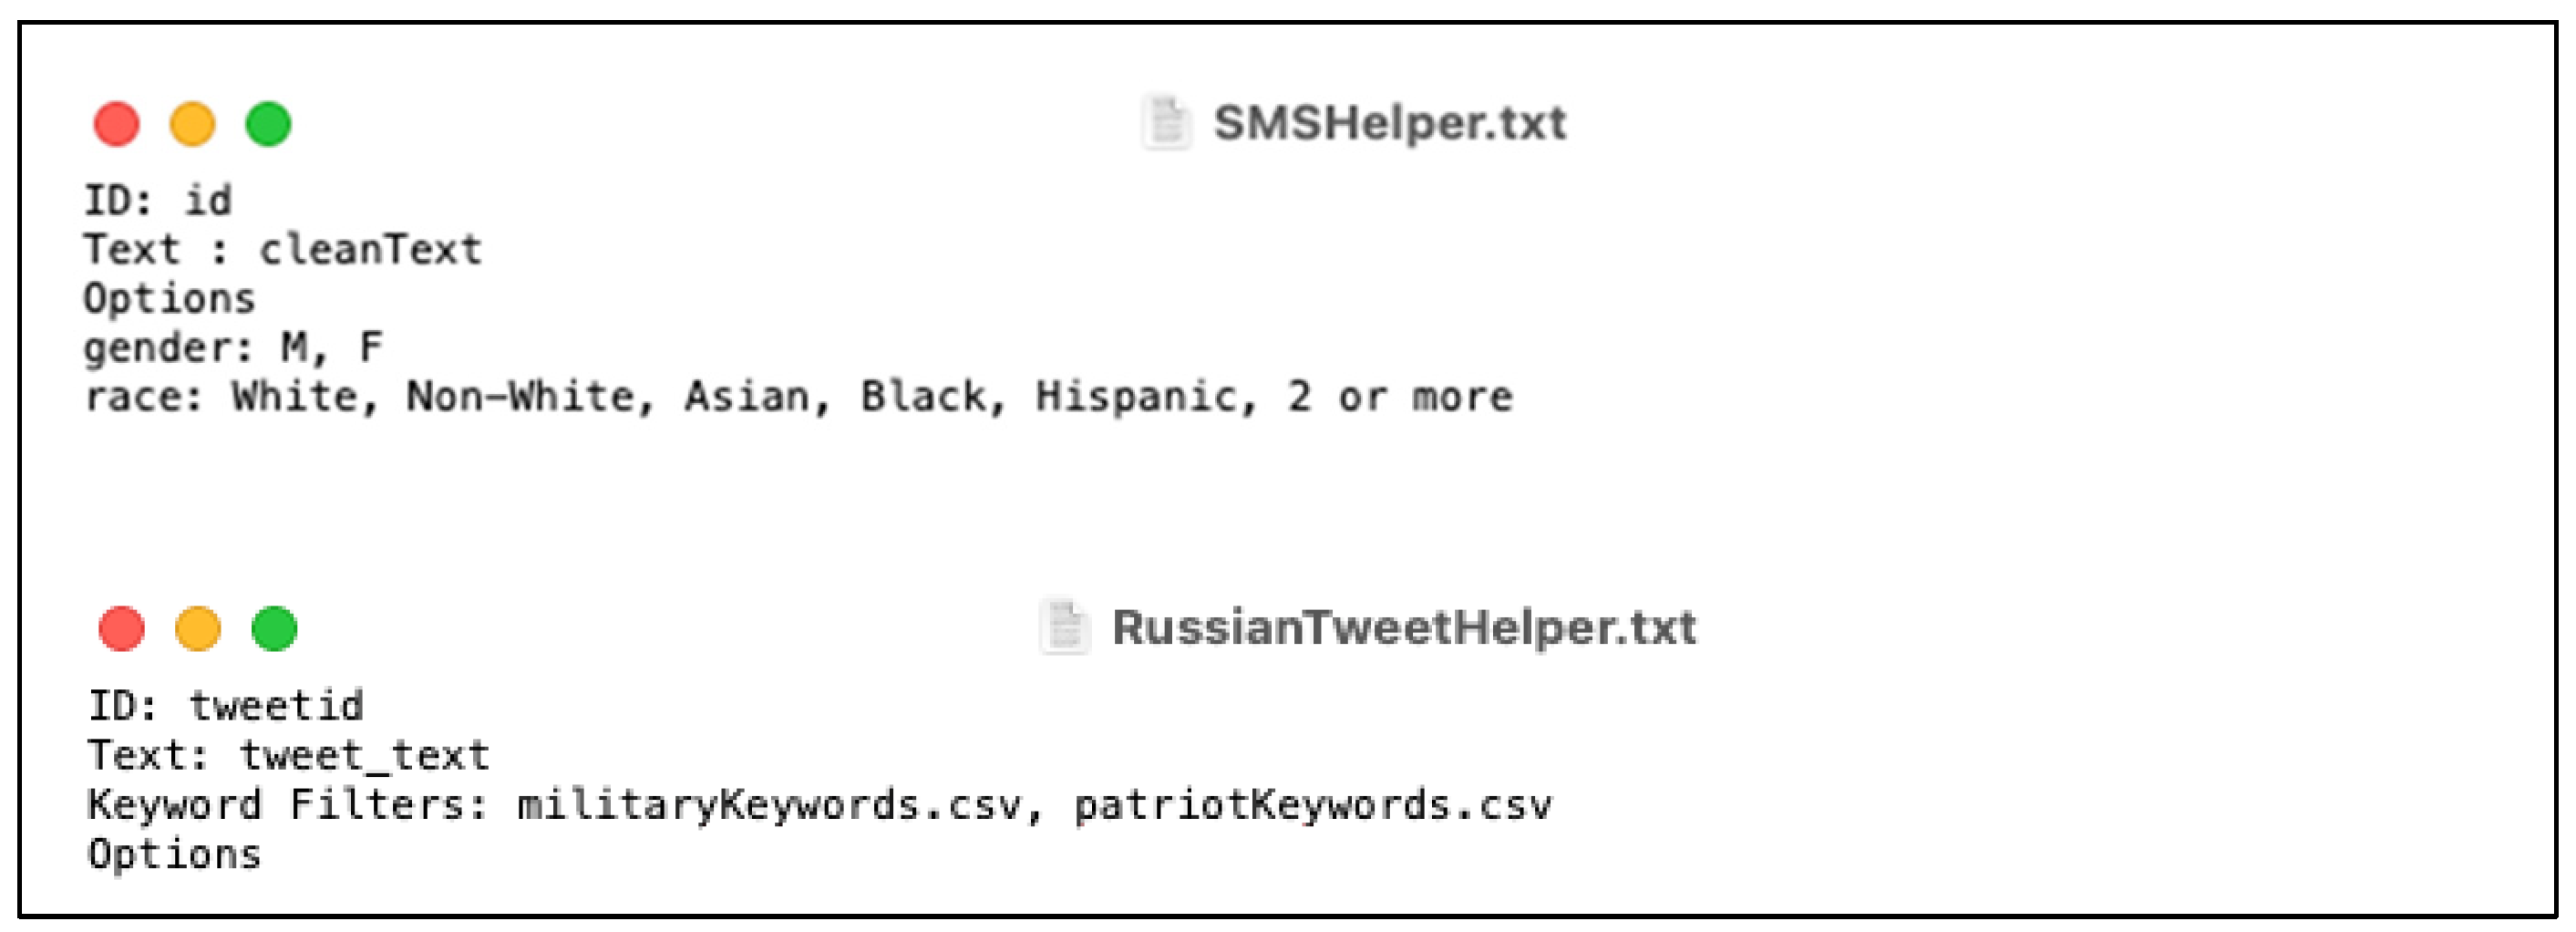
2.2. Data Preparation

TextQ currently requires that the text to be analyzed be stored in a text file in comma-separated values (csv) format, which can be saved directly from Excel and SQL query tools. The use of JSON and XML formats for input is planned. The flexible operation of TextQ requires a second metadata text file. This file specifies the fields containing textual and ID data, as well as any optional filtering fields. Figure 1 shows two examples of parameter files.
The ID and Text fields of the parameter file are required. Two additional fields are available. The SMS Helper in Figure 1 (top) shows the use of TextQ with a file that contains additional columns with nominal data (gender, race). As we will see in the next section, the interface will present the user with the ability to select one or more options in each field. The RussianTweetHelper.txt file (Figure 1, bottom) shows the use of a Keyword Filters parameter. With this option, the user can specify a file containing terms and phrases. The search will be done on the text field (as specified in the parameter file) and only lines (instances) containing these keywords will be used during the analysis phase. Users can also specify words/phrases to exclude from the results within the same file. An example appears in Figure 2. Here the filter file is looking for tweets containing the term “patriot” but is specifically excluding entries related to the New England Patriots football team.
The csv files corresponding to the parameter files in Figure 1 (opened in Excel) for the cyberbullying (top) and Twitter (bottom) data are in Figure 3. Some columns have been hidden for privacy purposes. The reader will notice that the tweet data have many additional fields which are currently unused. Should the analyst wish to begin use of these columns, they can be easily added to the parameter file and no further preprocessing of the text file is required.

2.3. TextQ Interface

TextQ initially presents the user with the option to upload a new dataset or choose and existing one (Figure 4, top). Existing datasets are included with TextQ to demonstrate the purpose and functionality of TextQ to new users. Figure 4 (bottom) shows the dialogue box that is presented to the user for performing analysis on their own dataset. Both the parameter file and the data file must be specified. While TextQ uses a standard English stop list, users are also able to add an additional stop word file for domain specific terms. Furthermore, the interface itself provides information on what a “stop word” is, and how it can be used to fine tune the results.
For example, in a recent application of the tool, TextQ was used to find categories in the National Institutes of Standards and Technologies (NIST) National Initiative for Cybersecurity Education (NICE) list of knowledge, skills and activities for cybersecurity education. Virtually every line began with “Knowledge,” “Skill” or “Activity.” Adding these to an application specific stop list after the initial run allowed the user to more easily obtain a list of bigrams that were useful for their analysis. While knowledge of the domain and task was necessary to determine which bigrams were most pertinent, TextQ identified several themes and ideas that were previously unknown to the users.
After the dataset is specified, the user is presented with the options from the parameter file, as shown in Figure 5. In this case, the user has selected to filter by keyword based on a military term filter. Upon clicking “Load and Filter” the text document is ready for analysis. The filter reduced the number of records to be processed on this relatively small dataset of tweets from 10,000 to 575 without noticeable delays in processing (see Section 3.1 for timing on larger datasets). The user is now ready to begin analyzing the data. For keyword filtering only, the user may choose to invert the keyword filters. This option will result in retention of the instances that were not selected by the filter. This option is particularly useful for comparing data with and without a set of keywords, as demonstrated in Section 3.3.
The selected text is loaded and processed using standard text mining techniques. For example, the text is reduced to lower-case only. All special characters are removed (numbers and alphabetic characters are retained). A standard English language stop word file from nltk is applied. As noted above, the user can also apply a customized stop word list. Additional languages will be supported as users express interest (assuming standard stemming and stop word libraries are available).

3. Results

The output from the analysis of data currently includes three panels—the top 100 list of terms, the top 100 list of bigrams (terms that appear next to each other) and a WordCloud that visually displays the top 100 terms (see Figures 8 and 9). Additional features such as flexibility in the number of terms displayed, ability to produce trigrams vs. bigrams, use of more sophisticated metrics that identify the most important words in the corpus [9], and ability to produce an n-gram WordCloud are in progress and will be very simple to implement due to the flexible architecture of TextQ.
As shown in Figure 6, TextQ employs an object-oriented architecture whereby the data layer resides in a Corpus class, which manages the text mining functions. The TextQMain class manages the overall application flow (as well as help menus) and is supported by two classes which are used to display results, one for tabular data (AditTableWin) and one for images and other visual representations (AditWin). All three visual components support exporting of the results so that the output can be imported into other tools, such as Excel. This architecture makes adding new analyses as simple as adding a function to the Corpus class and modifying TextQ main to run the function and display the results in one of the two result windows.

3.1. Run Time

Unsurprisingly, the run time increases as the size of the dataset increases. However, even a large dataset containing over 1.4 million tweets is processed relatively quickly on a standard laptop computer with competing tasks running. We completed five runs for each task and the average runtime results (in seconds) appear in Table 1. On these data, initial parsing takes around six minutes and each analysis takes less than 3 min on the largest datasets. This level of performance is adequate for standard usage for most organizations.

3.2. Case Study 1—Cyberbullying Collection

Cyberbullying is defined as the use of social media, email, cell phones, text messages, and Internet sites to threaten, harass, embarrass, or socially exclude someone [10,11]. While the anonymity of the Internet can foster cyberbullying from unknown persons, cyberbullying also happens between former friends and acquaintances who have personal knowledge that can be exploited in a cyberbullying event. The audience size afforded by social media contributes to the power imbalance between cyberbullies and their victims, and the ability to cyberbully via SMS or private messages can reduce a victim’s ability to flee to a safer environment. Youth are digital natives who spend increasing amounts of time on Internet connected devices [12] and simply “turning off the phone” is not a viable solution and can lead to further isolation [13].
A three-phase long-term project sought to identify patterns in cyberbullying and its relationship to self-disclosure. The first phase of the study was an online survey, and this was followed by focus group discussions with youth ages 10–19. A preliminary pilot cell phone study with 12 participants was conducted in 2016 to test the viability of tracking text usage from youth. In the third phase, smartphones were deployed to 70 youth, ages 10–14, and all textual activity on the devices was tracked for a full year. The software collected both inbound and outbound SMS (text) messages, and outbound keyboard activity from messaging apps such as Snapchat, FB Messenger, and Instagram.
Over 210,000 text (SMS) messages were collected, and 10,072 of these messages were labeled for use in machine learning algorithms that detect cyberbullying content. Over four percent, or 480 have shown to be instances of cyberbullying (4.8% of the messages). Previous work has shown that machine learning algorithms can reach levels of recall over 75% for detecting the presence of cyberbullying content across platforms [14]. In the current case study, we are interested in determining if there are gender or racial differences in the terms used in SMS messages by youth (we have not yet analyzed the keylogger messages). The filtering options in TextQ make this comparison much easier to manage (see Figure 7), by allowing the user to select the gender and race that should be used for analysis. The options pane is populated automatically from the parameter file. The pane in Figure 7 corresponds to the image on the left in Figure 1.
Figure 8 shows the WordCloud comparison for males (n = 88,597 messages) vs. females (n = 122,004 messages). The WordCloud is based on the 100 most frequently occurring terms. These images demonstrate that there was little difference in the communication patterns of Males vs. Females, with the top 4 most frequent words the same (ok, u, im, get) and the top 25 almost identical (with slight differences in frequency ranking). The WordClouds and term frequency lists lead to the conclusion that, at least on the surface, there is little difference in the most common terms by our male and female participants. The bigram analysis was uninteresting, with the top bigrams occurring in only 251 and 310 messages, for males and females, resp. This simple case study shows the amount of information that can be gleaned from even a basic analysis. The difference between messages from white participants (n = 118,738 messages) and non-white participants (n = 92,620) were likewise unremarkable, with significant overlap in the top 100 terms, and very little repetition of bigrams. Thus, we concluded that there are no differences in the text communication patterns across racial/ethnic or gender axes in the participating youth. This preliminary analysis using TextQ prevented hours of detailed manual work that would be required to reach the same conclusions.

3.3. Case Study 2—Tweets from Russian Influence Operations

In October 2018, Twitter released data from 4383 accounts that were believed to be related to potential influence operations. The initial accounts were attributed to state linked information operations in Russia and Iran. In a spirit of transparency, these accounts, including meta data and content, were made available for public scrutiny. Twitter states [15]: “It is our fundamental belief that these accounts should be made public and searchable so members of the public, governments, and researchers can investigate, learn, and build media literacy capacities for the future.” Updates to the dataset have been made available from time to time in the ensuing years.
In March 2021, a dataset containing 1,480,712 English-language tweets was downloaded from the Twitter archive by Weinberg and Dawson who performed a content analysis of the data to determine if there was specific targeting of US military personnel as part of these influence operations [16]. If such content was discovered, further analysis was required to determine the difference in the content when compared to messages that did not appear to be targeted toward members of the military. During this project, a keyword filtering file was manually created to track military-related posts. This file contains 412 terms (words and phrases) which can be used to identify military content, and an additional four that produced false positives and needed to be removed from analysis.
TextQ was used to analyze the tweets using keyword and inverted keyword filtering based on the term list provided. The top 25 terms and bigrams for each set are shown in Figure 9. Here we see a lot of difference in the terms used—with military terms appearing more frequently (unsurprising) but also terms like blacklivesmatter and dontgetfooledagain. By contrast neither term appears in the top 100 terms or bigrams list when the inverted military filter is used. On the other hand, there is a significant discussion of political figures, especially Donald Trump and Hillary Clinton, and of anti-Islamic sentiment in both partitions of the dataset.
The “7nOLureTo01fEYYDfIE56glTOUtkVOuVcse3olzlxM” term is used in a series of extremely anti-Islamic tweets that reference a particular user id on twitter via what is known as an “at mention” where someone who posts a message can direct it at a particular Twitter user. An example of one such message is:
@7nOLureTo01fEYYDfIE56glTOUtkVOuVcse3olzlxM=: Today’s Lesson On Islam: #IStandAgainstIslam Information 12 00508 i001 #StopImportingIslam Information 12 00508 i002 #JihadistNOTWelcome Information 12 00508 i003 #SayNoToIslam Information 12 00508 i004#DeathCult
With the TextQ tool, this strange term was immediately brought to our attention, and although we initially thought it was corrupted data, a simple search showed it to be an important aspect of the influence campaign. In future releases, users will be able to highlight terms and search the source content for more information.

4. Discussion and Conclusions

In this article we describe the first release of a new text analysis tool, TextQ, that can provide functionality to non-technical users for the analysis of social media and other textual data. This tool has already been shown to provide valuable insights on two social media analysis tasks—understanding youth communication and Russian influence operations. TextQ streamlined the research process and removed the uncertainty which can occur when researchers provide their own implementation, constantly reinventing the wheel. Unlike existing tools, TextQ is designed for the broadest possible use, and the lowest barrier to entry, allowing companies, research groups and other organizations to work toward a greater understanding of the vast amounts of textual data that are created daily.
As noted throughout the article, future features are already in progress, and will be driven largely by the needs and desires of the community of users. When considering future enhancements, the authors will focus first and foremost on achieving our commitment to open access and broad applicability of TextQ in a variety of environments. Planned future enhancements include: more flexible options for filtering and saving of results of the analyses, more sophisticated tools for text analysis (as needs warrant), additional language support, and, eventually, assisted labeling and integration of machine learning technology within TextQ.

Author Contributions

Conceptualization, A.E.; methodology, A.E.; software, M.S. and E.I.; validation, A.E. and D.W.; resources, A.E. and D.W.; data curation, A.E. and D.W.; writing—original draft preparation, A.E.; writing—review and editing, A.E., M.S., E.I. and D.W.; supervision, A.E.; project administration, A.E.; funding acquisition, A.E. All authors have read and agreed to the published version of the manuscript.

Funding

TextQ development and the Russian influence operations research was funded in part by the by Office of Naval Research. The cyberbullying material is based upon work supported by the National Science Foundation under Grant Nos. 0916152, 1421896, and 1812380. Any opinions, findings, and conclusions or recommendations expressed in this material are those of the author(s) and do not necessarily reflect the views of the Office of Naval Research, the National Science Foundation, the United States Naval Academy, or the United States Department of Defense.

Institutional Review Board Statement

Not applicable.

Informed Consent Statement

Not applicable.

Data Availability Statement

Not applicable.

Acknowledgments

The authors would like to thank the New War Research Symposium for their helpful feedback on an early demonstration of the TextQ interface. We appreciate Twitter’s willingness to release data for research purposes. We also thank our cell phone study participants. Finally, appreciation goes to colleagues and students at the United States Naval Academy and Queens College, for their support of this important work.

Conflicts of Interest

The authors declare no conflict of interest. The funders had no role in the design of the study; in the collection, analyses, or interpretation of data; in the writing of the manuscript, or in the decision to publish the results.

References

  1. Marr, B. How much data do we create every day? The mind-blowing stats everyone should read. Forbes, 21 May 2018; 1–5. [Google Scholar]
  2. Statista. Available online: https://www.statista.com/statistics/195140/new-user-generated-content-uploaded-by-users-per-minute/ (accessed on 5 November 2021).
  3. quanthub. Available online: https://quanthub.com/data-scientist-shortage-2020/ (accessed on 5 November 2021).
  4. Alexa, M.; Zuell, C. Text Analysis Software: Commonalities, Differences and Limitations: The Results of a Review. Qual. Quant. 2000, 34, 299–321. [Google Scholar] [CrossRef]
  5. Wiechmann, D.; Fuhs, S. Concordancing software. Corpus Linguist. Linguist. Theory 2006, 2, 107–127. [Google Scholar] [CrossRef]
  6. Diesner, J. ConText: Software for the Integrated Analysis of Text Data and Network Data. 2014. Available online: http://jdiesnerlab.ischool.illinois.edu/calls/ICA2014/Diesner_ICA_2014.pdf (accessed on 5 November 2021).
  7. LIWC. Available online: http://liwc.wpengine.com/ (accessed on 5 November 2021).
  8. Welbers, K.; Van Atteveldt, W.; Benoit, K. Text analysis in R. Commun. Methods Meas. 2017, 11, 245–265. [Google Scholar] [CrossRef]
  9. Kim, S.W.; Gil, J.M. Research paper classification systems based on TF-IDF and LDA schemes. Hum. Cent. Comput. Inf. Sci. 2019, 9, 30. [Google Scholar] [CrossRef]
  10. Willard, N.E. Cyberbullying and Cyberthreats: Responding to the Challenge of Online Social Aggression, Threats, and Distress; Research Press: Champaign, IL, USA, 2007. [Google Scholar]
  11. Olweus, D. Bullying at School: What We Know and What We Can Do; Blackwell: Oxford, UK; Cambridge, MA, USA, 1993. [Google Scholar]
  12. Lenhart, A.; Smith, A.; Anderson, M.; Duggan, M.; Perrin, A. Teens, Technology, and Friendships. 2015. Available online: https://www.pewresearch.org/internet/2015/08/06/teens-technology-and-friendships/ (accessed on 5 November 2021).
  13. Edwards, L.; Kontostathis, A. Reclaiming Privacy: Reconnecting Victims of Cyberbullying and Cyberpredation. In Proceedings of the Reconciling Privacy with Social Media Workshop, Held in conjunction with the 2012 ACM Conference on Computer Supported Cooperative Work, Seattle, WA, USA, 11–15 February 2012. [Google Scholar]
  14. Edwards, A.; Demoll, D.; Edwards, L. Detecting Cyberbullying Activity Across Platforms. In Proceedings of the 17th International Conference on Information Technology–New Generations (ITNG 2020), Las Vegas, NV, USA, 5–8 April 2020; Springer: Cham, Switzerland; pp. 45–50. [Google Scholar]
  15. Twitter Transparency. Available online: https://transparency.twitter.com/en/reports/information-operations.html (accessed on 5 November 2021).
  16. Weinberg, D.; Dawson, J. Military Narratives and Profiles in Russian Influence Operations on Twitter. 2021. Available online: https://osf.io/preprints/socarxiv/b9a2m/ (accessed on 5 November 2021).
Figure 1. Sample parameter files for text messages and tweets.
Information 12 00508 g001
Figure 2. Demonstrating use of the Keyword Filtering option, also saved in CSV format.
Information 12 00508 g002
Figure 3. Input files (in Excel), which allows saving in CSV format.
Information 12 00508 g003
Figure 4. Beginning the process—specifying the input data sets.
Information 12 00508 g004
Figure 5. Options panel presented to the user.
Information 12 00508 g005
Figure 6. Software Architecture for TextQ.
Information 12 00508 g006
Figure 7. TextQ Options Pane.
Information 12 00508 g007
Figure 8. Term analysis in cyberbullying data Male vs. Female.
Information 12 00508 g008
Figure 9. Term analysis from Twitter Russian Influence Operation.
Information 12 00508 g009
Table 1. Run time results (in seconds) on different size input data sets.
Test DescriptionNumber SelectedTime to LoadTime to ParseTerm AnalysisBigram Analysis
10,000 Tweets *5751.8960.0020.0910.092
10,000 Tweets *—Inverted94241.8980.0261.2271.352
Full Twitter Dataset * (~1.5 million tweets)111,584351.7840.42715.74616.553
Full Twitter Dataset * Inverted1,274,528359.5384.776167.225178.918
Cyberbully SMS Data (Males only)88,5970.4600.14311.92712.152
Cyberbully SMS Data (Females only)122,0040.4750.21116.35816.467
* Using the militaryKeywords.csv filter file.
Publisher’s Note: MDPI stays neutral with regard to jurisdictional claims in published maps and institutional affiliations.

