2. Related Work
This section goes over literature work that is related to (and also helped to build) the proposed My-AHA software platform. The section starts by providing a brief overview on platforms and software architectures that also (or could be used to) target frailty. Then, it presents different solutions concerning My-AHA’s main components, namely the multi-platform middleware, DSS and personal dashboard centred on the detection of early signs of health decline.
It is worth mentioning that our goal in this section is not to provide a detailed analysis of the related work concerning platforms, software architectures, middlewares, DSSs, and dashboards. Instead, we focus on the relevance of healthy and active ageing solutions, and how My-AHA stands out in the case of frailty early detection and prevention.
There are different works specifically on ICT-based platforms and software architectures that focus on the early detection of frailty to help caregivers and seniors [
10,
11,
12] or that could be used to target frailty [
13,
14]. Abbasi et al. [
10] evaluate the acceptability of tools that identify signs of frailty based on their literature review, including the PRISMA-7 (a tool composed of yes/no questions), a 4-m walk test to assess the gait speed and the calculation of the electronic frailty index (eFI) score (it required the training of an assistant to calculate it for every patient). Their conclusions show that less disruptive and more informative tools are highly accepted among caregivers. This is in line with the approach of My-AHA in combining data from different platforms to aid caregivers. It is worth noting that some of the considered tools are not very scalable since they require trained personnel to go over the gait analysis and the eFI score calculation individually for each case, for instance.
Lunardini et al. [
11] approaches the frailty detection on a home-based monitoring with the aim to support the independent living of the elder at home. To achieve this, the proposed MoveCare project used a subset of sensors, each one specialized to monitor a specific frailty sign, from weight values, low activity, questionnaires, grip strength etc. To detect unintentional weight loss, which can cause older adults to be more vulnerable, it used a specific model of a Beurer scale. To measure maximal grip strength, a smart anti-stress ball was designed and implemented specifically for this project. To obtain gait parameters it used a smart pair of shoe soles. The project also had some sensorized daily-use objects and an exergame component using the Nintendo Wii to monitor the daily activity of the patient. Another way of early identifying cognitive decline is through a series of spot questions that are asked to the elder. The main drawback of MoveCare is that it is tightly coupled with the specific sensor models used, and it could clearly benefit from a solution such as My-AHA by having access to more data from different platforms to more reliably identify frailty.
Zacharaki et al. [
12] developed a system with the ambition to identify the most important signs of frailty and apply the insight and expertise for self-management and prevention. The FrailSafe architecture is based on a Big Data architecture for IoT. It is somewhat similar, component wise, with the My-AHA approach in that it has a dashboard to provide controls on the system to the doctors and data visualization to the patients. And it also has a back-end component with a data analysis module and a decision support system module. The difference when compared to My-AHA is that as the architecture relies on a gateway to resolve the communications between the sensors and the system, and therefore the system needs to know how to communicate with every sensor, which may affect scalability given the different sensors interfaces. This lack of an abstraction layer that enables easier integration with other platforms could be complemented with our My-AHA solutions.
There are also few architectures in the Internet of Things (IoT) domain that could be used to address frailty. Alreshidi and Ahmad [
13] go over several types of architecture that can be used for IoT-based systems, and that could serve as basis for our work. Within the context of the authors classification, My-AHA architecture can be labelled as a “Reference Architecture for IoTs” as it provides generic and high-level (abstract) solutions that can be instantiated with specialized architectures such as IoTs devices. My-AHA decided to go with this type of architecture with the purpose of providing a reference framework (our Java SDK) that serves as a template with documented guidelines that allow high-level abstraction between systems. Also, this sort of architecture approach allows us to focus less in IoT connection, its quirks, and lack of standards, being more focused on creating a multi-platform middleware system, that integrates already existing platforms and is coupled with a with a DSS and a dashboard targeting sustainable ageing.
Manogaran et al. [
14] proposes the use a Big Data architecture model for health care applications. The architecture consists of using IoT sensors to monitor the patient health condition, and the obtained data is continuously stored on the cloud. To protect the data, the cloud component also includes a security layer. Once stored, the monitoring system runs an algorithm with a prediction model for heart disease. By using a Big Data model, the proposal is a data-driven system, focusing on having a distributed scalable database, data analysis, and efficient data processing and storage. This approach also comes with its drawbacks, such as complex implementation and deployment and needing frequent maintenance. On the other hand, a middleware-oriented solution, like the one used in My-AHA, focuses on adding several layers of abstraction, defining a set of guidelines for the easy deployment of new platforms to the system.
Regarding middleware for health monitoring, Alonso et al. [
3] considered the benefits of employing middleware solutions for Structural Health Monitoring (SHM) by providing a simple interface to access the underlying resources to simplify development. The study analysed several types of middleware, reviewing which requirements and desirable features a SHM system should have. The study recognises that adding a middleware layer provides an abstraction layer to ‘hide’ the complexity of handling the particularities of each hardware platform, such as wireless communications, power management, and low-level programming. This simplifies the integration with the new IoT devices and Wireless Sensor Networks (WSNs) by offering a high-level programming model for the development team. This aligns with My-AHA’s feature of providing a seamless way to gather data from different sources (i.e., platforms) to support the early identification and prevention of declines.
A hardware middleware device that handles the communication with the available sensors to retrieve the requested data was developed by Georgi et al. [
15]. In this solution, the user requests a specific data type, not a sensor model; then the middleware retrieves the available devices for the requested data type. Thereafter a discovery service is launched to connect and retrieve data from the list of supported sensors. The solution also stores the credentials provided by the application’s developer for each sensor using a credentials manager component and supports sensors from some manufacturers. This application stores measured data in a local database and then displays them on a chart. While this solution relates to My-AHA from the API abstraction perspective, the main difference resides that it focuses on the sensors, and not in the platforms as proposed by My-AHA.
A middleware framework for the Health Information System (HIS) of National Taiwan University Hospital was created by Ko et al. [
16]. This framework is a Service-Oriented Architecture which integrates heterogeneous platforms and databases while using the HL7 standard to cover all the data exchange. The HL7 standard defines how information is packaged and communicated from one party to another, setting the language, structure, and data types required for seamless integration between systems. Hence, the transition from the legacy system into the proposed system should be effortless. The middleware is divided in three components: HL7 Message Modules, Central WebService, and Sub-System Handlers. The first module is used to format all the messages exchanged across systems. The Central acts as the front-end of the data exchange. It receives and parses a received message and then dynamically loads and invokes correspondent sub-routines defined in the Sub-system component. The authors reported that the middleware was serving approximately 8000 outpatients a day. This solution is more focused on its middleware framework and not on the whole ecosystem of software when compared to My-AHA that focuses on bridging the gap between the technology, the data, and the users themselves.
Hofer et al. [
17] suggested an interoperable personal health system to monitor the obstructive pulmonary disease. The architecture follows a server-client RESTful architecture with a publish/subscribe mechanism running on Android devices. The mobile device acts as a data collector with a continuous connection to the sensor and broadcasting the fetched data to a remote server for storage and later processing. A multi-sensor medical device is used to collect the data and measure several vital signs such as blood oxygenation, heart rate, skin temperature, and steps count. With all the obtained information, a machine learning component then calculates new models and refines them regularly. The server then pushes the refined models to the clients using a publish/subscribe mechanism. This paper does not focus on features such as abstraction and a modular solution, focusing more on supporting one device featuring multiple sensors which connect to the phone. This approach diverts from the one applied in My-AHA, where the focus was on the seamless integration of solutions already available on the market.
With a rapidly growing health care sector, research has tried to apply well-known decision support systems in the field of medical care. Focus rested on clinical applications that support finding an accurate diagnosis, improving treatment, or optimizing medication. For example, Roshanov et al. [
18] studied the effectiveness of DSS systems employed in a clinical environment for chronic disease management. Several studies to determine if a DSS can improve the processes of chronic care, including diagnosis, monitoring and treatment, are presented. This study reviewed 55 trials from 71 publications. The results show that 87% of those trials measured system impact on the process of care. Furthermore, 65% of those demonstrated impact on patient outcomes and 31% showed a clear benefit on measures such as health-related quality of life, rates of hospitalisation, unscheduled care visits, and a host of disease-specific clinical outcomes. This work shows not only the importance of a DSS, but also provides insights that the more data is available to a DSS, the better it shall aid in prevention and treatment. This explains our choice of proposing the My-AHA platform that works on top of a different sourced data and builds relevant information to mitigate decline.
Until now, few DSS approaches tried address problems arising with aging societies. Personalized analysis and interventions are often missing. In addition, most systems monitor instead of advising or preventing the elderly decline. One example is the USEFIL platform [
19], which aims to support active and healthy aging and even analyses data in a personalized fashion but fails to go beyond monitoring to alert users when recognizing abnormalities or health decline in the data.
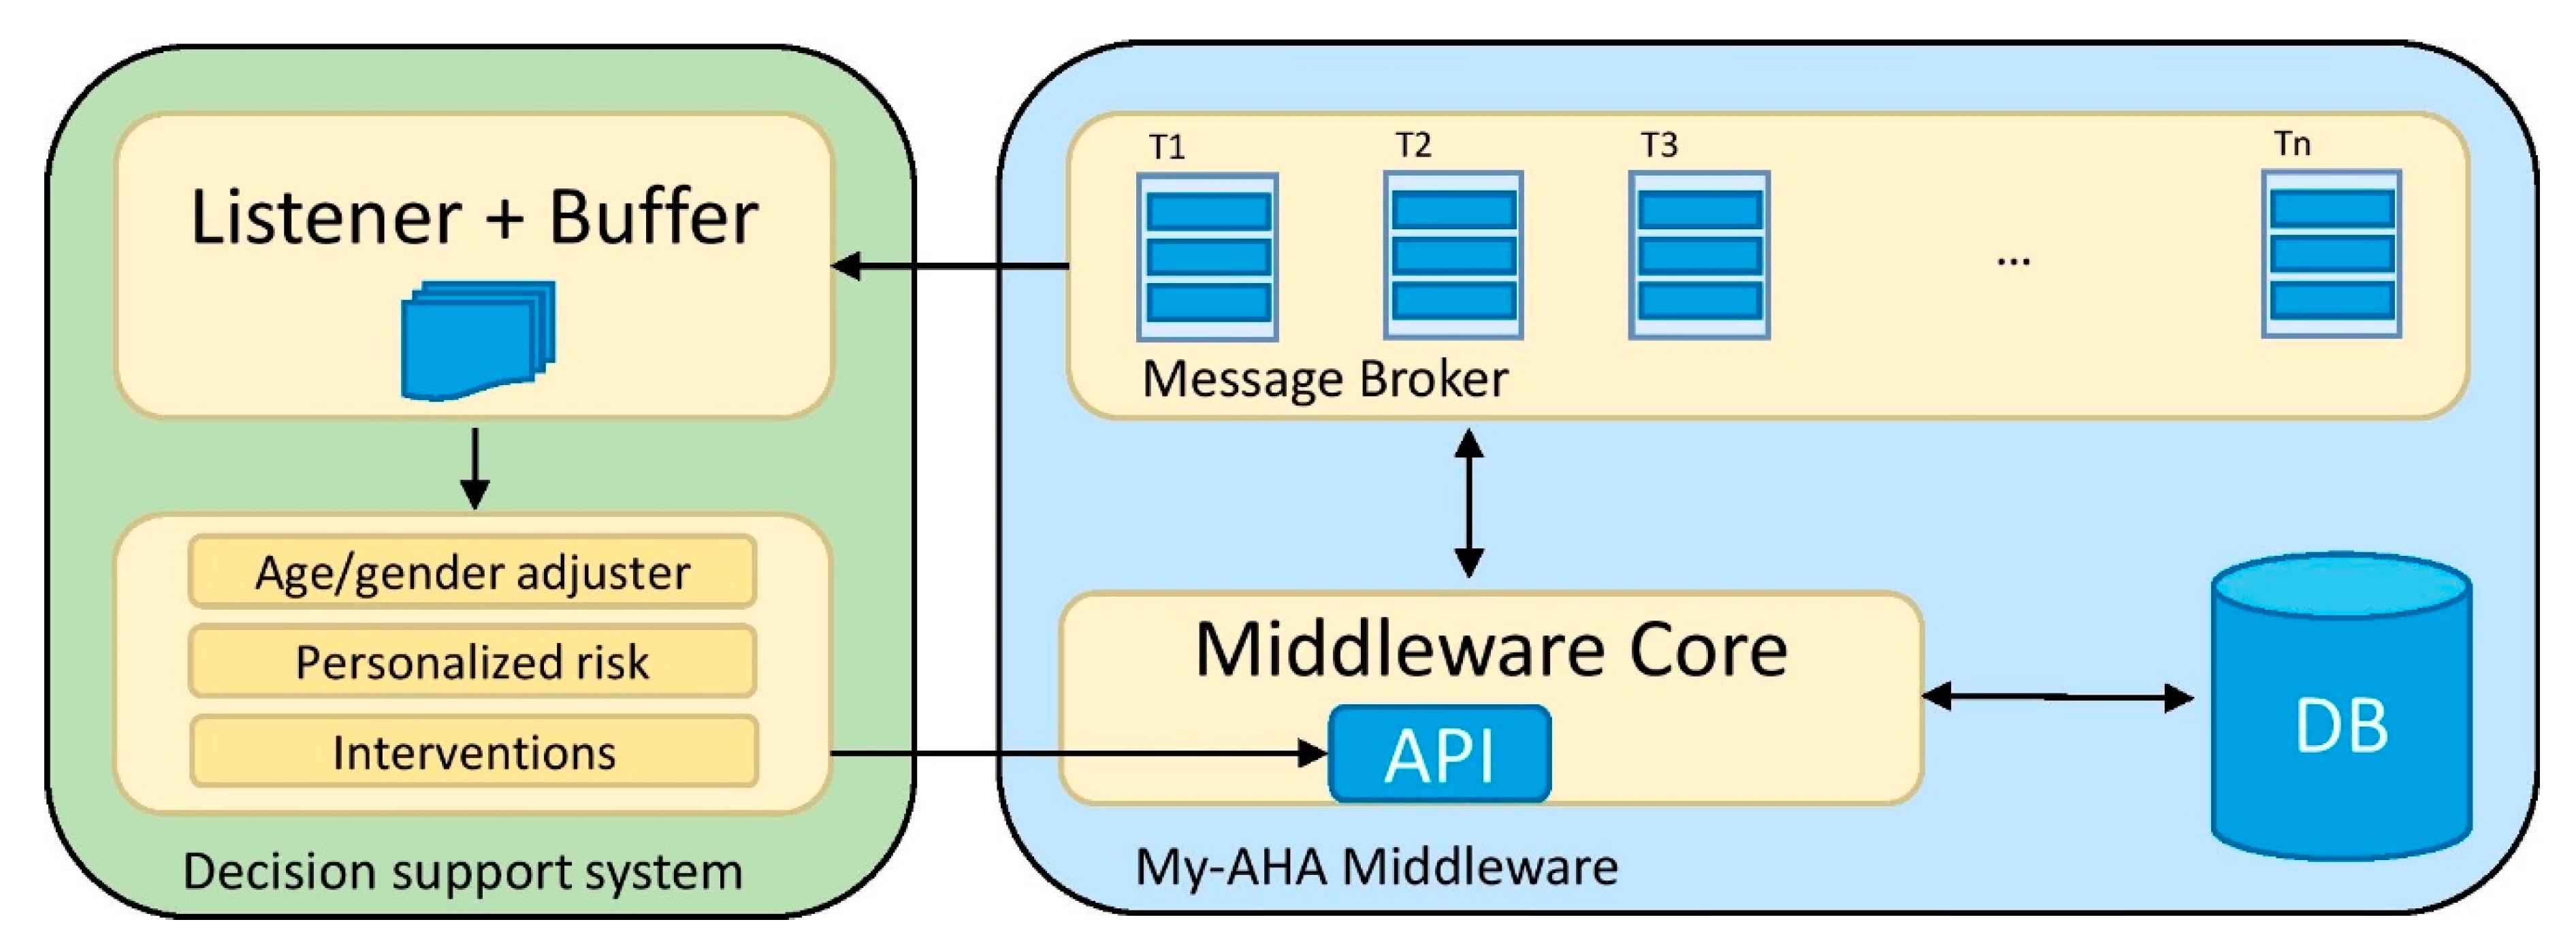
In what concerns DSS for health management, Billis et al. [
20] DSS’ monitors health assessment indicators on an ongoing basis, calculating the risk assessment and the seniors’ progression of depressive symptoms, alerting the caregivers with useful information and allowing a swift adjustment on the patients’ treatment accordingly. In an European project, Orte et al. [
21] invented a multi-domain solution with a DSS to support elderly and their active aging. While an evaluation is not given, the focus lies on the methods and algorithms of the proposed DSS. Static and dynamic information from wearables and the environment is collected to provide so-called coaching plans. Users are able to choose from a list of proposed activities. While the first solution lacks any interventions plans, the seconds does not provide any detailed information about the current health status to predict risk factors. Here, My-AHA addresses both problems by implementing a more complete system.
In addition, focused approaches based on one modality have been realized as well. Billis et al. [
22] implemented a system with the smart collection of TV usage patterns to enable active and healthy aging. Several health-related problems, like depressive symptomatology such as loss of interest in daily activities, depressive mood, sleep deprivation and total depression levels, could be associated with TV watching time. Although interesting findings and a helpful platform could be realized, My-AHA aims to provide more support by invoking a multimodal approach using different platforms.
From the perspective of the dashboard, My-AHA is a modular system, connecting in a complex platform multiple actors and platforms. One potential barrier for elderly users of the My-AHA platform is the technological layer. It is therefore imperative that the end user interface of the platform will be designed to help elderly users to adopt it and to receive stimuli toward healthy practices and active aging.
Even though the appropriation is defined as an individual process, it can also be cooperative. Considering that the collaborative appropriation is recognized as an important success factor [
23], it would be useful to address it on My-AHA. The relationship between the subject and the healthcare professional (HP) is an object of study of several disciplines (medicine, anthropology, sociology, psychology) in order to understand the internal dynamics of the interaction and figure out if and how they can influence the results of the therapy [
24]. This type of relationship can be established on three objectives: (1) to create a good interpersonal relationship; (2) exchange information; and, (3) make decisions about the type of treatment [
24].
Some authors focus specifically on the role played by the HP across the various contexts of interaction. In fact, Lussier and Richard [
25] argue that the HP attitude towards the interaction is strongly influenced by other aspects, such as the disease characteristics reported by the subject (i.e., the type of disease and its severity); the physical location where the interaction takes place (i.e., the surgery, the medical office, the emergency room, the patient’s home); and finally by the actors involved.
The interaction between the HP and patient can affect the results of the therapy. In particular, communication style can influence the results of the treatment even after some time away from the first consultation. Effective communication between the subject and HP can facilitate the process of care through indirect pathways, encouraging mutual understanding and the reinforcement of the therapeutic alliance, resulting in a greater treatment adherence. Effective verbal communication provides visible benefits for both parties: empathy from the HP enhances the emotional status of the patient in a positive loop promoting the psychological well-being through the reduction in negative emotions and an increase in positive emotions. Additionally, it fosters motivation about continuing the treatment.
The cooperative appropriation, based on relationship and cooperation among primary and secondary users, as well as included systems and platform, implies organizational preconditions that the design of the system has to address. In a socio-technical perspective, the system and its technical features must be deeply interrelated with the organizational and social context. This requires a holistic approach able to bring comprehensive, empathic understanding of users’ needs.
The theoretical models previously considered highlight the importance of the practice and the experience for the appropriation. The quality of the experience and the usability are core bricks that ground on the Human Factors methods and techniques.
The Human Centred Approach, historically set as a fundamental approach of Human Factors, Ergonomics and Human-Computer Interaction, is nowadays core in innovation design also [
26,
27,
28,
29]. The collection and understanding of the users’ needs and the context of their activities is the knowledge base and the main reference for each design and development phase. A set of tools and methodologies allow for gaining insights and understanding about every end users’ and stakeholders’ perspective (including mind-sets and background experiences) and the overall context. This approach sets the priority on the effectiveness and usability of the solution, ensuring sustainable processes and sense of co-ownership that serves as a base for building a long-term period end-user engagement. The Human Centred Approach is commonly adopted in the majority of research, design, and development in the field of tele-healthcare, tele-medicine, and tele-rehabilitation. The effectiveness of remote systems dedicated to the health depends not only on technology, but also on a careful design of the human—computer interaction [
30].
In My-AHA, when designing innovative services, systems, and applications for the healthcare domain, it has been useful to adopt a user-centred approach, with particular attention on the usability of the system (ISO 9241/11) to be designed and evaluated in consideration of real users and everyday contexts of use. A usable system will be pleasant and easy to use, able to foster a functional alliance with the users that will experience accuracy, efficiency, satisfaction.
The above assumptions have provided useful input to bring into the My-AHA system some elements of a working appropriation strategy. It has been important to bear in mind both the technological and socio-organizational constraints [
31]. From one hand, technology should help to decrease the workload of the individual. For instance, My-AHA dashboard supports the primary users in managing possible specific risks, following personalized activity plans; for the HP, they receive support in patient management and prescribe wider and personalized activity plans. On the other hand, it is important to be aware that technology increases the complexity of the interaction (Norman, 1988) due to mediation and remoted interaction, leading to a modification of the relational styles and procedures embedded in the clinical process.
Another design challenge has consisted in the clash between the needs and mental models of all targeted users that differ per age, expertise (on both the health domain and technology), country, and other variables. The system particularly works with the knowledge gap between the HP and primary users, including the so-called non-technical skills [
32], products of experience that are difficult to export into the digital environment.
Considering these assumptions, the My-AHA dashboard provides an effective communication environment, inspired by real interactions and successful practices of the HPs and end users. Moreover, the system exploits the strategies and features of all the My-AHA platforms, aiming at stimulating and reinforcing proactivity and positive behaviour in their target.
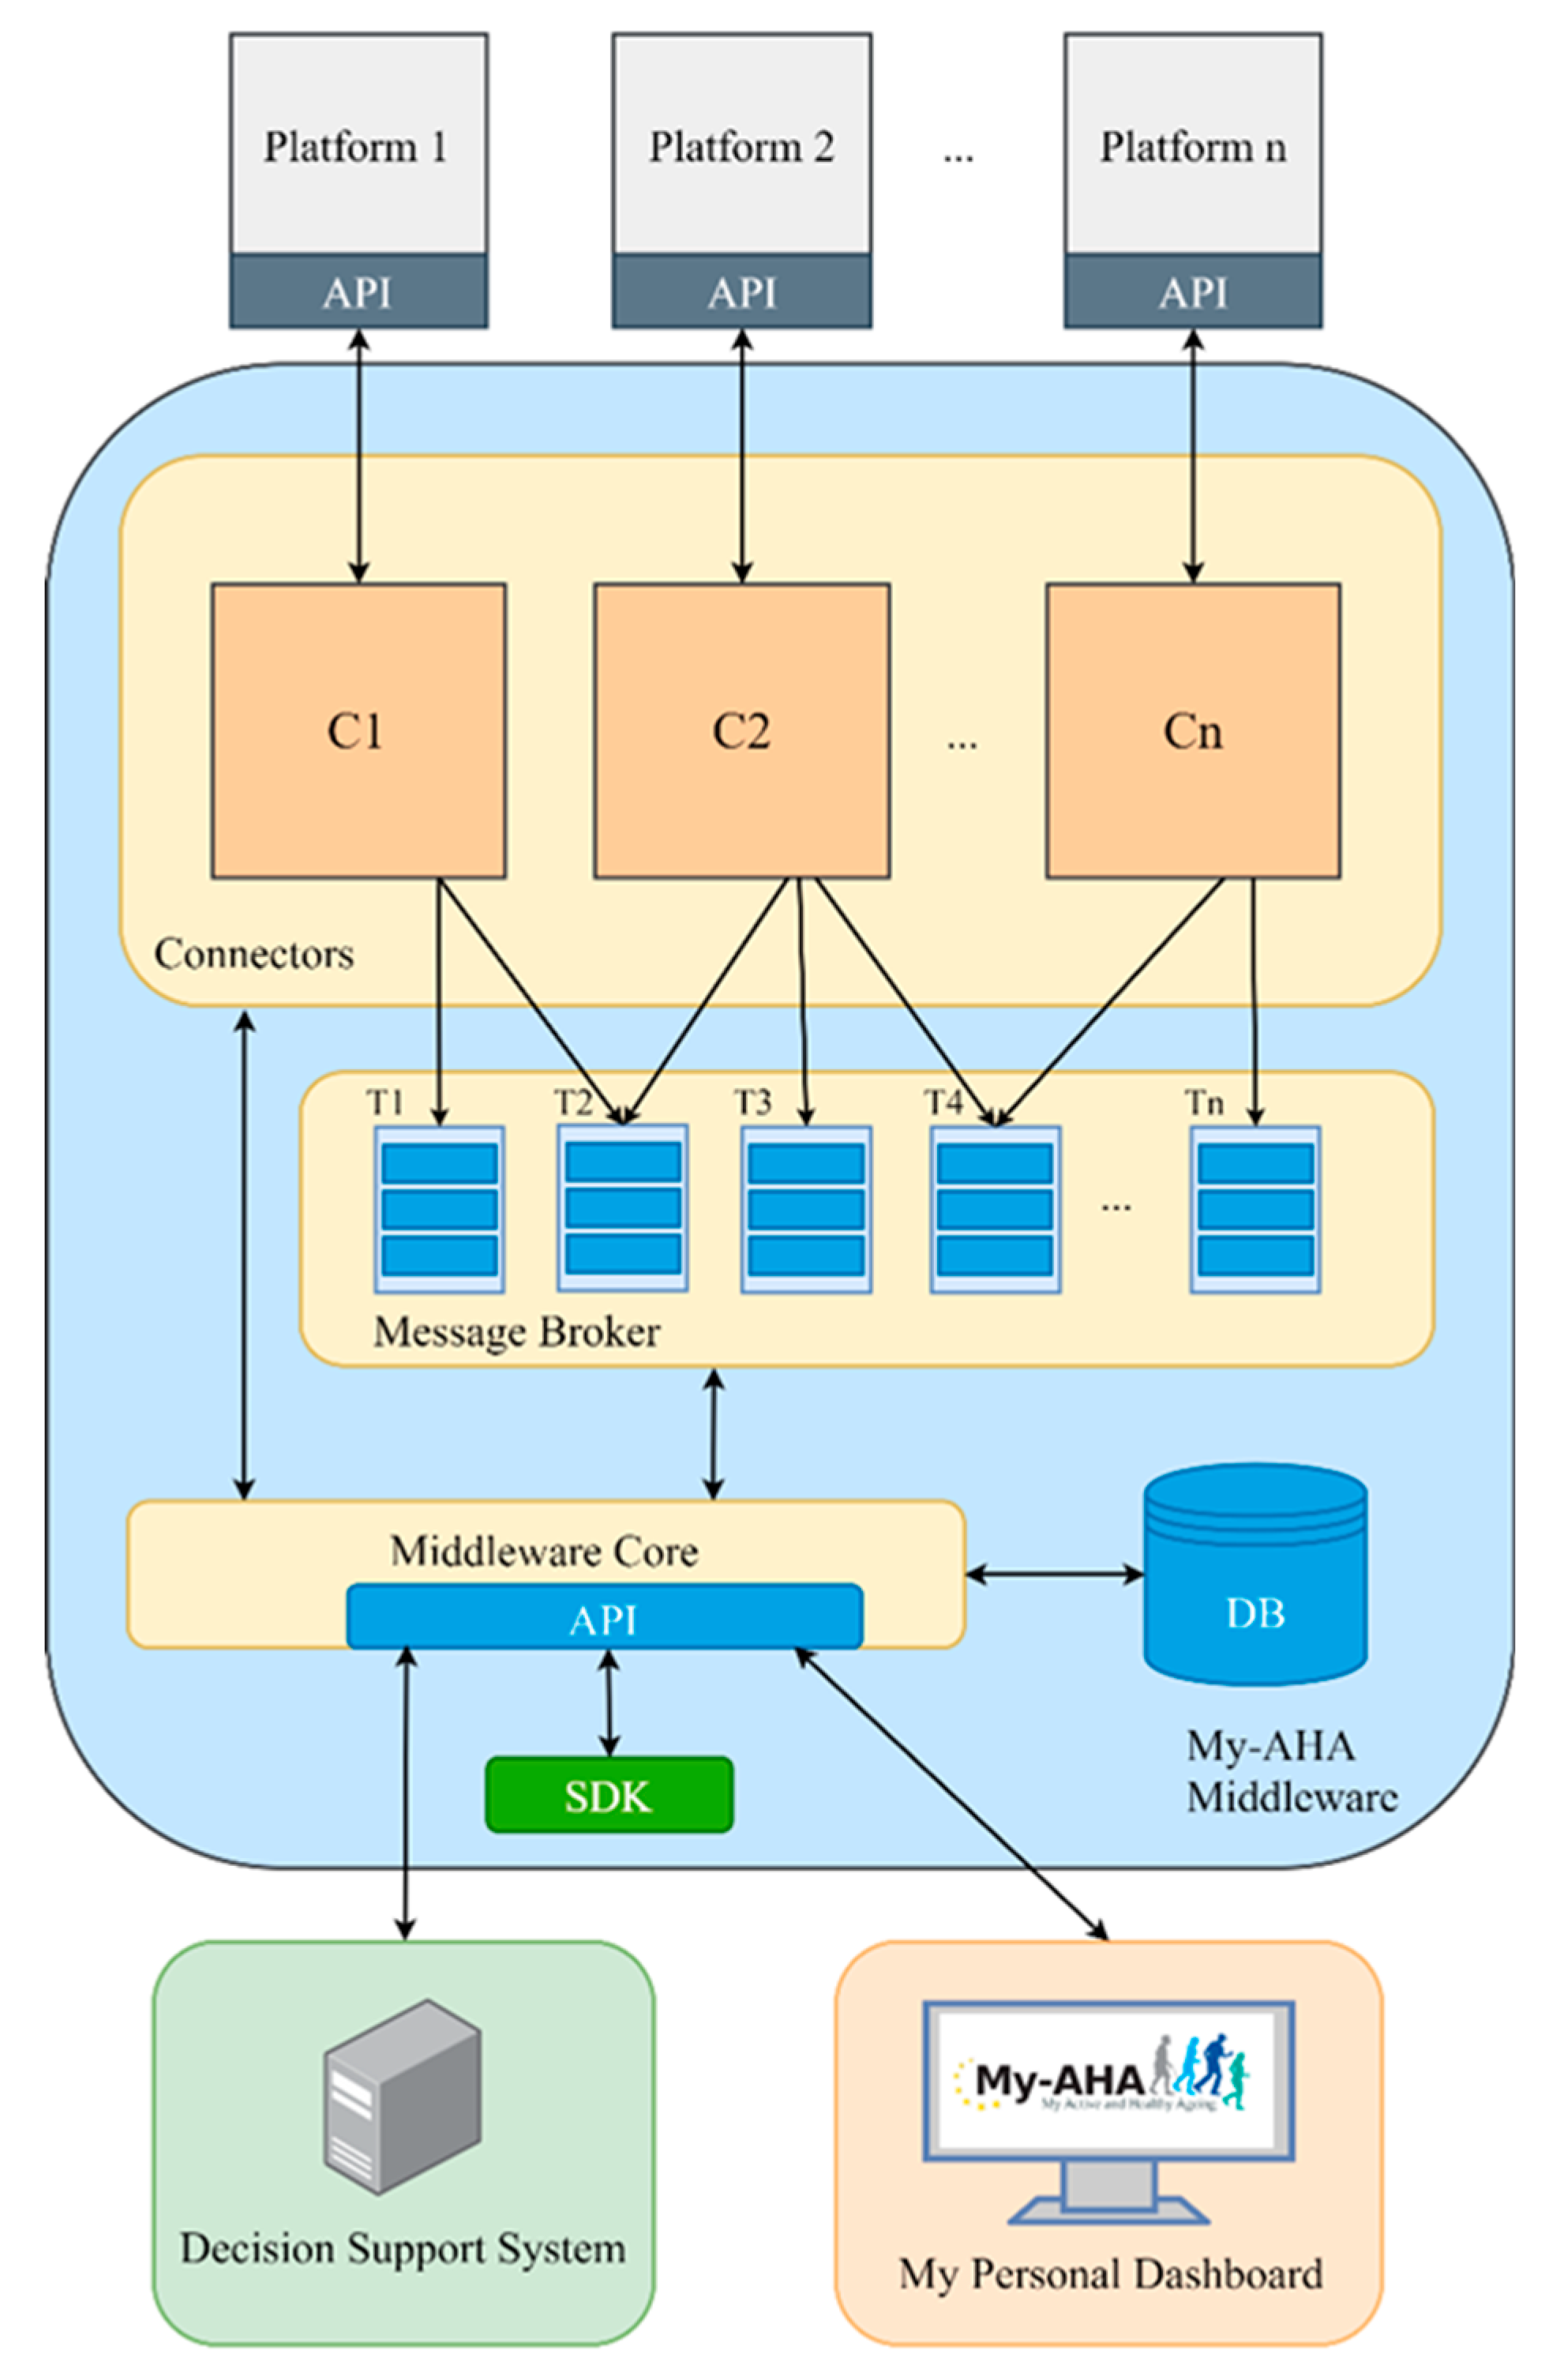
Looking at these platforms, software architectures, middlewares, DSSs, and dashboards, one can see that My-AHA’s solution is not focused on the sensors/end-devices (or set thereof) from which we can get data. It rather focuses on providing the means to integrate different healthy and active ageing platforms (cf.,
Section 4) regardless of (i) the type of sensor/end-device they have (proprietary or not); (ii) the measurements they perform, and (iii) their specific goals. The My-AHA software platform’s novelty (further detailed in
Section 3) relies on seamlessly combining data from multiple commercially available platforms (i.e., through API’s abstraction) and providing straightforward access to a variety of metrics. Moreover, it opens the possibility of these metrics for being post-processed into relevant information, which in our application scenario include the detection of cognitive, physical, social, psychological declines, but could be easily adapted for a different scenario.
Finally, My-AHA proposal differs from the analysed works as, besides having all the mentioned characteristics, it also provides a Java SDK to enable smooth and seamless integration of external entities with our proposed software platform speeding up this integration process. Another unique feature is the provision of methods that allow post-processing of measurements, even from external entities. Such methods allow the integration of systems such as the advanced DSS with functionalities to allow early frailty risk detection and intervention (i.e., prevention) and a platform targeted to the interface with the users which offers a dashboard where they can interact with the system in a simplified way.
4. Frailty Use Case
Frailty is a progressive process of increasing vulnerability, predisposing to functional decline and, finally, leading to death. It consists in the loss of functional homeostasis, which is intended as the potential for the individual to resist disease without loss of function. Nevertheless, frailty can be perceived from different domains (i.e., cognitive, physical, social, psychological), and My-AHA focuses on detecting changes on such domains by determining levels of frailty to help caregivers and the seniors themselves improve their current condition [
38].
To fulfil the main requirement of supporting for early risk detection and intervention in the frailty use case, several additional components and API methods were added beyond the core of the described My-AHA software platform.
4.1. Inclusion of Additional Metrics
Since the goal of the use case is to detect and prevent frailty using a multi-dimensional approach early, we needed to obtain the subject’s data from a wide variety of domains. The list of domains includes Activity Monitoring (e.g., daily activity tracking including steps taken, distance walked, etc.), Fall Risk (e.g., history of recent falls and/or the risk of falling again including the factors leading to this), Physical (e.g., weight, height, blood pressure, etc.), Nutritional (e.g., macronutrients of what the subjects are eating), Social (e.g., social activities or details of the subject, such as, owning a pet, smoking, early retirement, etc.), Cognitive (e.g., scores in cognate tests), Emotional (e.g., prior depressions), and Sleep (e.g., sleeping time and quality).
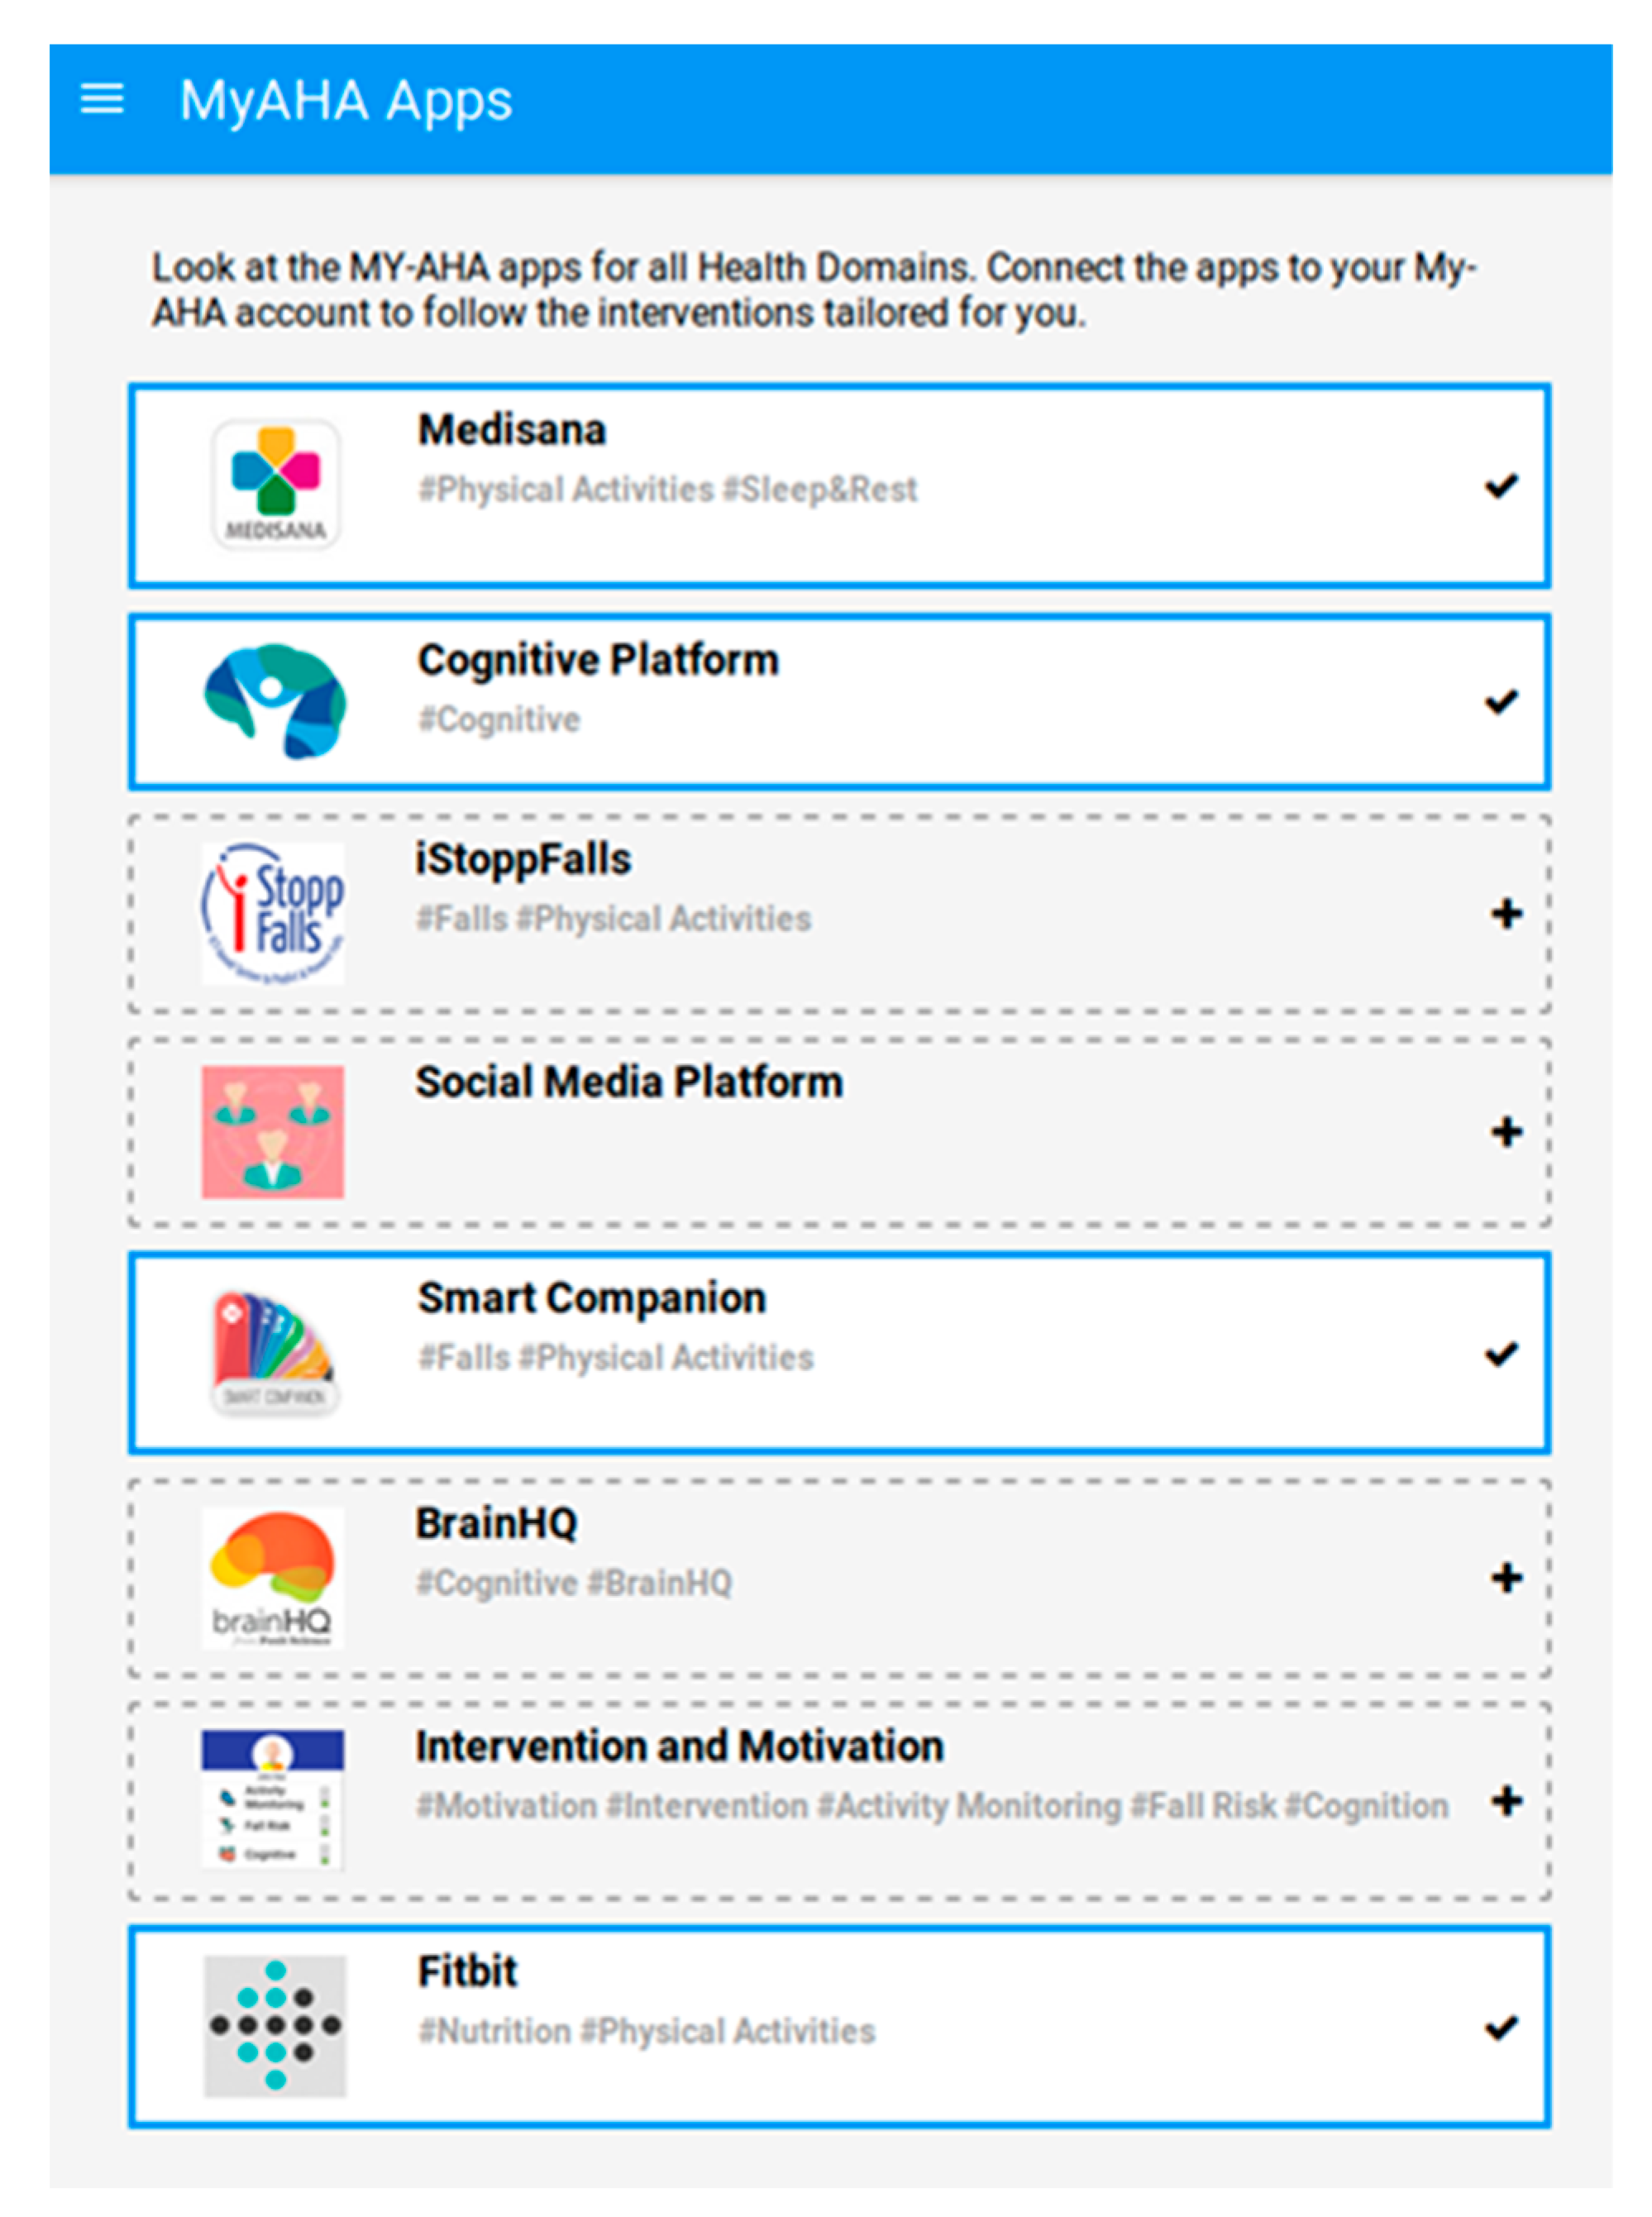
Currently, My-AHA can fetch data from the following platforms: Smart Companion, an application developed by Fraunhofer Portugal AICOS that besides other features includes an advanced activity tracker and fall risk predictor [
39]; VitaDock [
40] by Medisana that provides through a vast set of sensors a wide variety of data: activity (e.g., steps, distance, and energy) and sleep tracker, blood pressure, pulse, blood glucose, insulin, carbohydrates, body weight, body temperature, oxygen saturation; CognHome provides scores and all the metadata related with cognitive games; iStoppFalls [
41] provides activity data and fall risk scores resultant from the exercises and games played with the platform; Fitbit [
42] provides macronutrients data from food logging application and activity data registered by the Fitbit activity tracker.
My-AHA allows connection to platforms that encompass a set of sensors instead of connecting to an individual sensor directly. This opens the possibility to not only integrate additional devices (which may bring different measurements that were not considered before) but also provides more reliable measurements by connecting different devices which may offer some redundancy. An example of such a solution was the case of the sleep tracker. The initially selected sensor was commercially discontinued. Since we were already connecting our middleware to the VitaDock platform [
40] by Medisana, it was straightforward to include the ViFit Activity-Tracker [
43], which besides the desired sleep tracker also brought in the same package an alternative for an activity tracker.
As already described, one of the main concerns during the conception and development of My-AHA software platform was its modularity, since it would allow for easy replacement of platforms. An example of this was the replacement of the initially selected solution for nutrition recommendation and food logging. The users would use this platform to register what they were eating, and we could later retrieve the nutritional data from the registered food. However, the company providing this platform has ceased activity, and we had to find a replacement for this type of data provider. Taking advantage of the connectors’ modular capability, we could create a new connector targeting Fitbit [
42], implementing their APIs for authentication and data handling, and keep retrieving the same nutritional data from a different platform.
A similar situation also happened with the inclusion above of Fitbit. It was initially included as a replacement for Nutrition logging, but since some of the subjects already had activity trackers from Fitbit, with a reduced effort a connector was included to fetch the Activity Tracking data from Fitbit.
With this inclusion, besides widening the range of platforms available on the My-AHA ecosystem, we also provide redundancy, as the data retrieved from Fitbit can also be retrieved from Smart Companion and Medisana. So, one user might not have all the platforms available but can have at least one, increasing the data collection and its availability. Likewise, in a situation where the user has all these devices, the data retrieved from each one is tagged with its origin, and later it can be used for comparisons between the different data providers.
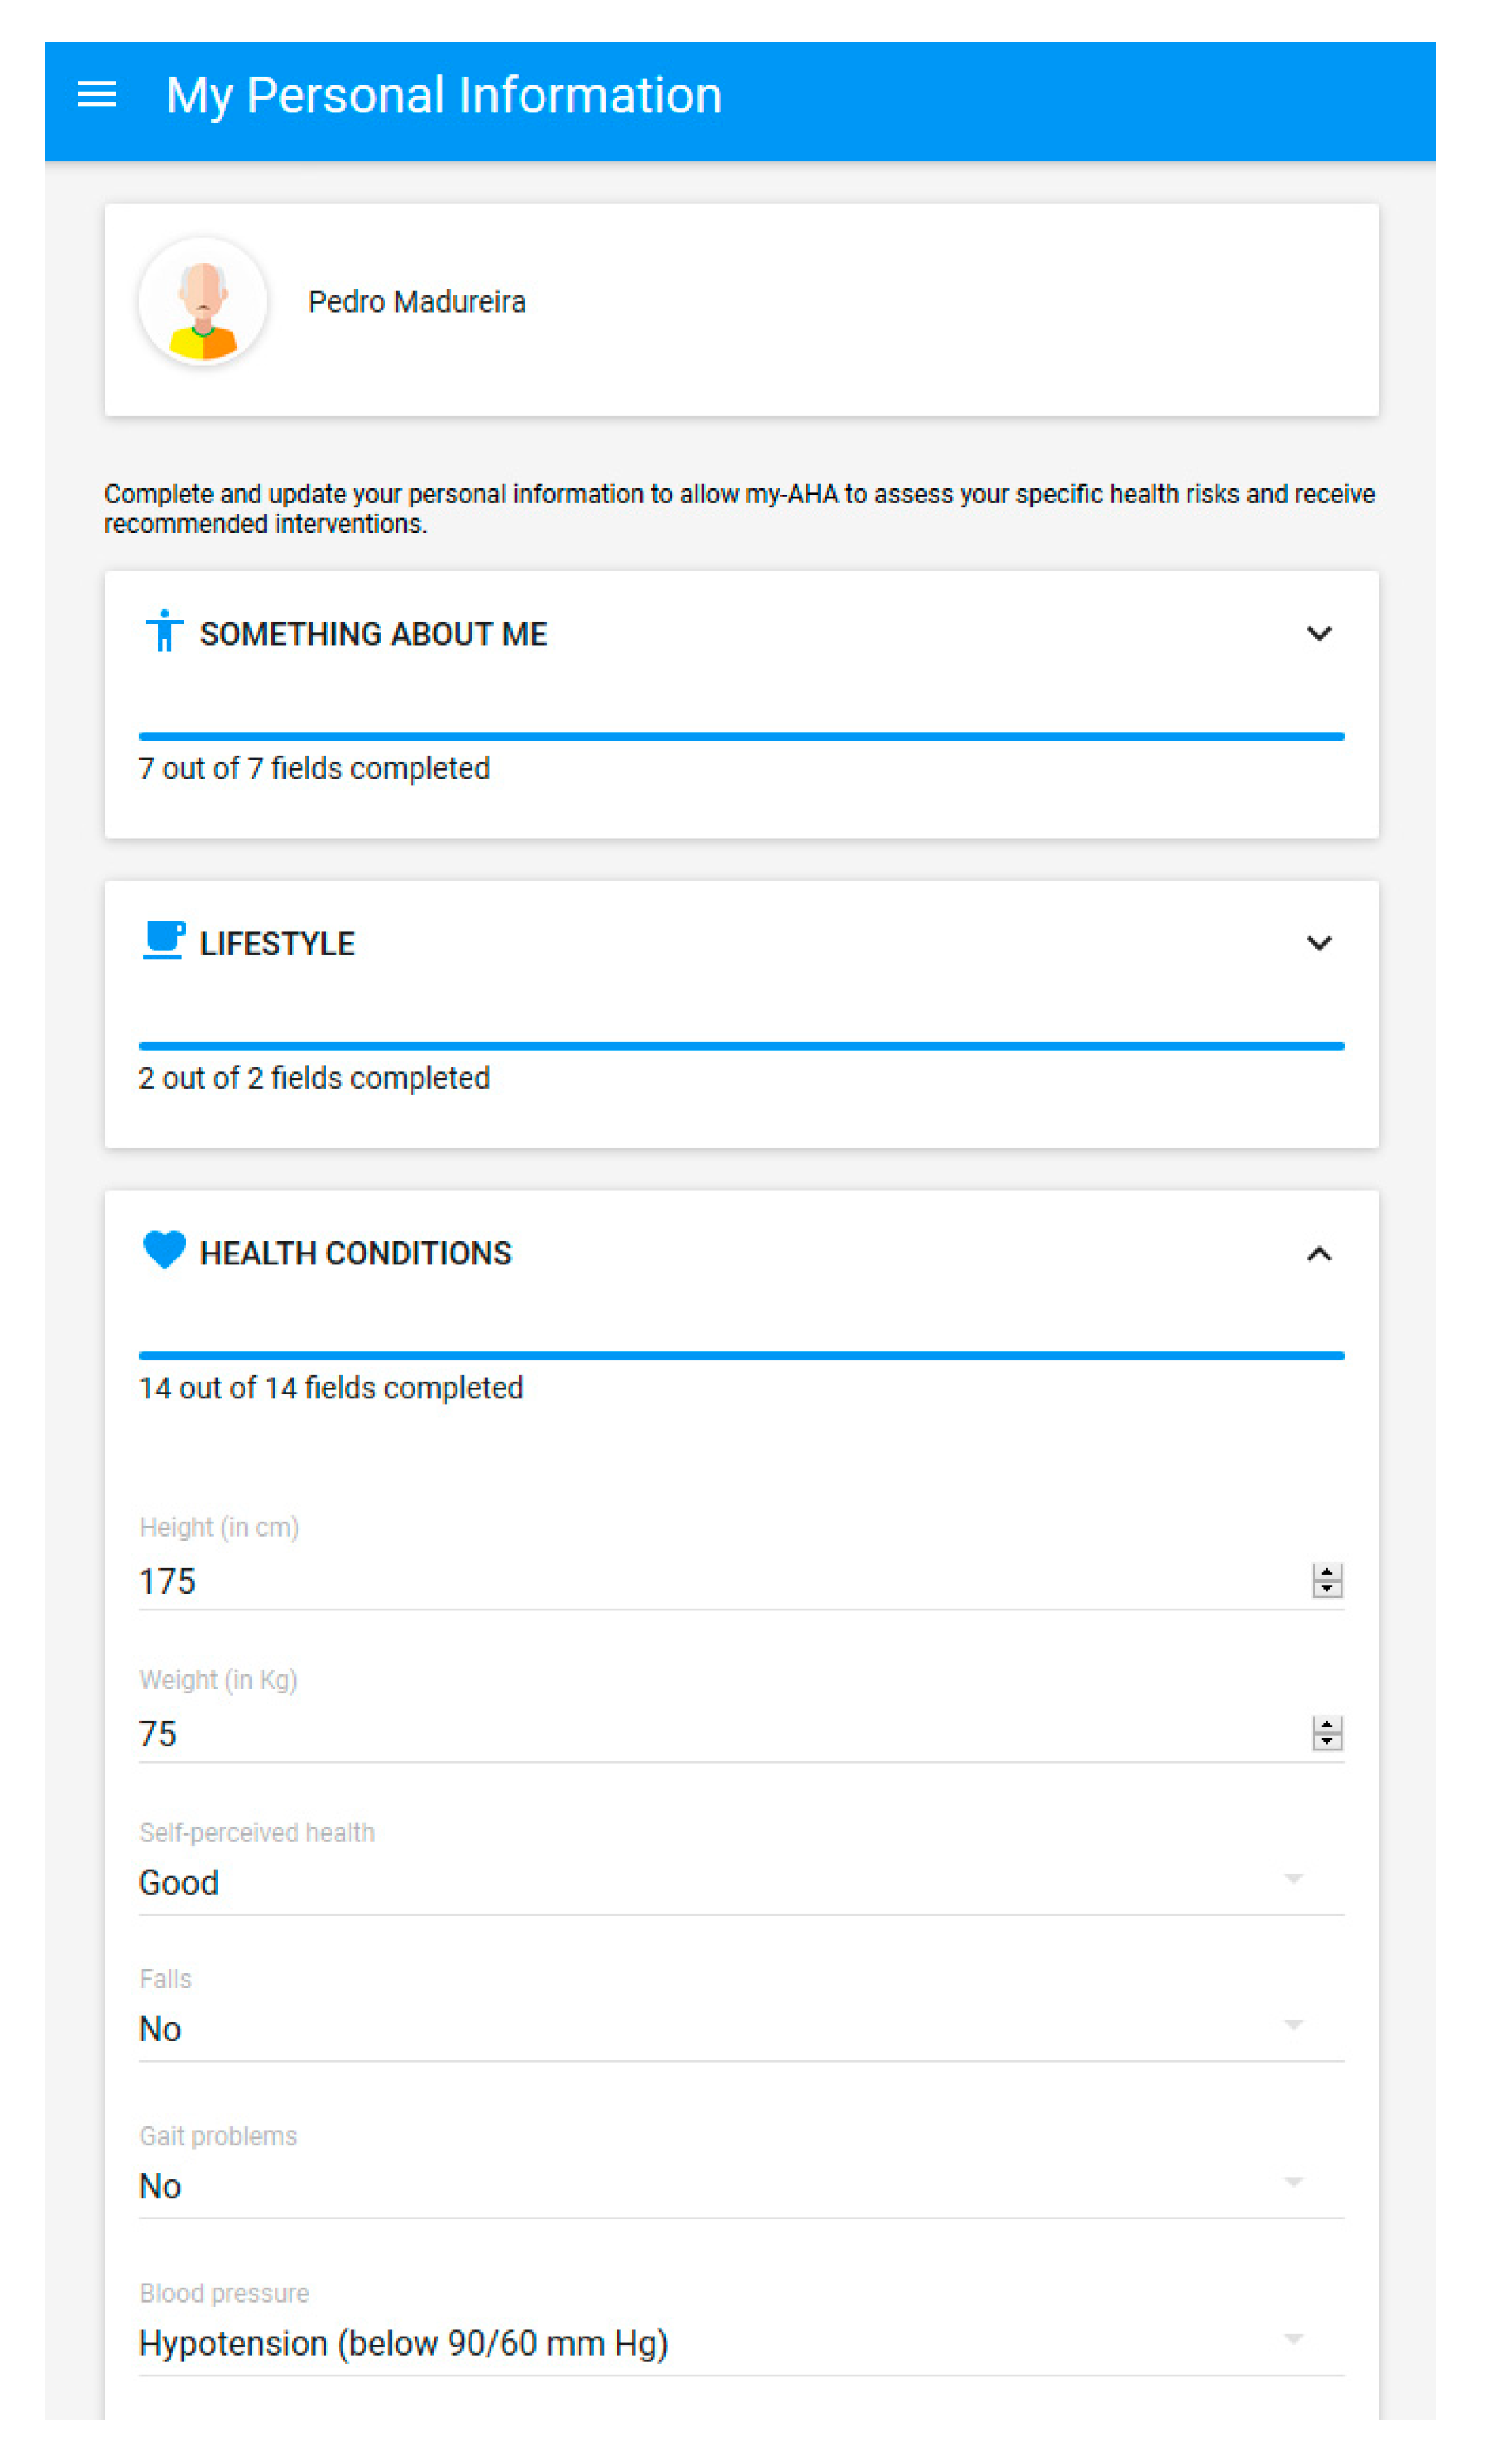
Since there is also data that cannot be automatically retrieved through sensors (e.g., years of school, early retirement, etc.), it was also essential to include a mechanism for integrating self-reported data. For this purpose, the users can access questionnaires in the dashboard, which they can fill in with their responses. These answers are also converted into measurements (e.g., early withdrawal from school can potentially contribute to an increase in the risk of cognitive frailty) to further enhance the calculation of the frailty indexes for the individual.
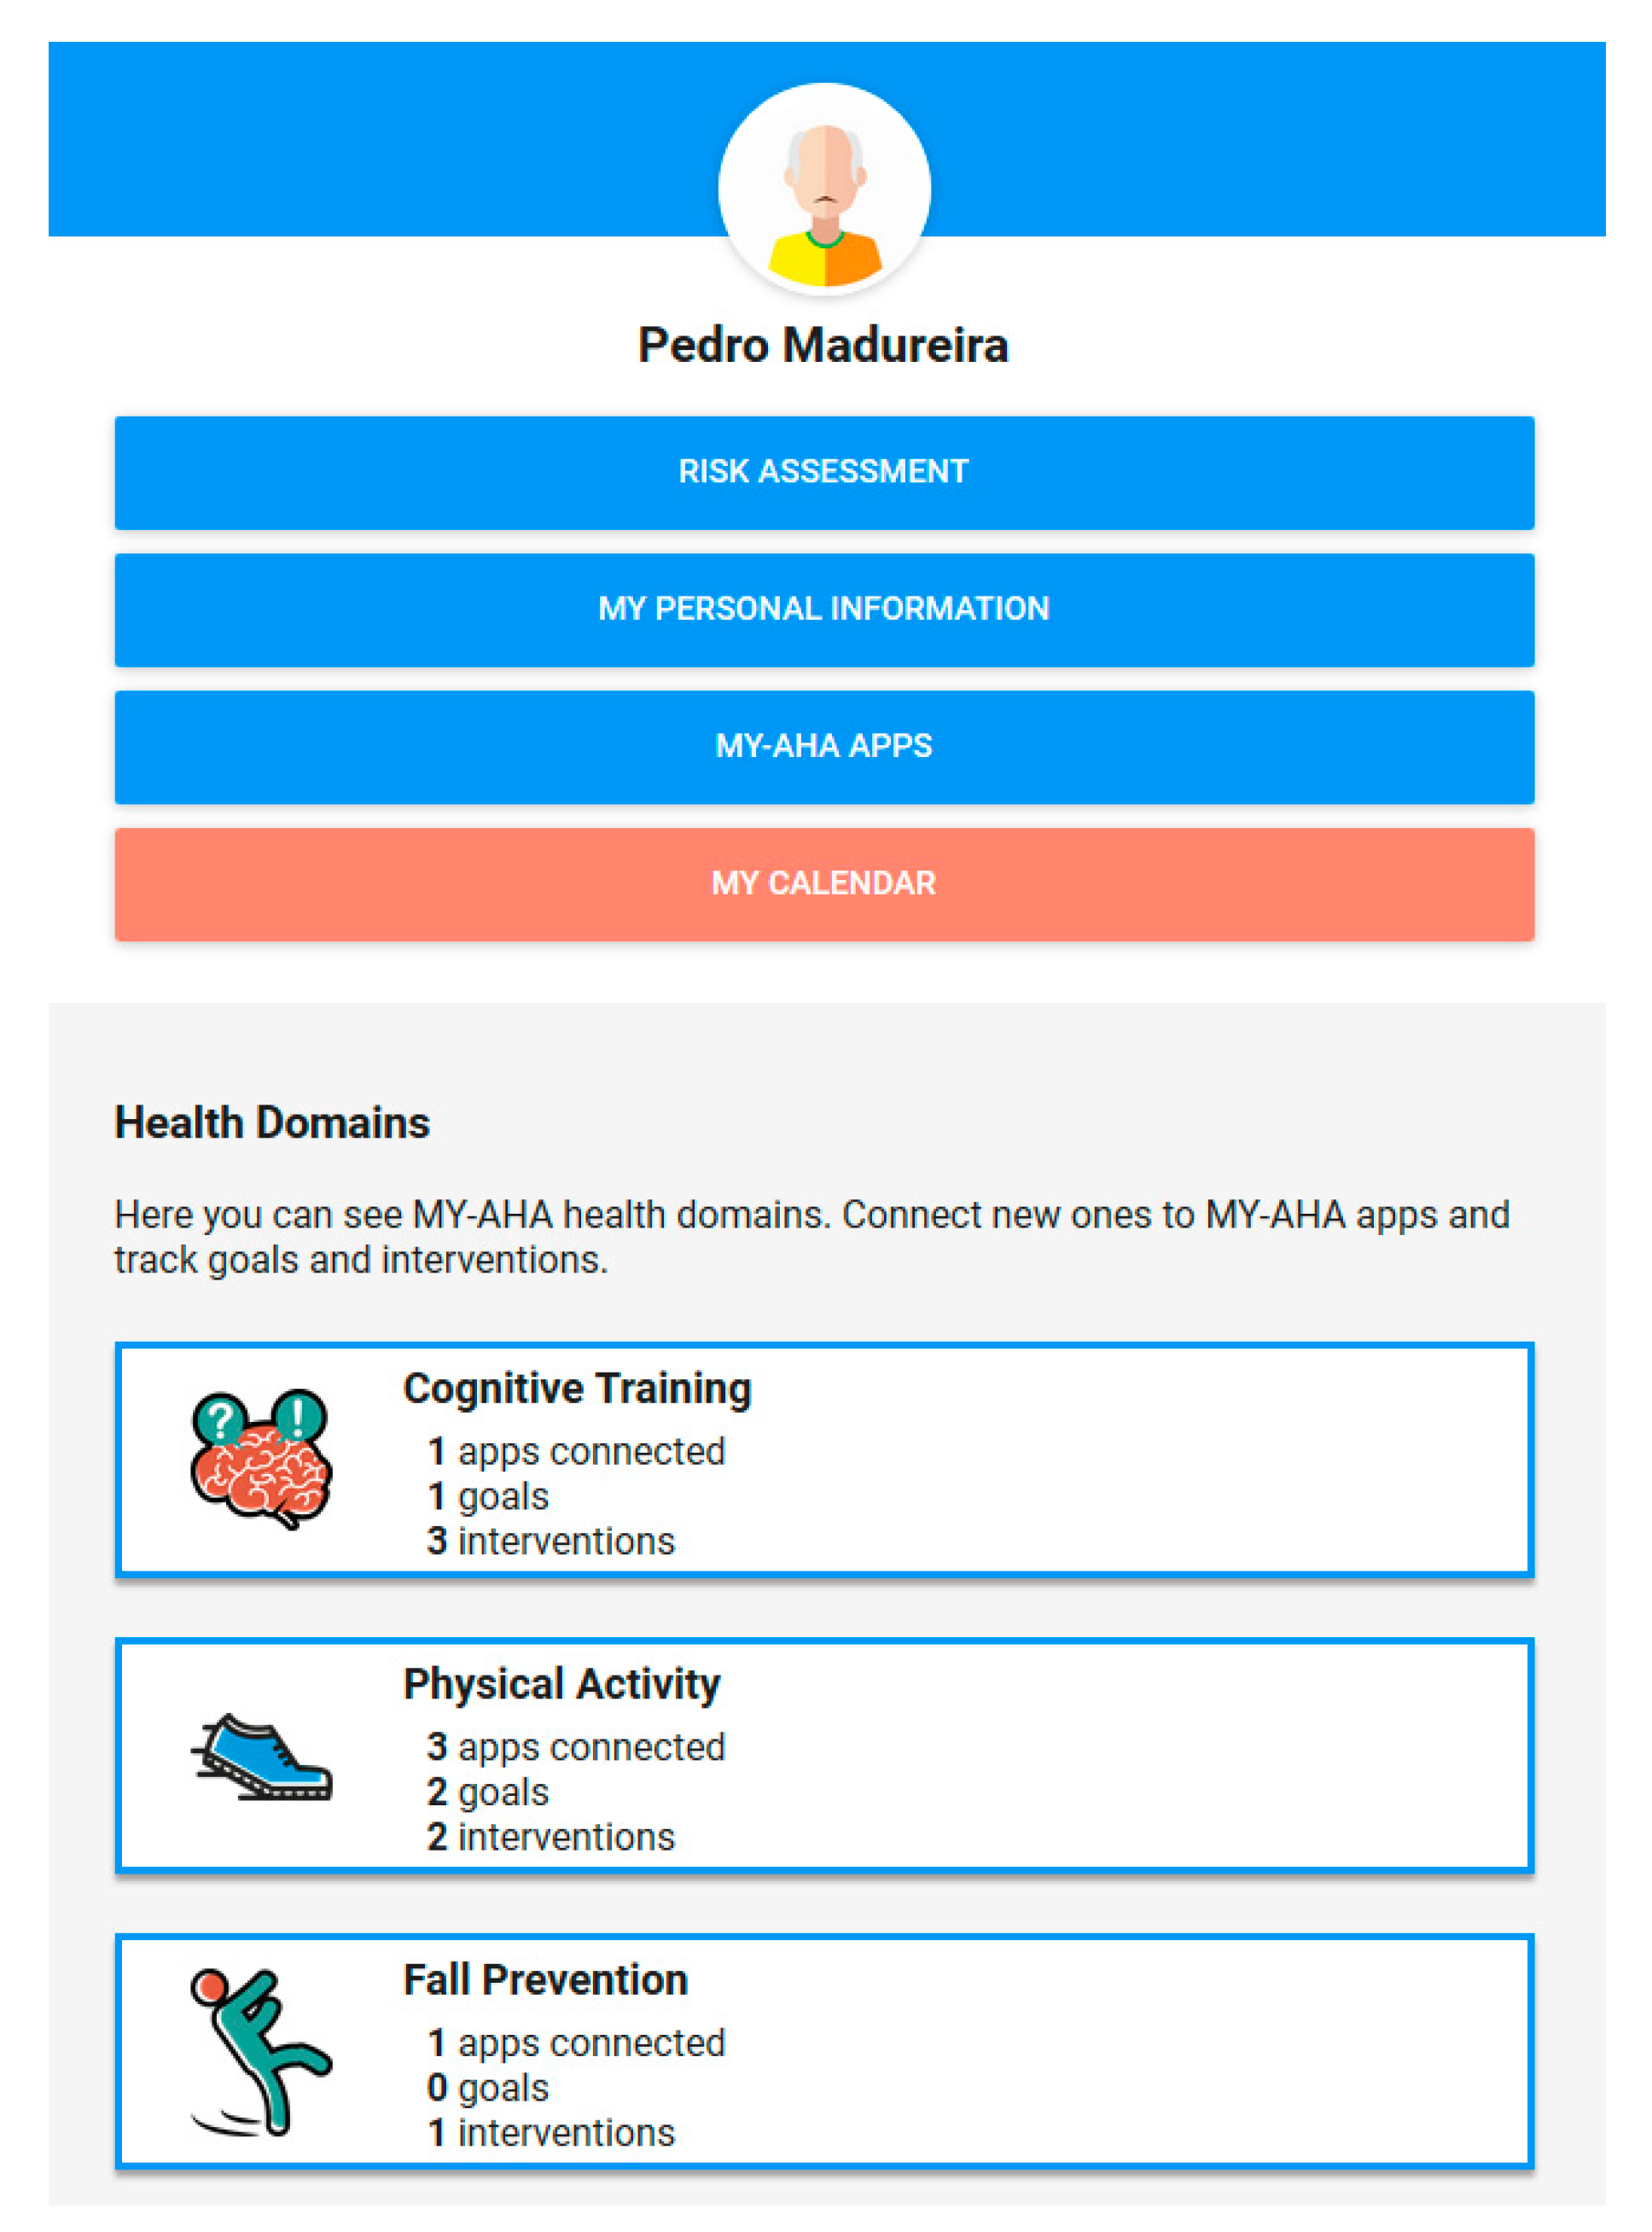
4.5. My Personal Dashboard
As aforementioned, the My Personal Dashboard has been designed to provide a unifying layer to users, over the single platforms and organisations, for providing a coherent and integrated understanding and experience of the My-AHA system as a whole.
The web interface accessible here [
46] was tested with the foremost recent browsers both on the PC and on smartphones. To foster its accessibility, the responsiveness of the interface was one of the main drivers of its development so the interface will adapt accordingly with the devices used to guarantee excellent user experience.
Due to practical reasons, the dashboard is also available through an Android application, downloadable from Google Play Store [
47].
Figure 4 shows the dashboard home screen alongside four of its main sections:
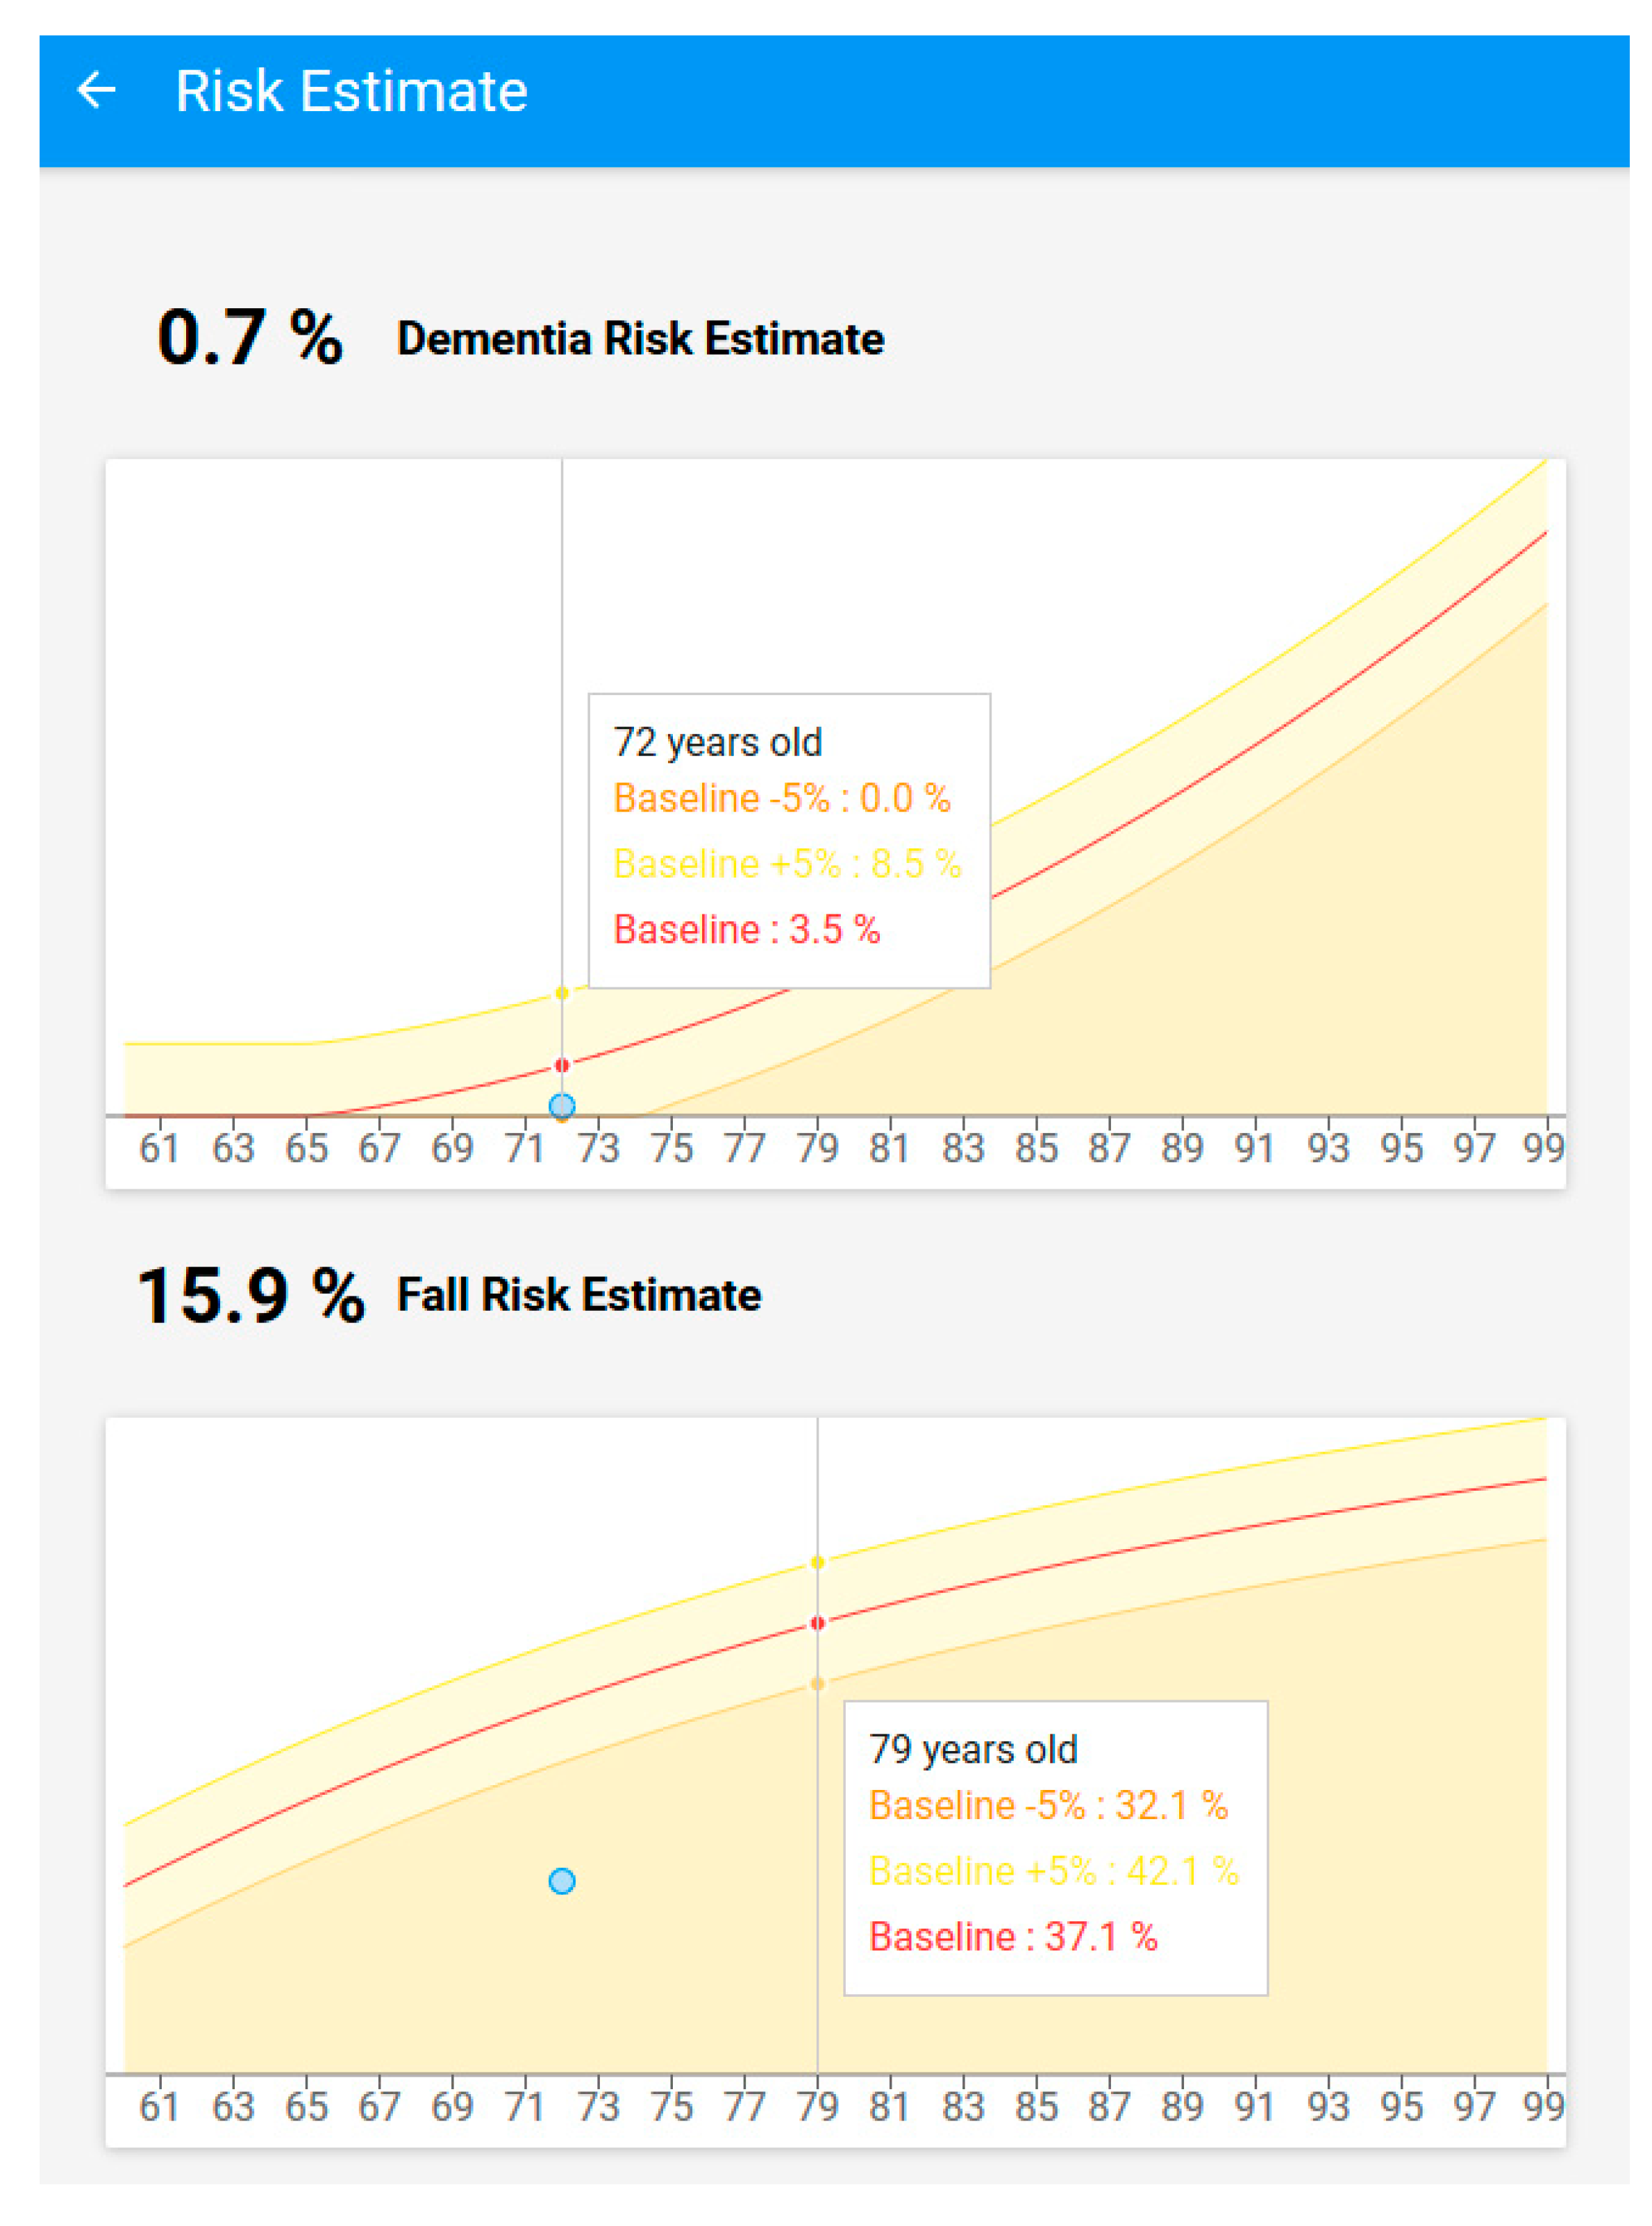
Risk Assessment
My personal information
My-AHA apps
My calendar
In the following sub-sections, a short description of each function and its connection with My-AHA middleware is provided.
4.8. Evaluation
My-AHA underwent an initial testing phase with users with constant and close follow-up by the caregivers during a period of 6 months following the living lab methodology described in
Section 4.7. That period allowed for an early evaluation of some of the initial assumptions on the technology developed. During that period, due to external and unforeseen circumstances, we were forced to replace one of the external platforms interfacing with My-AHA that was providing nutritional data. It was at that time that the connection with Fitbit was introduced to the system. This update allowed us not only to have an alternative source of data but also to prove within a real scenario the modularity and robustness of the whole software platform that allowed us to replace a data provider in a simplified way, having only to deal with the particularities of the authentication and querying of the new platform without having to change any structure of our system from that point onwards.
This initial phase allowed us also to listen to feedback from the caregivers working more closely with the participants. It was from this feedback arose the idea arose of the goals presented in
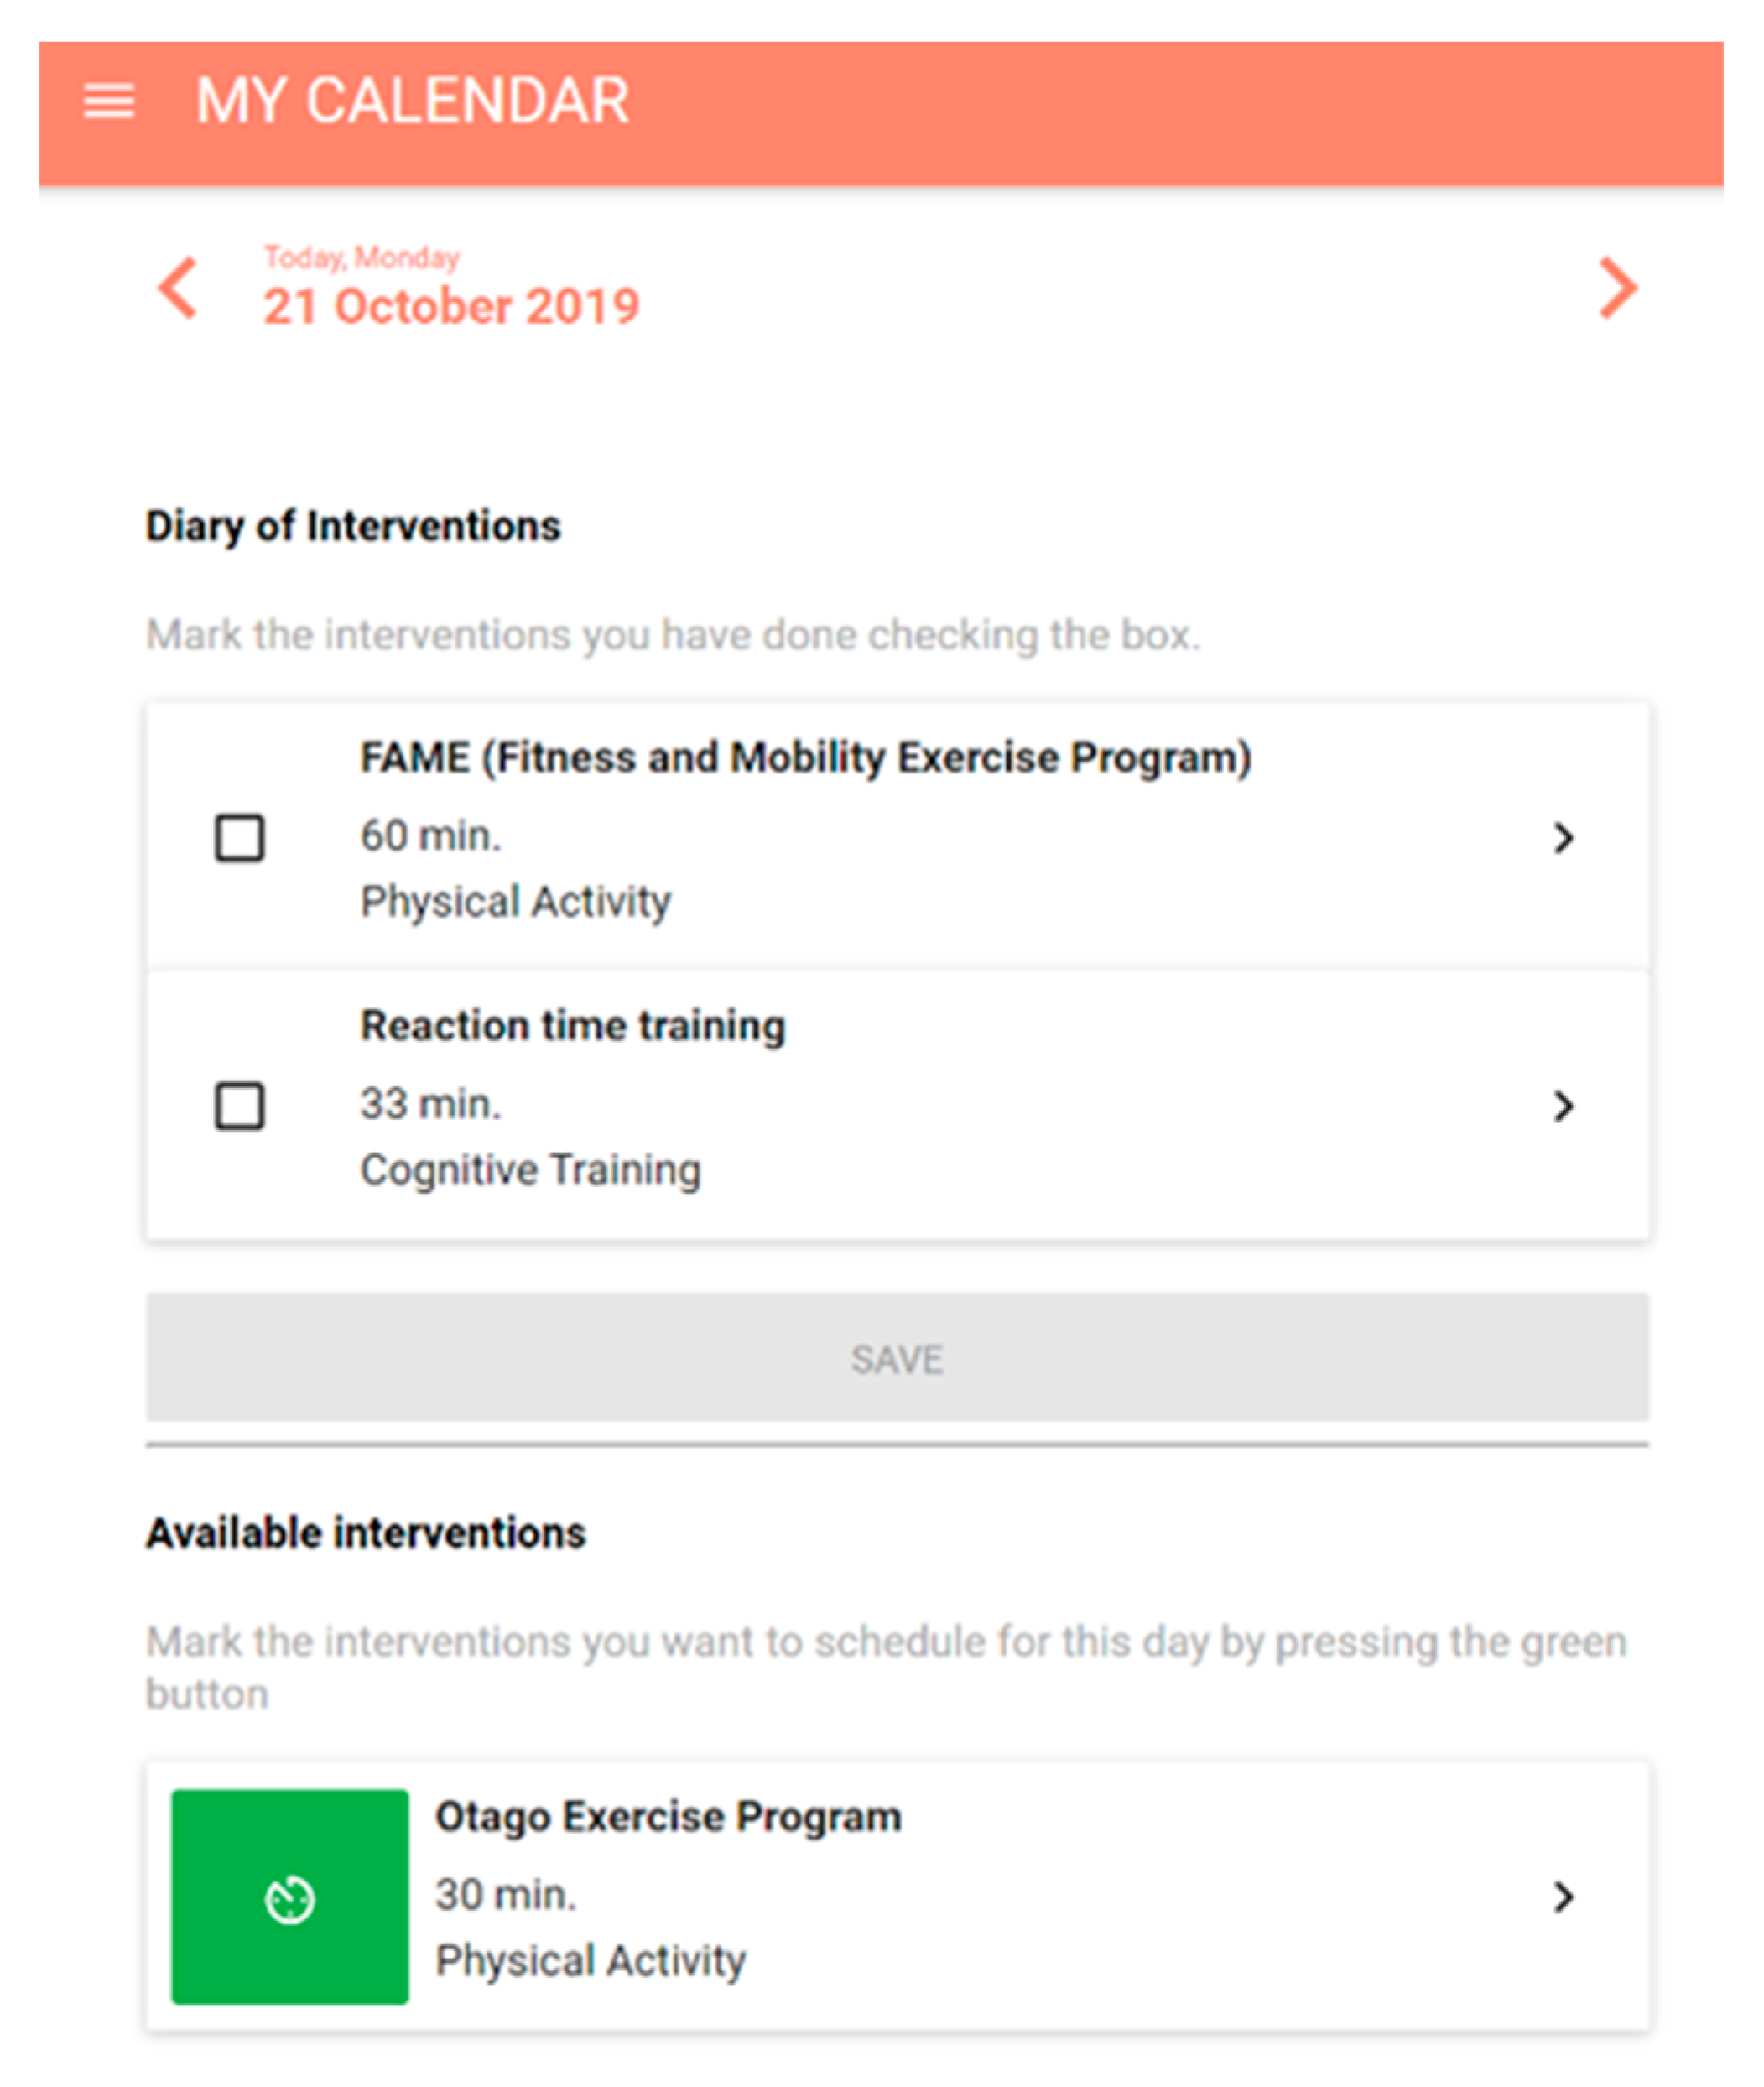
Section 4.5.5. Upon implementing it, the caregivers noticed a renewed interest in the platform from the participants with the objective of achieving their self-set goals. Furthermore, another important feedback that has been gathered and treated after this first validation has concerned the possibility to schedule and to keep track of the interventions. For this reason, my-calendar functionality has been designed (see
Section 4.5.4).
After this initial testing phase, My-AHA ran a multicentre 18-month RCT [
51] that lasted until late 2019. This RCT used the initially developed software platform and was further enhanced on the testing phase as a supporting technology for the whole system. Since the project encompassed partners from different countries, it was decided that also this RCT would include users from Spain, Italy, Austria, Australia, and Japan, totalling around 110 users regularly using the system.
When writing this paper, the users participating in the RCT have already contributed to 606,000 measurements collected by the middleware. Even though the RCT inside the My-AHA project has already been finished, several users are still engaged with the platform. By looking at the systems’ data, it is possible to observe that the whole list of users, which besides the RCT above’s participants, also includes users from the living labs testing phase and development and demonstration users, resulting in a total 390 entries on the database that have already provided a total of 935,000 measurements.
From these numbers, some conclusions can be derived from the RCT. The number of measurements coming from passive solutions (e.g., activity trackers) is significantly higher than the ones from platforms where users need to actively engage to generate data (e.g., food logging through Fitbit), and the later tends to decrease over time. So, for future inclusions of external platforms, the target would be focused on solutions that are able to collect data passively. Also, data coming from the dashboard where the users need to answer it manually (refer to
Section 4.5.1) came very infrequently, and most of the users answered it only once upon registration, making it challenging to track the evolution over time of some of the risk values. Some of this data insertion in the platform was indeed automated, like the case of body weight, where the users could manually add their weight via the dashboard but could insert it using a Smart Scale from Medisana platform, making it independent of the manual entry.
Regarding the performance of the middleware, each connector was kept running on an hourly basis throughout the whole RCT. The search for new measurements for each one of the registered users’ connected platforms was tested, totalling at the time of writing roughly 470 individual connector runs per hour (each one of these individual runs including multiple API calls). On average, a complete run of the system lasted approximately 50 s. The complete run goes through all the users, searching for new measurements, storing them, notifying the DSS, performing all the necessary updates and post-processing, and finally storing the updated risk, therefore, giving a considerable margin for the scalability of the system. Even with the increase of users and platforms, from the initial testing phases to the total amount of users in the RCT, the performance of the system kept very stable, increasing our degree of confidence in the robustness of the whole system.

 ,
, 


