Risk Assessment Framework for Outbound Supply-Chain Management


Abstract
:1. Introduction
- Risk Identification.
- Risk Assessment.
- Risk Modeling.
- Risk Mitigation.
- Risk Monitoring.
- Monitoring system—which would allow a user to monitor planned (known) events and be able to detect disruptive events.
- Alarm system—which would systematically detect variations to a schedule and notify key personnel based on predefined threshold levels.
- Decision support system—which would detect deviation and find a solution that minimizes the disturbance impact on the supply chain, and the proposed solution would then be provided to the human decision-maker to make the final decision.
- Autonomous corrective system—which would be able to detect a disruptive event, verify the feasibility of the current schedule, or look for a solution to repair the schedule, and if a solution exists, implement it.
2. Key Framework Parameters
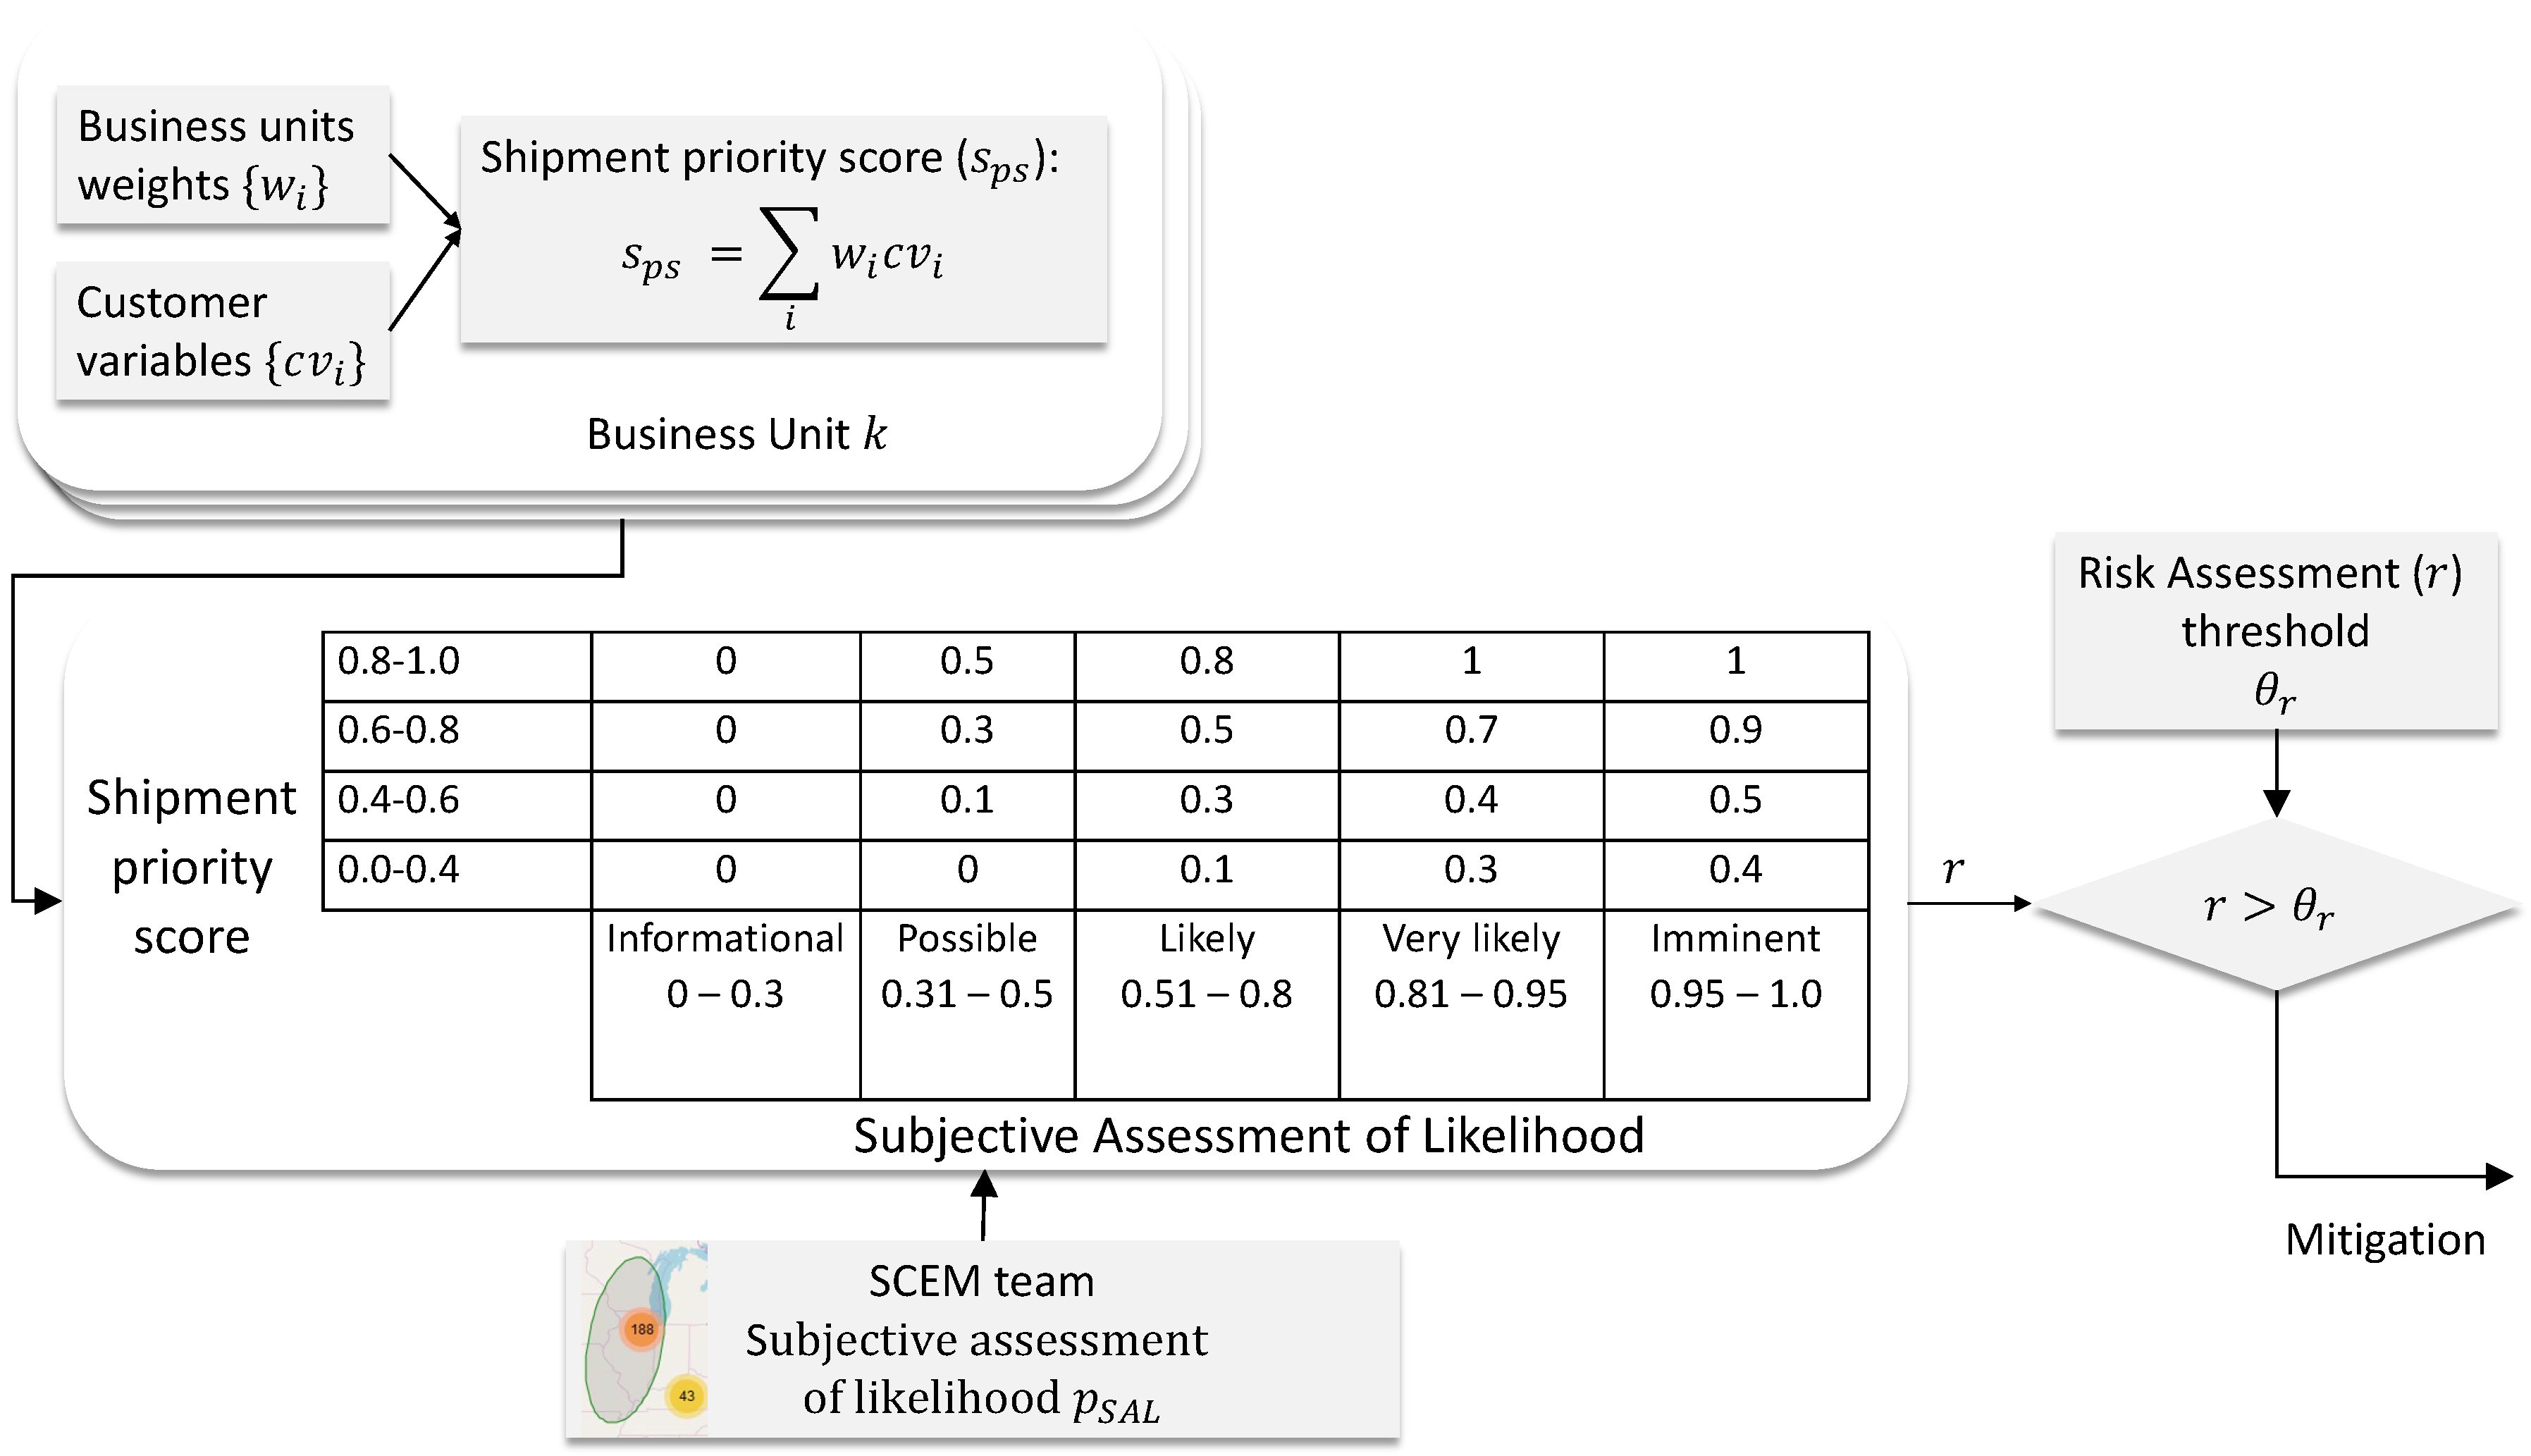
2.1. Importance of Individual Shipments
2.2. Probability of an Event
3. Geofencing and Risk Assessment
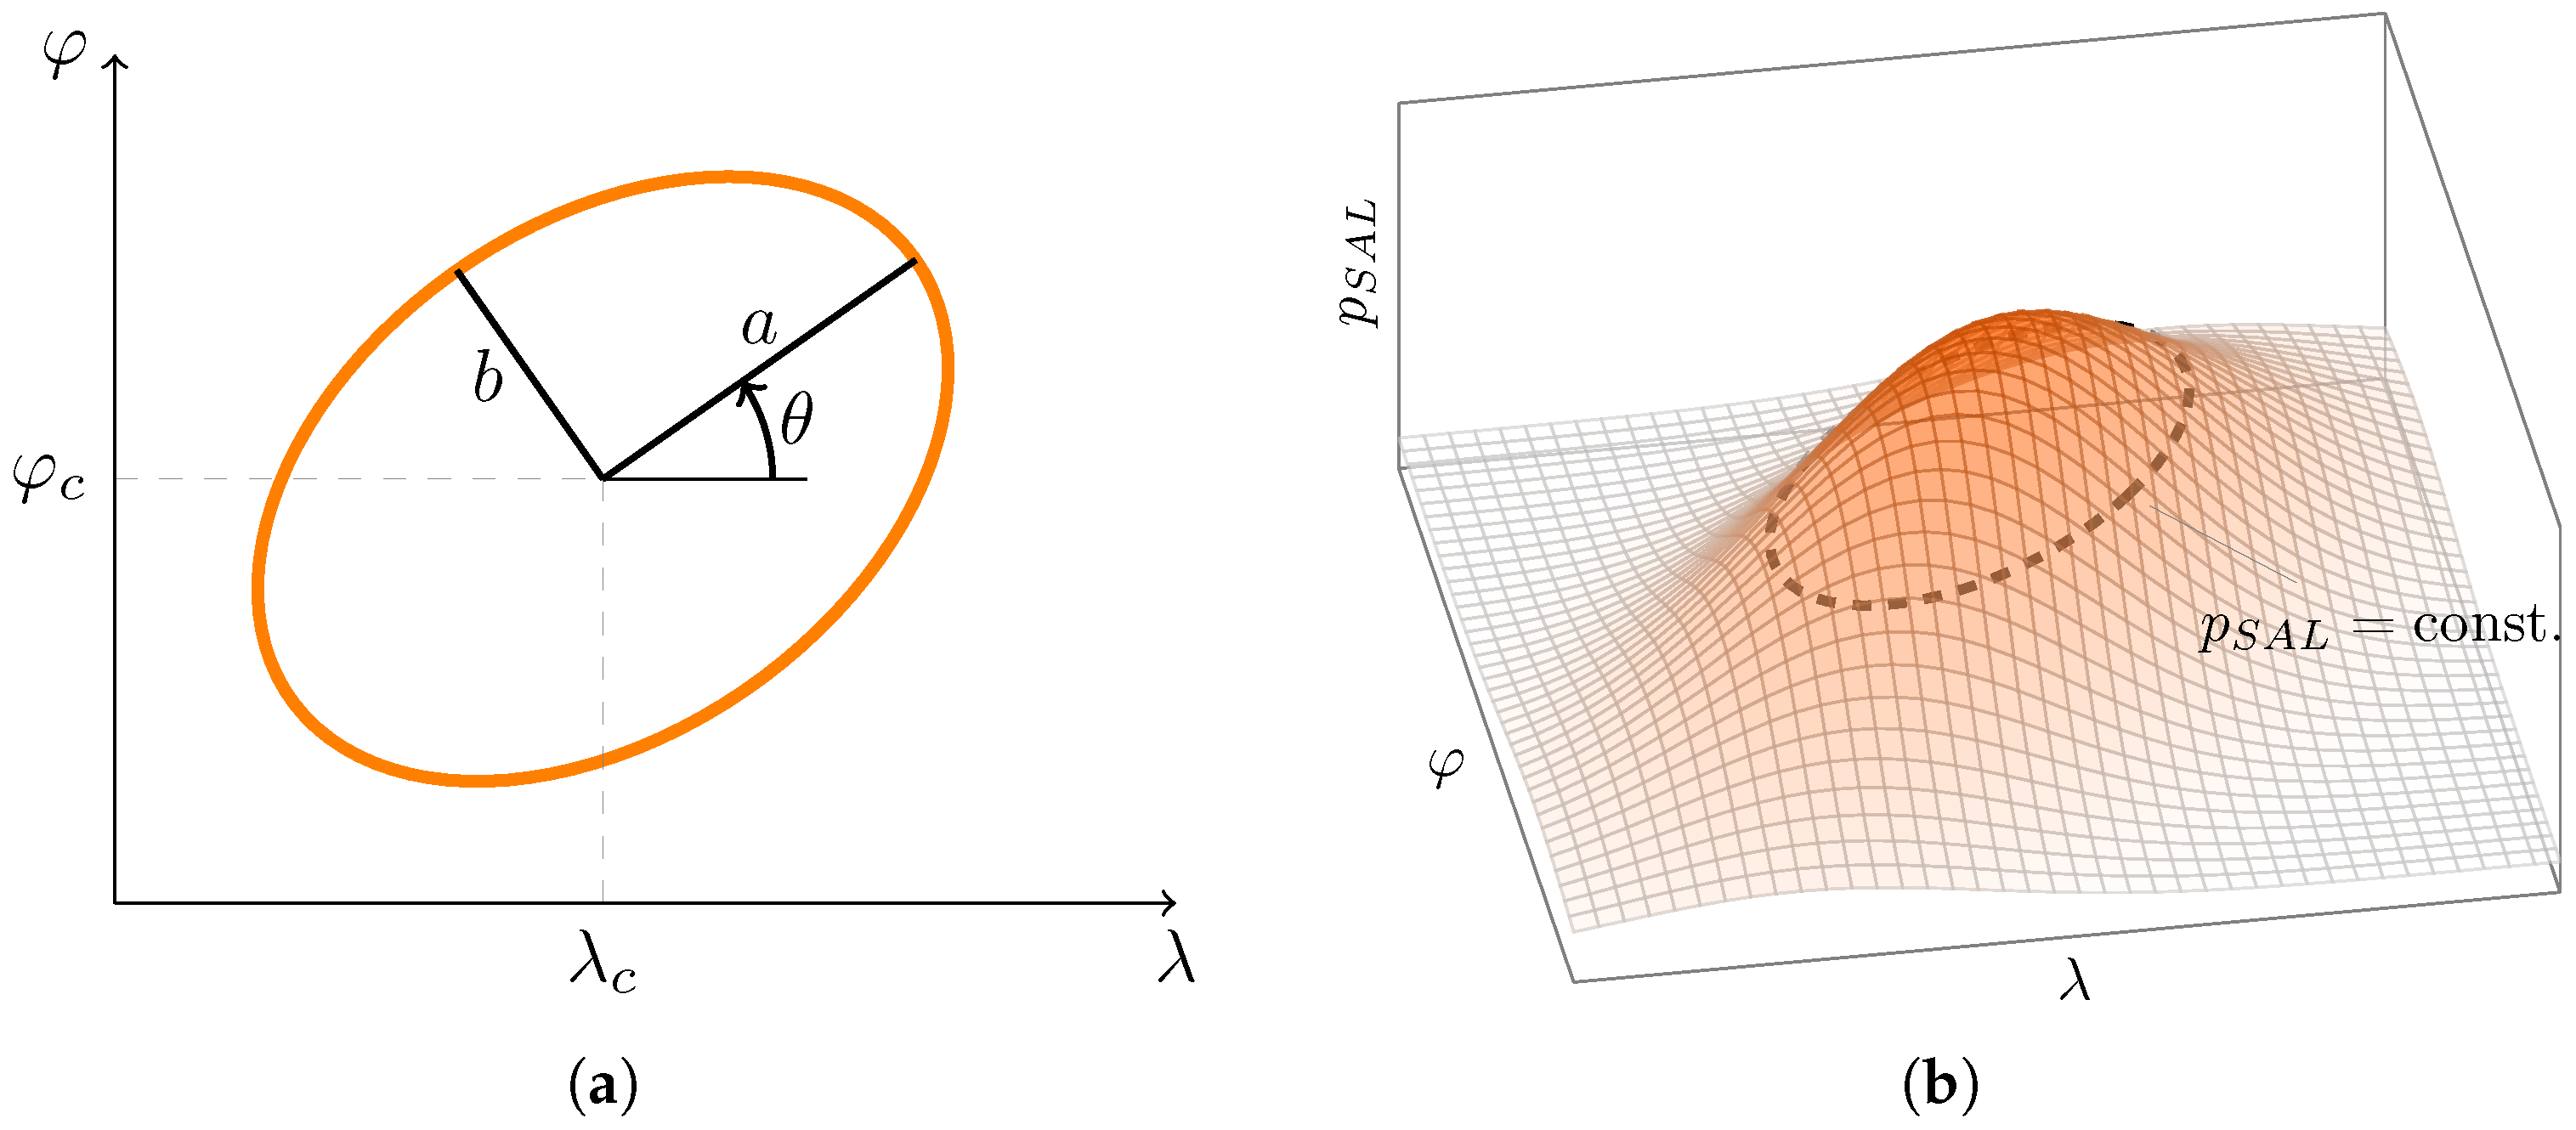
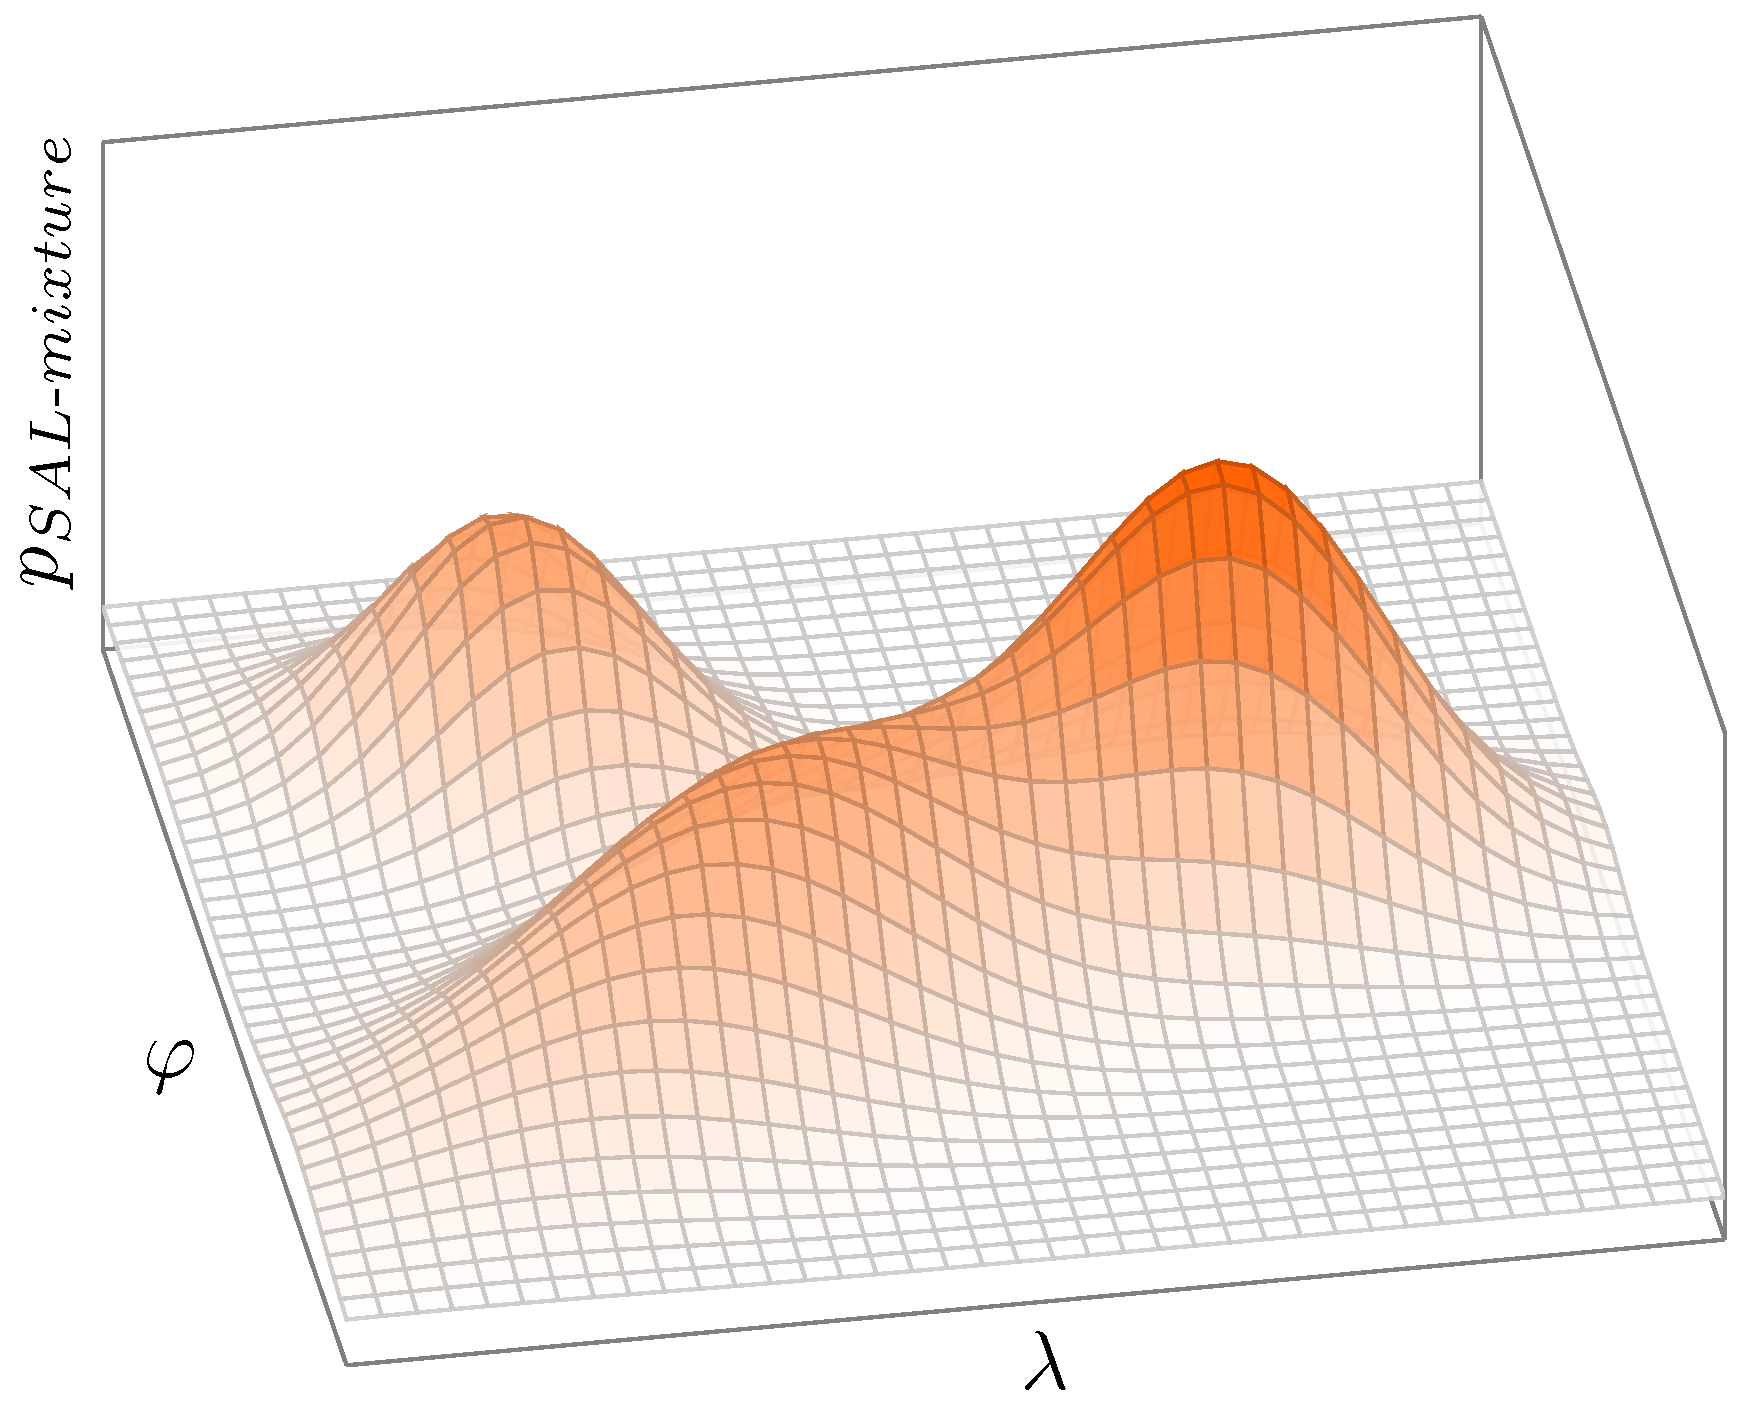
3.1. Event Geofencing and Its Relation to Probability
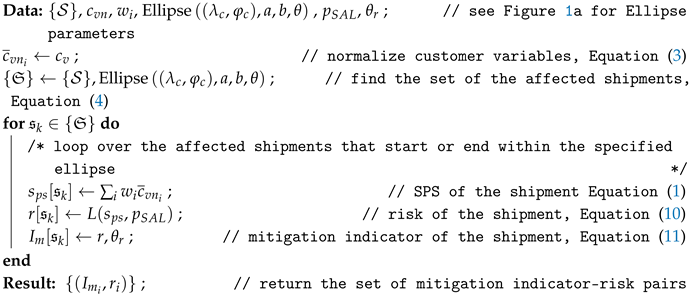
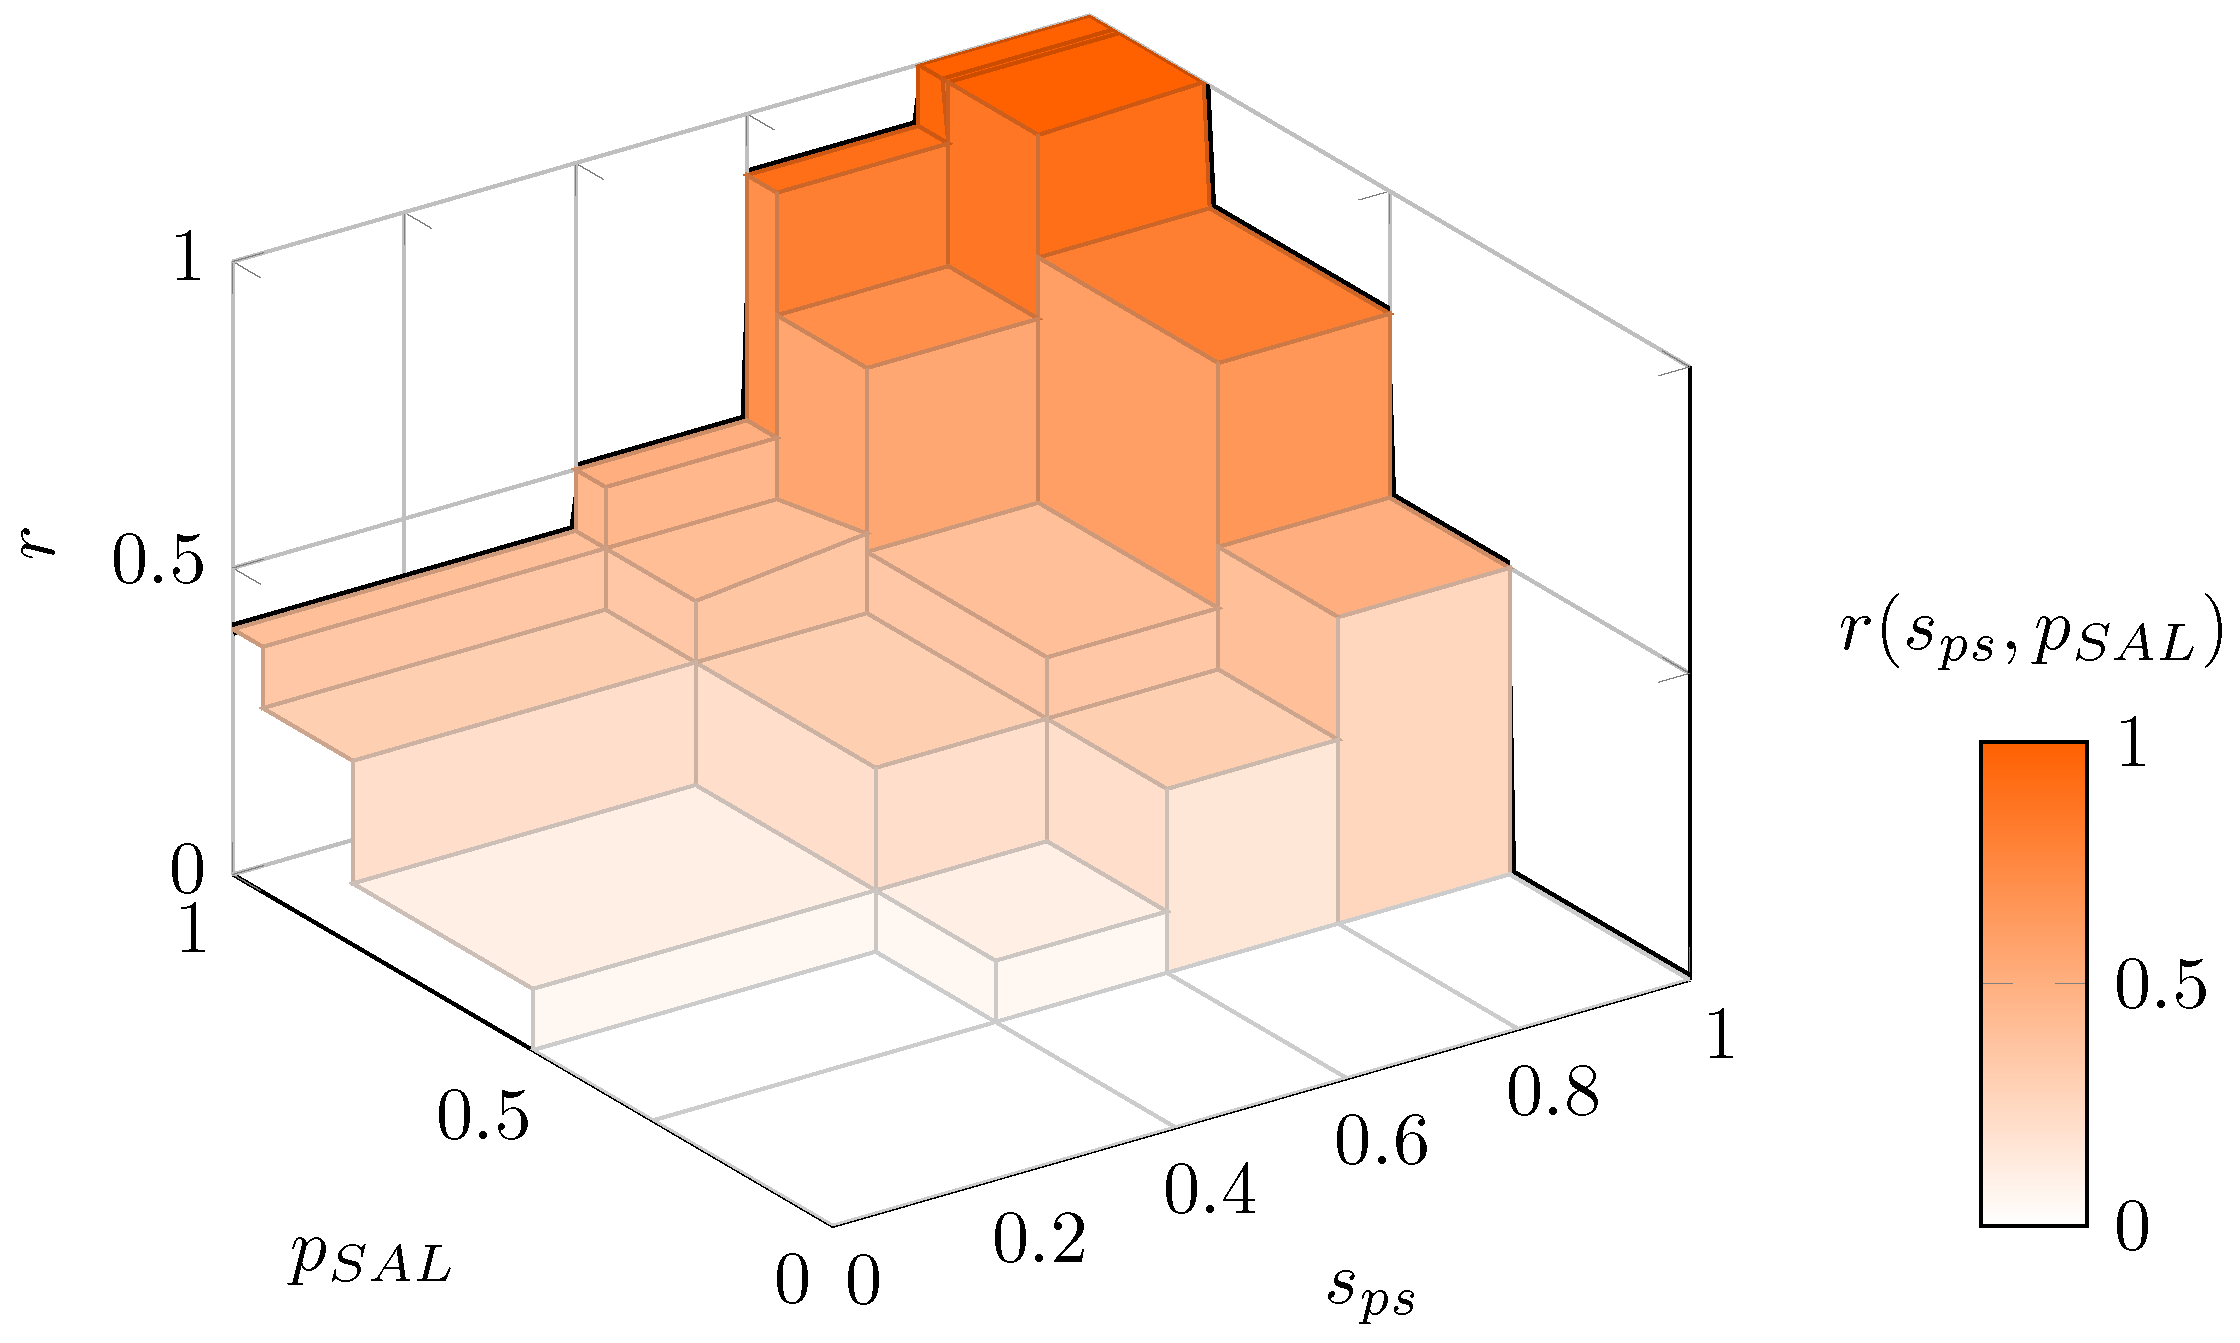
3.2. Risk Assessment
| Algorithm 1: Risk calculation. |
 |
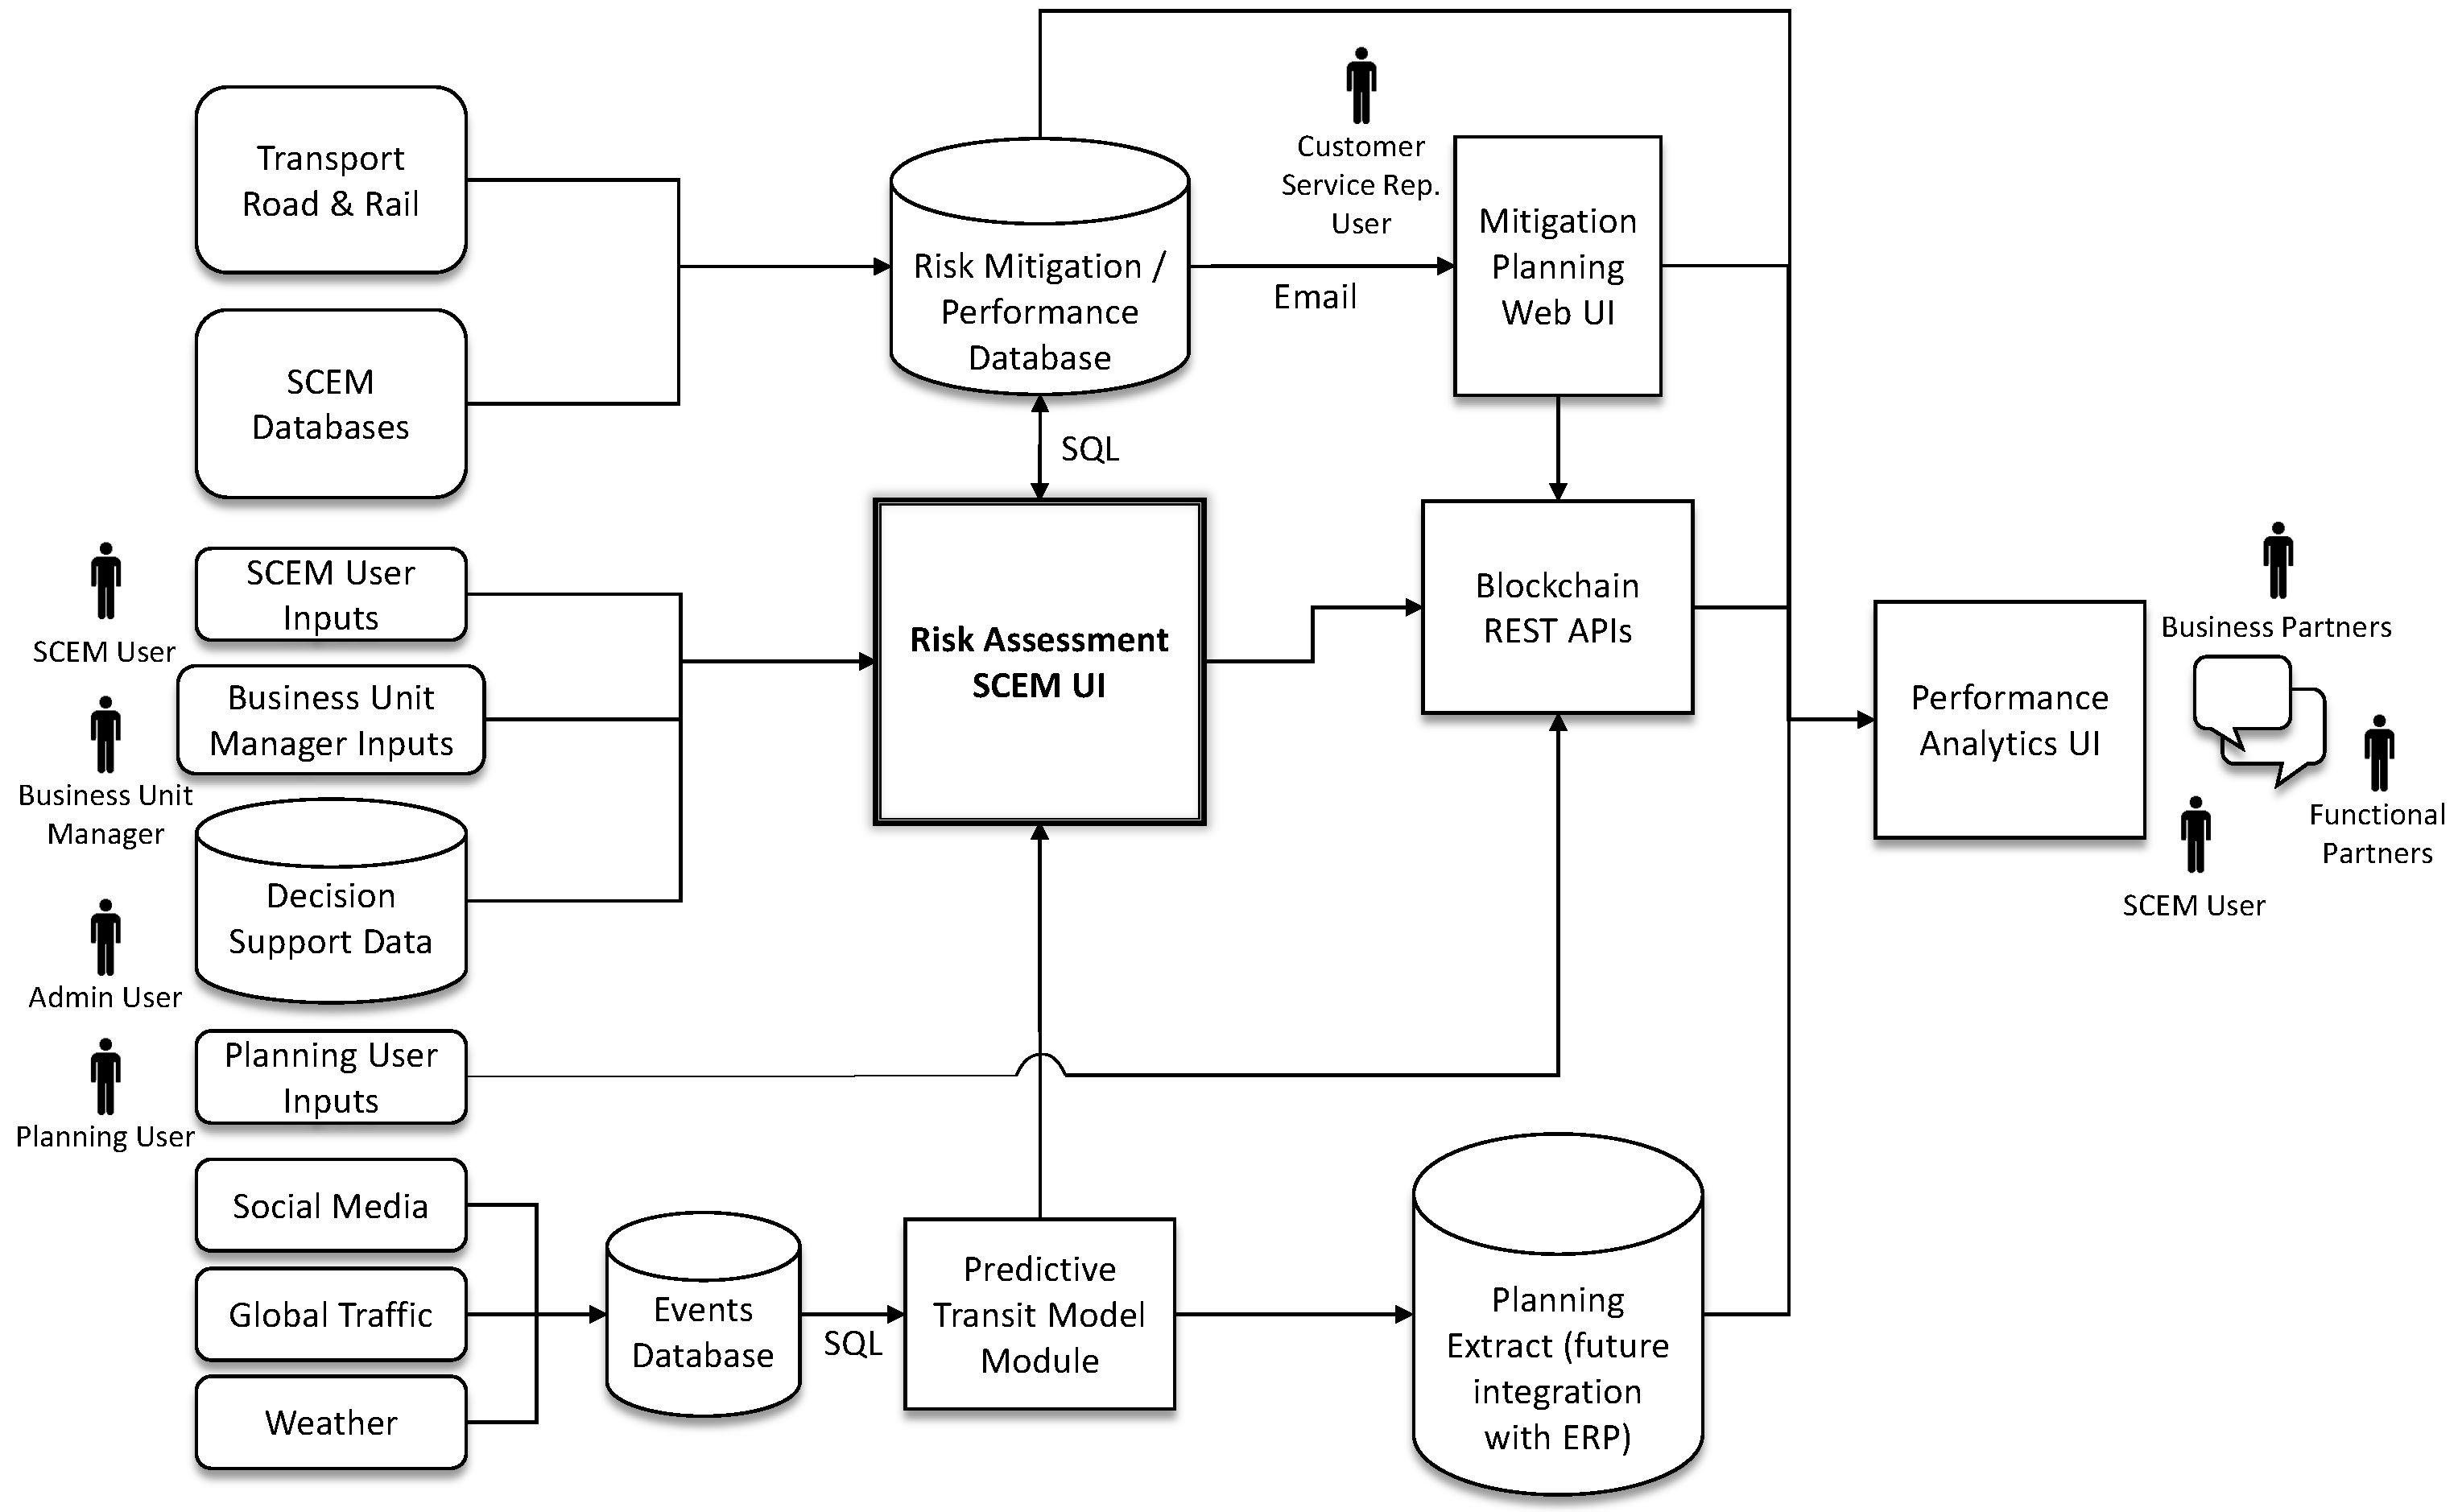
4. Implementation
- Predictive Transit: This module provides an estimated shipment transit time for future shipments based on source, destination, planned shipment date, product type, weather, and event data.
- Risk Assessment: This module provides a graphical user interface (GUI) to enable a user to document current and future events and automatically compute a risk for each individual outbound shipment in the affected geographical area.
- Mitigation Planning: This module automatically sends a communication (text/SMS or email) to subscribed decision makers when an outbound shipment has been promoted by the RA module. The communication provides an overview of the shipment and the event impacting it. The user can then enter in mitigation information, which is stored. After enough mitigation decisions are collected, a machine learning method may be trained to then automate recommended mitigation actions.
- SIMBA Chain Communications: This module integrates relevant data from different modules using a blockchain ledger and sends automated notifications to targeted individuals (Dow internal and external) when risk thresholds are met.
- Performance Analytics: This module is a data enablement SQL table within the Microsoft Azure environment with direct connection to a dashboard that calculates and displays Key Performance Indicators (KPIs) which are derived from the various modules. This module provides aggregated data, along with an easy access point for monitoring and decision making.
4.1. RA Database Implementation
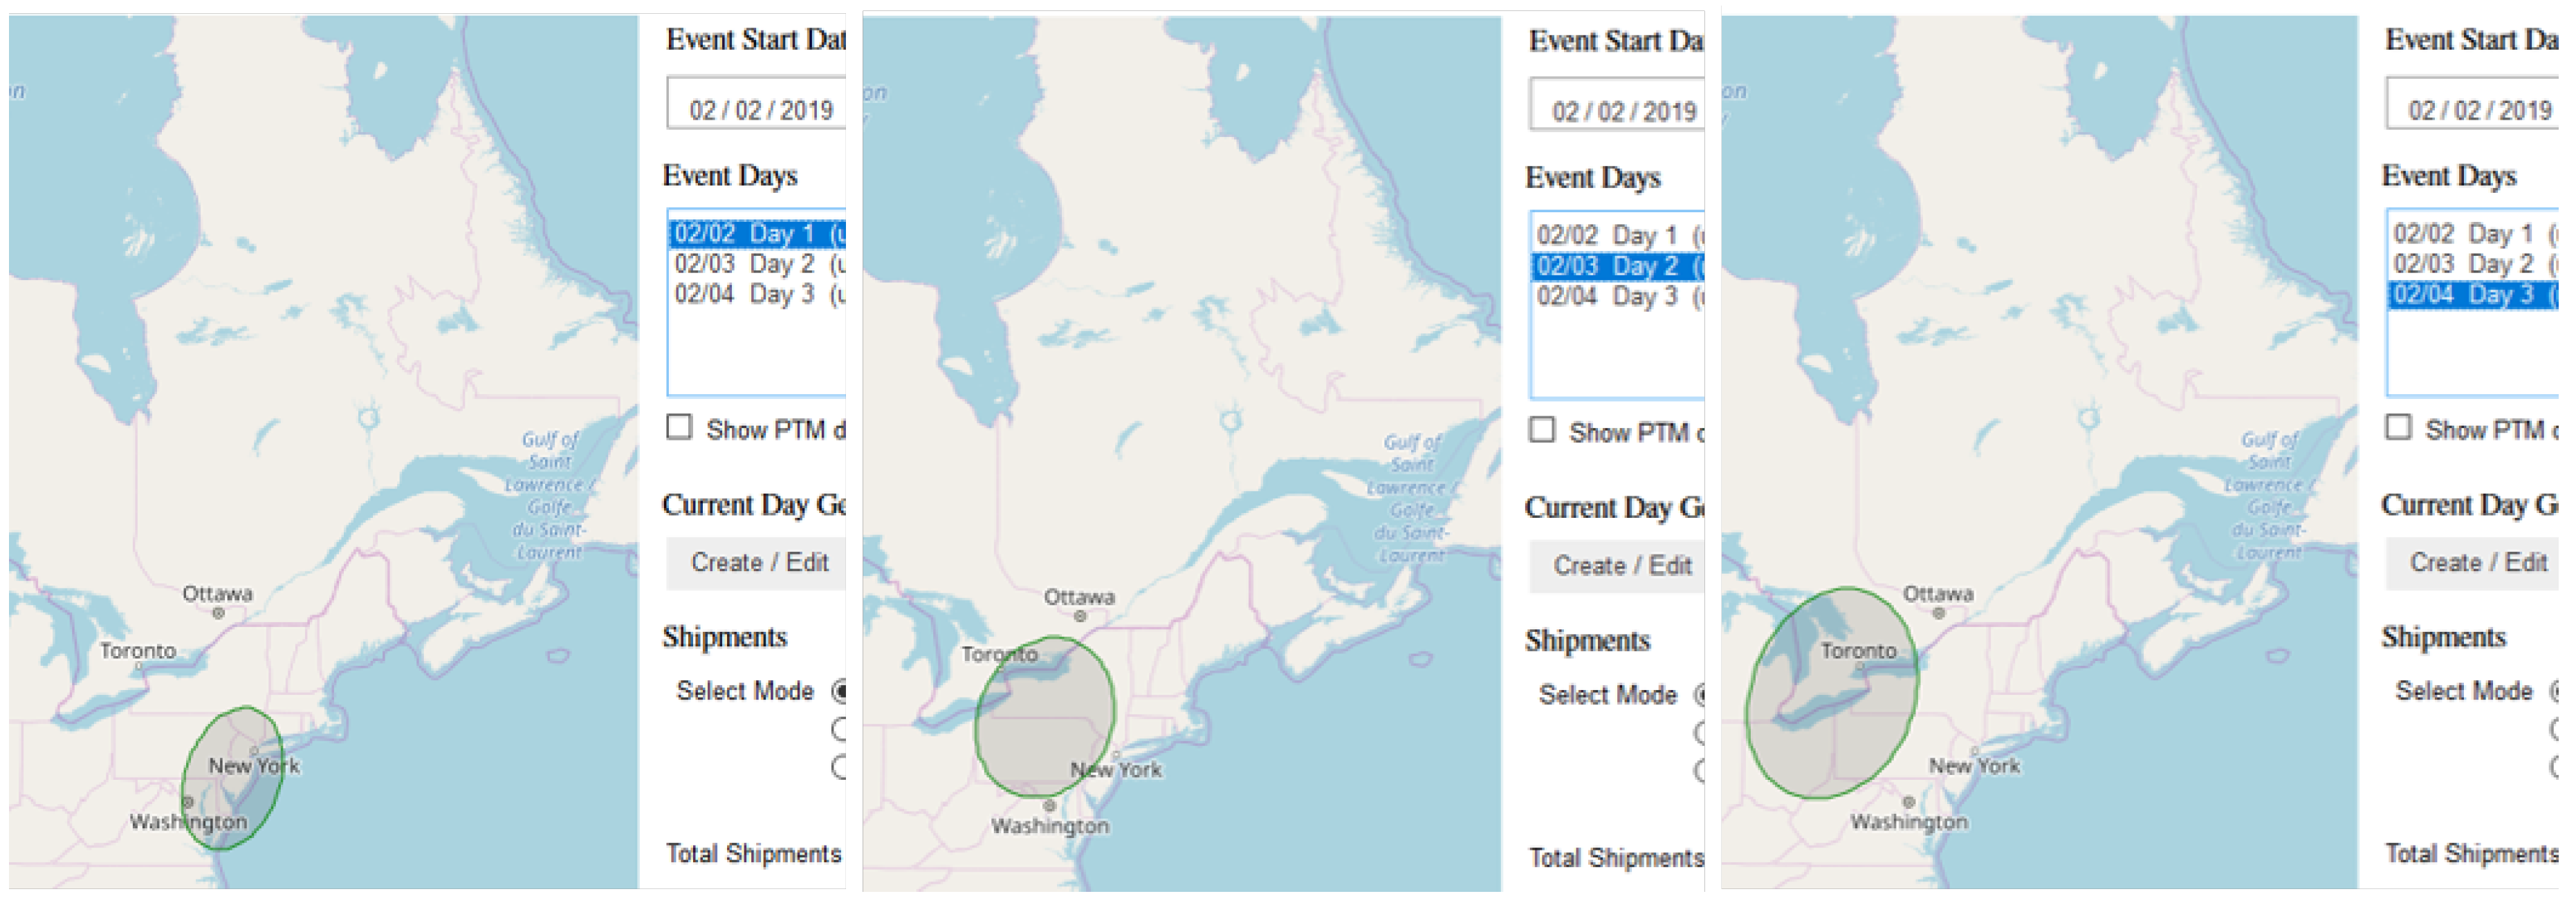
- Events table (top left) contained a unique event ID, date range, event status and category, shipment mode, and some information on whom recorded the event and where, such as event manager, region, updated on, updated number, and finally some user comments if desired.
- Event_Geofence table recorded unique event information, viz. event ID, update number, day in event, as well as the event data and parameters of the geofence: longitude, latitude, A (major axis value), B (minor axis value), and tilt.
- Event_Shipments contained information on the populated shipments from the manufacturer’s database as well as user supplied information for the given event. This table contained four fields that labeled a unique shipment within an event. These were event ID, day in event, shipment ID, and update number. The shipment mode was captured just as it was in the Events table. A column for status was added for tracking in-progress and updated events. SAL and SPS are calculated per shipment per event in order to obtain a mitigation indicator for each shipment, for each event. A comments field was included for user comments, and finally, two additional columns named Human SPS and Human Risk Score were added so a business unit manager could enter their own interpretation of shipment priority and risk to the event.
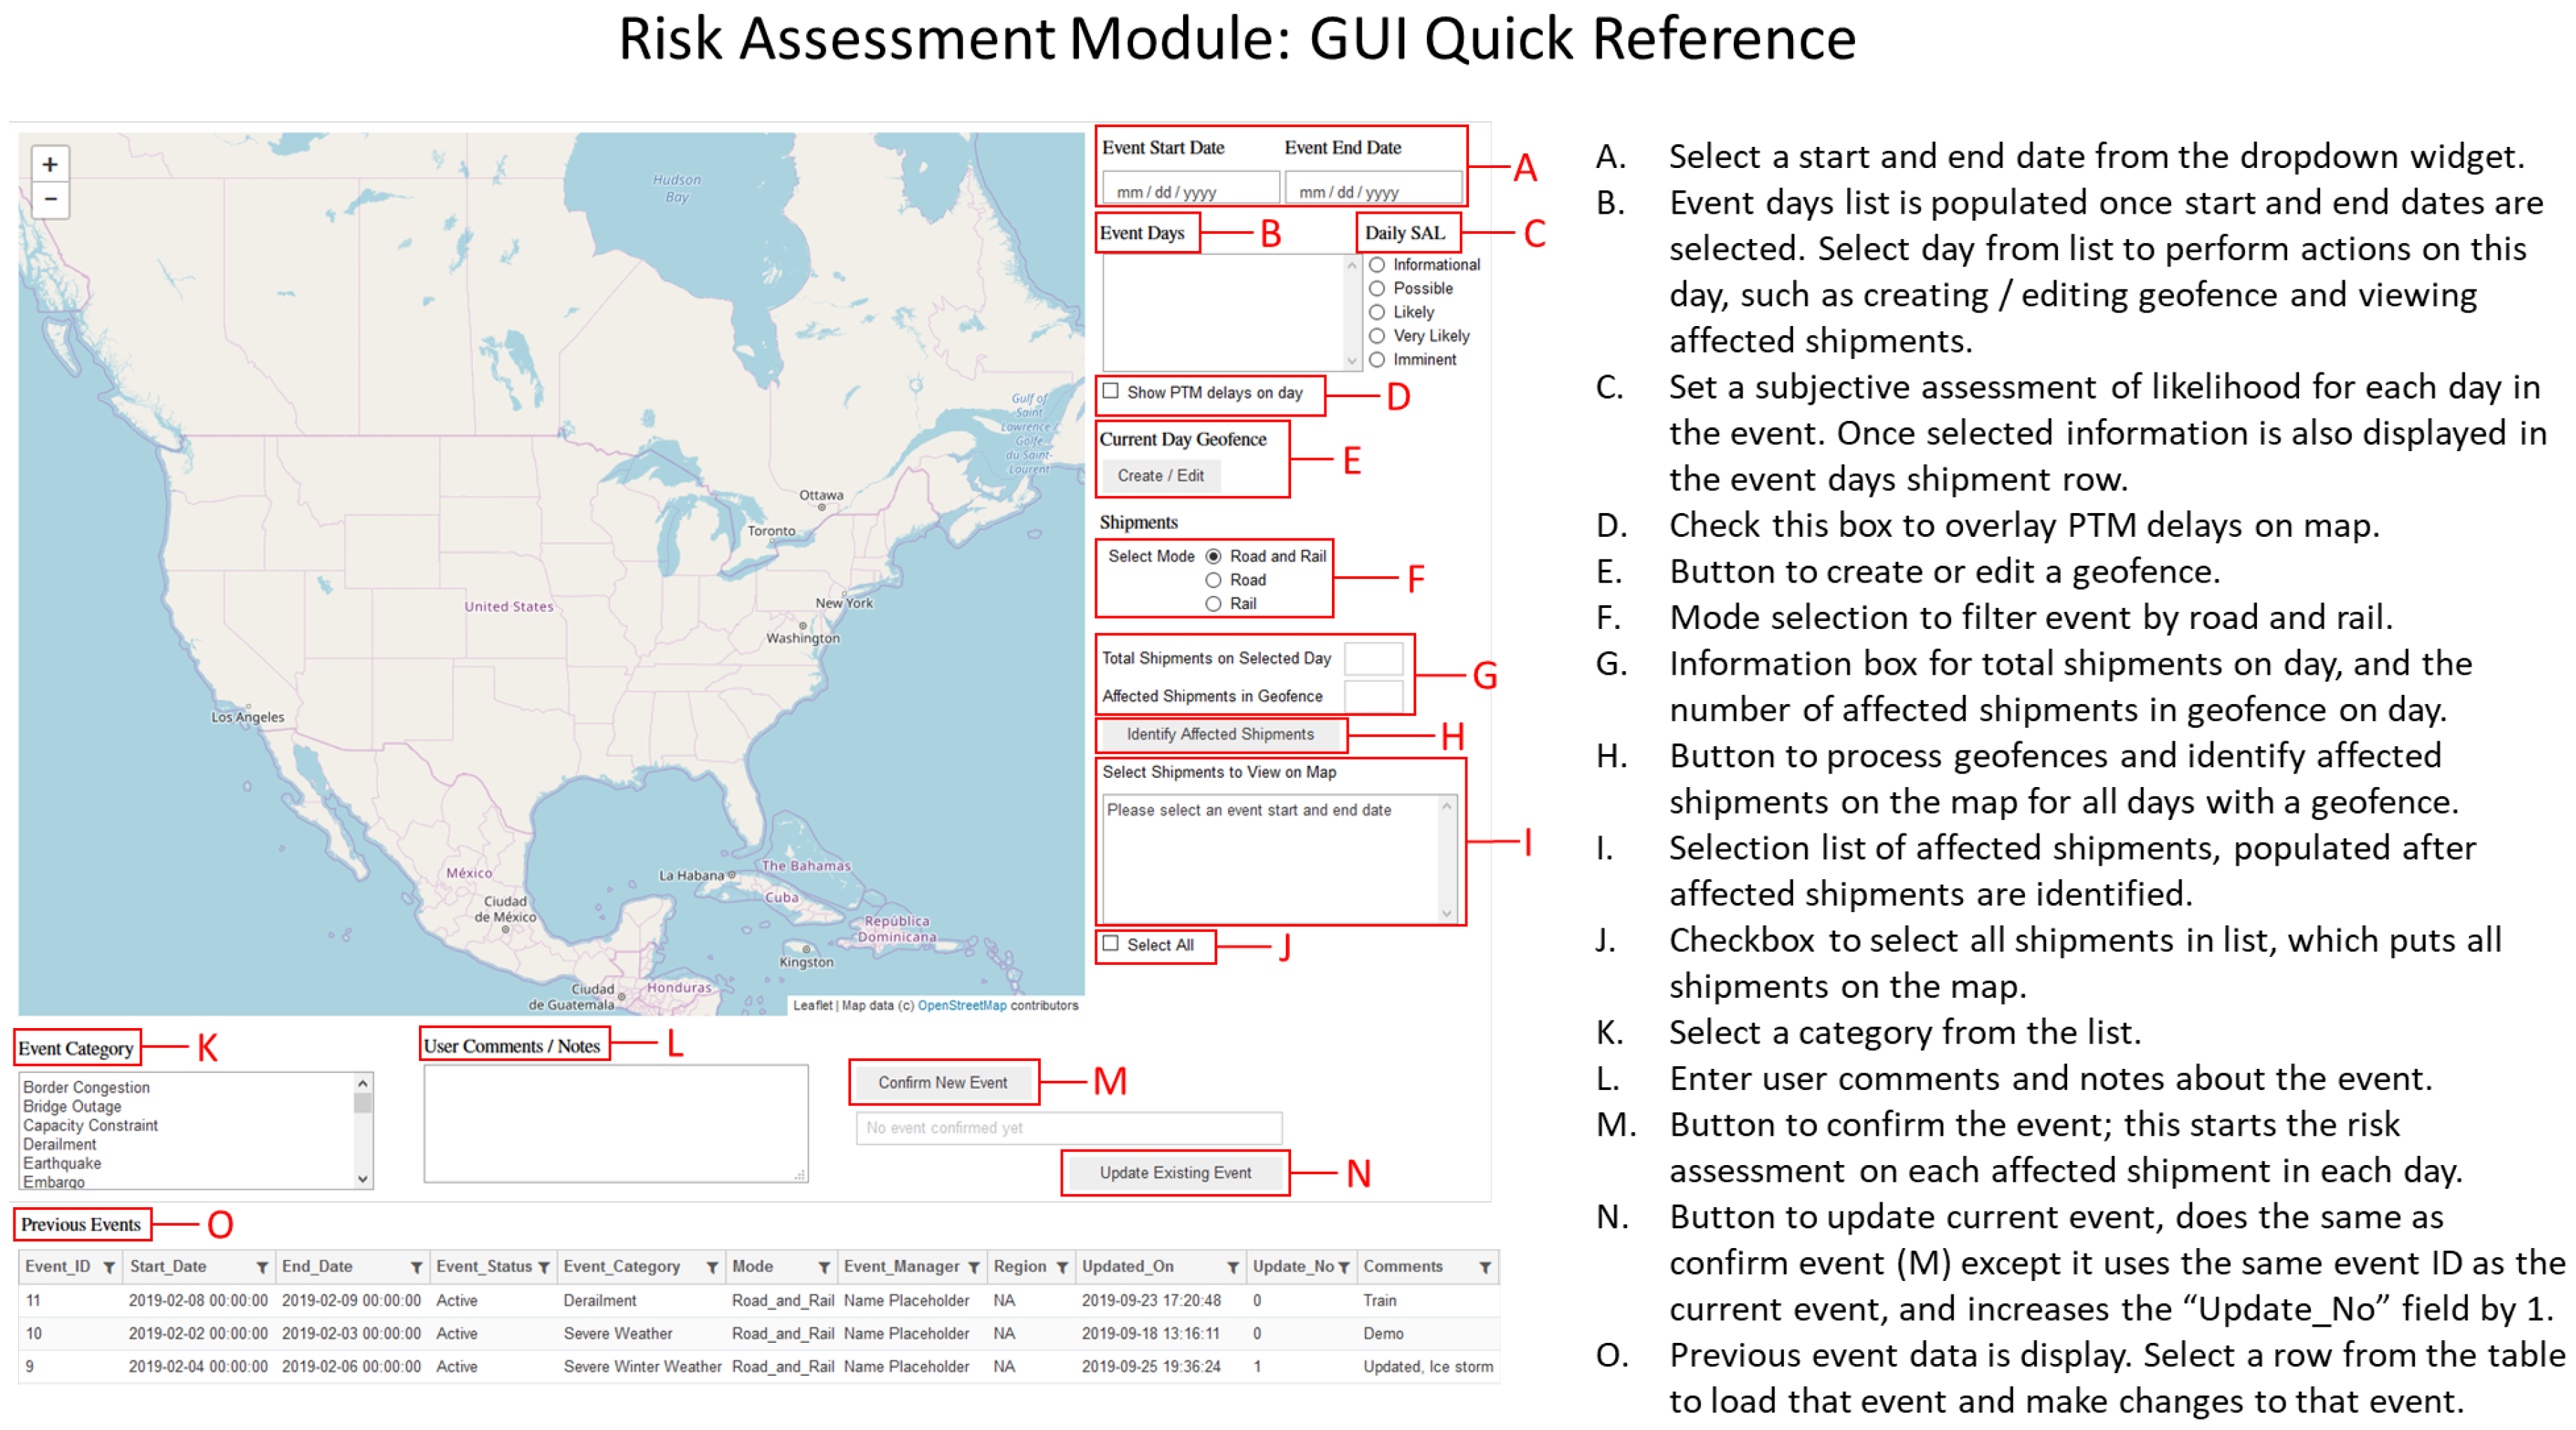
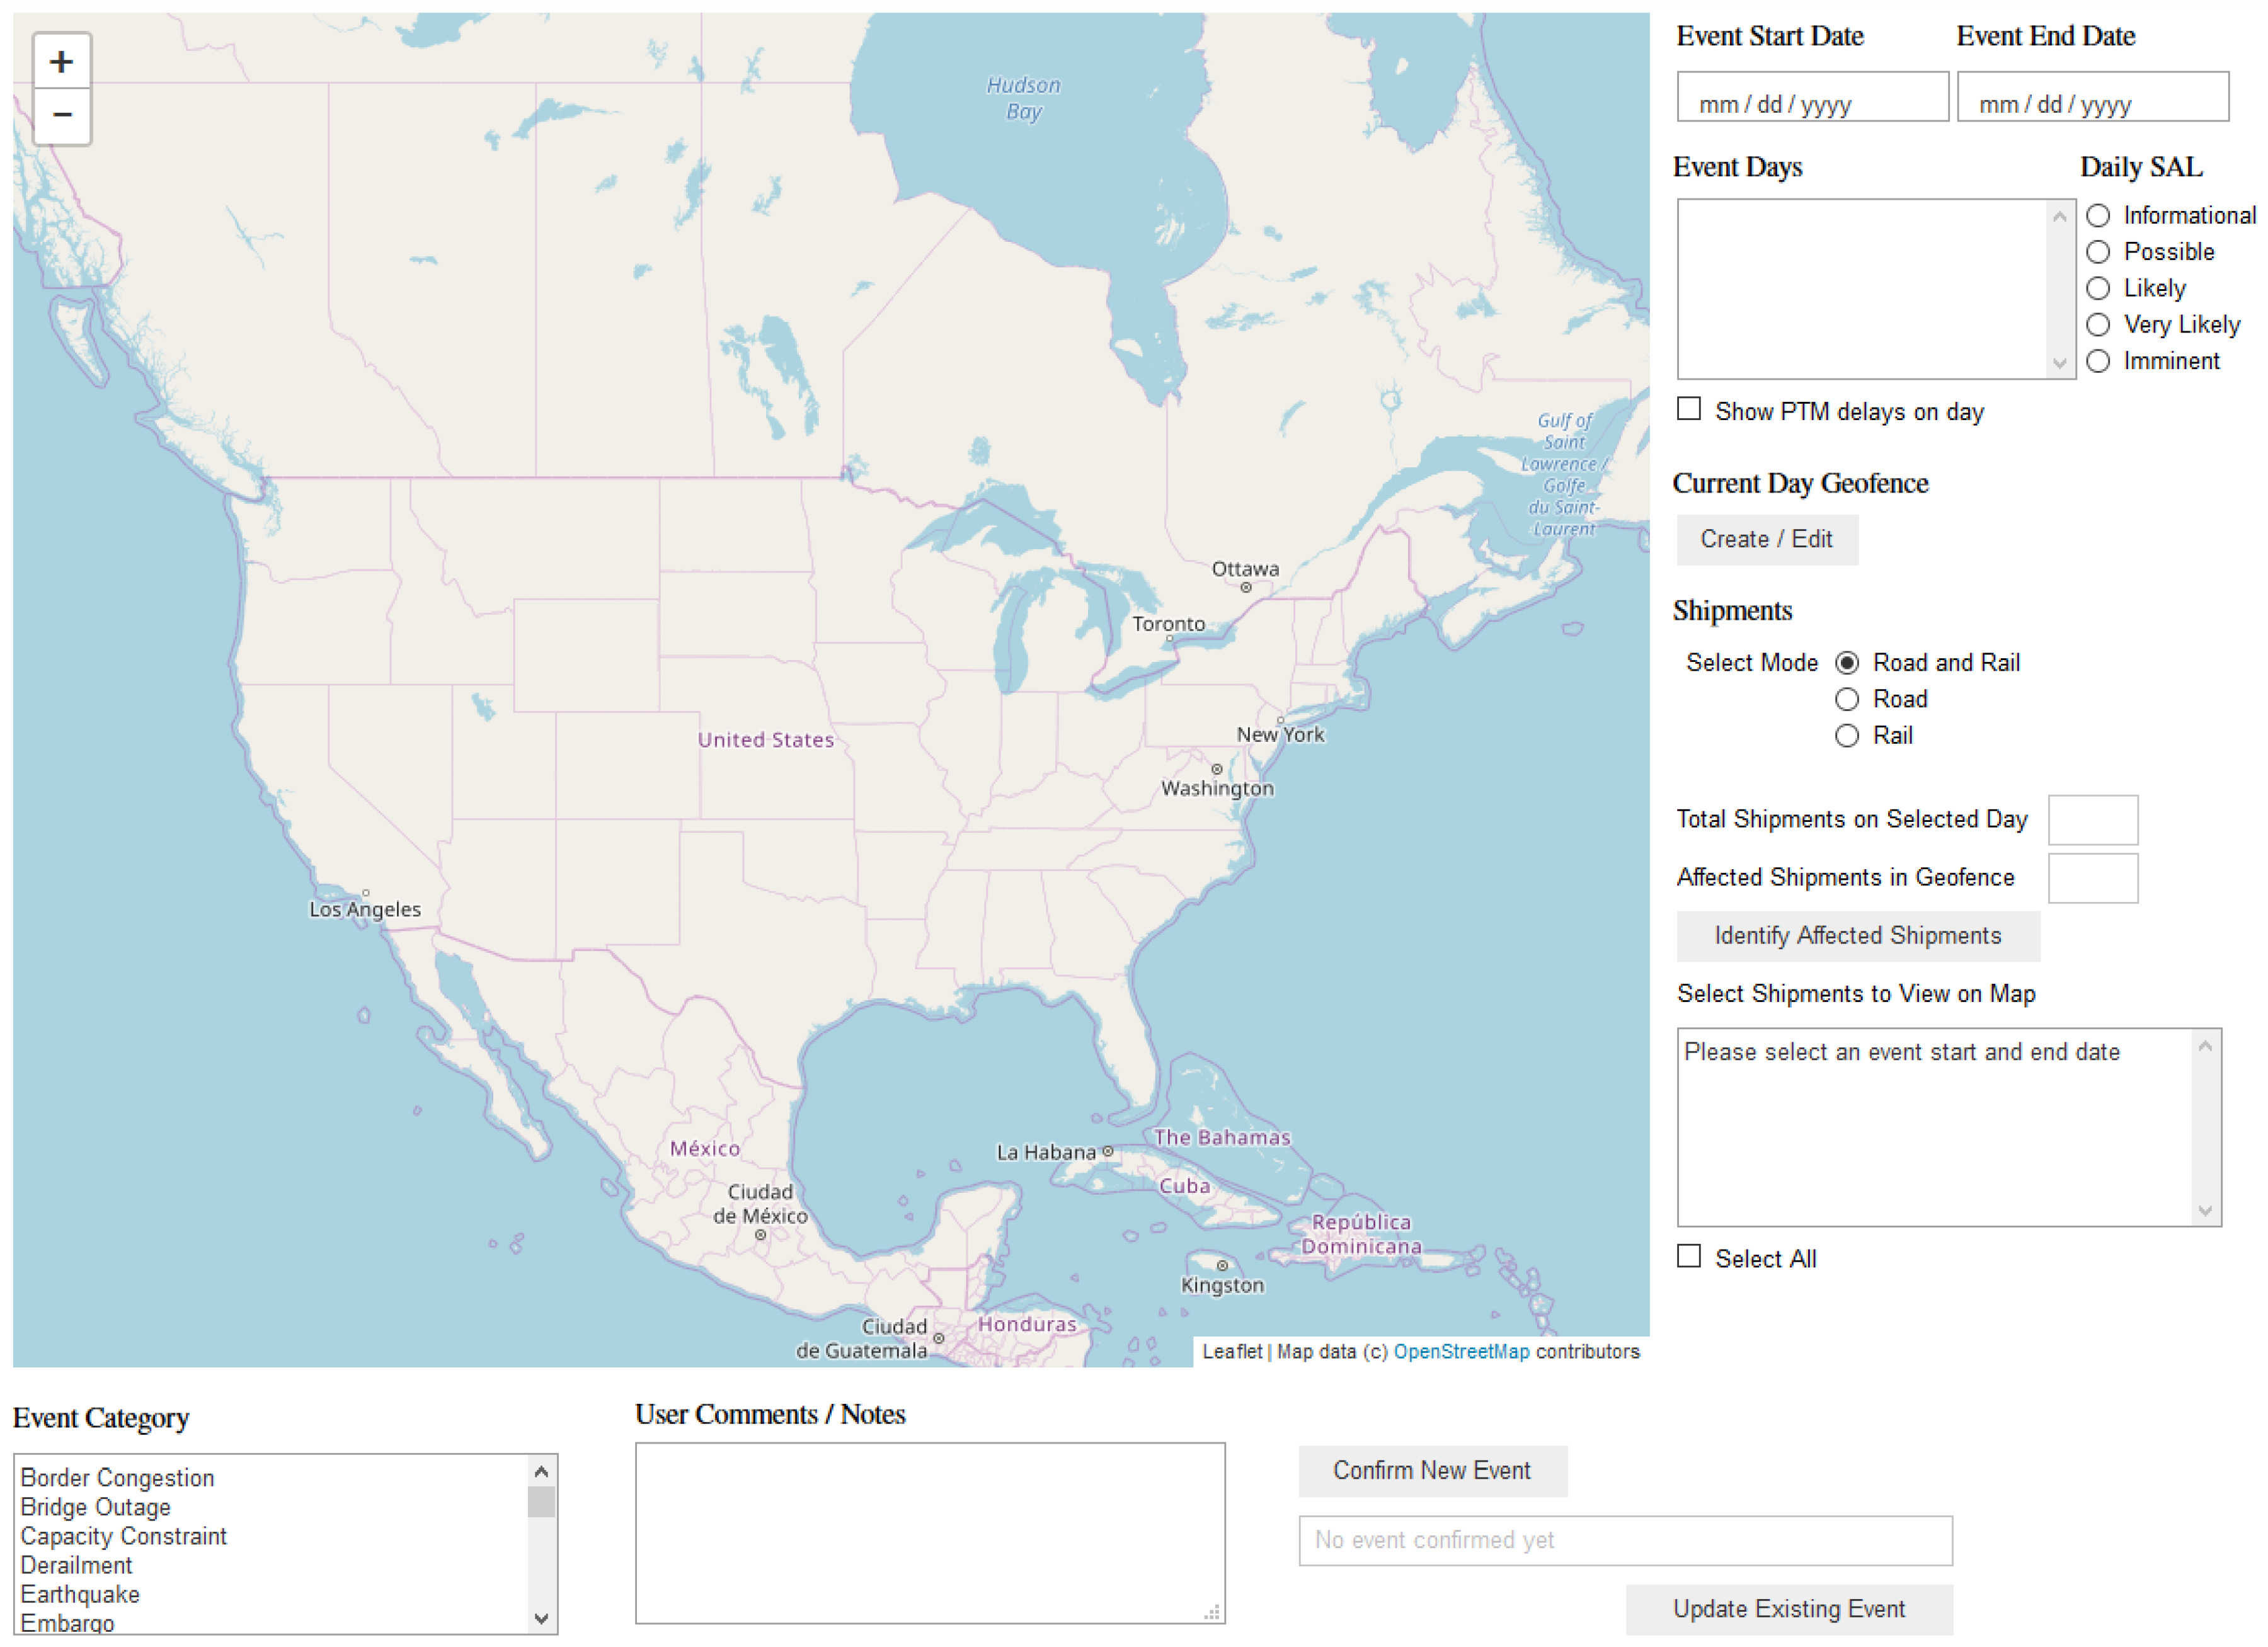
4.2. Code and Interface
4.3. Users
5. Conclusions
Author Contributions
Funding
Acknowledgments
Conflicts of Interest
Abbreviations
| GUI | Graphical user interface |
| RA | Risk assessment |
| SAL | Subjective assessment of likelihood |
| SCM | Supply chain management |
| SCEM | Supply chain and event management |
| SCRM | Supply chain risk management |
| SPS | Shipment priority score |
Nomenclature
| A customer weight | |
| Geofence longitude coordinate | |
| Geofence latitude coordinate | |
| a | Geofence major axis |
| b | Geofence minor axis |
| Geofence tilt angle | |
| Gaussian mean | |
| Gaussian covariance | |
| Gaussian variance component to | |
| Gaussian mixture coefficients | |
| Pearson correlation coefficient | |
| Mitigation indicator | |
| Subjective assessment of likelihood probability | |
| Gaussian mixture components | |
| Wishart distribution | |
| Precision matrix, the inverse of the covariance matrix | |
| Set of all shipments on within the specified time interval | |
| Set of affected shipments | |
| V | Wishart parameter matrix |
| Gamma distribution, | |
| L | Loss function for mapping risk (implemented as a look-up table) |
| Customer variable category | |
| Customer variable value | |
| Customer variable normalized value | |
| r | Risk |
| Risk threshold | |
| Shipment priority score |
Appendix A. Implementation Details
References
- Vishnu, C.; Sridharan, R.; Kumar, P.R. Supply chain risk management: Models and methods. Int. J. Manag. Decis. Mak. 2019, 18, 31–75. [Google Scholar]
- Bearzotti, L.A.; Salomone, E.; Chiotti, O.J. An autonomous multi-agent approach to supply chain event management. Int. J. Prod. Econ. 2012, 135, 468–478. [Google Scholar] [CrossRef]
- Savage, L.J. The Foundations of Statistics; Dover Publications, Inc.: Garden City, NY, USA, 1972. [Google Scholar]
- Jaynes, E.T. Probability Theory: The Logic of Science; Cambridge University Press: Cambridge, UK, 2003. [Google Scholar]
- Theodoridis, S. Bayesian learning: Inference and the EM algorithm. In Machine Learning: A Bayesian and Optimization Perspective; Academic Press: Cambridge, MA, USA, 2015; Chapter 12; p. 586. [Google Scholar]
- Duda, R.O.; Hart, P.E.; Stork, D.G. Bayesian decision theory. In Pattern Classification, 2nd ed.; Wiley-Interscience, John Willey & Sons Inc.: Hoboken, NJ, USA, 2001; Chapter 2; pp. 33–36. [Google Scholar]
- Bishop, C.M. Mixture of gaussians. In Pattern Recognition and Machine Learning; Springer: Berlin/Heidelberg, Germany, 2006; Chapter 2; pp. 110–113. [Google Scholar]
- Pearl, J. Probabilistic Reasoning in Intelligent Systems: Networks of Plausible Inference; Morgan Kaufmann: San Francisco, CA, USA, 1988. [Google Scholar]
- Koller, D.; Friedman, N. Probabilistic Graphical Models: Principles and Techniques; MIT Press: Cambridge, MA, USA, 2009. [Google Scholar]
- Raiffa, H.; Schlaifer, R. Applied Statistical Decision Theory; Division of Research, Graduate School of Business Administration: Harvard, MA, USA, 1961. [Google Scholar]
- Bishop, C.M. Exponential family. In Pattern Recognition and Machine Learning; Springer: Berlin/Heidelberg, Germany, 2006; Chapter 2; pp. 113–117. [Google Scholar]
- Berger, J.O. Utility and loss. In Statistical Decision Theory and Bayesian Analysis, 2nd ed.; Springer: Berlin/Heidelberg, Germany, 1985; Chapter 2; pp. 46–73. [Google Scholar]
- Archbold, J. Supply Chain Risk Alert; Technical Report 17-02-01; MxD Institute: Chicago, IL, USA, 2019. [Google Scholar]
- Van Rossum, G.; Drake, F.L., Jr. Python Tutorial; Centrum voor Wiskunde en Informatica Amsterdam: Amsterdam, The Netherlands, 1995. [Google Scholar]
- Kluyver, T.; Ragan-Kelley, B.; Pérez, F.; Granger, B.; Bussonnier, M.; Frederic, J.; Kelley, K.; Hamrick, J.; Grout, J.; Corlay, S.; et al. Jupyter notebooks—A publishing format for reproducible computational workflows. In Positioning and Power in Academic Publishing: Players, Agents and Agendas; Loizides, F., Schmidt, B., Eds.; IOS Press: Amsterdam, The Netherlands, 2016; pp. 87–90. [Google Scholar]
- Mease, J. Bringing ipywidgets Support to plotly. py. In Proceedings of the 17th Python in Science Conference (SciPy 2018), Austin, TX, USA, 9–15 July 2018; Available online: http://conference.scipy.org/proceedings/scipy2018/ (accessed on 15 May 2020).
- Derrough, J. Instant Interactive Map Designs with Leaflet JavaScript Library How-to; Packt Publishing Ltd.: Birmingham, UK, 2013. [Google Scholar]
- Jupyter-Team. Jupyterhub Documentation. Available online: https://jupyterhub.readthedocs.io/en/stable/ (accessed on 30 September 2019).


| Category | Numerical Value | Normalized Value |
|---|---|---|
| high | 3 | 0.375 |
| very high | 4 | 0.500 |
| critical | 8 | 1.000 |
| Category | Probability Range |
|---|---|
| Imminent | 0.95–1.00 |
| Very likely | 0.80–0.95 |
| Likely | 0.50–0.80 |
| Possible | 0.30–0.50 |
| Informational | 0.00–0.30 |
| Subjective Assessment of Likelihood | ||||||
|---|---|---|---|---|---|---|
| Informational | Possible | Likely | Very Likely | Imminent | ||
| 0–0.3 | 0.3–0.5 | 0.5–0.8 | 0.8–0.95 | 0.95–1.0 | ||
| SPS | 0.8−1.0 | 0 | 0.5 | 0.8 | 1 | 1 |
| 0.6−0.8 | 0 | 0.3 | 0.5 | 0.7 | 0.9 | |
| 0.4−0.6 | 0 | 0.1 | 0.3 | 0.4 | 0.5 | |
| 0.0−0.4 | 0 | 0.0 | 0.1 | 0.3 | 0.4 | |
© 2020 by the authors. Licensee MDPI, Basel, Switzerland. This article is an open access article distributed under the terms and conditions of the Creative Commons Attribution (CC BY) license (http://creativecommons.org/licenses/by/4.0/).
Share and Cite
Krystofik, M.; Valant, C.J.; Archbold, J.; Bruessow, P.; Nenadic, N.G. Risk Assessment Framework for Outbound Supply-Chain Management. Information 2020, 11, 417. https://doi.org/10.3390/info11090417
Krystofik M, Valant CJ, Archbold J, Bruessow P, Nenadic NG. Risk Assessment Framework for Outbound Supply-Chain Management. Information. 2020; 11(9):417. https://doi.org/10.3390/info11090417
Chicago/Turabian StyleKrystofik, Mark, Christopher J. Valant, Jeremy Archbold, Preston Bruessow, and Nenad G. Nenadic. 2020. "Risk Assessment Framework for Outbound Supply-Chain Management" Information 11, no. 9: 417. https://doi.org/10.3390/info11090417
APA StyleKrystofik, M., Valant, C. J., Archbold, J., Bruessow, P., & Nenadic, N. G. (2020). Risk Assessment Framework for Outbound Supply-Chain Management. Information, 11(9), 417. https://doi.org/10.3390/info11090417