Article

How Much Space Is Required? Effect of Distance, Content, and Color on External Human–Machine Interface Size

Chair of Ergonomics, Technical University of Munich, 85748 Garching, Germany
*
Author to whom correspondence should be addressed.
Information 2020, 11(7), 346; https://doi.org/10.3390/info11070346
Submission received: 3 May 2020 / Revised: 30 June 2020 / Accepted: 1 July 2020 / Published: 3 July 2020

Abstract

:
The communication of an automated vehicle (AV) with human road users can be realized by means of an external human–machine interface (eHMI), such as displays mounted on the AV’s surface. For this purpose, the amount of time needed for a human interaction partner to perceive the AV’s message and to act accordingly has to be taken into account. Any message displayed by an AV must satisfy minimum size requirements based on the dynamics of the road traffic and the time required by the human. This paper examines the size requirements of displayed text or symbols for ensuring the legibility of a message. Based on the limitations of available package space in current vehicle models and the ergonomic requirements of the interface design, an eHMI prototype was developed. A study involving 30 participants varied the content type (text and symbols) and content color (white, red, green) in a repeated measures design. We investigated the influence of content type on content size to ensure legibility from a constant distance. We also analyzed the influence of content type and content color on the human detection range. The results show that, at a fixed distance, text has to be larger than symbols in order to maintain legibility. Moreover, symbols can be discerned from a greater distance than text. Color had no content overlapping effect on the human detection range. In order to ensure the maximum possible detection range among human road users, an AV should display symbols rather than text. Additionally, the symbols could be color-coded for better message comprehension without affecting the human detection range.

1. Introduction

The process of introducing automated vehicles (AVs) into road traffic is progressing. In urban areas in particular, a gradual change is taking place towards mixed traffic, including AVs, human drivers, cyclists, and pedestrians. From automation level 2 and higher, the system sustains lateral and longitudinal vehicle motion control [1], which could directly impact the nature of the interactions between the AV and road users in the surroundings. One approach for enabling communication of AVs with their environments is to use external human–machine interfaces (eHMIs). These are displays mounted on the surface of the vehicle [2,3], light strips [4,5,6], and projections on the road [7,8]. These devices enable AVs to indicate, for instance, their status, perception, or intention [9] in relevant scenarios, such as at intersections, in parking lots, in narrow spaces, or in merging traffic [10,11]. Current research is almost exclusively devoted to the question of what content these interfaces should display in order for them to be comprehensible to pedestrians [12] or human drivers [2]. Based on a comprehensible eHMI design, the interaction is comfortable, efficient, and safe if the human interaction partner has enough time to perceive and process the eHMI content and act accordingly. The dynamics of road traffic and the time required by the receiver result in a certain lead time within which the AV has to communicate its message. In turn, a minimum content size is required in which the AV has to display its message.
For the purpose of dimensioning the eHMI, this paper makes reference to the road bottleneck scenario from two previous studies [2,7], with obstacles on both sides of the road due to double-parked vehicles. In this scenario, an AV and a simultaneously oncoming human driver negotiate the right of way within a 30 km/h speed limit zone. The AV displays its message to the human driver at a distance of 100 m. Rettenmaier, Pietsch, and Bengler [7] recommend that in such a bottleneck scenario an AV should communicate via a display mounted on the front of the vehicle, in order for the interaction to be efficient and safe. Front-mounted displays are particularly suitable for communication purposes in straight-approach scenarios [13]. Owing to the high dynamics and relative speeds of the AV and the human driver when approaching the road bottleneck, the resulting required eHMI size exceeds that which would be needed for interactions in a tighter space. Thus, the determined size is also suitable for communicating with pedestrians in road crossing scenarios in which the AV’s communication commences at a shorter distance between the AV and the pedestrian, for instance, 45 m [4] or 50 m [12]. Despite all its positive potentials, one disadvantage of communicating via displays is that the content size must be large to be viewed at a distance [14]. However, there was no research found that deals with the question of how large text or symbols need to be with respect to content and color in order for them to be legible from a particular distance. As there are as yet no standards governing the design of eHMIs, this paper investigates the size that displayed text or symbols must have, in order for them to render a message legibly in a bottleneck scenario.

2. Objectives

The present study aims to determine the content size required to render distinct communication at a certain distance for different content types. An additional aim is to examine the influence of content color and content type on the human detection range, which we defined as the distance from which a certain content size is legible. For this purpose, we developed an eHMI prototype (Section 3) including a package space analysis (Section 3.1), ergonomic requirements (Section 3.2), the selection of hardware and software (Section 3.3), and the presentation of the final prototype (Section 3.4). We conducted a study involving 30 participants (Section 4) to analyze the effects of distance, content type, and content color on the required content size, and we set up the following research questions (RQs):
  • RQ1: Is there any difference in the required content size for it to be legible at a certain distance depending on the content type?
  • RQ2: Is there any difference in the human detection range depending on the content type?
  • RQ3: Is there any difference in the human detection range depending on the content color?

3. Development of External HMI Prototype

3.1. Package Space Analysis of Existing Vehicle Models

An AV communicates with an oncoming human driver via its external display. For this reason, the vehicle front is the only surface suitable for displaying information. This surface can be divided into the bumper, radiator grille, headlights, hood, windshield, and rear of the side mirrors. The area of the side mirrors is small and incoherent, while the projection area of the hood is small in the vertical plane. Moreover, the AV’s passenger must be able to use the windshield for monitoring the driving scene, while the function of the headlights is to illuminate the road ahead. For these reasons, we considered the bumper and the radiator grille as suitable areas for implementing the eHMI, as the radiator grille is no longer required for engine cooling in an electric vehicle. It is also a suitable area for displaying messages from the AV in straight approach scenarios [13].
We selected three car models to represent each of the six vehicle categories of the Commission for European Communities (mini cars, small cars, large cars, executive cars, luxury cars, and sport utility cars) [15]. The selection was based on the new registration data published by the German Federal Motor Transport Authority for the month of June 2019 [16]. The vehicle’s front dimensions were determined by digital measurement of the official dimensions given in a technical drawing and subdividing this area into individual sections for the radiator grille and the bumper (Figure 1). The scale of the technical drawing was recorded, while the pixel size and, in turn, the size of the defined sections were calculated using a digital pixel meter. The potential eHMI size dimensions were determined as the minimum height (H) of the radiator grille and the bumper together (Mercedes C-Class: 459 mm) and the minimum width (W) of the radiator grille (VW Up: 772 mm) of all car models.

3.2. Ergonomic Requirements

Due to the complexity of the driving task during manual driving, it is necessary that all pertinent information is easily and comfortably legible for drivers. Similarly, the eHMI must be legible at all times of day and night. During the day, the required luminance of the display varies between 1000 cd/m2 [18] and 5000 cd/m2 [19] for outdoor use. At night, the eHMI must not be so bright as to dazzle nearby road users. Therefore, the display luminance must be adjustable so as not to impair the eye’s adaptability to changes in light levels [20]. Another requirement is that the eHMI should display bright text and symbols on a dark background and not the other way around since this display mode is suitable for day and night use [21]. The contrast ratio of the display between the text/symbol and the background should be 5:1 at high brightness and at least 3:1 at common brightness levels [18].
The symbols on the display should have a minimum visual angle of 20 min of arc (MOA). The minimum visual angle of text written in Latin letters must be 16 MOA and 20–22 MOA for comfortable reading. Moreover, the ratio between letter height and letter width should be 0.7:1–0.9:1. The line width of sans-serif fonts should be 10–17% of the letter height, and there should be a space of one line width between letters [20].
The letter or symbol height requirements specify the minimum display height. The number of letters in a word limit the minimum display width.

3.3. Hardware and Software

The prototype consists of 12 outdoor light-emitting diode (LED) modules made by Coreman Technology Co. [22]. Each red-green-blue (RGB) LED matrix measures 256 × 128 mm with 62 × 32 pixels and a pixel distance of 4 mm. The minimum visual angle of 20 MOA at a distance of 100 m, as considered in the bottleneck scenario [2,7], has a matrix height H = 582 mm. The available package space dimensions are W = 772 mm and H = 459 mm. The 4 × 3 matrix layout has a size of W = 768 mm and H = 512 mm, with a resolution of 192 × 128 pixels. This represents a good compromise between the theoretically required space and the available space. The luminance of each module is higher than 6000 cd/m2, resulting in a maximum illuminance of 2358 cd when the whole matrix illuminates in full brightness in white. This exceeds the limit value of 1200 cd [23] prescribed for road traffic. Since fewer than 50% of the pixels illuminate for displaying symbols and letters, the illuminance is lower than the legally required threshold.
The working temperature of the module is between −30 °C and +55 °C. The LED matrix is controlled by a Raspberry Pi 4 Computer Model B with 2 GB of memory and a quad-core 64-bit processor with a frequency of 1.5 Hz [24]. The prototype uses the official operating system Raspbian, based on Debian GNU/Linux. The LED matrix is controlled by a laptop via a remote desktop connection. The LED matrix is controlled by an open source C++ library [25]. It is, therefore, able to display pictures, texts, and animations [26].

3.4. Final eHMI Prototype

Figure 2 shows the final eHMI prototype. The LED modules are screw-fitted to a frame made from aluminum sheets. The prototype satisfies the visual angle requirements of 20 MOA at a distance of 88 m between display and participant pursuant to DIN EN ISO 9241-303 [20] with a display size of 768 × 512 mm. This eHMI display distance is less than the 100 m used in the previous studies [2,7], on which the present investigation is based, but it would provide the human driver in the bottleneck scenario sufficient time to interact comfortably with the AV [27].

4. Evaluation of External HMI Prototype

4.1. Sample

Thirty participants took part in the experiment. As no data were discarded, there were 30 valid data sets in the study. The age of the sample was M = 31.07 years (SD = 12.54 years). The age span ranged from 18 years to 69 years. Nineteen participants were male and 11 were female. Eighteen participants had a visual impairment, which was corrected in 17 cases in the course of the experiment and not corrected in one case. Additionally, there was one participant with red-green deficiency. We refrained from excluding these two data sets from the analysis, as persons with visual impairments also participate in real road traffic. The eye test [28,29] resulted in a visual acuity of M = 1.47 (SD = 0.37). The visual acuity ranged from 0.8 to 2.0. The participants were recruited at the Technical University of Munich and did not receive an expense allowance.

4.2. Display Content

Figure 3 shows the three different content types displayed by the eHMI prototype during experiment 1 and experiment 2 (Figure 4). The text fulfills the ergonomic requirements (Section 3.2). In experiment 1, we chose to display four letters, since this number was easily readable from a distance of 88 m in a pre-test. In experiment 2, the eHMI displayed five letters (E, P, C, F, D). In both experiments, the eHMI displayed cryptic chunks of letters, so that it was hardly possible to guess the sequence of letters. To avoid the effect of varying legibility for different letters, the display showed the same letters for each participant, but in a randomized order. The letters were derived from one row of the Snellen chart. In addition to text, the prototype also displayed two types of symbols. The arrow and the “E” from the E chart were visualized in four degrees of rotation (0°, 90°, 180°, 270°) such that the limbs of the E and the arrow tip were pointing up, down, to the left, or to the right. The content size is defined throughout this article as the height of the text or the height of the arrow and the E in the orientation given in Figure 3. Even if the arrow is rotated by 90°, its size is the distance from the end of the arrow to its tip.

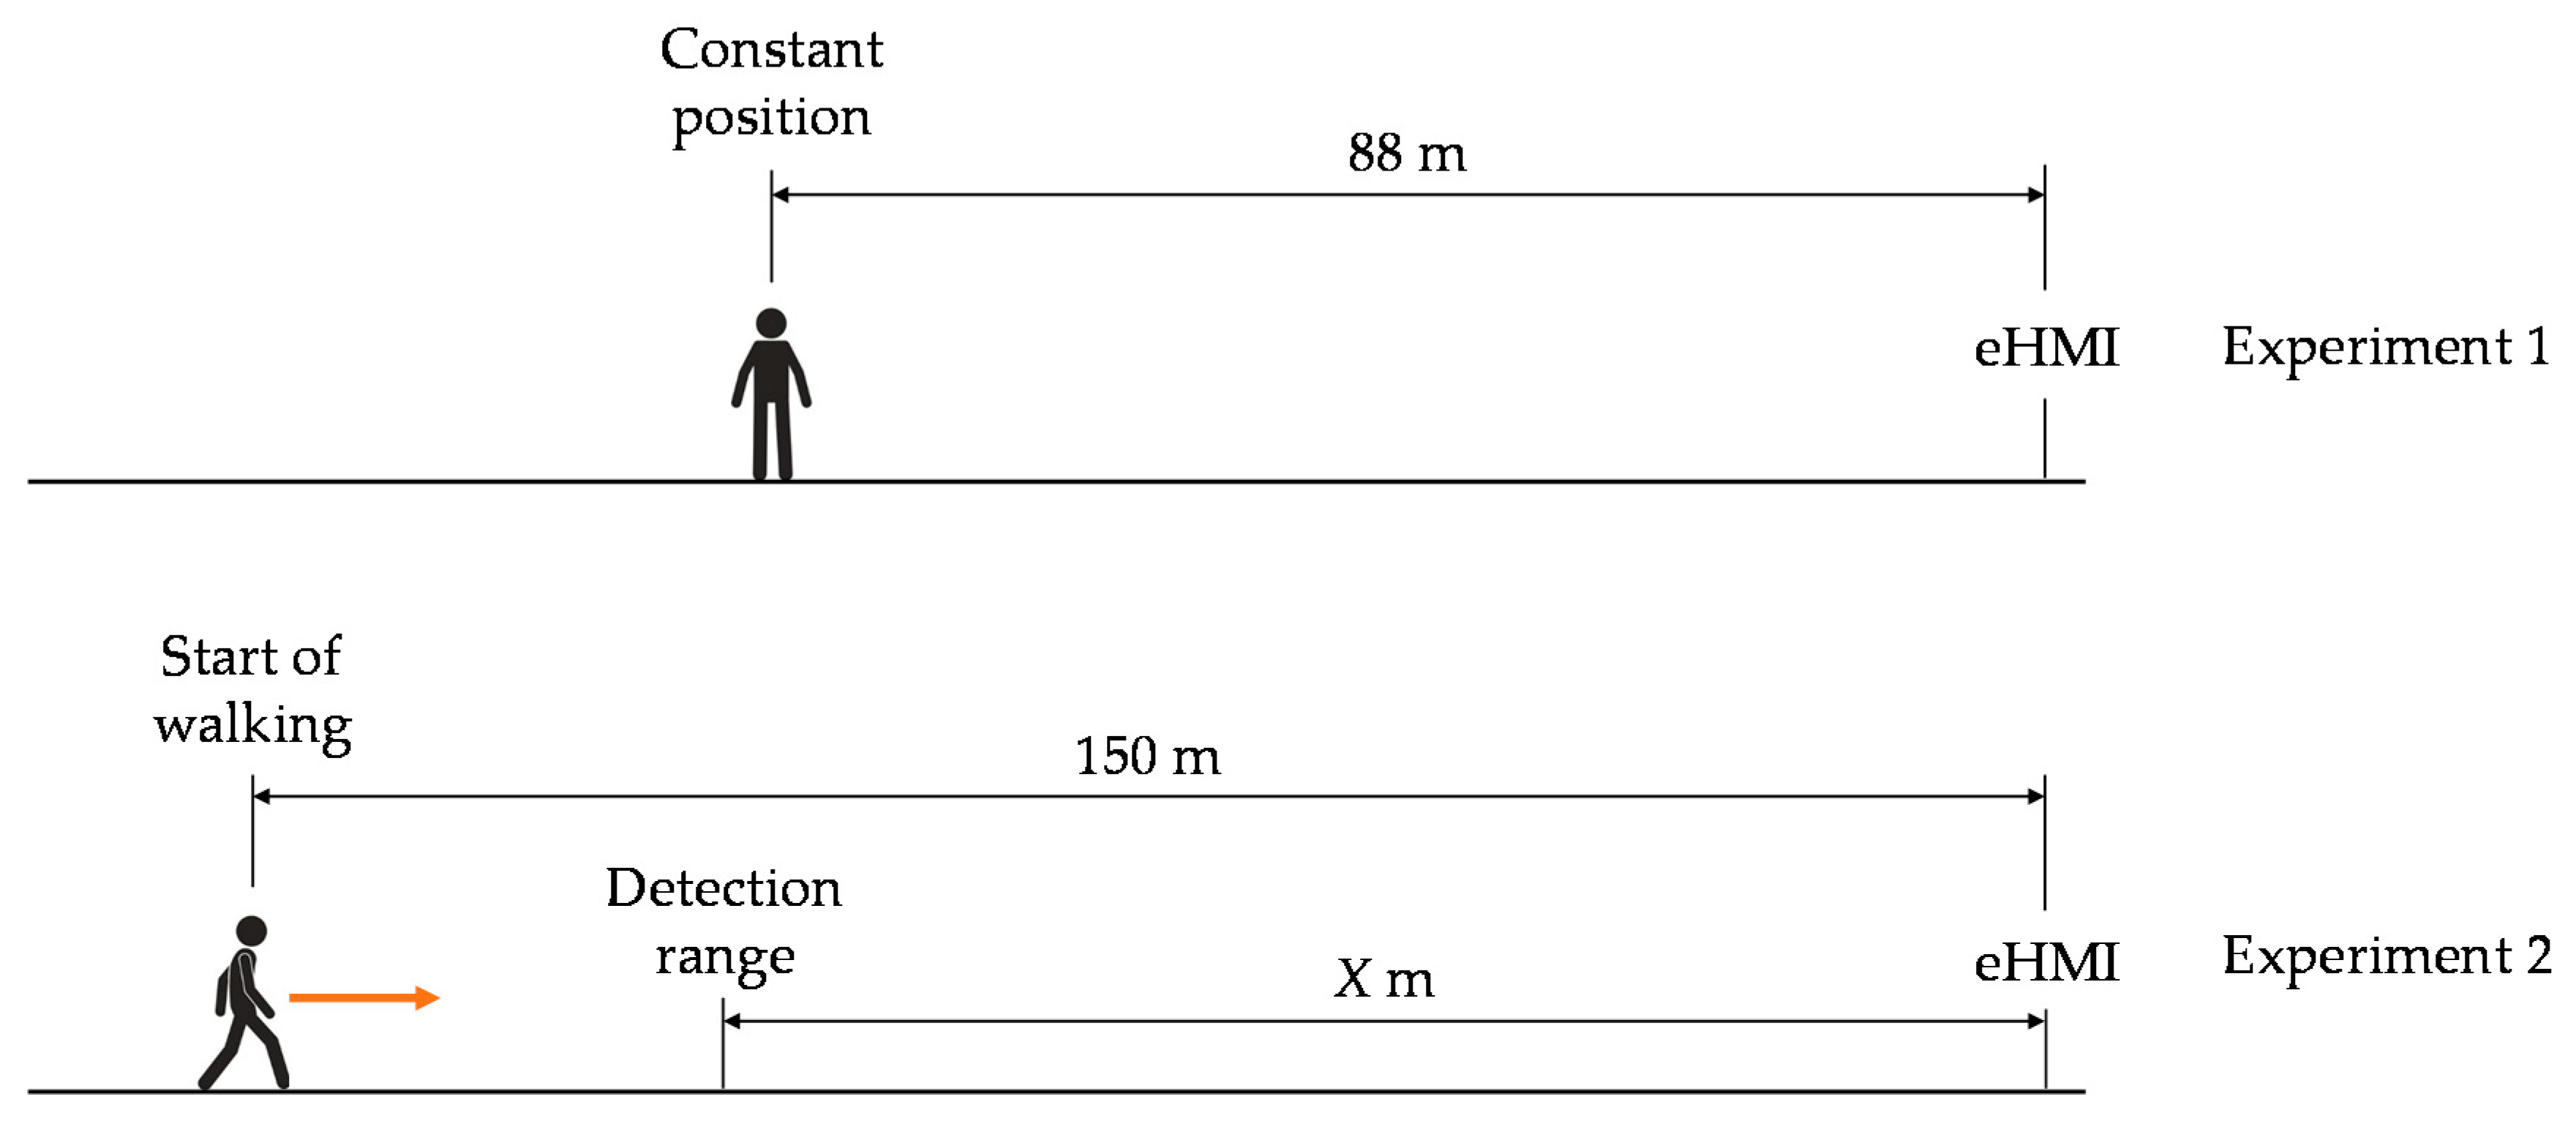
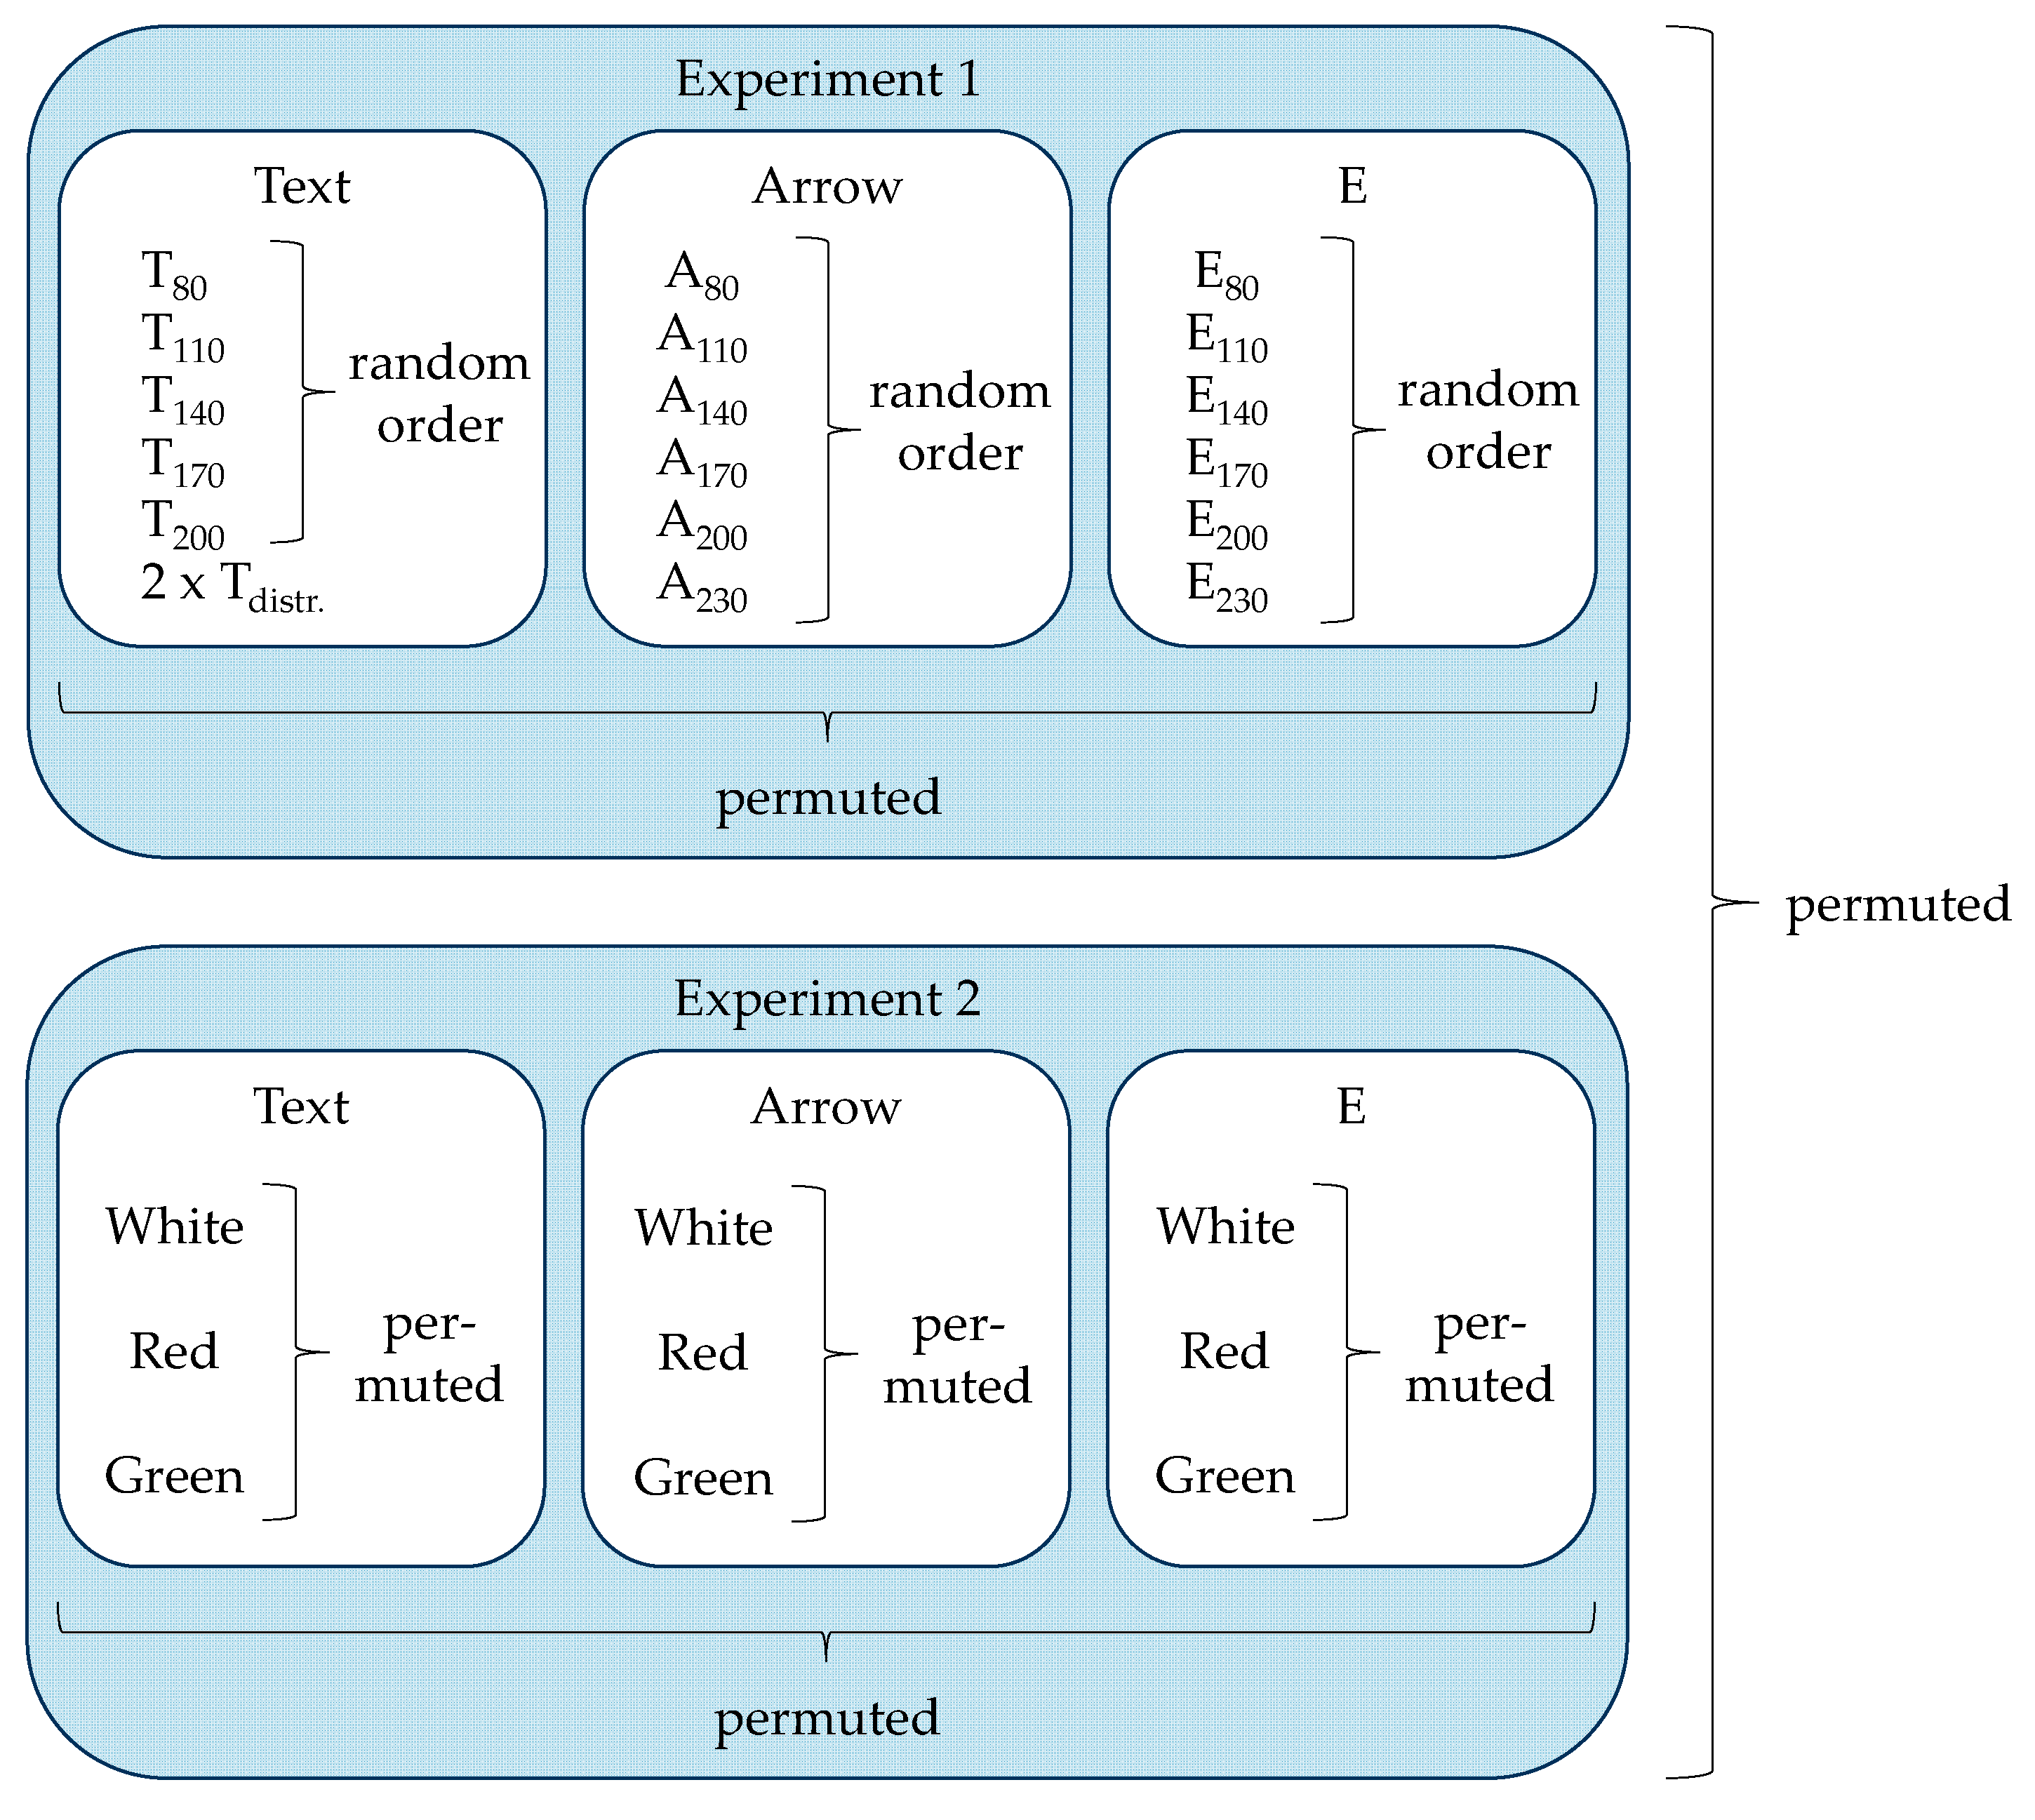
4.3. Experimental Design

It was necessary to conduct two experiments (Figure 4) in order to obtain answers to the research questions. In experiment 1, the participants were at a constant distance of 88 m to the prototype. This distance corresponds to the recommended visual angle of 20 MOA for a prototype height of 512 mm [20]. Following a pre-test, the symbols were scaled to six sizes (ranging from 80 mm to 230 mm), while the text was scaled to five different sizes (from 80 mm to 200 mm) (Table 1) for determining the size required for it to be legible at a distance of 88 m. In experiment 1, the prototype displayed the message in white (R = 255, G = 255, B = 255), since this represents the highest contrast to the LED matrix.
Experiment 2 analyzed the effect of content type and content color on the human detection range. The size of symbols and texts was set to 164 mm, which made it possible to display five letters on the prototype. Additionally, texts and symbols were displayed in the colors white (R = 255, G = 255, B = 255), red (R = 255, G = 0, B = 0), and green (R = 0, G = 255, B = 0). We decided to use red and green in addition to white, as they are already familiar in the context of traffic as an indication of either yielding or insisting on the right of way. In experiment 2, the participants approached the eHMI prototype from a distance of 150 m. The participants stopped at a distance X from the eHMI as soon as the content type became legible and thus their detection range was attained.
The participants performed experiment 1 and experiment 2 in a permuted order (Figure 5). In experiment 1, the participants read the text (in five different sizes), the arrow (in six different sizes), and the E (in six different sizes) in a permuted order. The text segment of the experiment also displayed two distracting text blocks, in which letters appeared twice, after the first text and after the third text, such that the participants could not assume that the respective letters only appeared once within a text. The data from these two distractor texts were not considered in the evaluation.
In experiment 2, the participants approached the prototype displaying the text, arrow, and E three times each. In each of the three parts, the message was displayed once in white, red, and green.

4.4. Procedure

Once they had been duly informed about the experiment, the participants gave their written consent to take part in the study. They then filled in a demographic questionnaire, which included questions on age and gender. The participants were also asked to indicate whether they had any visual impairment or color vision deficiency. Afterwards, they underwent eye testing using the software FrACT 3.10.2 [29], which displayed the Landolt-C on a computer monitor. The participants had to discern in which of the eight possible positions the Landolt-C opening appeared. The distance between monitor and participant and the number of trials can be configured in the software. The participants then received the instructions for the study, after which experiment 1 and experiment 2 were conducted in a permuted order. The participants were not subject to time limits when identifying the displayed items. Prior to the experiments, the illuminance was measured directly at the eHMI prototype because of the possibility of ambient illumination affecting contrast requirements [30]. The average illuminance was M = 2812 lx (SD = 1092 lx), with a range of 132 lx to 5483 lx. The total duration of the experiment was about 45 min.

4.5. Dependent Variables

The correctness of the text and symbol identification was evaluated in both experiments. The text was correctly identified and was considered legible if the participant read the sequence of letters in the right order. The arrow and the E were considered legible if the respective symbol and its orientation were correctly identified. In experiment 2, the participants additionally had to state the content color for correct identification. In experiment 1, the content size required for legibility at a distance of 88 m was calculated from the correctly identified content data, while the human detection range from which content of a certain size became legible was investigated in experiment 2.
Experiment 1 collected subjective data regarding the legibility of content, the concentration required for identifying the content, and the participants’ confidence in having correctly identified the content, each on a 5-point Likert scale (Table 2). Experiment 2 collected subjective data regarding the participants’ confidence in having identified the eHMI content correctly.

4.6. Statistical Analysis

Data preparation was performed with Excel and the statistical analysis was conducted using the software JASP [31]. In experiment 1, since the data were not normally distributed, we applied a Friedman test to analyze the content size required for legibility from a constant distance of 88 m. Post hoc comparisons were conducted using Wilcoxon tests and a Bonferroni correction was applied. The effect size of the Friedman test was classified using Kendall’s W (small effect: W = 0.1; medium effect: W = 0.3; large effect: W = 0.5). In the case of the Wilcoxon tests, we classified the effect sizes with the Pearson moment correlation r (small effect: r = 0.1; medium effect: r = 0.3; large effect: r = 0.5) [32].
In experiment 2, we chose to conduct three ANOVAs to evaluate the effect of both content type and content color. The assumption of sphericity (Mauchly’s test: p > 0.05) was always fulfilled. In both cases, we performed a Bonferroni correction. We refrained from analyzing content type and content color within a single ANOVA, as there were values missing for the text, which would have resulted in the exclusion of nine participants in the analysis as a whole. Our approach allowed the data of these participants to be at least partially incorporated into the statistical analysis. We rated the effect sizes by applying η p 2 (small effect: η p 2 = 0.01; medium effect: η p 2 = 0.06; large effect: η p 2 = 0.14) for the ANOVA and Cohen’s benchmark d (small effect: d = 0.2; medium effect: d = 0.5; large effect: d = 0.8) for the post-hoc comparisons [32].

5. Results

5.1. Experiment 1

5.1.1. Effect of Content Size

Table 3 shows the absolute number and the percentage of correct identifications according to content size. All participants usually recognized the three largest sizes, regardless of the content. The only exception was one participant who could not identify the orientation of the arrow at a size of 170 mm. At a size of 110 mm and 80 mm, the number of correct identifications of the text was considerably lower than the number of correct identifications of the arrow and the E.
Figure 6 shows the content size from which the participants could correctly identify the contents. The text was identified correctly at a size of Mdn = 110 mm. The arrow (Mdn = 95 mm) and the E (Mdn = 95 mm) could be identified at a smaller size. The Friedman test reveals a significant effect of content type on the required content size (Χ2 = 14.59, p < 0.001, Kendall’s W = 0.549). The post-hoc comparisons using Wilcoxon tests (Table 4) show significant differences between the text and the arrow and between the text and the E, each with a large effect.

5.1.2. Subjective Results

Table 5 contains the participants’ subjective ratings of legibility, concentration, and confidence on a 5-point Likert scale. In the case of legibility and concentration, the two biggest content sizes include high ratings of Mdn = 4 and Mdn = 5. The two smallest content sizes produce low ratings of Mdn = 2 and Mdn = 1. As for their confidence in identifying the display content, the participants gave high ratings for the biggest four content sizes and considerably lower ones for the two smallest content sizes.

5.2. Experiment 2

Effect of Content Type and Content Color

Figure 7 shows the detection range from which the participants were able to identify the eHMI content for each content color. The text implies the smallest distance to the prototype for all three colors (Table 6). Table 7 contains the three ANOVAs, one for each color, to evaluate the effect of the content type. For all colors, there were significant effects of the content type on the detection range with large effect sizes. Post-hoc comparisons for the color white (Table 8) reveal significant differences with a medium effect between the text and the arrow and a large effect between the text and the E. The analysis of the red content indicates a significant difference between the text and the E, with a medium effect. The post-hoc comparison of the green content shows significant differences between all three content types with a large effect between the text and the E and medium effect sizes between the text and the arrow as well as between the arrow and the E.
We analyzed the influence of content color by conducting three ANOVAs (Table 9). For text, there was a significant difference with regard to the color, with a large effect. Post-hoc comparisons (Table 10) reveal a significant difference in the distance between the colors white and red and a significant difference between the colors red and green, each with a medium effect.

6. Discussion

6.1. Effect of Content Type

An increase in content size increases the legibility of the display content regardless of the content type, reflected by the higher numbers of correct identifications from a distance of 88 m, as well as by the participants’ higher legibility ratings. Moreover, the concentration required for identifying the content decreases and the confidence in identifying it increases. An increase in text or symbol size leads to the display content taking up more space in the total area of the prototype. Since the brightness of each LED was the same within a color scheme in all trials, the use of larger texts or symbols results in a greater number of illuminated LEDs and thus higher luminance of the message. Additionally to the larger visual angle with large content sizes, with an increase in luminance, there is also a rise in the participants’ visual acuity [33], showing that larger content sizes result in increasing legibility.
Text and symbols should be at least 140 mm high to be legible from a distance of 88 m. The participants rated their confidence in identifying the display content as sure (Mdn = 4) for all content types. Moreover, the percentage of correct identifications drops considerably with smaller content sizes. For safety-critical interactions with AVs at a road bottleneck, the oncoming human driver must always be able to identify the message with confidence. Moreover, in real traffic interactions, environmental factors such as vehicle body movements, as well as the driving activity itself, distract the driver from focusing on the eHMI. We can therefore state that the AV should display its message in a slightly larger size than the minimum value. We recommend a value of between 170 mm (6.64 MOA) and 200 mm (7.81 MOA), as these sizes resulted in participants feeling very confident in identifying the display content. For this content size, a display width of 768 mm was sufficient for displaying different symbols and small blocks of text comprising four to five letters, such as “WALK”, “GO”, “OK”, and “STOP”, as proposed in several studies [12,34,35].
According to the standard DIN EN ISO 9241-303 [20], 170 mm is the size that should be used at distances of less than 29 m, while the content size for a distance of 88 m should be 512 mm to comply with a recommended visual angle of 20 MOA. However, according to our findings, a content size of 6.64 MOA to 7.81 MOA is sufficient for good legibility. This result underlines the importance of new international standards for future eHMI development. The transferability of findings from guidelines on technology, task, and environment-independent performance specifications and recommendations [20] is not applicable.
Symbols require a smaller size than text for them to be legible, which coincides with the findings of Kline, Ghali, Kline, and Brown [36]. Moreover, symbols of equal size were legible over longer distances than text. The prototype displayed the symbols individually and not surrounded by other elements. The letters within the text did not stand alone and were not delimited from each other, which complicated the correct identification of individual letters. In addition, it can be assumed that the contours of texts and symbols were blurred by the haze effect [20], which depends, among other things, on the relative atmospheric humidity [37]. Even though the haze effect affects symbols and text equally, the contours of text tend to merge in letters that are close together. The impact of haze and the small distances between multiple letters resulted in the text being misread in 13 attempts in experiment 2. The blurred delimitation of individual letters led to confusion, for instance, between the letters C, O, and G, as well as between F and P. In contrast to text identification, participants expected the symbol to be displayed, which means that the symbol type was already identified and only its orientation had to be determined. For safety-critical AV–human driver interaction at road bottlenecks, these findings imply that standalone symbols should be used for communication in order to achieve the most accurate identification and the greatest possible legibility of the AV’s message. Moreover, taking into account the comments of the participants, it can be concluded that if using arrows for communication, the arrow tips should be designed more distinctly to improve identification of its orientation. This is reflected in the lower legibility rating of the arrow compared with the distinct orientation of the E for sizes greater than 170 mm.

6.2. Effect of Content Color

The statistical analysis showed that the effect of color was significant for displaying text, in a way that the color red was found to be readable from greater distances, although this color had the lowest contrast ratio. There was no significant effect of symbol color on the human detection range. This finding may be due to the fact that contrast and luminance are confounded variables [30] and thus human visual performance varies with different ratios of contrast and luminance [38]. The red light may have affected the contrast–luminance ratio between several letters in favor of better legibility. All in all, we can state that the influence of color was negligible, which corresponds with the findings of Lin [39], who showed that the color of letters has no significant effect on the visual performance of text identification on TFT-LCD monitors.
We recommend the use of symbols for AV communication (Section 6.1). As the factor of color has no effect on the human detection range, we are free to use red, green or white in an eHMI design in order to attain good legibility. Moreover, the display provides color fidelity at viewing angles of less than 140°, and humans are able to perceive the colors red and green in an area of 65° and 60° respectively [40]. Therefore, in straight approach scenarios like the AV–human driver interaction at a road bottleneck, it is possible to communicate via color and, at the same time, there is no risk of reducing the human detection range. This fact enables coding of AV messages via colors, leading to faster reaction times if the color meets the expectation of the human interaction partner [41]. Red and green are familiar from traffic in the context of yielding or insisting on the right of way. As an example, when texts are green, participants perceive a higher level of safety to cross the street [42], while using symbols in green to communicate to yield the right of way at a road bottleneck enables an efficient and safe passage for the human driver [2].

6.3. Limitations

The sample taking part in the study consisted mainly of young participants between the ages of 25 years and 30 years. This means that a considerable proportion of human drivers were not represented. Elderly people, in particular, are more likely to suffer from vision deficiency such as impaired contrast sensitivity [43], which can influence the results of the experiments. A future study should therefore use an age-balanced sample.
Moreover, in contrast to interactions at road bottlenecks, the participants identified the display content without sitting in a vehicle. Thus, the investigation did not take into account the potential influence of the windshield on the legibility of the display. Additionally, vehicle body movements and dirt can impair the eHMI’s legibility in real traffic. A further limitation is that the absence of any driving activity means that participants can devote their full attention to the display. To counteract these effects, we did not recommend a content size of 140 mm for display legibility, but calculated a range of 170 mm–200 mm for use in eHMI designs.
The experiments were conducted on dry winter days. Thus, the analysis did not consider the influence of summer light conditions or rainfall. Before conducting the experiments, we measured the illuminance. Initial analysis indicated an effect of illuminance on the human detection range such that an increase in illuminance led to an increase in range. We refrained from presenting this result in the present paper, because in addition to illuminance, there are several other parameters, such as luminance distribution, light color, and glare [44], which characterize real-life lighting conditions, while haze [37] and thus legibility are affected by air humidity and fog. Therefore, we could not assign the effect only to illuminance. To investigate the influence of individual factors, these need to be isolated and examined in a controlled environment in future work.

7. Conclusions

Content type significantly influences the required display size, with a large effect. Symbols can be displayed in a smaller size than text for them to be legible from a constant distance. Moreover, symbols can be identified at a greater distance than text, which means that in the same scenario the human interaction partner has more time to perceive and process an AV’s message in the form of a symbol. In the bottleneck scenario, we state that the height of the display content should be 170 mm (6.64 MOA) to 200 mm (7.81 MOA), as this leads to very good legibility at a distance of 88 m and the majority of the participants were able to identify the smaller content in experiment 2 from even greater distances. In addition, this recommendation considers potential environmental influences that may negatively affect legibility.
Regardless of the display content, we did not find a content overlapping effect of color on the human detection range. The influence of color was only significant when displaying text. In conclusion, we state that in order to ensure the widest possible range of AV communication, the colors investigated in this study are suitable for displaying simple symbols without running the risk of negatively influencing legibility. Therefore, color coding in addition to the symbol shape can be employed in the interests of good legibility and communicating AV messages more clearly.

Author Contributions

Conceptualization, M.R. and J.S.; data curation, M.R. and J.S.; formal analysis, M.R. and J.S.; funding acquisition, K.B.; investigation, M.R. and J.S.; methodology, M.R. and J.S.; project administration, M.R.; software, J.S.; supervision, K.B.; validation, M.R. and J.S.; visualization, M.R.; writing—original draft, M.R.; writing—review and editing, M.R. All authors have read and agreed to the published version of the manuscript.

Funding

The German Federal Ministry of Economics and Energy funded this research within the project @City: Automated Cars and Intelligent Traffic in the City, grant number 19A17015B.

Conflicts of Interest

The authors declare no conflicts of interest.

References

  1. SAE International. Taxonomy and Definitions for Terms Related to Driving Automation Systems for On-Road Motor Vehicles (J3016); SAE International: Warrendale, PA, USA, 2018. [Google Scholar]
  2. Rettenmaier, M.; Albers, D.; Bengler, K. After you?!—Use of external human-machine interfaces in road bottleneck scenarios. Transp. Res. Part F 2020, 70, 175–190. [Google Scholar] [CrossRef]
  3. Clamann, M.; Aubert, M.; Cummings, M.L. Evaluation of Vehicle-to-Pedestrian Communication Displays for Autonomous Vehicles. In Proceedings of the 96th Annual Transportation Research Board Meeting, Washington DC, USA, 8–12 January 2017. [Google Scholar]
  4. Habibovic, A.; Lundgren, V.M.; Andersson, J.; Klingegård, M.; Lagström, T.; Sirkka, A.; Fagerlönn, J.; Edgren, C.; Fredriksson, R.; Krupenia, S.; et al. Communicating Intent of Automated Vehicles to Pedestrians. Front. Psychol. 2018, 9, 1336. [Google Scholar] [CrossRef] [PubMed]
  5. Faas, S.M.; Baumann, M. Yielding Light Signal Evaluation for Self-driving Vehicle and Pedestrian Interaction. In Human Systems Engineering and Design II; Ahram, T., Karwowski, W., Pickl, S., Taiar, R., Eds.; Springer International Publishing: Cham, Switzerland, 2019; pp. 189–194. [Google Scholar]
  6. Faas, S.M.; Baumann, M. Light-Based External Human Machine Interface: Color Evaluation for Self-Driving Vehicle and Pedestrian Interaction. Proc. Hum. Factors Ergon. Soc. Annu. Meet. 2019, 63, 1232–1236. [Google Scholar] [CrossRef]
  7. Rettenmaier, M.; Pietsch, M.; Schmidtler, J.; Bengler, K. Passing through the Bottleneck - The Potential of External Human-Machine Interfaces. IEEE Intell. Veh. Symp. 2019, 1687–1692. [Google Scholar] [CrossRef]
  8. Dietrich, A.; Willrodt, J.-H.; Wagner, K.; Bengler, K. Projection-Based External Human Machine Interfaces—Enabling Interaction between Automated Vehicles and Pedestrians. In Proceedings of the DSC 2018 Europe VR, Antibes, France, 5–7 September 2018. [Google Scholar]
  9. Faas, S.M.; Mathis, L.-A.; Baumann, M. External HMI for self-driving vehicles: Which information shall be displayed? Transp. Res. Part F 2020, 68, 171–186. [Google Scholar] [CrossRef]
  10. Kaß, C.; Schoch, S.; Naujoks, F.; Hergeth, S.; Keinath, A.; Neukum, A. Standardized Test Procedure for External Human–Machine Interfaces of Automated Vehicles. Information 2020, 11, 173. [Google Scholar] [CrossRef] [Green Version]
  11. Habibovic, A.; Andersson, J.; Lundgren, V.M.; Klingegård, M.; Englund, C. External Vehicle Interfaces for Communication with Other Road Users? Road Veh. Autom. 2019, 19, 91–102. [Google Scholar] [CrossRef]
  12. De Clercq, K.; Dietrich, A.; Núñez Velasco, J.P.; De Winter, J.; Happee, R. External Human-Machine Interfaces on Automated Vehicles: Effects on Pedestrian Crossing Decisions. Hum. Factors 2019, 61, 1353–1370. [Google Scholar] [CrossRef] [Green Version]
  13. Eisma, Y.B.; Van Bergen, S.; Ter Brake, S.M.; Hensen, M.T.T.; Tempelaar, W.J.; De Winter, J.C.F. External Human–Machine Interfaces: The Effect of Display Location on Crossing Intentions and Eye Movements. Information 2020, 11, 13. [Google Scholar] [CrossRef] [Green Version]
  14. Schieben, A.; Wilbrink, M.; Kettwich, C.; Madigan, R.; Louw, T.; Merat, N. Designing the interaction of automated vehicles with other traffic participants: Design considerations based on human needs and expectations. Cogn. Technol. Work 2019, 21, 69–85. [Google Scholar] [CrossRef] [Green Version]
  15. Regulation (EC) No 139/2004 Merger Procedure; Office for Official Publications of the European Communities: Luxembourg, 2009. Available online: https://pdfs.semanticscholar.org/00f1/09017a252e7b49b2b92e1c00000ca7e9b5ba.pdf (accessed on 20 April 2020).
  16. Kraftfahrt Bundesamt. Neuzulassungen von Personenkraftwagen nach Segmenten und Modellreihen im Juni 2019. 2019. Available online: https://www.kba.de/DE/Statistik/Fahrzeuge/Neuzulassungen/Segmente/2019/2019_segmente_node.html (accessed on 20 April 2020).
  17. Auto Portal Angurten.de. BMW 5er Touring (G31): Abmessungen und Technische Daten. Available online: https://www.angurten.de/is/abmessungen/1681-bmw-5er-touring/1.htm#abmes-sungsbilder (accessed on 20 April 2020).
  18. Andrén, B.; Brunnström, K.; Wang, K. Readability of Displays in Bright Outdoor Surroundings. Sid Symp. Dig. Tech. Pap. 2014, 45, 1100–1103. [Google Scholar] [CrossRef]
  19. Luft, H. LED Leitfaden. 2016, pp. 1–13. Available online: https://www.dbz.de/download/1243759/dbz-leitfaden-2014-led.pdf (accessed on 20 April 2020).
  20. German Institute for Standardization. Ergonomics of Human-System Interaction—Part 303: Requirements for Electronic Visual Displays (ISO 9241-303:2008); German Registered Association: Berlin, Germany, 2009. [Google Scholar]
  21. German Institute for Standardization. Road Vehicles—Ergonomic Aspects of Transport Information and Control Systems—Specifications and Test Procedures for In-Vehicle Visual Presentation (ISO 15008:2017); German Registered Association: Berlin, Germany, 2017. [Google Scholar]
  22. Coreman Technology Co. Products. Available online: http://www.coreman.cc/product_list.asp?bid=73 (accessed on 20 April 2020).
  23. Regulation No 87 of the Economic Commission for Europe of the United Nations (UN/ECE)—Uniform Provisions Concerning the Approval of Daytime Running Lamps for Power-Driven Vehicles. In Official Journal of the European Union; United Nations Economic Commission for Europe: Geneva, Switzerland, 2009.
  24. Model, B. (Ed.) Raspberry Pi 4 Computer; Raspberry Pi Trading Ltd.: Cambridge, UK, 2019. Available online: https://www.raspberrypi.org/ (accessed on 20 April 2020).
  25. Zeller, H. Rpi-Rgb-Led-Matrix [Computer Software]. Available online: https://github.com/hzeller/rpi-rgb-led-matrix (accessed on 20 April 2020).
  26. Zeller, H. Rpi-Rgb-Led-Matrix. Available online: https://github.com/hzeller/rpi-rgb-led-matrix/tree/master/utils (accessed on 20 April 2020).
  27. Rettenmaier, M.; Bengler, K. Modeling the Interaction with Automated Vehicles in Road Bottleneck Scenarios. Proc. Hum. Factors Ergon. Soc. Annu. Meet. 2020. accepted. [Google Scholar]
  28. Bach, M. The Freiburg Visual Acuity Test - Automatic Measurement of Visual Acuity. Optom. Vis. Sci. 1996, 73, 49–53. [Google Scholar] [CrossRef] [PubMed]
  29. Bach, M. The Freiburg Visual Acuity Test-Variability Unchanged by Post-Hoc Re-Analysis. Graefes Arch. Clin. Exp. Ophthalmol. 2007, 245, 965–971. [Google Scholar] [CrossRef]
  30. Rogers, S.P.; Spiker, V.A.; Cicinelli, J. Luminance and luminance contrast requirements for legibility of self-luminous displays in aircraft cockpits. Appl. Ergon. 1986, 17, 271–277. [Google Scholar] [CrossRef]
  31. JASP Team. JASP (Version 0.11.1) [Computer Software]. 2019. Available online: https://jasp-stats.org/faq/how-do-i-cite-jasp/ (accessed on 20 April 2020).
  32. Cohen, J. Statistical Power Analysis for the Behavioral Sciences, 2nd ed.; Lawrence Erlbaum Associates: Mahwah, NJ, USA, 1988; ISBN 0-8058-0283-5. [Google Scholar]
  33. Foxell, C.A.; Stevens, W.R. Measurements of visual acuity. Br. J. Ophthalmol. 1955, 39, 513–533. [Google Scholar] [CrossRef] [Green Version]
  34. Fridman, L.; Mehler, B.; Xia, L.; Yang, Y.; Facusse, L.Y.; Reimer, B. To Walk or Not to Walk: Crowdsourced Assessment of External Vehicle-to-Pedestrian Displays. arXiv 2017, arXiv:1707.02698. [Google Scholar]
  35. Song, Y.E.; Lehsing, C.; Fuest, T.; Bengler, K. External HMIs and Their Effect on the Interaction Between Pedestrians and Automated Vehicles. In Intelligent Human Systems Integration; Karwowski, W., Ahram, T., Eds.; Springer International Publishing: Cham, Switzerland; pp. 13–18.
  36. Kline, T.J.B.; Ghali, L.M.; Kline, D.W.; Brown, S. Visibility Distance of Highway Signs among Young, Middle-Aged, and Older Observers: Icons Are Better than Text. Hum. Factors 1990, 32, 609–619. [Google Scholar] [CrossRef]
  37. He, Y.; Gu, Z.; Lu, W.; Zhang, L.; Okuda, T.; Fujioka, K.; Luo, H.; Yu, C.W. Atmospheric humidity and particle charging state on agglomeration of aerosol particles. Atmos. Environ. 2019, 197, 141–149. [Google Scholar] [CrossRef]
  38. Zhu, Z.; Wu, J. On the standardization of VDT’s proper and optimal contrast range. Ergonomics 1990, 33, 925–932. [Google Scholar] [CrossRef]
  39. Lin, C.C. Effects of screen luminance combination and text color on visual performance with TFT-LCD. Int. J. Ind. Ergon. 2005, 35, 229–235. [Google Scholar] [CrossRef]
  40. Woodson, W.E.; Conover, D.W. Human Engineering Guide for equipement Designers; University of California Press: Berkeley, CA, USA, 1964. [Google Scholar]
  41. Tanaka, J.W.; Presnell, L.M. Color diagnosticity in object recognition. Percept. Psychophys. 1999, 61, 1140–1153. [Google Scholar] [CrossRef] [Green Version]
  42. Bazilinskyy, P.; Dodou, D.; De Winter, J. Survey on eHMI concepts: The effect of text, color, and perspective. Transp. Res. Part F 2019, 67, 175–194. [Google Scholar] [CrossRef]
  43. Owsley, C. Aging and vision. Vis. Res. 2011, 51, 1610–1622. [Google Scholar] [CrossRef] [PubMed] [Green Version]
  44. German Institute for Standardization. Light and Lighting—Lighting of Work Places—Part 1: Indoor Work Places; German Version EN 12464-1:2011, 2011 (12464-1); German Registered Association: Berlin, Germany, 2011. [Google Scholar]
Figure 1. Dimensioning of the vehicle front using the technical drawing [17] of a BMW 5 Touring model as an example. We divided the front into separate radiator grille and bumper sections.
Information 11 00346 g001
Figure 2. The external human–machine interface (eHMI) prototype developed and evaluated in the present investigation. The content colors do not match the real colors due to the display angle and camera distortion.
Information 11 00346 g002
Figure 3. The three different content types displayed by the eHMI in the present study.
Information 11 00346 g003
Figure 4. Experiment 1 evaluated the required content size for it to be legible from a distance of 88 m. Experiment 2 analyzed the human detection range (X) depending on content type and content color.
Information 11 00346 g004
Figure 5. Experimental design dividing the study into two experiments. Both the experiments and the different content types within each experiment were presented in a permuted order.
Information 11 00346 g005
Figure 6. Content size from which the text and symbols were correctly identified (n = 30).
Information 11 00346 g006
Figure 7. Distance from which the display content could be identified correctly divided by content type and content color.
Information 11 00346 g007
Table 1. Content sizes used in experiment 1. The distance from which the respective size has a visual angle of 20 min of arc (MOA) is presented according to DIN EN ISO 9241-303 [20].
Size (mm)80110140170200230
Distance (m)13.7518.9124.0629.2234.3839.53
Table 2. The three items used to collect subjective data.
Item5-Point Likert Scale
Legibility:Please rate the legibility of the displayed text (symbol).Very poor to very good
Concentration:Please rate the degree of concentration required to read (identify) the text (symbol).Very high to very low
Confidence:How sure are you that you have read (identified) the text (symbol) correctly?Very unsure to very sure
Table 3. Correct identification in absolute and relative terms (n = 30).
Size (mm)
23020017014011080
Text-30 (100%)30 (100%)28 (93%)20 (67%)4 (13%)
Arrow30 (100%)30 (100%)29 (97%)29 (97%)27 (90%)16 (53%)
E30 (100%)30 (100%)30 (100%)29 (97%)26 (87%)15 (50%)
Table 4. Post-hoc comparisons using Wilcoxon tests.
Wpr
TextArrow29.000.0060.695
TextE27.000.0020.743
ArrowE43.000.8840.055
Note: A Bonferroni correction was applied, and the corrected level of significance was set to α = 0.0167.
Table 5. Subjective participant ratings on a 5-point Likert scale with regard to legibility, concentration, and confidence (n = 30).
Size (mm)
23020017014011080
Legibility:Please rate the legibility of the displayed text (symbol).
(1 = very poor, 5 = very good)
Text-543.521
Arrow443.5321
E554321
Concentration:Please rate the degree of concentration required to read (identify) the text (symbol).
(1 = very high, 5 = very low)
Text-44321
Arrow443321
E544321
Confidence:How sure are you that you have read (identified) the text (symbol) correctly?
(1 = very unsure, 5 = very sure)
Text-55421
Arrow554431
E55542.51
Table 6. Descriptive data giving the distance from which the display content could be identified divided by content type and content color.
WhiteRedGreen
Text, M (SD)110.04 m (20.84 m), n = 27116.85 m (19.96 m), n = 26108.71 m (18.93 m), n = 24
Arrow, M (SD)125.17 m (24.71 m), n = 30125.37 m (23.14 m), n = 30121.03 m (26.04 m), n = 30
E, M (SD)123.70 m (20.61 m), n = 30128.90 m (19.15 m), n = 30124.30 m (20.81 m), n = 30
Table 7. Statistics for the ANOVAs conducted to evaluate the effect of content type with respect to content color.
Fdfp η p 2
White (n = 27)10.7042, 52<0.0010.292
Red (n = 26)5.7132, 500.0060.186
Green (n = 24)19.2672, 46<0.0010.456
Note: A Bonferroni correction was applied, and the corrected level of significance was set to α = 0.0167.
Table 8. Post-hoc comparisons analyzing the content type.
pbonfCohen’s d
White
TextArrow0.0030.707
TextE<0.0010.854
ArrowE1.0000.034
Red
TextArrow0.0860.456
TextE0.0070.666
ArrowE0.8410.216
Green
TextArrow0.0090.677
TextE<0.0011.306
ArrowE0.0350.558
Table 9. Statistics for the ANOVAs conducted to evaluate the effect of content color with respect to content type.
Fdfp η p 2
Text (n = 21)5.8592, 400.0060.227
Arrow (n = 30)1.1452, 580.3250.038
E (n = 30)1.9432, 580.1520.063
Note: A Bonferroni correction was applied, and the corrected level of significance was set to α = 0.0167.
Table 10. Post hoc comparisons analyzing the text color.
pbonfCohen’s d
WhiteRed0.0460.579
WhiteGreen1.0000.097
RedGreen0.0060.770

