Article

Feature Analysis of Degradation Signal of Rolling Stock Lateral Damper

School of Mechanical, Electronic and Control Engineering, Beijing Jiaotong University, Beijing 100044, China
*
Author to whom correspondence should be addressed.
Information 2020, 11(6), 298; https://doi.org/10.3390/info11060298
Submission received: 3 May 2020 / Revised: 21 May 2020 / Accepted: 26 May 2020 / Published: 1 June 2020
(This article belongs to the Special Issue Signal Processing and Machine Learning)

Abstract

:
The lateral damper is one of the key components of rolling stock. Establishing the relationship between the degraded signal and the health state of the lateral damper is important in order to perform timely performance detection and fault diagnosis. This paper proposes a wavelet packet cross-correlation method (WPCC) that is based on wavelet packet transform (WPT) and cross-correlation analysis (CCA). First, the vibration signals under different running speeds, different running conditions, and different track excitations were collected and analyzed. Second, the wavelet packet transform was used to select larger energy band signals for reconstruction. Subsequently, the WPCC coefficient was calculated between the reference signal and the signal to be measured. The proposed method was applied to analysis of vibration signals of the lateral damper performance degradation. The lateral damper health condition was divided into four intervals, and the average accuracy calculated under different running speeds, different running conditions, and different track excitation was 95%.

1. Introduction

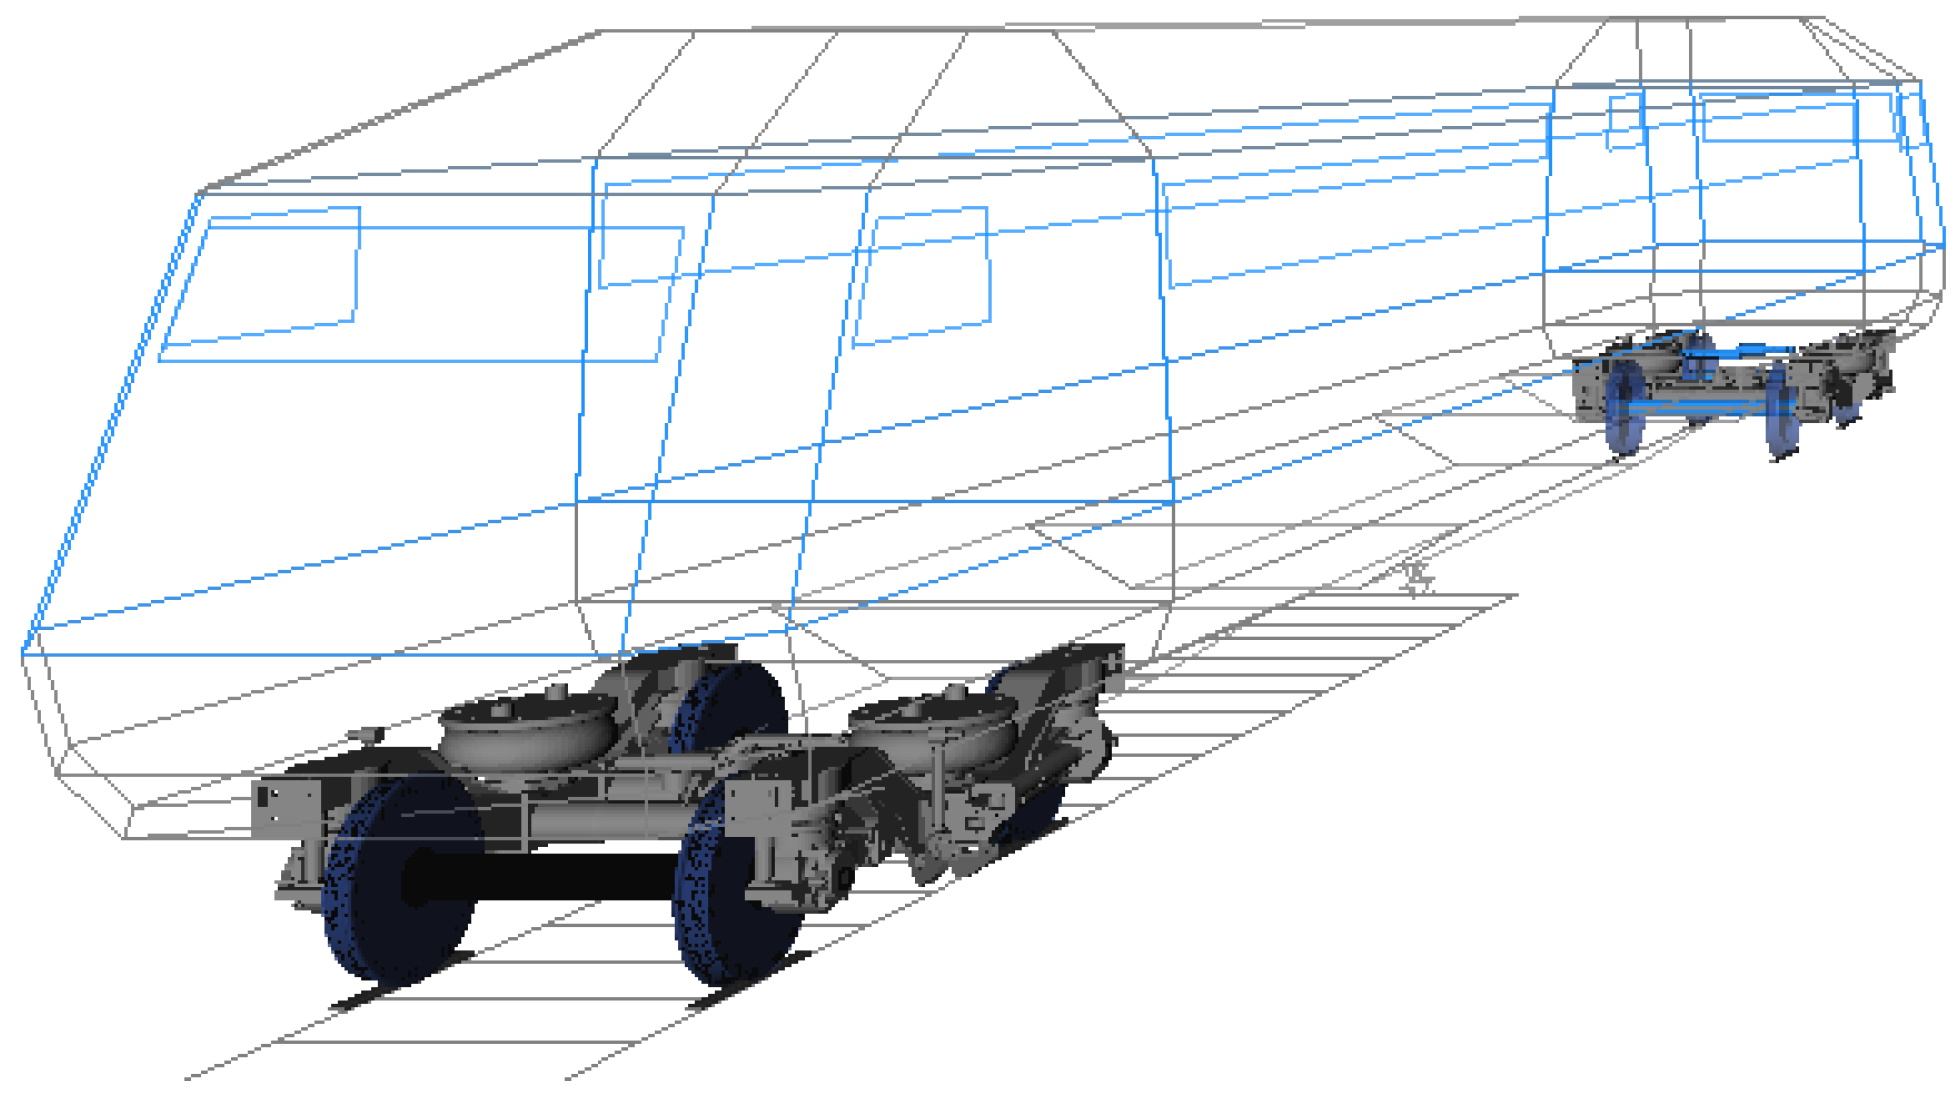
The research and development of rolling stock technology has made the running speed of trains continue to increase. At the same time, the requirements for the stability and comfort of the train are becoming more stringent. The lateral damper is one of the key components that affect the running performance of the train. The vibration can be effectively suppressed in the lateral direction of the train, and to ensure riding performance [1]. In the course of use, the lateral damper will undergo a process of failure from normal to degradation, due to various internal and external factors. Different running states of rolling stock will show different data characteristics. The current maintenance method of lateral dampers is regular maintenance. As the running speed increases, the future development trend will inevitably be to carry out state maintenance to identify the health status of components. The establishment of the relationship between different states and signal data is what is missing from regular to state repair. The key to research is feature extraction and state recognition, and the problem is the identification of early degradation states. There is an urgent need to explore new feature extraction and feature selection methods to more effectively realize the health state recognition of lateral dampers. The faults of high-speed train systems and key components are often expressed in the form of various signals. Using appropriate feature analysis methods, the working status of components can be directly obtained from the signals to achieve the purpose of status recognition and fault diagnosis. Early signal analysis research focused on classic signal analysis methods. Traditional signal processing methods, such as spectrum analysis, Fourier analysis, envelope analysis, correlation analysis, and maximum entropy spectrum analysis, played a huge role in system and component state recognition. Li Tan [2] adopted principal component analysis (PCA) and multi-fractal analysis method in order to analyze the vibration characteristics of trains during single failure and cross-mixing failure of key components of high-speed trains. Yu Y [3] adopted empirical mode decomposition (EMD) and adaptive short-time Fourier transform (STFT) diagnosis method to diagnose the faults of railway freight rolling bearings. The results showed that the method could effectively obtain fault information in the time-frequency domain. Zeng Hua et al. [4] used time-domain statistical methods to calculate the root mean square of the bogie vibration signal and analyzed the frequency response characteristics of the vibration transfer function between each position. Guo-Liang S. [5] proposed a state estimation method of wavelet packet energy moment that was effective for accurately estimating different faults of high-speed train. When compared with other time domain and frequency domain analysis, the wavelet packet analysis method can effectively eliminate the interference of noise in the fault signal, and it has better sensitivity and stability to features. Therefore, this paper used wavelet packet analysis to extract the features of the fault signal.
Presently, a variety of state recognition methods have been developed in the field of fault state recognition, mainly divided into methods that are based on qualitative empirical knowledge, methods based on analytical models and methods based on data-driven. Lin S. [6] used principal component analysis (PCA) and rough set-based fault identification method for train door fault identification. The comparison found that, although the PCA method can determine whether a fault has occurred, it cannot perform fault identification. Li Yong [7] combined Hilbert transform and Berg spectrum estimation method to extract the time-frequency and spectrum characteristics of the fault current signal, and used the binary classification support vector machines as a high-impedance ground fault classifier for the traction network, which can effectively identify the fault type of the traction network, and obtain a high classification accuracy rate. Since the degree of performance degradation is gradual, it cannot be divided into several fixed fault types, so it is unreasonable to use a classifier, such as a support vector machine, to evaluate the degree of performance degradation. References [8,9] applied cross correlation analysis to transformer internal fault identification and bearing fault diagnosis, and achieved certain results. When compared with classification methods, such as support vector machines, cross-correlation analysis can effectively extract minor differences between signals, so it is suitable for early degraded signal feature analysis.
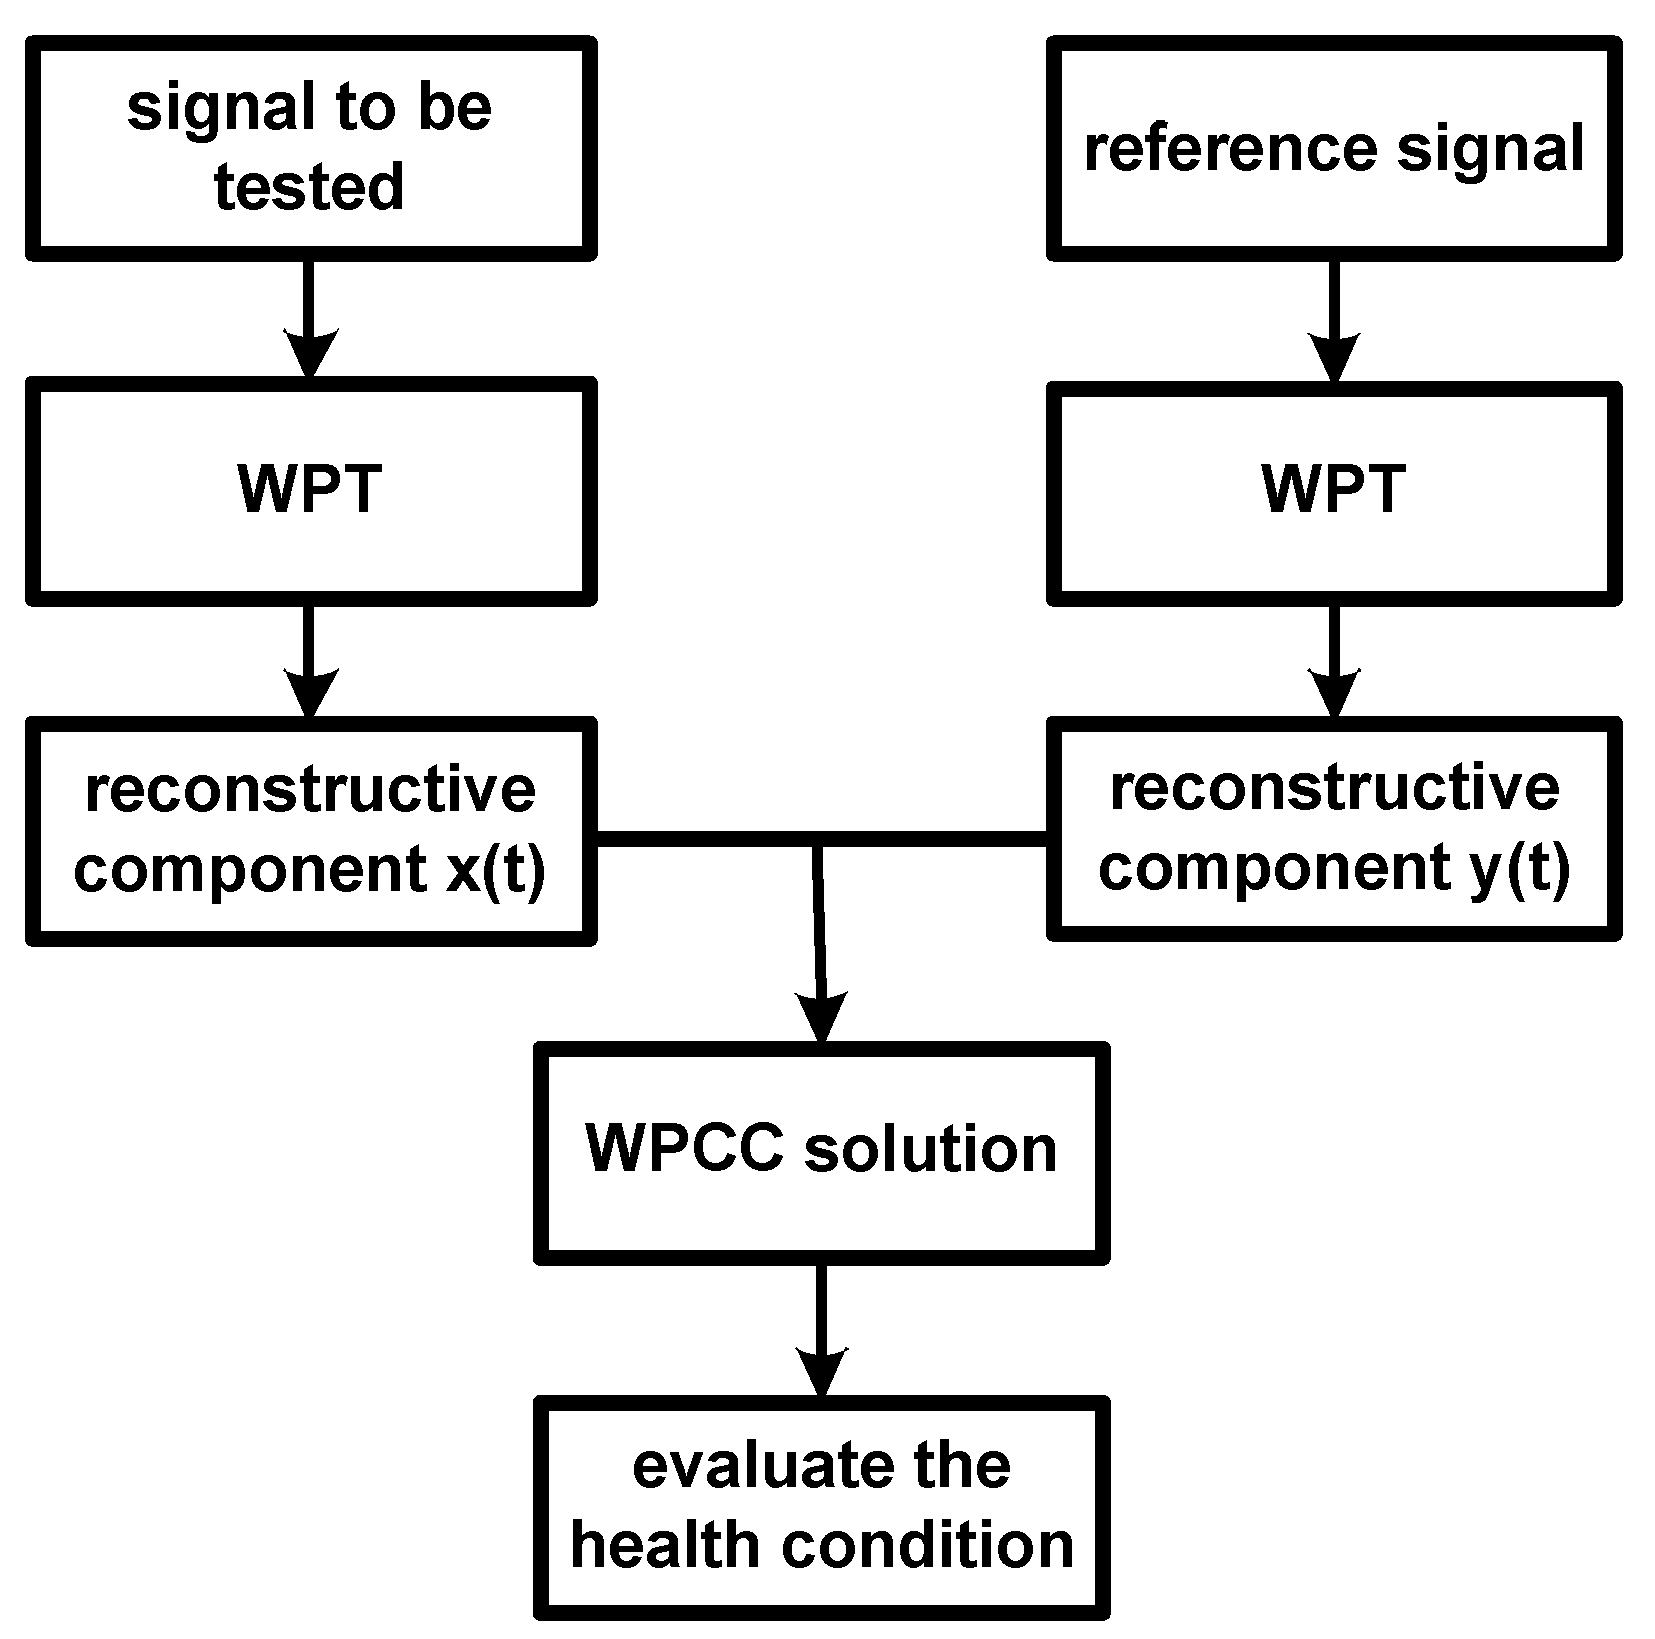
Most of the existing researches on the fault diagnosis of train parts are to identify the failure status of the components. There is no in-depth analysis on the identification of the early degradation of the components. In this paper, a high-speed train lateral damper was used as an example, and a feature analysis method of wavelet packet cross-correlation analysis was proposed in order to identify the early degradation state. It provided a reference for the identification of the degradation status of other components, and introduced new ideas for the early warning calibration of key parts of high-speed trains.

2. Lateral Vibration Analysis

The body will produce severe lateral vibration during the operation of high-speed trains, due to the uneven track, the working state of train components, bends, turnouts, and other factors. Body vibrations are often complex and they contain multiple frequency components, multiple directions, changing over time. The frequency of vibration will have various effects on the car body and passengers, especially the occurrence of resonance, which will lead to physical discomfort in all aspects of passengers and even cause harm to health [10]. Therefore, it is necessary to evaluate the vibration acceleration of the train in order to process the vibration design of the high-speed train. Riding comfort is one of the important items that show the quality of running vehicles. Taking the lateral damper as the research object, the lateral sperling indices of the vehicle body are analyzed when the damping value changes from 0 to 100 kN.s.m−1, as shown in Table 1. Figure 1 shows the relation curve of the sperling index versus the damping coefficient.
It can be seen from Figure 1 and Table 1: when the damping value is small, such as less than 20 kN.s.m−1, the sperling index of cab decreases as the damping value increases; when the value is larger, the sperling index increases as the damping value increases. At the same speed, the sperling index of the front and rear cab is similar with the variation law of damping value, but the amplitudes are slightly different. It is shown that the lateral damper is a key component of the high-speed train bogie that affects the running performance of the train. It can effectively suppress the vibration of the train in the lateral direction and ensure the riding quality of the train and the comfort of the ride. When the lateral damper is out of order, it will produce abnormal vibration. From practice, it is known that the frequency of the vehicle body is mainly concentrated in the low frequency band. In order to extract the subtle characteristics of the train under different faults, the wavelet packet decomposition has great advantages, and the wavelet packet cross-correlation analysis method is proposed to reflect the health condition of the lateral damper that corresponds to different vibration signals.

3. Method

3.1. Wavelet Packet Transformation

The wavelet packet transformation (WPT) method is developed on the basis of the multi-resolution wavelet transform (WT), which is, the signal is decomposed in a series of different levels of space. It retains the characteristics of the wavelet transform, with the increase of resolution, the widened spectral window further fines the fine quality, and can perform comprehensive time-frequency decomposition of the signal, which has unique advantages for vibration signal analysis. As an extension of the WT, WPT can be achieved on any frequency of infinite refinement [11], and Figure 2 shows its frequency domain distribution.
The signal can be decomposed into the interested frequency bands, which is advantageous for extracting the characteristic signal, as can be seen from Figure 2. The mathematical description of the wavelet packet transform is as follows:
The bandwidth of analysis frequency in Figure 1 is written as [10]:
B = 2 i f h
where B is the bandwidth of analysis frequency, f h is the maximum analysis frequency of the signal, and i is the number of layers decomposed by the wavelet packet, i = 0, 1, 2, 3, …
Additionally, the upper and lower limits of frequency band be written as [10]:
{ m = j B n = ( j + 1 ) B     j = 0 , 1 , 2 , , 2 i 1
where m is the lower limit of frequency band, n is the upper limit, and j is the index of the sub-band.
The traditional wavelet transform method does not consider the energy distribution on the time axis of each decomposition frequency band, so that the extracted characteristic parameters cannot accurately reflect the characteristics of the fault features. Signals in different states will exhibit different frequency band energy distribution characteristics. The wavelet packet energy moment M i j is introduced in order to calculate the energy of each frequency band. By comparing the sensitivity of each frequency band to component degradation, the frequency band that best reflects the signal characteristics is extracted. The energy moment parameter M i j is the energy moment of the j-th frequency band in the i-th layer after the wavelet packet decomposition of the signal. The calculation formula of M i j is [12]:
M i j = k = 1 n ( k × Δ t ) | S i j ( k × Δ t ) | 2
where Δt is the sampling time interval, n is the total number of sampling points, and k is the sampling point.

3.2. Wavelet Packet Cross-Correlation Analysis Method

The cross-correlation analysis method is one of the common methods for time-domain analysis of mechanical vibration signals and an important means of fault diagnosis [13]. The correlation refers to the linear relationship or correlation between variables.
The cross-correlation function embodies the correlation between the two signals, so the cross-correlation analysis method can be used in order to determine the correlation of the two signals in frequency. Assuming that both signals x(t) and y(t) contain the same frequency component and the same period, then the cross-correlation function R x y also contains the frequency component of the same period. Therefore, for the signal feature changes that are caused by component degradation, this feature of the cross-correlation function can be used to effectively extract features and identify states.
The cross-correlation function of discrete vibration signals is [14]:
R x y = 1 N k i = 1 N k x i y i + k    k = 0 , 1 , 2 , , K
where x i and y i + k are the data sequence of the response signal, K is the length of the data sequence, and k is the time delay.
Taking advantage of the WPT in the sensitive frequency band, combined with the correlation function to judge the signal correlation. This method is applicable to evaluate the health condition for rolling stock lateral damper. The specific steps are as follows:
(1)
Wavelet packet transform. Five-layer wavelet packet transform transformed the collected lateral vibration acceleration signals of the vehicle body.
(2)
Calculate cross-correlation coefficient. The cross-correlation functions of each frequency band of the reference signal and the signal to be tested are calculated, respectively, and the cross-correlation coefficients of eight frequency bands are calculated according to Equation (5).
ρ x y = N 1 N x ( t ) y ( t ) 1 N x ( t ) 1 N y ( t ) N 1 N x ( t ) 2 1 N x ( t ) 2 N 1 N y ( t ) 2 1 N y ( t ) 2
The correlation coefficient ρ x y gives an indication on the strength of the linear relationship between the two time series x(t) and y(t) [15]. As the correlation coefficient approaches zero, there is less of a relationship between the two time series (closer to uncorrelated). The closer the coefficient to either −1 or 1, the stronger is the correlation between the two time series. Figure 3 shows the process.

4. Results and Discussion

Based on vehicle track coupling dynamics, with Multi-Body Simulation (MBS) software SIMPACK, the nonlinear dynamics model of the China standard EMU vehicle system is established, which fully considered the geometric nonlinearity of wheel-rail contact, the creep nonlinearity of wheel-rail, and the nonlinear suspension. LMA type treads and 60 kg/m steel rail are adopted, and the distance between backs of wheel flanges is in accordance with the Chinese standard of 1353 mm, as shown in Figure 4.
The experimental study is carried out in order to identify the degradation state of the lateral damper under different running speeds, different running conditions and different track excitations. The rolling stock was run for 3 min. with the performance of the lateral damper from normal to gradually degraded (deterioration degree of the normal 90% to 10%), recording vehicle body lateral vibration acceleration sensor data at a sampling frequency of 256 Hz. Six seconds (1536 sample points) were taken from the experimental data as one sample, and 270 samples at each speed were obtained.

4.1. Selection of Sensitive Signal Bands

It is necessary to select a sensitive signal band that reflects the degradation trend of the lateral damper performance in order to accurately establish the relationship between the signal and the degradation state of the lateral damper. Considering the analysis of signals within 30 Hz, only the wavelet packet coefficients of the first eight bands in the fifth layer are reconstructed. The corresponding frequency range is: 0~3.75 Hz, 3.75~7.5 Hz, 7.5~11.25 Hz, 11.25~15 Hz, 15~18.75 Hz, 18.75~22.5 Hz, 22.5~26.25 Hz, and 26.25~30 Hz. Taking the running speed of 200 km/h under the linear running condition on the Beijing–Tianjin track excitation as an example, the signals of 90~10% degradation degree are decomposed by wavelet packet, and the wavelet packet energy moment Mij are shown in Table 2. Figure 5 shows the variation curves of the wavelet packet cross-correlation method (WPCC) coefficient of lateral acceleration signals of vehicle body in each degenerate degree.
The higher energy components are M50 and M53, as can be seen from Table 2. It can be seen from Figure 3 that different frequency bands have different sensitivity to the degradation of lateral dampers, and the M53 frequency band reflects the most obvious change trend of its performance degradation. Therefore, the M53 frequency band (11.25~15 Hz) is selected as the sensitive frequency band for calculating WPCC coefficients.

4.2. Solution of Wavelet Packet Cross-Correlation Coefficients

Normal performance signal is selected as the reference signal, and each degradation degree is taken as the signal to be tested. The wavelet packet cross-correlation coefficients of different degradation degrees is calculated according to the steps in Section 3.2. The results under different running speeds, different running conditions, and different track excitation are shown in Table 3, Table 4 and Table 5, respectively.
It can be seen from the above table that the number of the coefficient under different degrees of degradation is different. As the degree of degradation deepens, the value of the coefficient also becomes smaller, which is mutually consistent with the physical meaning of the WPCC coefficients that are defined above. The physical meaning of the number of relationships is consistent. This indicates that the WPCC coefficients can well reflect different degrees of degradation.
It can be seen from Table 4 and Table 5 that the WPCC coefficient of degeneration degree of the lateral damper is significantly reduced under the curve condition and the track excitation of German railway spectra of high irregularity (GRSHI), indicating that the similarity of the signals is weakened more. Wavelet packet cross-correlation coefficients can better reflect different degradation states in harsh environments. Therefore, the wavelet packet cross-correlation coefficient is a reliable reference base.

4.3. Curve Fitting of Wavelet Packet Cross-Correlation Coefficients

It can be obtained from the above simulation analysis that the wavelet packet cross-correlation analysis method can effectively identify the health status of the lateral damper. The wavelet packet cross-correlation coefficient can reflect the degradation state of the lateral damper and it is a reliable reference. The above simulation data are fitted with the least squares fitting polyfit function in MATLAB, and the following exponential curve can be obtained, as shown in Figure 6.
Table 6 shows the results of goodness of fit. Goodness of fit is the degree to which the regression model fits the observations. It can be seen from the above table that the RMSE is 0.0154 and the R-square is 0.9916, indicating that the regression curve fits the observations very well.

5. Evaluation of the Health Condition for Lateral Damper

The assessment of the health conditions requires prior knowledge as a criterion. The gradient between 100% and 70% is denoted as stage 1 (Health), 70%~40% as stage 2 (Sub-health), 40% to 10% as stage 3 (Fault), and 10% as stage 4 (Scrap), according to the practical experience of engineering projects. Three specific stages of performance degradation degree, namely 70%, 40%, and 10%, are predetermined.
The WPCC coefficients of these three stages are extracted as the critical value, which could constitute four degradation degree intervals. When evaluating the signal to be tested, the WPCC coefficients is first calculated, and the nearest two critical values are found, and the degradation degree of the signal is divided into the degradation degree interval that is formed by the two critical values. Six degradation degrees (90%, 80%, 60%, 50%, 30%, and 20%) were selected for the signals to be tested, with 10 samples per degradation degree, at the speed of 200 km/h, 250 km/h, 300 km/h, and 350 km/h, respectively. Figure 7 shows the test results of the signals that were collected by the vehicle body at the speed of 200 km/h under the linear running condition on the Beijing–Tianjin track excitation.
It can be seen from Table 7 that the algorithm has a high recognition rate at all speeds. As the train running speed increases, the correct recognition rate for the health state of the lateral damper increases, that is, as the speed increases, the characteristics of wavelet packet cross-correlation coefficients are more prominent in the representation of health status.
It can be concluded from Table 8 that the wavelet packet cross-correlation coefficient feature can obtain a higher recognition rate than the traditional wavelet packet energy and wavelet entropy feature, especially at high speed. The recognition rate of wavelet packet cross-correlation coefficient feature reaches a satisfactory result of more than 96% when the speed is 350 km/h.
Table 7, Table 9, and Table 10 shows the accuracy of the lateral acceleration signal analysis collected by the sensor under different running speeds, different running conditions, and different track excitation. It can be seen from the table that there is a high recognition rate under each condition, and the overall average accuracy rate is 95%, which verifies the effectiveness and feasibility of the wavelet packet cross-correlation coefficient in evaluating the health condition of the lateral damper.

6. Conclusions

This paper realizes the quantitative description of the health state of the lateral damper by solving the wavelet packet cross-correlation coefficient in order to accurately and deeply evaluate of health condition for rolling stock lateral damper. Using the simulation data of the performance degradation of the lateral damper under different running speeds, different running conditions, and different track excitation, a satisfactory evaluation accuracy is obtained, and the applicability and effectiveness of the method are verified.

Author Contributions

Conceptualization, Z.Z.; data curation, Z.Z.; formal analysis, Z.Z.; software, Z.Z.; supervision, T.Z.; writing – original draft, Z.Z.; writing – review & editing, B.W. All authors have read and agreed to the published version of the manuscript.

Funding

This research was funded by National Key R&D Program of China (Grant No. 2016YFB1200506-09).

Conflicts of Interest

The authors declare no conflict of interest.

References

  1. Jing, B.; Jin, W.D.; Qin, N.; Wu, X.D. Feature Extraction of Lateral Damper Performance Degradation of High-speed Train. Noise Vib. Control 2015, 35, 57–60. [Google Scholar]
  2. Li, T. High-speed Train Condition Analysis and Fault Diagnosis based on Fractal Theory; Southwest Jiaotong University: Chengdu, China, 2015. [Google Scholar]
  3. Yu, Y. Roller bearing fault diagnosis method based on EMD and neural network. Vib. Shock 2005, 24, 85–88. [Google Scholar]
  4. Zeng, H.; Wu, Y.S.; Wu, X.J.; Zhong, Z.Y. Bogie fault diagnosis application based on vibration energy and transfer function analysis. China Test 2015, 41, 121–124. [Google Scholar]
  5. Shi, G.L.; Li, X.; Jin, W.D.; Gou, X.T. Fault analysis of high-speed train bogie based on permutation entropy. Appl. Res. Comput. 2014, 31, 3625–3627. [Google Scholar]
  6. Shuai, L.; Limin, J.; Yong, Q.; Bo, Y.; Yanhui, W. Research on Urban Rail Train Passenger Door System Fault Diagnosis Using PCA and Rough Se. Open Mech. Eng. J. 2014, 8, 340–348. [Google Scholar] [CrossRef] [Green Version]
  7. Li, Y. High-impedance ground fault diagnosis method for traction power supply system based on support vector machine. China Railw. 2016, 3, 26–30. [Google Scholar]
  8. Shao, W.; Qiao, N.; Wang, J. A novel algorithm of identifying inrush current based on waveform cross-correlation coefficient. Power Syst. Prot. Control 2015, 43, 14–20. [Google Scholar]
  9. Pan, Y.N.; Chen, J. Wavelet Package-Support Vector Data Description Applied in Bearing Performance Degradation Assessment. J. Vib. Shock 2009, 28, 164–167. [Google Scholar]
  10. Sasaki, J.; Barnes, R.; Dale, C. Radio noise currents n short sections on bundle conductors. In Proceedings of the IEEE Summer Power Meeting, Berlin, Germany, 22–27 June 1990. Paper 90 SM 690-0 PWRS. [Google Scholar]
  11. Xing, P.; Li, G.; Liu, T.; Gao, H.; Wang, G. A Detection Method for Friction Vibration Based on Harmonic Wavelet Packet Transform and Cross-Correlation Analysis. J. Vib. Acoust. 2018, 140, 1115–1123. [Google Scholar] [CrossRef]
  12. Lin Yan, L.; Wei Dong, J.; Zhi Bin, Y.U. Running state estimation of high-speed train based on wavelet analysis. Appl. Res. Comput. 2013, 30, 2948–2950. [Google Scholar]
  13. Qi, C.; Wang, K. Mechanical fault characteristics and diagnosis analysis based on vibration signals. Constr. Eng. Technol. Des. 2016, 19, 3377. [Google Scholar]
  14. Wang, T.; Cheng, W.; Li, J.; Wen, W.; Wang, H. Anomaly detection for equipment condition via cross-correlation approximate entropy. MSIE 2011 2011, 52–55. [Google Scholar] [CrossRef]
  15. Liu, X.; Chen, H.; He, L. Probability Theory and Mathematical Statistics; Science Press: Beijing, China, 2000. [Google Scholar]
  16. Qin, N.; Jin, W.D.; Huang, J.; Jiang, P.; Li, Z.M. Analysis of wavelet entropy characteristic of high speed train bogie fault signal. J. Comput. Appl. 2013, 30, 3657–3659. [Google Scholar]
  17. Li, H.; Jin, W. Fault Diagnosis of Lateral Shock Absorber of High Speed Train Based on Statistical Characteristics of White Noise and EEMD. J. Comput. Appl. 2016, 33, 2648–2651. [Google Scholar]
Figure 1. Sperling index versus lateral damping.
Information 11 00298 g001
Figure 2. Frequency domain distribution map of wavelet packet transformation (WPT).
Information 11 00298 g002
Figure 3. The flow chat of wavelet packet cross-correlation method (WPCC).
Information 11 00298 g003
Figure 4. Simulation model.
Information 11 00298 g004
Figure 5. WPCC Coefficients for each degradation degree.
Information 11 00298 g005
Figure 6. WPCC Coefficients function.
Information 11 00298 g006
Figure 7. Test results at the speed of 200 km/h.
Information 11 00298 g007
Table 1. Sperling indices.
PositionsDamping [kN.s.m−1]
0102030405060708090100
Front cab2.56352.1342.06022.06022.05512.08252.09982.11712.13322.15082.5476
Rare cab2.61742.0972.00771.99781.9942.02082.03542.03272.05422.07432.2101
Table 2. Wavelet packet energy moments Mij for each degradation degree.
Degradation DegreeM50M51M52M53M54M55M56M57
90%0.393370.0466490.131540.35660.0103630.0593810.0917690.034625
80%0.393630.0419580.1160.320490.00935470.0550620.0819210.031703
70%0.353130.037120.103360.27460.00862140.0511860.0706310.028352
60%0.393160.0384250.0904060.25040.00808440.0472570.0619590.025326
50%0.327060.0293150.0739760.196990.0075540.0443460.0515010.022569
40%0.313130.0268730.0593590.163130.00714680.0414820.0428850.020173
30%0.313580.0259780.0423490.126570.00643580.0377080.0348990.017572
20%0.300330.0246910.0272250.0970010.00596090.0343740.0255220.01519
10%0.297930.0250950.0145870.0776870.0057580.0319880.0198040.013604
Table 3. WPCC coefficients under different running speeds.
Running Speed (km/h)Degradation Degree
90%80%70%60%50%40%30%20%10%
2000.98010.98330.97260.96210.94480.89850.8040.65480.4587
2500.99210.99560.98470.97350.94390.89420.80.63590.4103
3000.98440.99090.98180.95630.92930.86240.76260.60750.4165
3500.9980.99380.9850.96650.93670.88370.79830.65950.492
Table 4. WPCC coefficients under curve condition.
Running ConditionDegradation Degree
90%80%70%60%50%40%30%20%10%
curve0.99430.98920.970.95770.91280.88050.77850.68580.421
Table 5. WPCC coefficients under German railway spectra of high irregularity.
Track ExcitationsDegradation Degree
90%80%70%60%50%40%30%20%10%
GRSHI0.99220.98430.96520.94580.90660.84310.77290.65950.4837
Table 6. Goodness of Fit.
Goodness-of-Fit ItemValue
SSE0.01352
RMSE0.0154
R-square0.9916
Adjusted R-square0.9912
Table 7. Accuracy rates at each speed.
Accuracy RatesRunning Speed (km/h)
200250300350
Front cab95%96.7%93.3%98.3%
Rear cab93.3%91.7%95%95%
Table 8. Comparison of recognition rates of different feature extraction methods
Accuracy Rates/%200 km/h250 km/h300 km/h350 km/h
Wavelet packet energy feature [16]84.188.572.386.3
Wavelet entropy feature [17]91.890.987.690.3
Wavelet packet cross-correlation coefficient feature94.1594.294.1596.65
Table 9. Accuracy rates at each speed.
Accuracy RatesFront CabRear Cab
Curve96.67%96.11%
Table 10. Accuracy rates at each speed.
Accuracy RatesFront CabRear Cab
GRSHI95.56%97.22%

