Abstract
As students’ behaviors are important factors that can reflect their learning styles and living habits on campus, extracting useful features of them plays a helpful role in understanding the students’ learning process, which is an important step towards personalized education. Recently, the task of predicting students’ performance from their campus behaviors has aroused the researchers’ attention. However, existing studies mainly focus on extracting statistical features manually from the pre-stored data, resulting in hysteresis in predicting students’ achievement and finding out their problems. Furthermore, due to the limited representation capability of these manually extracted features, they can only understand the students’ behaviors shallowly. To make the prediction process timely and automatically, we treat the performance prediction task as a short-term sequence prediction problem, and propose a two-stage classification framework, i.e., Sequence-based Performance Classifier (SPC), which consists of a sequence encoder and a classic data mining classifier. More specifically, to deeply discover the sequential features from students’ campus behaviors, we first introduce an attention-based Hybrid Recurrent Neural Network (HRNN) to encode their recent behaviors by giving a higher weight to the ones that are related to the students’ last action. Then, to conduct student performance prediction, we further involve these learned features to the classic Support Vector Machine (SVM) algorithm and finally achieve our SPC model. We conduct extensive experiments in the real-world student card dataset. The experimental results demonstrate the superiority of our proposed method in terms of Accuracy and Recall.
1. Introduction
Owing to the development of information management systems (such as the student card system) in colleges and universities, it becomes convenient and easy for teachers to collect and analyze students’ behaviors, which is one of the most important approaches to learn students’ learning and living habits on campus. For example, a student who wants to get a high Grade Point Average (GPA) score may live a very regular life (such as going to the library at certain times) [1,2], since she needs to work hard on her selected courses. The students’ behaviors tell us whether they intend to spend more time on studies [3,4]. Based on this, we have the motivation to develop student performance prediction methods from their behaviors. The performance prediction task pays more attention to the students who are possible under-performers. The task aims to let educators obtain early feedback and take immediate action to improve students’ performance.
The research problem described in this work is about Educational Data Mining (EDM), which is a technology for mining potential information from massive learners’ behavior data, and it has been widely applied in scientific research, business, finance, and other fields [5]. There are many applications of EDM in the education field, such as building learners’ feature model [6] and recommending courses or learning paths to students according to their learning behaviors [7]. The purpose of a majority of methods is to improve students’ academic performance and promote their well-rounded development. In this work, we focus on students’ behaviors in order to predict their performance, since in this way we can find out students’ learning difficulties in advance and handle them timely with an intervention trial. At the same time, personalized guidance can be provided to promote students’ comprehensive development. In addition, because students’ behaviors are intuitive, we can have easier access to judge consequences directly and quickly, instead of discovering students’ learning and life problems at the end of the semester.
To study this problem, many researchers have proposed utilizing different technologies such as statistical analysis, data mining, and questionnaire surveys to predict students’ performance from their behavior data. For example, Fei et al. [8] introduced a temporal model to predict the performance of students who are at risk via formulating an activity sequence from the historical behaviors of a Massive Open Online Courses (MOOC) platform. Another study [9] adopted the discussion behaviors in online forums to predict students’ final performance by using different data mining approaches. Although these existing methods have achieved great success in predicting students’ performance, they still have the following limitations: (1) Their methods are mainly focused on manually extracting statistical features from the pre-stored data, resulting in the hysteresis in predicting students’ achievement and finding out their problems. (2) Due to the limited representation capability of these manually extracted features, they can only understand students’ behaviors shallowly.
On the one hand, predicting students’ performance timely is helpful for education managers (such as teachers) to find out learners’ problems, and hence adjust their education policy or teaching method. Suppose a student is a freshman who just graduated from high school. She may work harder in the first semester since she continues her learning habit in high school. However, from the second semester, she may be distracted by other college activities, such as club or class activities. In addition, she is even influenced by her growing laziness. If we can only find out the student’s problem at the end of this semester, she will miss lots of courses. A timely prediction method is helpful to avoid these situations. To achieve this goal, we regard the performance prediction problem as a sequence classification task, in which the students’ behaviors in a short period are taken into account.
On the other hand, traditional manually extracted features have limited representation capability, while deep neural networks have achieved great success for their ability to extract high-representative features from various sequences. For example, a recent study [10] adopted Gated Recurrent Units (GRU) with an attention mechanism to model the user’s sequential behavior and capture their main intention in the current session, which is combined as a unified session representation. Another study [11] introduced a neural network architecture that can process input sequences and questions, form episodic memories, and generate relevant answers. However, these existing works are mainly focused on the research problem in Natural Language Processing (NLP) and Recommender systems. The study that leverages the power of the Recurrent Neural Network (RNN) to model students’ performance is largely unexplored.
Based on the above observations, we first treat the student performance prediction task as a short-term sequence classification problem. Then, we propose a two-stage classification algorithm by extracting students’ recent behavior sequence characteristics to predict their performance, which consists of a hybrid sequence encoder and an SVM classifier. Concretely, for the sake of discovering useful sequential features from students’ sequential behaviors, we introduce an attention-based HRNN to model their short-term goals by giving a higher weight to the behaviors that are relevant to the students’ last behaviors, which is interpreted as a unified sequence representation later. Then, we further involve the learned features of the classic SVM algorithm to achieve our final SPC framework.
As far as we know, we are the first to treat the student performance prediction as a sequence classification task and leverage the capability of the RNN technique to investigate student behavior patterns. The main contributions of this work are summarized as follows:
- We target at predicting student achievement with their short-term behavior sequences and propose an SPC model to explore the potential information of their recent behaviors.
- We apply an attention-based HRNN approach to research student behavior characteristics by only focusing on their current short-term behaviors, which allows us to make timely performance prediction.
- We conduct extensive experiments on the real-world student smart card dataset to demonstrate the superiority of our proposed method.
The remainder of this paper is organized as follows: Section 2 explains the main features of the methods used in our research and outlines the proposed method; Section 3 describes the set of experiments completed and their interpretation report the experimental on the real-world dataset; and, finally, conclusions in Section 4.
2. Materials and Methods
In this section, some theoretical concepts are explained first. Then, we depict the sequence-based performance prediction task based on our advanced model.
2.1. Student Performance Prediction
Student performance prediction, as one of the most valuable applications in the EDM area, has attracted much attention in the past decade. Existing works explored this task mainly through data mining technology, statistical analysis, and other machine learning methods to achieve the academic performance prediction. For example, Cao et al. [1] proved that there was a significant correlation between the regularity of campus life and academic achievement by defining quantitatively two high-level behavior characteristics, orderliness and diligence. A recent study [12] examined the performance of a broad range of classification techniques to find a qualitative model for the student performance prediction problem by using students’ behavior data. A previous study [13] investigated and determined significant behavior indicators from Learning Management System (LMS) platform data regarding online course achievement. Another previous study [14] further explored both multi-level and standard regressions to predict student performance from LMS predictor variables. A previous study [15] utilized statistical methods with variable multi-modal data and semester-wise information as input to assess students’ performance.
However, the above methods cannot forecast students’ performance opportunely and only understand the behavior data shallowly. More recent works have focused on novel methods to make timely predictions. For example, Ma et al. [16] formulated the task of pre-course student performance prediction as a multi-instance multi-label (MIML) problem. They proved that it was desirable to predict each student’s performance on a certain course before its commencement rather than after finishing it. Zhou et al. [17] showed that an education measurement system could obtain large-scale observations on punctuality, distraction, and the performance of educational behaviors by using longitudinal WLAN data. A previous study [18] proposed a hybrid FM-RF method to accurately predict grades from historical transcript data based on the degree program of students, the intervention of instructors, and personalized advice. Another previous study [19] suggested that it was effective to assess the performance of early in-class, such as quizzes, which can result in timely scientific guidance for each student. However, the above works mainly exploit manually extracted statistics features, and the deep recurrent features of student behavior data are not investigated.
2.2. Deep Learning-Based Sequence Modeling
Deep learning-based sequence modeling aiming at capturing deep recurrent features from sequential items (such as words or products) has been widely studied in many related fields such as NLP [20,21] and recommender system [22,23]. For example, Li et al. [10] proposed a hybrid RNN model to capture both the user’s sequential preferences and the main purpose of the current session by an attention mechanism in a session-based recommendation task. Liu et al. [24] proposed an attention-based RNN for joint intent detection and slot filling considering all available information from the input and the emitted output sequences. A previous study [25] applied a sequence-to-sequence training framework to learn the representations of the audio segment with variable length acoustic feature sequences, and demonstrated that the proposed model could achieve a better retrieval performance than other related works. Zhu et al. [26] proposed a new Long Short-Term Memory (LSTM) variant to model users’ sequential actions, where time intervals among users’ behaviors are of significant importance in capturing the relations of their behaviors.
However, very few prior studies have explored the student performance prediction from a sequence modeling perspective [27,28]. For instance, a recent study [29] experimented on prediction models for student performance in the early stages of blended learning courses, which applied deep neural network architecture and utilized online activity attributes as input patterns extracted from the activity logs stored by Moodle. A recent study [30] transformed the time series click data of students’ eBook behaviors into different features to predict whether a student passes the course or not. A recent study [31] explored the factor for improving the performance of prediction of students’ quiz scores by using a RNN from learning logs. Yang et al. [32] incorporated the data that was collected from the watching click-streams of lecture video into the machine learning feature set, and trained a time series neural network that learns from both prior performance and click-streaming data. Nevertheless, the above studies haven’t utilized sequential behavioral data from a smart campus card to address the student performance prediction problem. Thus, we treat this task as sequence modeling via exploring intrinsic patterns from students’ campus behaviors.
2.3. Performance Prediction Model
Sequence-based performance prediction is the task of predicting the students’ current performance by classifying their recent sequential behaviors (such as accessing and leaving the library, fetching water and going to the canteen). Here, we give a formulation of the sequence-based performance prediction task.
2.3.1. Task Definition
For a specific student, we intend to know if we can judge her learning performance when only very limited behavior records of her in the campus are provided. Let be a behavioral sequence, where is the index of one behavior out of a whole number of m card devices. Let be the observed interactions among n students and m campus card devices, where each item indicates student i has conducted card item j. We establish a performance prediction model M by classifying the given sequences into different grades y (i.e, good, medium and poor). Compared to traditional performance prediction problem, we focus on how to conduct timely predictions by automatically extracting deep recurrent features. The formal definition of our task is defined as follows:
- Input: The sequential behaviors of students per week.
- Output: A mapping function that can map a given sequence to a performance grade:
2.3.2. Overview
The proposed methodology, based on deep learning and data mining techniques, aims to explore students’ potential behavior features and predict their academic performance. To be specific, we utilized a two-stage classifier, which consists of a neural attentive encoder-decoder and an SVM classifier, where the former contains an RNN-based encoder, attention mechanism, behavior feature generator, and decoder. The main idea of our method is to build a hidden representation of the behavioral sequence, and afterwards make classification prediction. RNN is a neural network with the ability of short-term memory. It can handle sequences of different lengths compared with other neural networks (such as Convolutional Neural Networks (CNN)). In this network structure, a neuron can not only accept information from other neurons but also its information. The workflow of our method is described in Figure 1.
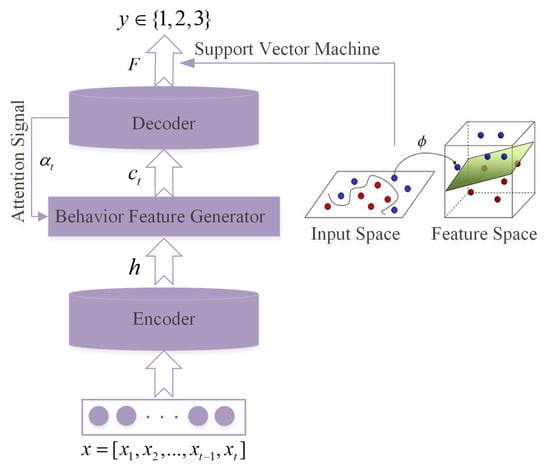
Figure 1.
The general framework and dataflow of SPC for student performance.
First, we take the behavioral sequence as the input of the encoder (RNN) and further transform it into a series of high-dimensional hidden representation . The reason why RNN can learn the representation of students’ behavioral sequence is that the output of each unit is related to the current input as well as the past output. We aim to dig out the latent expressions, that is, behavioral features, of hidden layers through deep RNN. However, traditional statistical analysis techniques and data mining algorithms cannot effectively capture these potential features. Most of them can merely extract features manually based on indicators, which can only understand the students’ behaviors shallowly.
Then, along with the set of hidden states h, we feed the attention vector into the sequence feature generator (i.e., the output of hidden state representation) to decode at time t (indicated as ). We notice that the main purpose or intention of a student may hide behind a series of her activities. For instance, a student plans to study in the library, but she also buys some food or takes a shower. Her main purpose is hidden behind her behaviors. To capture the students’ main attention from their current behaviors, we introduce an attention-based RNN into our method, which has been successfully applied in many recommender systems. The role of is to decide which hidden state h is important.
Finally, is a function of hidden states, which allows the decoder to dynamically select and linearly combine different parts of the input sequence hidden states, which can generate students’ behavior features . Each student is an independent individual who has different behavioral characteristics and motivations. Furthermore, as the SVM approach has achieved great results in most of machine learning tasks, we simply use SVM to classify student behaviors to predict their academic level y.
2.3.3. Learning Sequential Features with Attention-Based HRNN
RNN was proposed by American physicist J.J. Hopfield in the 1980s. It is a neural network with the ability of short-term memory. Compared with other networks (such as Artificial Neural Network (ANN), Generative Antagonistic Network (GAN) and CNN), RNN can achieve a certain “memory function” and explore temporal information and semantic information effectively. In the task of our sequence-based performance prediction, we utilize an attention-based HRNN model proposed by Li et al. [10] as the first classifier to learn sequential features and the main purpose from students’ behaviors.
The structure of the SPC model is shown in Figure 2. The upper and lower input are the same data about students’ historical behaviors (e.g., means ‘canteen’, means ‘shower’) at time t, while the output is the representation of the students’ sequential behavior features . Notice that the upper and lower play different roles, but they have the same values. The upper encoder is to encode the entire initial sequence information through the last hidden state , and the lower encoder is to compute attention weights with the previous hidden states through the last hidden state . It is uniformly constituted that inputs and outputs are high-dimensional vectors.
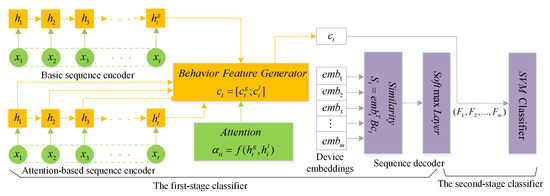
Figure 2.
The graphical model of SPC, where the first-stage classifier contains attention-based HRNN while the second-stage classifier is SVM. Note that the sequence feature is represented by the concatenation of vectors and , the output means the learned student sequential features.
Figure 2 shows the graphical model of the first classifier [10] in SPC. We can see that it combines the basic sequence encoder with the attention-based sequence encoder to feed to the behavior feature generator. Both of the two encoders utilize GRU as the basic unit [33] since, not only can GRU keep important features in short-term propagation, but it can also deal with the vanishing gradient problem as well. The specific algorithm steps are as follows: for each behavioral sequence , GRU takes the current campus card activity m in the sequence. The output is a linear transformation between the previous activation of hidden state and the candidate activation of hidden state ; this process can be expressed as:
where and are the previous and the current hidden state, respectively. Equations (1)–(4) respectively represent update gate, reset gate, new memory, and hidden state. In particular, the update gate controls how much information needs to be forgotten from and how much information needs to be remembered from . The reset gate determines how much previous memory needs to be retained. This procedure takes a linear interpolation between the existing activation and current activation and the last state of the encoder RNN carries information of the entire initial sequence. We virtually use the final hidden state (later called ) as the representation of the students’ behavior features called basic sequence encoder,
As we notice that not all the students’ behaviors are related to their learning performance, when making predictions, we would like our SPC model to be able to pay more attention to the interactions that are related to their performance. Hence, we introduce an attention mechanism to model this assumption called attention-based sequence encoder,
where the context vector can be calculated based on the weighted factors and the hidden states from to , . It makes the decoder dynamically generate and linearly combine different parts of the input sequence. The attention function is computed by
where is a sigmoid function that transforms and into a latent space by matrix. This function does not induce the representation of students’ sequences by directly summing all the hidden states learned by the RNN network. Instead, it utilizes a weighted factor to denote which hidden state/interaction is important for the encoder. Then, the weighted sum of the above hidden states are calculated to represent a student’s behaviour sequence. To better understanding , can also be represented as the last hidden state (i.e., ) at time t. Therefore, is amended to
As illustrated in Figure 2, we can see that the summarization is incorporated into , and is incorporated into and . Both of them provide a sequential behavior representation for student performance prediction. By this hybrid scheme, both the basic sequence encoder and the attention-based sequence encoder are able to be modeled into a unified representation that is sequence feature generator, which denotes the concatenation of vectors and ,
In order to realize performance prediction better, we apply an alternative bi-linear decoding scheme between the representation of the current sequence and each campus card device to compute a similarity score (later represented F).
where T is a matrix and is the dimension of each device embedding, which, for mapping each behavior, vectors to a low-dimensional space. is the dimension of the sequence representation. Then, the similarity score of each device is fed into a softmax layer to acquire the probability to achieve decoding.
For the task of sequence-based prediction, the basic sequence encoder has the summarization of the whole sequential behavior while the attention-based sequence encoder can adaptively select the important behavior to capture the students’ main intent by focusing on what they have done recently. Therefore, we use the representations of the sequential behaviors and the previous hidden states to compute the attention weight for each behavior device. Then, a natural extension combines the sequential behavior feature with the students’ main intent feature, which forms an extended representation for each timestamp to learn recurrent sequential features from student behaviors.
2.3.4. Student Performance Classifier
Classification is a popularly explored area in educational data mining for predicting student performance. SVM as a prevalent classifier has been successfully applied in many related areas such as text recognition [34], human body recognition [35], medical area [36], and educational field [37,38]. SVM is based on the statistical learning theory of VC dimension theory and structural risk minimization principle, which can use the limited sample information to find the best compromise between the complexity of the model and the learning ability by machine learning [39]. This article is a multi-class problem and owns tens of thousands of data. We choose SVM as the second stage classifier for the reason that the application of the kernel function is indeed a bright spot for SVM, so we can make some changes to adapt to the scene with SVM principle to solve the problem of linear indivisibility.
In the case of linear separability, the support vector classifier attempts to find an optimal classification hyperplane to maximize the interval. To find this hyperplane, we need to solve the quadratic programming problem below,
Among them, w is a normal vector, b is a bias term, and x represents features. The solution of the above mentioned quadratic programming problem is solved by Lagrangian duality,
This formula is the original problem, and the dual problem of this formula is simplified by the differential formula to obtain the relations of w and , b and .
This is a quadratic function optimization problem with inequality constraints and has a unique solution; the final optimal classification hyperplane is
where is the support vector point. In the case of nonlinear separability, using kernel functions to map feature space F to higher dimensions. The original training sample is mapped to a high-dimensional feature space F by a nonlinear mapping . Therefore, the nonlinear classification problem in the input space becomes a linear classification problem in the feature space:
Solving steps are similar to linearly separable cases, where is penalty term, and the classification hyperplane at this point is
We take advantage of the properties of the kernel function corresponding to the inner product of the high-dimensional space to make the linear classifier implicitly establish the classification plane in the high-dimensional space. Because the classification surface in high-dimensional space can more easily bypass some indivisible regions in low-dimensional space, this can achieve better classification results. SVM constructs the optimal segmentation hyperplane in the feature space based on the structural risk minimization theory, so that the learner is globally optimized, and the expected risk in the whole sample space satisfies a certain upper bound with a certain probability.
When solving a multi-class pattern classification problem, we select a one-against-one approach that every two categories make the classification. In our work, as shown in Figure 2, the inputs are completely sequential behavior features formed by neural attentive sequence-based network in the previous section while the outputs are real students’ academic performance . Let be the sample set and the category be represented as y. Student academic grade is divided into three classes: the one is A degree about 20 percent of students, the second B degree about 60 percent of students, and the last C degree about 20 percent of students. Therefore, it is a valid approach through which we can view student performance prediction as a short-term sequence modeling problem. If given another a series of student behaviors data, we can predict their academic achievement from our two-stage classifier in order to timely discover students with a learning crisis.
3. Results
In this section, we describe the dataset, evaluation metrics, and the implementation details employed in our experiments. Then, some comparison and analysis of different methods for feature extraction are completed.
3.1. Experiment
3.1.1. Dataset
In the era of big data, the traditional management of students’ behaviors has the disadvantages of untimely intervention and governance hysteresis. Nowadays, school administrators can be able to capture the grades of students initiatively with putting educational big data into analysis and monitoring of students’ daily behaviors; therefore, further research and judgments can be made on the basis of it. As a result, it is meaningful that behavior data generated by college students in daily campus activities can dig out the factors and patterns related to academic achievement. To demonstrate the effectiveness of the two-stage classifier method, we use the real-world dataset smart card as our data source https://www.ctolib.com/datacastle_subsidy.html.
The dataset utilized in our experiments is from the smart card system of one famous university in our country. The published dataset contains five tables (as shown in Table 1), which are books lending data, card data, dormitory open/close data, library open/close data, and student achievement data. The fields of each data table are shown in the third column of Table 1. We also present some samples of each sub-dataset in Table 2, Table 3, Table 4, Table 5 and Table 6. From the first data table (as shown in Table 1 and Table 2), we can see that the smart card system can record the information of borrowing books, and the fields of this data table include students’ id, borrowing time, books’ name, and ISBN. From the second data table (as shown in Table 1 and Table 3), we can observe that the smart card system can save students’ consumption information, such as how much a student spends in the canteen, when did a student go to the library, and when did a student have dinner, etc. From the third data table (as shown in Table 1 and Table 4), we can notice that the information of the dormitory is recorded, including when did a student leave/enter her dormitory. From the fourth data table (as shown in Table 1 and Table 5), we can see the information of students entering and leaving the library, such as which door did a student leave from, and when did a student enter the library, etc. From the last data table (as shown in Table 1 and Table 6), we can see that the smart card system can record the information on students’ grade ranking.

Table 1.
Details of the dataset utilized in our experiments.
Table 2.
Samples of the books lending data.
Table 3.
Samples of the card data.
Table 4.
Samples of the dormitory open/close data.
Table 5.
Samples of the library open/close data.
Table 6.
Samples of the students achievement data.
Since all the records of this dataset are obtained after conducting data masking from the “original data record”, some duplicate or abnormal records are being. To reduce the impact of inaccurate data, we further extract the behavior records of 9207 students over 29 weeks, from March to June 2014 and April to June 2015. The dataset includes students’ fetching water records, going into the library and other kinds of 13 behaviors. In order to further model the students’ behaviors from their visiting sequences, we sort students’ behaviors by the time they visit the card reader and then form behavioral sequence of them. The denotes one kind of card reader located at different buildings, such as at the front door of the library or laboratories. The statistic of the resulted dataset is shown in Table 7, and the samples of students’ behavioral sequences are shown in Table 8.
Table 7.
The statistic of the resulted dataset.
Table 8.
The samples of students’ behavioral sequences.
The reasons to choose this dataset are fourfold: First, these behavioral data are not directly related to academic performance. In this way, we can explore the relationship between the two parts. Second, these behaviors are unobtrusive and thus can objectively reflect students’ lifestyles without experimental bias. Third, most university students in China live and study on campus. Therefore, the utilized dataset has sufficient coverage to validate the results. Finally, the results of the experiment not only facilitate the management of the daily activities of teachers and students, but also provide important information for teaching, research, and guidance.
3.1.2. Evaluation Protocols
In order to quantitatively evaluate the performance of our method, we randomly select 70% of the resulted dataset as the training set and the remaining as the test set. We adopt two popular evaluation protocols’ accuracy and recall to evaluate our experiments. Accuracy is defined as:
Recall is defined as:
where accuracy returns the fraction of correctly classified samples (float). TP indicates the number of real positives among the predicted positives, and True Negative (TN) represents the number of real negatives of the predicted negatives. Similarly, False Negative (FN) denotes the number of real positives among predicted negatives. Therefore, accuracy denotes the proportion of students’ performance classified correctly by SVM among all sequential behaviors, and recall denotes the proportion of students’ performance that are classified as positive among all real performance.
3.1.3. Baseline Methods
These models are commonly used in different machine learning applications; we will only briefly present them here and focus on the setting of our performance prediction experiments. In order to validate the performance of the SPC model for students’ academic performance prediction task, we compare it with the following baseline methods:
- Support Vector Machine [40]: This is arguably one of the most popular classification methods used in educational data mining such as student performance prediction. Meanwhile, SVM demonstrates a very efficient algorithm for machine learning.
- Logistic Regression [41]: This is another popular classification technique that predicts a certain probability task. The logistic regression model aims to describe the relationship between one or more independent variables that may be continuous, categorical, or binary.
- Bayesian [42]: This is a simple classification method that is based on the theory of probability, which is more important and widely used in machine learning.
- Decision Tree [43]: This is one of the most popular data mining techniques for prediction and the model has been used extensively because of its simplicity and comprehensibility to discover small or large data structure.
- Random Forest [44]: This is an integrated learning method that is specifically designed for decision tree-based classifiers. It can be utilized for classification and regression, and effectively prevent overfitting.
To demonstrate the superiority of our sequence-based features, we manually extract 19 types of features (as shown in Table 9), and further compare our method with the following baselines that utilize features from different behaviors. At the same time, based on the existing machine learning algorithms, we study the application of the algorithms in the performance prediction. The most suitable algorithms and parameters are searched to form the optimal state, and the goal of predicting academic performance according to the behaviors could be realized in the end. We study the students’ smart data on the basis of learning and summarizing the experience of the predecessors, and we acknowledge that the side evaluation of the student achievement ranking is many-sided. Our work makes use of statistical methods and selects indicators that are relevant to the ranking of achievements. The detailed explanation of these extracted features about consumption habits, living habits, and learning habits are described as follows:
Table 9.
Different types of manually extracted features.
Features 1–4 respectively represent the amount of student spending in the cafeteria/supermarket/Point of Sale (POS) machine per day and the frequency of going to the print center, which are classified as consumption features. Features 5–8 respectively represent the frequency of borrowing books, the number of going out of the library earlier than 8:00 a.m. and the duration of staying at the library per day, which are classified as studying habits. The rest respectively mean the frequency of fetching water per day, the number of taking showers in spring/summer/fall/winter per week, the days of eating breakfast/lunch/dinner, the frequency of going out of the dorm earlier than 8:00 a.m., the frequency of entering the dorm later than 10:00 p.m. and the duration of staying at the dorm per day, which are classified as living habits. The baseline methods with different types of behaviors are shown as follows:
- SVM+CH College students with different academic achievements have differences in the amount of campus card consumption, which is reflecting the different consumption needs and psychology of college students. We choose daily average canteen consumption, daily average supermarket spending and other indicators as consumption habits (CH) features.
- SVM+SH College students’ learning habits are developed over a long period of time, whose tendency and behaviors are not easily changed. We choose the duration of staying at the library, the number of borrowing books, and other indicators as studying habits (SH)’ features.
- SVM+LH Well-behaved habits may be beneficial for academic performance. We select the frequency of fetching water, the duration of staying at the dorm, and other indicators as living habits (LH) features.
3.1.4. Implementation Details
We implement our method using Python and theno library with NVidia Tesla K80 GPU (Santa Clara, CA, USA). Here are some implementation details: The proposed two-stage classifier model uses 50-dimensional embeddings for the card devices and the dimension of the one GRU is also set at 50 hidden units. The optimization is done by using Adam [45] with an initial learning rate of 0.001 and mini-batch size is fixed at 128. To prevent RNN from over-fitting, there are two dropout layers applied in the attention-based HRNN: One is between the card device embedding layer and the GRU layer with 25% dropout, the other is between the GRU layer and the bi-linear similarity layer with 50% dropout. We truncate BPTT at 19-time steps and set the batch size as 512. The number of epochs is set to 30 as the setting in the state-of-the-art method [46]. By training, we set the c to 0.8 and gamma to 0.1 with applying SVM.
3.2. Results on Baseline
We compare our method with multiple classification techniques, which are utilized in the data mining process for predicting the students’ grades to discover their problems timely. In addition, we adopt 10-fold cross-validation to verify and validate the outcomes of the considered classifiers. We divide students into three types (i.e, good, medium, and poor) according to ranking. The results of all methods are shown in Table 10.
Table 10.
Performance comparison of the SPC model with baseline methods on our dataset (△ denotes the improvements of SPC over other baseline methods.
Based on Table 10, it can be concluded as follows: (1) It can be observed that the two-stage classifier approach proposed in this paper has more consistent and significant performance than other baselines, which demonstrates that the RNN-based SVM model is good at processing sequence information in multi-classification tasks. (2) By considering the sequential behaviors and main purpose of the students, the proposed SPC method can outperform all the baselines. The relative performance of SPC is around 86.90% and 81.57% respectively in terms of Accuracy and Recall. (3) As we can see, there is almost no difference in the experimental results of other data mining models, and these models are barely satisfactory in Accuracy and Recall. We believe that one of the important reasons is that these models have their own limitations in processing various types of data; hence, they cannot effectively deal with behavioral sequence characteristics. (4) From the perspective of the traditional method, the prediction results of the extracted features manually are generally performed in terms of Accuracy and Recall, which are around 59% and 33%, respectively. These results may be caused by improper pre-processing of features or failure to extract highly representative features, which affects the final model effect. The extraction of students’ traditional behavioral characteristics is a relatively subjective process, which is often influenced by people’s own empiricism of cognitive to campus behaviors. (5) It is practicable to combine attention-based HRNN and SVM models, since it can learn the latent relationships between students’ behaviors and determine which sequential behavior features are important for the multi-classification performance task.
3.3. Impacts of Sequence Lengths
Our experimental impact in this section is based on the hypothesis that, when a student generates various campus behaviors, her behaviors frequently follow a certain pattern and main intention in order to achieve better grade prediction. However, we can hardly explore the orderliness of students’ daily activities and capture their main purpose when they perform only a few behaviors. Therefore, we make comparisons among sequential behaviors with different lengths to study whether the SPC approach is good at modeling long activities. As shown in Figure 3, the horizontal axis represents the sequence length in weeks. We discover that the model performs better when increasing the sequential behavior lengths from 1 to 20, all of which are higher than 70% accuracy. This indicates that the SPC method could make a better prediction if it captures more student purpose features on the basis of the existing sequential behavior features. Another reason could be that students are very likely to develop regular living and learning habits. However, as shown in Table 11, we can discover that, when sequence length is divided by month, the evaluation of the model decreases (only 71.40%). It is believed the reason is that, when a sequence is too long, managers do not assess the students’ status and intervene in their learning in a timely manner, which results in a decline accuracy. Therefore, compared with standard academic assessment or personal static information, short-term sequential behavior modeling can monitor the students’ daily activities more sensitively, and reflect their living and learning status more opportunely.
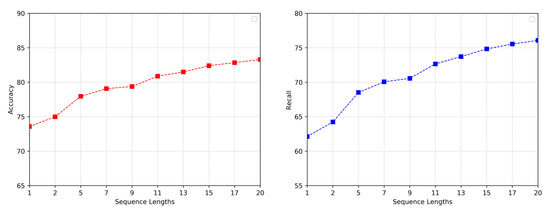
Figure 3.
Accuracy and recall of the SPC model with the impact of different sequence lengths.
Table 11.
The comparison result of different cycles.
3.4. Impacts of Feature Dimension
We perform several experiments on whether the feature dimensions have an influence on the selection of students’ behavior representations in terms of two evaluation methods. As shown in Figure 4, when hidden state dimensions increase from 5 to 100, SPC performance improves significantly in terms of Accuracy and Recall, which are up to about 87.5% and 82.5%, respectively. However, the curve tends to gradually flatten when the feature dimension reaches 50. The reason could be that the hidden layer with fewer dimensions is not accurate enough to represent students’ behavior features. When the dimensions of the hidden state are set more, SPC can understand and analyze students’ campus behaviors more comprehensively. However, due to the limited representation capabilities of the RNN model, there may be some duplicate features when there are many hidden states. Therefore, setting a suitable feature dimension is helpful for educators to understand students’ behaviors and explore the information contained in the data.
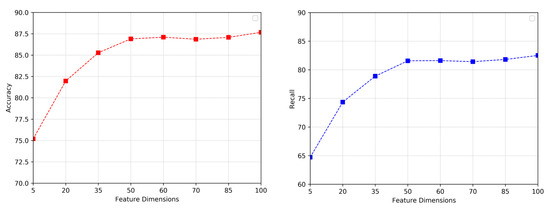
Figure 4.
Accuracy and recall of the SPC model with the impact of different feature dimensions.
3.5. Results on Correlation Analysis
In order to demonstrate the correlation between students’ behavior characteristics and academic performance, we further utilize the statistical approach for factor analysis and principal component analysis to explain the correlation between them. Firstly, the common factors are extracted by factor analysis. Then, these factors influencing academic performance are reasonably explained by rotating the component matrix. Finally, the proportion of each factor and common factors impacting academic performance are discussed. The principle of factor analysis is to study the correlation coefficient matrix between variables, and integrate the complex relationship between these variables into a few comprehensive factors under the premise of minimal information loss, which belongs to the process of reduction dimensions. Therefore, we explore the basic structure of observing data and use several hypothesis variables to represent them by studying the internal dependence of student sequential behavior features [47].
Before conducting factor analysis, the collected features were examined by KMO and Bartlett’s test. The KMO test is used to check the correlation and partial correlation between variables. The closer the KMO statistic is to 1, the stronger the correlation is. In addition, the weaker the partial correlation is, the better the effect of factor analysis. As shown in Table 12, according to Bartlett’s test of Sphericity, the accompanying probability value is 0.000 (p < 0.05), which reaches a significant level. This test is a hypothesis that the correlation matrix is not an identity matrix, which would indicate that variables are related to structure detection. Therefore, based on the above analysis results, the original variables (students sequential behavior features) are suitable for factor analysis according to the above analysis results.
Table 12.
KMO and Bartlett’s Test, where Approx. chi-square means the chi-square test; df means the degree of freedom; Sig. means the probability value of the test.
The principal component analysis is to find out independent comprehensive indicators that reflect multiple variables, and to reveal the internal structure among multiple variables through principal components. By investigating the correlation between multiple variables and prediction functions in principal component analysis, we analyze 50-dimensional behavior features affecting students’ performance. As is shown in Table 13, the first ten factors can explain the overall variance of 84.764%, which effectively reflects the overall information and has a significant relationship with academic performance.
Table 13.
Total variance explained (extraction method: principal component analysis).
4. Conclusions
In this paper, we viewed the student performance prediction as a short-term sequential behavior modeling task. A two-stage classifier SPC for learners’ behaviors was proposed, which consisted of the attention-based HRNN and classic SVM algorithm. Different from other statistical analysis methods where behavior features were manually extracted, the whole student sequential behavior information could be adaptively integrated and the main behavior intention could be captured. In the real-time campus scene, the baseline consequences showed that the proposed method could result in a higher prediction accuracy of about 45% improvement. The evaluation indicators of the SPC method were about 86.9% and 81.57% in terms of accuracy and recall, which was better than other traditional methods. From an educational perspective, the analysis indicated that the number of students’ behaviors and the representation of learned features could make teachers grasp the patterns and regularity of students’ behaviors initiatively, so as to make research and judgment accordingly.
Author Contributions
Conceptualization: X.W.; Methodology: X.Y.; Software: L.G.; Validation: F.L.; Resource: L.X.; Writing—original draft preparation: X.Y.; Writing—review and editing: X.W. and L.G.; Supervision: L.G.; Visualization: X.Y.; Funding acquisition: X.W. All authors have read and agreed to the published version of the manuscript.
Funding
This research is supported by the Social Science Planning Research Project of Shandong Province No.19CTQJ06, the National Natural Science Foundation of China Nos.61602282, 61772321 and China Post-doctoral Science Foundation No.2016M602181.
Acknowledgments
The authors thank all commenters for their valuable and constructive comments.
Conflicts of Interest
The authors declare that there are no conflict of interest regarding the publication of this article.
References
- Cao, Y.; Gao, J.; Lian, D.F.; Rong, Z.H.; Shi, J.T.; Wang, Q.; Wu, Y.F.; Yao, H.X.; Zhou, T. Orderliness predicts academic performance: Behavioural analysis on campus lifestyle. J. R. Soc. Interface 2018, 15, 20180210. [Google Scholar] [CrossRef] [PubMed]
- Jovanovic, J.; Mirriahi, N.; Gašević, D.; Dawson, S.; Pardo, A. Predictive power of regularity of pre-class activities in a flipped classroom. Comput. Educ. 2019, 134, 156–168. [Google Scholar] [CrossRef]
- Carter, A.S.; Hundhausen, C.D.; Adesope, o. The Normalized Programming State Model: Predicting Student Performance in Computing Courses Based on Programming Behavior. In Proceedings of the Eleventh Annual International Conference on International Computing Education Research, Omaha, NE, USA, 9–13 August 2015. [Google Scholar]
- Conard, M.A. Aptitude is not enough: How personality and behavior predict academic performance. J. Res. Pers. 2006, 40, 339–346. [Google Scholar] [CrossRef]
- Romero, C.; Ventura, S. Data mining in education. Wiley Interdiscip. Rev.-Data Min. Knowl. Discov. 2013, 3, 12–27. [Google Scholar] [CrossRef]
- Amershi, S.; Conati, C. Combining unsupervised and supervised classification to build user models for exploratory. JEDM 2009, 1, 18–71. [Google Scholar]
- Hou, Y.F.; Zhou, P.; Xu, J.; Wu, D.O. Course recommendation of MOOC with big data support: A contextual online learning approach. In Proceedings of the 2018 IEEE Conference on Computer Communications Workshops (INFOCOM WKSHPS), Honolulu, HI, USA, 15–19 April 2018. [Google Scholar]
- Fei, M.; Yeung, D.Y. Temporal models for predicting student dropout in massive open online courses. ICDMW 2015, 256–263. [Google Scholar] [CrossRef]
- Romero, C.; López, M.I.; Luna, J.M.; Ventura, S. Predicting students’ final performance from participation in online discussion forums. Comput. Educ. 2013, 68, 458–472. [Google Scholar] [CrossRef]
- Li, J.; Ren, P.J.; Chen, Z.M.; Ren, Z.C.; Lian, T.; Ma, J. Neural attentive session-based recommendation. In Proceedings of the 2017 ACM on Conference on Information and Knowledge Management, Singapore, 6–10 November 2017; pp. 1419–1428. [Google Scholar] [CrossRef]
- Kumar, A.; Irsoy, O.; Ondruska, P.; Iyyer, M.; Bradbury, J.; Gulrajani, I.; Zhong, V.; Paulus, R.; Socher, R. Ask me anything: Dynamic memory networks for natural language processing. In Proceedings of the 33rd International Conference on Machine Learning(ICML), New York, NY, USA, 24 June 2016; pp. 1378–1387. [Google Scholar]
- Meghji, A.F.; Mahoto, N.A.; Unar, M.A.; Shaikh, M.A. Predicting student academic performance using data generated in higher educational institutes. 3C Tecnología 2019, 8, 366–383. [Google Scholar] [CrossRef]
- You, J.W. Identifying significant indicators using LMS data to predict course achievement in online learning. Internet High. Educ. 2016, 29, 23–30. [Google Scholar] [CrossRef]
- Conijn, R.; Snijders, C.; Kleingeld, A.; Matzat, U. Predicting student performance from LMS data: A comparison of 17 blended courses using Moodle LMS. IEEE Trans. Learn. Technol. 2016, 10, 17–29. [Google Scholar] [CrossRef]
- Di Mitri, D.; Scheffel, M.; Drachsler, H.; Börner, D.; Ternier, S.; Specht, M. Learning pulse: A machine learning approach for predicting performance in self-regulated learning using multimodal data. In Proceedings of the Seventh International Learning Analytics & Knowledge Conference, New York, NY, USA, 13–17 March 2017; pp. 188–197. [Google Scholar] [CrossRef]
- Ma, Y.L.; Cui, C.R.; Nie, X.S.; Yang, G.P.; Shaheed, K.; Yin, Y.L. Pre-course student performance prediction with multi-instance multi-label learning. Sci. China Inf. Sci. 2019, 62, 29101. [Google Scholar] [CrossRef]
- Zhou, M.Y.; Ma, M.H.; Zhang, Y.K.; SuiA, K.X.; Pei, D.; Moscibroda, T. EDUM: Classroom education measurements via large-scaleWiFi networks. In Proceedings of the 2016 ACM International Joint Conference on Pervasive and Ubiquitous Computing, Heidelberg, Germany, 12–16 September 2016; pp. 316–327. [Google Scholar] [CrossRef]
- Sweeney, M.; Rangwala, H.; Lester, J.; Johri, A. Next-term student performance prediction: A recommender systems approach. arXiv 2016, arXiv:1604.01840. [Google Scholar]
- Meier, Y.; Xu, J.; Atan, O.; Van der Schaar, M. Predicting grades. IEEE Trans. Signal Process. 2015, 64, 959–972. [Google Scholar] [CrossRef]
- Lee, J.; Cho, K.; Hofmann, T. Fully character-level neural machine translation without explicit segmentation. TACL 2017, 5, 365–378. [Google Scholar] [CrossRef]
- Johnson, M.; Schuster, M.; Le, Q.V.; Krikun, K. Google’s multilingual neural machine translation system: Enabling zero-shot translation. TACL 2017, 5, 339–351. [Google Scholar] [CrossRef]
- Ren, P.J.; Chen, Z.M.; Li, J.; Ren, Z.C.; Ma, J.; De Rijke, M. RepeatNet: A repeat aware neural recommendation machine for session-based recommendation. In Proceedings of the Thirty-Third AAAI Conference on Artificial Intelligence, Honolulu, HI, USA, 27 January–1 February 2019; pp. 4806–4813. [Google Scholar] [CrossRef]
- Donkers, T.; Loepp, B.; Ziegler, J. Sequential user-based recurrent neural network recommendations. In Proceedings of the Eleventh ACM Conference on Recommender Systems, Como, Italy, 27–31 August 2017; pp. 152–160. [Google Scholar] [CrossRef]
- Liu, B.; Lane, I. Attention-based recurrent neural network models for joint intent detection and slot filling. arXiv 2016, arXiv:1609.01454. [Google Scholar]
- Chung, Y.A.; Wu, C.C.; Shen, C.H.; Lee, H.Y.; Lee, L. Unsupervised learning of audio segment representations using sequence-to-sequence recurrent neural networks. In Proceedings of the Interspeech 2016, Stockholm, Sweden, 20–24 August 2017; pp. 765–769. [Google Scholar] [CrossRef]
- Zhu, Y.; Li, H.; Liao, Y.K.; Wang, B.D.; Guan, Z.Y.; Liu, H.F.; Cai, D. What to Do Next: Modeling User Behaviors by Time-LSTM. In Proceedings of the Twenty-Sixth International Joint Conference on Artificial Intelligence, Melbourne, Australia, 19–25 August 2017; pp. 3602–3608. [Google Scholar] [CrossRef]
- Lykourentzou, I.; Giannoukos, I.; Mpardis, G.; Nikolopoulos, V.; Loumos, V. Early and dynamic student achievement prediction in e-learning courses using neural networks. J. Am. Soc. Inf. Sci. Technol. 2009, 60, 372–380. [Google Scholar] [CrossRef]
- Ramanathan, L.; Parthasarathy, G.; Vijayakumar, K.; Lakshmanan, L.; Ramani, S. Cluster-based distributed architecture for prediction of student’s performance in higher education. Clust. Comput. 2019, 22, 1329–1344. [Google Scholar] [CrossRef]
- Raga, R.C.; Raga, J.D. Early Prediction of Student Performance in Blended Learning Courses Using Deep Neural Networks. In Proceedings of the 2019 International Symposium on Educational Technology (ISET), Hradec Kralove, Czech Republic, 2–4 July 2019; pp. 39–43. [Google Scholar]
- Askinadze, A.; Liebeck, M.; Conrad, S. Predicting Student Test Performance based on Time Series Data of eBook Reader Behavior Using the Cluster-Distance Space Transformation. In Proceedings of the 26th International Conference on Computers in Education(ICCE), Manila, Philppines, 26–30 November 2018. [Google Scholar]
- Okubo, F.; Yamashita, T.; Shimada, A.; Taniguchi, Y.; Shin’ichi, K. On the Prediction of Students’ Quiz Score by Recurrent Neural Network. CEUR Workshop Proc. 2018, 2163. [Google Scholar]
- Yang, T.Y.; Brinton, C.G.; Joe-Wong, C.; Chiang, M. Behavior-based grade prediction for MOOCs via time series neural networks. IEEE J. Selected Topics Signal Process. 2017, 11, 716–728. [Google Scholar] [CrossRef]
- Chung, J.; Gulcehre, C.; Cho, K.; Bengio, Y. Empirical evaluation of gated recurrent neural networks on sequence modeling. arXiv 2014, arXiv:1412.3555. [Google Scholar]
- Peng, Z.C.; Hu, Q.H.; Dang, J.W. Multi-kernel SVM based depression recognition using social media data. Int. J. Mach. Learn. Cybern. 2019, 10, 43–57. [Google Scholar] [CrossRef]
- Zhou, Z.H.; Liu, X.H.; Jiang, Y.R.; Mai, J.G.; Wang, Q.N. Real-time onboard SVM-based human locomotion recognition for a bionic knee exoskeleton on different terrains. In Proceedings of the 2019 Wearable Robotics Association Conference (WearRAcon), Scottsdale, AZ, USA, 25–27 March 2019; pp. 34–39. [Google Scholar]
- Reddy, U.J.; Dhanalakshmi, P.; Reddy, P.D.K. Image Segmentation Technique Using SVM Classifier for Detection of Medical Disorders. ISI 2019, 24, 173–176. [Google Scholar] [CrossRef]
- Hussain, M.; Zhu, W.H.; Zhang, W.; Abidi, S.M.R.; Ali, S. Using machine learning to predict student difficulties from learning session data. Artif. Intell. Rev. 2019, 52, 381–407. [Google Scholar] [CrossRef]
- Al-Sudani, S.; Palaniappan, R. Predicting students’ final degree classification using an extended profile. Educ. Inf. Technol. 2019, 24, 2357–2369. [Google Scholar] [CrossRef]
- Vapnik, V.N. An overview of statistical learning theory. IEEE Trans. Neural Netw. 1999, 10, 988–999. [Google Scholar] [CrossRef]
- Oloruntoba, S.A.; Akinode, J.L. Student academic performance prediction using support vector machine. Int. J. Eng. Sci. Res. Technol. 2017, 6, 588–597. [Google Scholar]
- Urrutia-Aguilar, M.E.; Fuentes-García, R.; Martínez, V.D.M.; Beck, E.; León, S.O.; Guevara-Guzmán, R. Logistic Regression Model for the Academic Performance of First-Year Medical Students in the Biomedical Area. Creative Educ. 2016, 7, 2202. [Google Scholar] [CrossRef]
- Arsad, P.M.; Buniyamin, N.; Ab Manan, J.L. A neural network students’ performance prediction model (NNSPPM). In Proceedings of the 2013 IEEE International Conference on Smart Instrumentation, Measurement and Applications (ICSIMA), Kuala Lumpur, Malaysia, 25–27 November 2013; pp. 1–5. [Google Scholar]
- Kumar, S.A.; Vijayalakshmi, M.N. Efficiency of decision trees in predicting student’s academic performance. Comput. Sci. Inf. Technol. 2011, 2, 335–343. [Google Scholar]
- Liaw, A.; Wiener, M. Classification and regression by random Forest. R News 2002, 2, 18–22. [Google Scholar]
- Kingma, D.P.; Ba, J. A method for stochastic optimization. arXiv 2014, arXiv:1412.6980. [Google Scholar]
- Tan, Y.K.; Xu, X.X.; Liu, Y. Improved recurrent neural networks for session-based recommendations. In Proceedings of the 1st Workshop on Deep Learning for Recommender Systems, Boston, MA, USA, 15 September 2016; pp. 17–22. [Google Scholar]
- Yi, M.X. Analysis and sequencing of the influence factors of the value of review on the low carbon Library Line Based on SPSS data analysis. In Proceedings of the 2018 International Conference on Advances in Social Sciences and Sustainable Development (ASSSD 2018), Fuzhou, China, 7–8 April 2018. [Google Scholar]
© 2020 by the authors. Licensee MDPI, Basel, Switzerland. This article is an open access article distributed under the terms and conditions of the Creative Commons Attribution (CC BY) license (http://creativecommons.org/licenses/by/4.0/).