Abstract
Presently, due to the extended availability of gigantic information networks and the beneficial application of graph analysis in various scientific fields, the necessity for efficient and highly scalable community detection algorithms has never been more essential. Despite the significant amount of published research, the existing methods—such as the Girvan–Newman, random-walk edge betweenness, vertex centrality, InfoMap, spectral clustering, etc.—have virtually been proven incapable of handling real-life social graphs due to the intrinsic computational restrictions that lead to mediocre performance and poor scalability. The purpose of this article is to introduce a novel, distributed community detection methodology which in accordance with the community prediction concept, leverages the reduced complexity and the decreased variance of the bagging ensemble methods, to unveil the subjacent community hierarchy. The proposed approach has been thoroughly tested, meticulously compared against different classic community detection algorithms, and practically proven exceptionally scalable, eminently efficient, and promisingly accurate in unfolding the underlying community structure.
1. Introduction
It is an indisputable fact that in 2019 more than 4.5 billion people used the internet on daily basis, while more than 2.7 billion of which were practically considered active social media users [1]. As the information digitalization massively grows, the need for efficient data representations has never been more immediate.
Unquestionably, data graphs have been one of the prevailing data representations. This lies under the fact that this information model can subtly combine the different, intrinsic data modalities, such as the distinct information entities along with the associations existing between them. Hence, data graphs have been broadly adopted in many scientific sectors—such as chemistry, biology, neuroscience, finance, linguistics, social sciences, software engineering, and digital marketing—mostly because of their obvious interpretation.
Focusing on social media case, the included information can compactly presented with data graphs. Particularly, each user can be mapped to a graph’s vertex and any kind of user interaction—e.g., friendship, liking, following, sharing, interest, reaction, etc.—can be expressed as an interconnection between the corresponding vertices. Undoubtedly, graph analysis has been under the scientific spotlight, aiming not only to introduce efficient information analysis techniques but predominantly to define effective data mining methods.
One of social graphs’ principal characteristics is homophily, which is the natural human tendency to form groups of peers (a.k.a. communities) to primarily associate and interact with. The main scope of community detection’s field [2,3] is the evaluation of homophily in social networks, expressed as the identification of the underlying community structure.
With a wide range of applications—such as recommendation systems, targeted market analysis, viral marketing, social influence analysis, etc.—community detection has been proven significant for revealing the information networks’ inner mechanisms and evolution. However, as clearly demonstrated in [3], there is not a universally accepted definition of the community. Nevertheless, by concentrating on social graph’s context, a community can intuitively be defined as the group of vertices which are more densely connected with each other (a.k.a., intra-connected) than connected with the rest of the graph (a.k.a., inter-connected). Thus, community detection can alternatively be interpreted as the edges’ classification to either intra-connection, which are the edges linking vertices of the same community, or inter-connection that are the edges linking vertices of different communities [3,4].
As thoroughly described in [2,3,4,5,6,7,8,9,10], due to community detection’s widespread application, ample research has already been conducted to efficiently unveil the information networks’ subjacent community structure. The classic community detection algorithms are originally designed to be generally applied to any information network. These techniques—such as the Girvan–Newman [6] algorithm, edge centrality [7] method, geodesic edge betweenness [2] approach, Kernighan–Lin algorithm [2], Latora–Marchiori [2] algorithm, etc.—are basically recursive methods of high polynomial computational complexity that predominantly leverage an iteratively modified and repetitively calculated set of global network topology metrics, in order to extract the underlying community hierarchy from any possible network. Nevertheless, as meticulously described in [5,11], the classic algorithms’ capacity has practically confirmed to be profoundly limited in terms of scalability, outcome consistency, and overall reliability. Thus, their application could doubtlessly be considered infeasible in case of today’s social media graphs, due to their excessive computational demands.
Therefore, our previous work [4]—based on the amalgamation of prediction with community detection [12,13,14,15,16,17,18,19,20]—introduced the community prediction concept [4] that promises extremely scalable and noticeably efficient solutions with complexity towards to linear, as regards the data graph’s edges. Contrary to the application of rigid, recursive, and computationally overdemanding policies that classic algorithms dictate, the principal intention of community prediction is to properly classify the data graph’s edges to inter-connection or intra-connection, by explicitly focusing on the information network’s topological idiosyncrasies. This is practically accomplished by training a sophisticated learner according to a small but sufficiently descriptive subset of vertices, which would obviously predict the subjacent community structure of the original graph in linear time.
In this article, on the basis of community prediction and influenced by the impressive performance and the decreased variance of bagging ensemble methods, a novel distributed community prediction methodology is introduced. Specifically, having analyzed the original social graph to a fully descriptive set of network topology metrics [21], a set of random subgraphs of predefined size is extracted. To each of which, the Louvain community detection algorithm [10], which broadly serves as the universally accepted community detection benchmark, is applied. This way, each included edge is properly labeled as either inter-connection or intra-connection. Hence, the previously extracted subgraphs are suitably transformed to supervised, machine learning-ready training datasets. Subsequently, with each of the aforementioned training datasets, a distinct distributed logistic regression model is trained to behave similarly to the Louvain algorithm [10,22]. Therefore, based on the bootstrap aggregating ensemble method, the previously trained learners are properly combined to form one predictive meta-model. This ensemble learner would eventually be applied to the original graph to linearly disclose its underlying community hierarchy.
The exhaustive experimentation with numerous real-life social media graphs and the detailed comparison against different classic community detection algorithms have evidently demonstrated that this auspicious methodology has not only demonstrated remarkable scalability and prominent efficiency, but consistently displayed noticeable prediction accuracy and supreme stability.
The remainder of this manuscript is organized as follows. In Section 2, the necessary background is presented. In Section 3, the proposed methodology and its implementation is comprehensively analyzed. In Section 4, the experimentation process is described and thoroughly assessed. Finally, in Section 5, the final conclusions are outlined accompanied by the potential future improvements.
2. Background
2.1. Classic Community Detection Methods and Algorithms
Due to the profitable application of community detection in plenteous scientific areas, an affluent set of algorithms [2,3,4,5,6,7,8,9,10] has already been published to tackle this a NP-hard class problem. From methods that are exclusively based on the repetitive calculation of a global network topology metric, to alternatives inspired by discrete mathematics and physics, the pluralism of classic community detection processes is indeed remarkable. Depending on the evaluation strategy used to unveil the subjacent hierarchy, the existing community detection techniques can roughly be distinguished to divisive, agglomerative, or other community detection algorithms.
The iterative processes aiming to identify and remove all the inter-connection edges, by recursively maximizing a global topology criterion are classified as divisive algorithms [2,3,6,7,8]. In these techniques, at each iteration step, a finer community hierarchy layer is formed. Thus, the community detection evolution of any divisive algorithm could obviously be represented by dendrograms.
The most prevalent divisive algorithm is the one introduced by Girvan and Newman [6]. In this, the underlying community structure is revealed after the removal of all inter-connection edges, as indicated by the maximization of edge betweenness [6] at each repetition. Specifically, by originally considering the entire graph as a single community and by iteratively calculating the shortest paths between any pair of nodes, the edges engaging the most, are tagged as inter-connection edges and thus removed. Those edges are expected to have the wider information spread and hence are due to connect nodes of different communities [2]. Despite its conceptual simplicity and straightforward implementation, the Girvan–Newman algorithm [6] is assuredly considered overdemanding and its application is limited to networks of merely few thousands of vertices. Other divisive alternatives include the calculation of different topological metrics—such as the geodesic edge betweenness [2], random-walk edge betweenness [2], vertex centrality [2], edge centrality [7], information centrality [8], etc.—or the incorporation of more sophisticated data structures as in case of the Clauset–Newman –Moore algorithm [3].
Opposing to the aforementioned top-down approaches, the agglomerative community detection algorithms try to apply bottom-up strategies to unveil the subjacent community structure of a given information graph [2,3,9,10]. By originally considering each vertex as a distinct community (a.k.a., singleton) and by repetitively merging the directly connected communities that maximize a global network topology criterion, the principal scope of these methods is to form communities of communities, aka meta-communities, until no further merge is feasible. Hence, the stepwise execution of the agglomerative algorithms, similarly to the divisive, can also be presented as dendrograms.
The prevailing, among the opulent set of agglomerative methods in terms of overall efficiency and interpretability is the one introduced by Blondel (a.k.a., Louvain algorithm) [10]. This greedy approach, which initially considers singletons, aims to recursively compose meta-communities by globally maximizing the Louvain modularity measure [10]. This network topology criterion mathematically expresses the comparison of the original graph’s density over the intra-connection and the inter-connection densities of a potentially formed meta-community. It is worth mentioning that the modularity value is repetitively calculated until either no further merging is feasible, or a predefined number of iterations has occurred. Despite the copious different alternatives proposed—such as the Xiang algorithm [2], InfoMap [3], fast greedy algorithm [3], label propagation method [3], Kernighan–Lin algorithm [2], the OCDLCE [11], etc.—the Louvain algorithm’s performance, as adequately demonstrated [2,3,10], is universally accepted as the classic community detection golden standard.
The rest of the published methods, extend beyond the network analysis context and fall under the other community detection algorithms category [2,3,5,8,9]. These techniques principally aim to disclose the subjacent community structure by:
- Projecting the original community detection definition to conceptually different contexts and thereby transform the graph representation to other alternatives, aka transformation methods,
- Enhancing the community extraction criteria with the inherent vertex information, aka node attributes information or profile information, and by
- Applying general probabilistic heuristic criteria.
Despite the fact that those techniques might be deemed comparatively more accurate in detecting the underlying community hierarchy, the other category algorithms have limited application to small information networks only, due to the exhaustive statistical analysis required and the intrinsic sensitivity on the information types supported. Indicatively, some of the most representative ones are spectral optimization [2], Wu and Huberman algorithm [2], Markov chains & random walks [3], CESNA [8], genetic algorithms [2], CODICIL [8], and PICS [8].
As strongly emphasized in [2,3], as the size of contemporary information networks continuously grows, with the modern social graphs outreaching the billions of vertices, it seems highly unrealistic to depend on community detection solutions of higher computational complexity than linear. Hence, as plainly shown in Table 1, due to their high polynomial complexity, no classic community detection algorithm can generally be considered the optimal solution for tackling this NP-hard class problem in case of big data graphs.

Table 1.
Computation complexity on sparse networks per classic community algorithm, where n depicts the number of nodes, m the number of edges, d the depth of the dendrogram and P the number of repetitions.
2.2. Community Detection and Prediction Concept Combination
The primary intention of community prediction [4] was the introduction of an approximation methodology that by properly training a distributed learner to behave similarly to a classic community detection algorithm, having the additional advantage of stunning scalability and eminent efficiency, would feasibly proceed to the qualitative disclosing of the underlying community structure of big data social networks. Therefore, the concept of community prediction is practically a synonym for approximately detecting/predicting the subjacent community structure of any given information network based on its rudimentary network topology measures, regardless of its size. In contrast, the currently published research work [12,13,14,15,16,17,18,19], which claim to mix the community detection field with the prediction’s concept, have fundamentally different incentives and objectives to the best of our knowledge.
Firstly, with effective application in viral marketing and social influence analysis, the [12,13] approaches target on the prediction of the community structure’s evolution through pattern recognition and content analysis. In both cases, the a priori knowledge of the initial community structure is assumed.
Furthermore, due to the incompleteness and the intrinsic defects of real-life data, another critical use of prediction and community detection amalgamation is the community structure improvement. With crucial application in node classification, graph partitioning, text mining and linguistics, the main scope of the Community Detection Based on Link Prediction methods [14,15,16,17] (a.k.a., DBLP methods in short), is to apply complementary, post-processing, link prediction techniques on the already extracted hierarchy in terms of community structure recovering and link enhancement. The existing published CDBLP material include but not limited to:
- joint predictive models based on purely network topology metrics [14,15],
- residualized factor adaptation analysis methods [16], and
- matrix completion techniques that target to generate ideal block-diagonal community matrices [17].
Contrary to the CDBLP methods, the subjacent community hierarchy information can alternatively be used as input for increasing the accuracy of link prediction [18,19]. In particular, founded on the principle that inter-community nodes have a much deeper impact on graph dynamics and evolution, comparing to the intra-community ones, the community structure is considered crucial for the community bridge boosting prediction model introduced in [18]. Lastly, by relying on the assumption that the probability of connecting two nodes is proportional to the relevance and the betweenness of their corresponding communities, the objective of the similarity based method in [19] leverage the subjacent community structure to repetitively calculate the closeness between any pair of communities.
2.3. Ensemble Learning Methods
Due to the wide availability of distributed processing resources, the application of formerly considered, over-demanding methods has flourished. Therefore, ensemble learning, which is a machine learning technique that aggregates the output of several, properly trained, base estimators, has been broadly adopted to tackle various, computationally demanding challenges such as face recognition, fraud detection, financial decision-making, intrusion detection, and land cover mapping. Contrary to the single estimator approaches, the ensemble learning methods manage to prominently improve the prediction performance and eminently diminish the prediction’s reducible error, by aggregating the results of multiple, independently trained, base estimators. Thus, a prediction ensemble meta-model is generally considered superior regarding stability, generalization, and robustness, compared to the single estimator learner case.
The set of ensemble methods could be coarsely divided to either boosting (a.k.a., sequentially trained methods), or bagging (a.k.a., parallelly trained methods).
The boosting methods principally aim to reduce the predictive bias by exploiting the dependence of the generated sequence of base learners. This arises from the fact that each base learner is trained in sequence on an appropriate weighted version of the training data. Hence, each base learner is directly affected by the prediction performance of those previously built.
Contrarily, the bagging methods’ primary intention is the predictive variance reduction, by leveraging the generated base estimators’ independence. Specifically, for a given dataset, the bagging methods dictate the extraction of small subsets of training observations by applying the sampling with replacement technique. Therefore, a base prediction model might be properly trained for each of the previously extracted bootstrap training samples, which predictions would be aggregated, with votes of equal weight, to make the final bagging prediction. Therefore, by introducing randomization into the training process and by consequently ensembling the individual predictions, the bagging methods ensure variance reduction, high prediction stability, and overfitting avoidance.
3. Proposed Methodology
In reference to cloud computing’s low cost, limitless scalability, high resiliency, and unrestricted resource availability and grace to bagging ensemble methods’ innate extensibility to distributed calculation, a distributed bagging community prediction methodology is introduced. This promising methodology is graphically presented in Figure 1 and meticulously explained below.
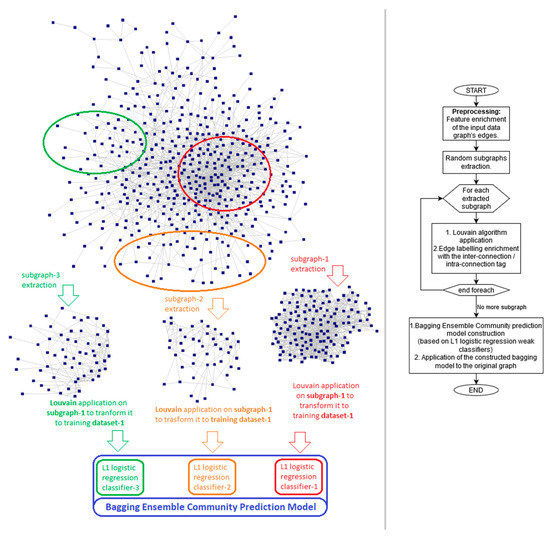
Figure 1.
Overview of the distributed bagging community prediction methodology.
Initially, the feature enrichment process takes place. Considering that the plain topological information of an edge might not be adequate for the proper extraction of the subjacent community hierarchy, it is highly expected that the correct inter-connection/intra-connection classification might be significantly reliant to its kth-depth network topology information.
It seems self-evident that a vertex is more likely to be assigned to the community where most of its neighbors belong. Thus, based on community’s intuitive definition and by assuming that the principle of locality is strongly correlated with the community prediction process, each edge is properly enriched with the knowledge of its kth-depth network topology status.
As experimentation process clearly demonstrated, any feature enrichment process for depths higher than the third degree, tended to converge to the original graph’s average values and hence did not essentially contribute any significant information. As a result, the feature enrichment process for all the experiments conducted has not exceeded the third depth.
Hence, considering an edge, its adjacent pair of nodes and each of their corresponding sets of distinct vertices up to the kth-depth, the subsequent set of network topology metrics [21] is calculated for all the depths that are less or equal to the kth:
- The number of common neighbors: this is the number of common nodes for the sets of the kth-depth nodes of the corresponding subjacent vertices. It should be noted that since a common node might be of a different depth for each impeding node, each kth-depth set should include all nodes up to the kth-depth.
- The loose similarity: this is the fraction of the relevant kth-depth sets’ common nodes, over the union’s total number of nodes.
- The dissimilarity: this is the fraction of the relevant kth-depth sets’ uncommon nodes, over the union’s total number of nodes.
- The edge balance: this is the fraction of the absolute difference between of the relevant kth-depth distinct sets, over the union’s total number of nodes. This feature’s value ranges from 0 to 1, with values close to 0 indicating a balanced edge that have merely equal kth-depth vertices on both sides.
- The edge information: considering an edge on the graph’s kth-power adjacency matrix, this metric quantifies the number of distinct kth-length paths between the impeding vertices [23] and indicates the impending pair of nodes’ interconnection strength.
Subsequently, the bootstrap training subgraphs are extracted. Specifically, by concurrently initiating a BFS network crawler from different, randomly selected vertices, each subgraph’s extraction process stops as soon as a predefined number of nodes has been collected. This way, the necessary integrity of bagging’s sampling with the replacement criterion is ensured.
Complementarily to bootstrap training subgraphs’ extraction step, the inter-connection/intra-connection classification tagging per included edge is required for the transformation of the previously extracted subgraphs to community prediction-ready training datasets. Thereby, the Louvain algorithm [10,22], which performance is universally considered the community detection’s golden standard, is applied to each of the extracted training subgraphs.
It should be stressed that as long as the size of the extracted training datasets is substantially small, even the application of Louvain algorithm’s classic implementation [10] might not raise any performance-wise concerns. However, in terms of generalizability, the distributed version of the Louvain algorithm [22] was adopted in any conducted experiment.
Additionally, the fact that Louvain algorithm’s performance is strongly dependent from the execution’s initiation node and the traversal strategy applied should not be overlooked. Ergo, in terms of tagging validity and classification accuracy, several executions, with different execution parameters are evidently required, for properly classifying each included edge. Despite the significant calculation overhead introduced, the re-execution of the Louvain algorithm’s distributed version [22] is indubitably not restrictive, since the size of each extracted subgraph is considerably small.
Therefore, by having transformed the bootstrap extracted subgraphs to appropriate community prediction ready training datasets, the construction of the bagging prediction meta-model may now occur. By considering the Occam’s razor principle, which roughly states that the simpler solutions are more likely to be proven more accurate compared to complex ones, and due to the linear learners’ exceptional performance on big data, the logistic regression model is selected as bagging’s base estimator.
However, the consideration of the full set of the already calculated, kth-depth network topology metrics might not only introduce unnecessary prediction complexity but primarily reduce the prediction’s efficiency and increase the overfitting possibility due to the curse of dimensionality and the potential existence of the collinearity and multicollinearity effects. Thus, in terms of dimensionality reduction and by considering the intrinsic characteristics of community detection’s process, the L1 regularization penalty is applied to solely consider the most informative features.
Thereafter, by taking advantage of Spark MLlib’s libraries [24], a distributed bagging ensemble community prediction meta-learner is built, consisting of several, independent, L1 regularized, distributed logistic regression classifiers. This distributed bagging ensemble community prediction model would eventually be applied to the original information network, to predict its underlying community hierarchy.
4. Experiments and Results Discussion
To assess the proposed distributed bagging community prediction methodology, which in terms of brevity will now be referred as the bagging community prediction methodology, the prediction performance and the quality of the extracted community structure are compared against:
- the community prediction methodology requiring the extraction of a representative subgraph [4], which will be now referred as the representative subgraph’s community prediction methodology in terms of brevity,
- the distributed implementation of the Louvain’s community detection algorithm [10,22] and
- the NetworkX’s implementation of the Clauset–Newman–Moore’s community detection algorithm [3,25].
The experimentation process was limited to real but rather small social networks, considering the size of real-life social networks and the capabilities of the proposed methodology, due to the fact that the Clauset–Newman–Moore [25] and the Louvain [22] community detection algorithms intrinsically introduce strong restrictions regarding the size of the analyzed datasets. However, the comparison made for the extensively used and thoroughly analyzed social networks of Table 2, can certainly be deemed complete and insightful.
Table 2.
Evaluated datasets.
Regarding the comparison of the corresponding community prediction methodologies, both have deliberately been trained to behave similarly to the Louvain community detection algorithm [10,22]. Hence, the community structure disclosed by the distributed Louvain algorithm version [22] would be considered the ground truth for the prediction performance comparison between them.
All the experiments were conducted in an eight-node Spark 2.3.2 cluster, with 8 GBs of RAM and four virtual processing cores per execution node.
The adoption of bagging ensemble learning method might initially be deemed over-demanding since it natively requires many additional calculations. However, as the conducted experimentation process clearly demonstrated, the necessity for extracting a representative to the original subgraph have practically been proven at least 25 times slower in the average case. Even if the Tiny Sample Extractor is generally considered one of the most efficient representative sample extraction algorithms, the required repetitive calculation of the complementary cumulative distribution function (CCDF), practically introduces a significant calculation overhead. Specifically, in case of the bigger social media graphs, as regards the number of edges, the total execution time required for the representative subgraph’s community prediction methodology was dramatically bigger comparing to the bagging ensemble method’s one. For instance, in case of the Epinions [34] social graph, the execution time overhead had consistently exceeded two orders of magnitude.
Another equally critical concern is the size of the extracted subgraph. In terms of ensuring the extracted subgraph’s representativity, the representative subgraph’s prediction methodology [4] does not define any limitation regarding the amount of nodes required. That can be proven pernicious, since requiring the extraction of a representative subgraph of similar size to the original graph can obviously be considered unacceptable in case of contemporary social graphs. Building on that, it is notable that by attempting to reproduce the remarkable classification performance of the said community prediction methodology [4], the experimentation outcome clearly revealed that the extracted representative subgraph size should have consistently exceeded the 75% of the original graph for any social network examined.
Hence, by bounding the extracted subgraph’s size and consequently dictating both community prediction methodologies to use training datasets of equal sizes, in terms of comparison fairness, the bagging methodology’s supremacy has been indisputable.
Regarding the classification performance comparison, the classic prediction performance metrics are being considered. Specifically, in reference to the community prediction concept, those can be translated as shown below:
- Accuracy: The fraction of the correctly classified edges, either inter-connected or intra-connected, over all the predictions made.
- Specificity: The fraction of the correctly predicted intra-connection edges over all the intra-connection predictions made.
- Sensitivity: The fraction of the correctly predicted inter-connection edges over all the inter-connection predictions made.
- Precision: The fraction of the correctly predicted inter-connection edges over the truly inter-connection edges.
Therefore, by applying the execution parameters shown in Table 3, the experimentation process was conducted. It is notable that each run, per different social graph and distinct community prediction methodology, have been repeated five times to ensure the conclusions’ validity and the generated outcome’s robustness and determinism. The classification performance for both community prediction methodologies are graphically presented in Figure 2, while the relevant performance improvement is summarized in Table 4. At this point it should be noted that the values reported are practically the mean of the five different executions.
Table 3.
Execution parameters applied per evaluated dataset.
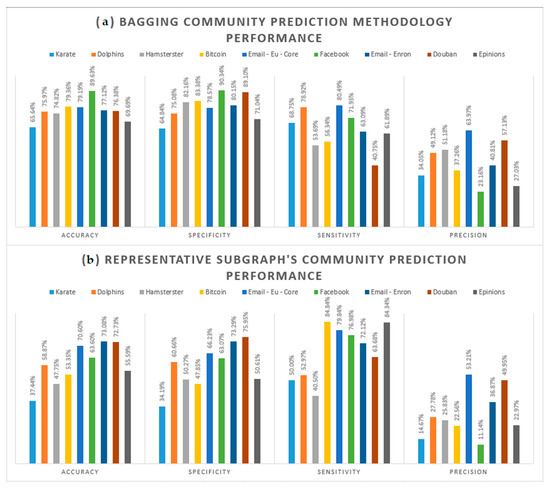
Figure 2.
Prediction performance per community prediction methodologies. (a) Bagging community prediction methodology’s prediction performance; (b) Representative subgraph’s community prediction methodology’s [4] prediction performance.
Table 4.
Community prediction performance improvement. The comparison of the bagging community prediction performance over the representative subgraph’s community prediction methodology.
As Figure 2 and Table 4 succinctly establish, the overall prediction performance of the bagging community prediction methodology steadily outperformed the corresponding of the representative subgraph’s one. By consistently reporting remarkable accuracy results that exceeded the 76.4% in average, the bagging community prediction methodology is systematically proven superior, by 17.2%, in predicting the correct classification label, over the representative subgraph methodology. Built on this, it is safe to conclude that the bagging’s sampling with replacement strategy is practically proven more appropriate for the social graphs case, compared to the extraction of one representative subgraph.
Additionally, it is self-evident that the recently introduced bagging community prediction methodology practically generates denser intra-connected communities, since its reported specificity outperforms the outstanding 79.4% in the average case. By continuously accomplish to correctly classify any social network’s intra-connection edges, the revealed community structure’s validity is not only ensured, but also substantially enhanced by 21.39%, comparing to the corresponding of the representative subgraph’s community prediction methodology [4].
Concentrating on the inter-connection edges identification, the sensitivity metric demonstrates mediocre results for both methodologies, indicating that there is certainly great room for improvement in this direction. Specifically, both methodologies prediction’s performances are highly on the extracted sample used for training purposes. Hence, considering that sensitivity is strongly correlated with the identification of the inter-connection edges, it is more than obvious that both methodologies would poorly identify inter-connection edges, should the training dataset not include a sufficient amount of relevant labeled edges. However, this case should not be deemed detrimental since the original graph’s severe fragmentation is avoided and hence the original information network’s cohesion is preserved.
Nevertheless, in terms of correct inter-connection identification performance comparison, the calculated precision justifies the bagging’s community prediction dominance by 13.19% in average. Specifically, the bagging community prediction methodology persistently predicts more inter-connection edges that truly are, compared to the representative subgraph methodology [4].
Apart from consistently validating the superiority of the proposed methodology in terms of prediction accuracy, the extracted community hierarchy’s performance should also be carefully examined through the comparison of the proposed methodology with the classic community detection algorithms of Louvain [10,22] and Clauset–Newman–Moore [3,25]. However, this comparison should not include the execution efficiency, since it seems absolutely pointless to contrast the classic community detection implementations with one of linear computational complexity in terms of execution performance.
Thus, only the qualitative characteristics of the corresponding unveiled community hierarchies worth to be thoroughly compared per each evaluated dataset. At this point, it should be strongly outlined that the disclosed community hierarchies of the aforementioned community detection algorithms are universally accepted as community detection’s golden standards.
To properly compare the quality of the returned community structures the following quality measures are taken into consideration:
- Coverage [2]: The coverage of partition is the ratio of the intra-connection edges to the total number of edges in the graph.
- Performance [2]: The performance of a partition is the ratio of the number of intra-connection edges and inter-connection non-edges with the total number of potential edges.
As it is plainly demonstrated in Figure 3, the bagging community detection methodology’s extracted community hierarchy tends to be more cohesive and each distinct extracted community structure is systematically more densely intra-connected comparing to the respective of the Louvain [10,22] and Clauset–Newman–Moore [3,25] case. Specifically, by consistently outreaching by 26.32% and 17.97% on average of the reported coverage values of the aforementioned algorithms respectively, it appears definite that the proposed community prediction methodology’s disclosed community structures are steadily less fragmented and continually more densely intra-connected.
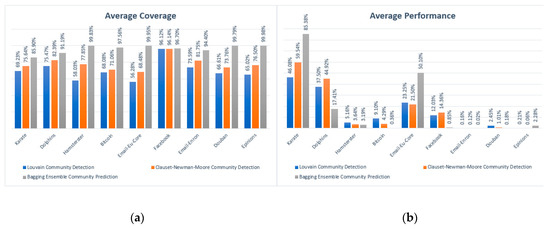
Figure 3.
Qualitative performance comparison of the bagging community prediction methodology (grey columns) against the Louvain [10,22] (blue columns) and Clauset–Newman–Moore [3,25] (orange) community detection algorithms. (a) Average coverage per applied method; (b) Average performance per applied method.
Additionally, regarding the community hierarchy’s performance, it seems axiomatic that only the cases of denser social media graphs, such as the Email-Eu-Core [30] and Facebook [31], should only be taken into account. Since the community detection’s performance can alternatively be interpreted as the ratio of the inter-connection edges over the total number of edges of the complete social graph, it seems rather unrealistic to compare the performance values for the rest of the graphs which could obviously be considered sparse. This conclusion is also cross-verified from the totally insignificant reported performance values in those graphs. Thus, by focusing on the previously mentioned denser graphs, it is ratified that the bagging community prediction methodology seems to partition more efficiently the imminent social graphs, since its corresponding performance outreaches the of Louvain [10,22] and Clauset–Newman–Moore [3,25] by 15.67% and 7.55% respectively on average.
In terms of completeness, Figure 4 presents the returned community hierarchy structures per each method applied, in the case of the Email-Eu-Core [30] social graph, to visually assess each generated community structure.
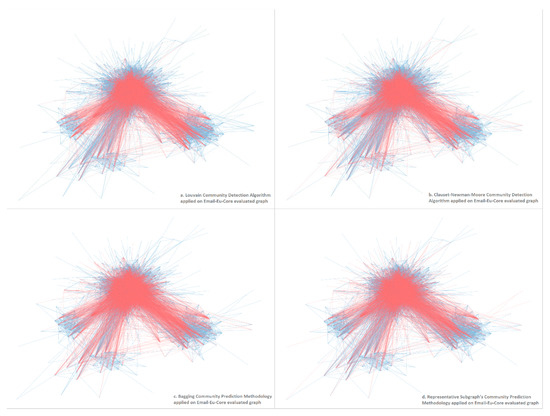
Figure 4.
Graphical comparison of the different generated community structures for the Email-Eu-Core [30] social graph per each method applied. (a) Louvain community detection algorithm [10,25]; (b) Clauset–Newman–Moore community detection algorithm [3,25]; (c) bagging community prediction methodology; (d) representative subgraph’s community prediction methodology [4].
In this figure, by representing the inter-connection edges with the red and the corresponding intra-connection edges with the blue colored edges, displays the community structure unveiled by:
- the Louvain community detection algorithm’s distributed version [22];
- the Clauset–Newman–Moore community detection algorithm [3,25];
- the bagging ensemble community prediction methodology; and
- the representative subgraph’s community prediction methodology [4]
As conspicuously presented, the proposed community detection methodology generates a more discernible and more accurate community structure comparing to the respective of the other methods.
5. Conclusions
In this article, a novel distributed bagging community prediction methodology has been introduced that has practically been proven superior to the classic community detection algorithms in terms of overall execution performance and qualitative community hierarchy extraction. The extensive experimentation process on several real social networks has unquestionably confirmed the remarkable scalability, the conspicuous efficiency, and the promiscuous prediction accuracy of this methodology.
Despite the encouraging results, there is certainly room for improvement by considering:
- The adoption of more accurate and more complex base classifiers,
- The consideration of more sophisticated subgraph extraction techniques that would ensure data graph’s descriptiveness and exclude information multi-occurrence,
- The examination of the depth-first search strategy during the subgraphs extraction step,
- The reconsideration and the potential extension of the network topology metrics used,
- The prediction enhancement by including the node attributes information,
- The consideration of different community detection algorithms in terms of subgraphs’ edges classification.
All of these considerations are left for future work.
Author Contributions
For research articles with several authors, a short paragraph specifying their individual contributions must be provided. The following statements should be used “Conceptualization, G.P. and C.M. methodology, G.P. software, I.O.R. validation, G.P. formal analysis, G.P. investigation, G.P. resources, G.P. and C.M. writing-original draft preparation, G.P. writing-review and editing, G.P. and C.M. visualization, I.O.R. supervision, G.P. project administration, C.M. funding acquisition, C.M. All authors have read and agreed to the published version of the manuscript”, please turn to the CRediT taxonomy for the term explanation. Authorship must be limited to those who have contributed substantially to the work reported.
Funding
Christos Makris has been co-financed by the European Union and the Greek national funs through the Regional Operational Program “Western Greece 2014–2020”, under the Call “Regional Research and Innovation Strategies for Smart Specialization—RIS3 in Information and Communication Technologies” (project: 5038701 entitled “Reviews Manager: Hotel Reviews Intelligent Impact Assessment Platform”).
Conflicts of Interest
The authors declare no conflicts of interest.
References
- Internet Fact. Available online: https://hostingfacts.com/internet-facts-stats/ (accessed on 12 February 2020).
- Schaeffer, S. Graph Clustering. Comput. Sci. Rev. 2007, 1, 27–64. [Google Scholar] [CrossRef]
- Lancichinetti, A.; Kivelä, M.; Saramäki, J.; Fortunato, S. Characterizing the community structure of complex networks. PLoS ONE 2010, 5, e11976. [Google Scholar] [CrossRef] [PubMed]
- Makris, C.; Pettas, D.; Pispirigos, G. Distributed Community Prediction for Social Graphs Based on Louvain Algorithm. AIAI 2019, 500–511. [Google Scholar] [CrossRef]
- Fortunato, S. Community detection in graphs. CoRR. arXiv 2009, arXiv:0906.0612. [Google Scholar]
- Newman, M.E.; Girvan, M. Finding and Evaluating Community Structure in Networks. Phys. Rev. 2004, 69, 026113. [Google Scholar] [CrossRef] [PubMed]
- Girvan, M.; Newman, M.E. Community structure in social and biological networks. Proc. Natl. Acad. Sci. USA 2002, 99, 7821–7826. [Google Scholar] [CrossRef] [PubMed]
- Jia, C.; Li, Y.; Carson, M.B.; Wang, X.; Yu, J. Node Attribute-enhanced Community Detection in Complex Networks. Sci. Rep. 2017, 7, 2626. [Google Scholar] [CrossRef]
- Devi, J.; Eswaran, P. An Analysis of Overlapping Community Detection Algorithms in Social Networks. Procedia Comput. Sci. 2016, 89, 349–358. [Google Scholar] [CrossRef]
- Blondel, V.D.; Guillaume, J.L.; Lambiotte, R.; Lefebvre, E. Fast unfolding of community hierarchies in large networks. J. Stat. Mech. Theory Exp. 2008, 2008, P10008. [Google Scholar] [CrossRef]
- Peel, L.; Larremore, D.B.; Clauset, A. The ground truth about metadata and community detection in networks. Sci. Adv. 2017, 3, e1602548. [Google Scholar] [CrossRef] [PubMed]
- Takaffoli, M.; Rabbany, R.; Zaïane, O.R. Community Evolution Prediction in Dynamic Social Networks. In Proceedings of the 2014 IEEE/ACM International Conference on Advances in Social Networks Analysis and Mining (ASONAM 2014), Beijing, China, 17–20 August 2014; pp. 9–16. [Google Scholar] [CrossRef]
- Appel, A.P.; Cunha, R.L.; Aggarwal, C.C.; Terakado, M.M. Temporally Evolving Community Detection and Prediction in Content-Centric Networks. In Proceedings of the European Conference, ECML PKDD 2018, Dublin, Ireland, 10–14 September 2018. [Google Scholar] [CrossRef]
- Cherifi, H.; Gonçalves, B.; Menezes, R.; Sinatra, R. Improving Network Community Structure with Link Prediction Ranking. In Complex Networks VII; Springer International Publishing: Cham, Switzerland, 2016. [Google Scholar] [CrossRef]
- Cheng, H.-M.; Zhang, Z. Community Detection Based on Link Prediction Methods. CoRR. arXiv 2016, arXiv:1611.00254. [Google Scholar]
- Zamani, M.; Schwartz, H.A.; Lynn, V.E.; Giorgi, S.; Balasubramanian, N. Residualized Factor Adaptation for Community Social Media Prediction Tasks. arXiv 2018, arXiv:1808.09479. [Google Scholar]
- Shao, J.; Zhang, Z.; Yu, Z.; Wang, J.; Zhao, Y.; Yang, Q. Community Detection and Link Prediction via Cluster-driven Low-rank Matrix Completion. In Proceedings of the 28th International Joint Conference on Artificial Intelligence, Macao, China, 10–16 August 2019; pp. 3382–3388. [Google Scholar] [CrossRef]
- Gao, F.; Musial, K.; Gabrys, B. A Community Bridge Boosting Social Network Link Prediction Model. In Proceedings of the 2017 IEEE/ACM International Conference on Advances in Social Networks Analysis and Mining, Sydney, Australia, 31 July–3 August 2017; pp. 683–689. [Google Scholar] [CrossRef]
- Li, L.; Fang, S.; Bai, S.; Xu, S.; Cheng, J.; Chen, X. Effective Link Prediction Based on Community Relationship Strength. IEEE Access 2019, 7, 43233–43248. [Google Scholar] [CrossRef]
- Sethu, H.; Chu, X. A new algorithm for extracting a small representative subgraph from a very large graph. arXiv 2012, arXiv:1207.4825. [Google Scholar]
- Cukierski, W.; Hamner, B.; Yang, B. Graph-based features for supervised link prediction. In Proceedings of the International Joint Conference on Neural Networks, San Jose, CA, USA, 31 July–5 August 2011; pp. 1237–1244. [Google Scholar] [CrossRef]
- Sotera Distributed Graph Analytics (DGA): Sotera Defence Solution. Available online: https://github.com/Sotera/spark-distributed-louvain-modularity.git (accessed on 12 February 2020).
- Kranda, D. The Square of Adjacency Matrices. arXiv 2012, arXiv:1207.3122. [Google Scholar]
- Meng, X.; Bradley, J.; Yavuz, B.; Sparks, E.; Venkataraman, S.; Liu, D.; Freeman, J.; Tsai, D.B.; Amde, M.; Owen, S.; et al. MLlib: Machine Learning in Apache Spark. J. Mach. Learn. Res. 2016, 17, 1235–1241. [Google Scholar]
- NetworkX Clauset–Newman–Moore Implementation. Available online: https://networkx.github.io/documentation/latest/reference/algorithms/generated/networkx.algorithms.community.modularity_max.greedy_modularity_communities.html (accessed on 12 January 2020).
- Zachary Karate Club Network Dataset. KONECT, April 2017. Available online: http://konect.uni-koblenz.de/networks/ucidata-zachary (accessed on 12 February 2020).
- Dolphins Network Dataset—KONECT, April 2017. Available online: http://konect.uni-koblenz.de/networks/dolphins (accessed on 12 February 2020).
- Hamster Friendships Network Dataset. KONECT, April 2017. Available online: http://konect.uni-koblenz.de/networks/petster-friendships-hamster (accessed on 12 February 2020).
- Kumar, S.; Hooi, B.; Makhija, D.; Kumar, M.; Subrahmanian, V.S.; Faloutsos, C. REV2: Fraudulent User Prediction in Rating Platforms. 11th ACM International Conference on Web Searchand Data Mining (WSDM). 2018. Available online: https://snap.stanford.edu/data/soc-sign-bitcoin-alpha.html (accessed on 12 February 2020).
- Yin, H.; Benson, A.R.; Leskovec, J.; Gleich, D.F. Local Higher-order Graph Clustering. In Proceedings of the 23rd ACM SIGKDD International Conference on Knowledge Discovery and Data Mining. 2017. Available online: https://snap.stanford.edu/data/email-Eu-core.html (accessed on 12 February 2020).
- McAuley, J.; Leskovec, J. Learning to Discover Social Circles in Ego Networks. NIPS. 2012. Available online: https://snap.stanford.edu/data/ego-Facebook.html (accessed on 12 February 2020).
- Klimmt, B.; Yang, Y. Introducing the Enron corpus. CEAS Conference. 2004. Available online: https://snap.stanford.edu/data/email-Enron.html (accessed on 12 February 2020).
- Douban Network Dataset. KONECT, April 2017. Available online: http://konect.uni-koblenz.de/networks/douban (accessed on 12 February 2020).
- Richardson, M.; Agrawal, R.; Domingos, P. Trust Management for the Semantic Web. ISWC, 2003. Available online: https://snap.stanford.edu/data/soc-Epinions1.html (accessed on 12 February 2020).
© 2020 by the authors. Licensee MDPI, Basel, Switzerland. This article is an open access article distributed under the terms and conditions of the Creative Commons Attribution (CC BY) license (http://creativecommons.org/licenses/by/4.0/).