Abstract
Inferring customers’ preferences and recommending suitable products is a challenging task for companies, although recommender systems are constantly evolving. Loyalty is an indicator that measures the preference relationship between customers and products in the field of marketing. To this end, the aim of this study is to explore whether customer loyalty can improve the accuracy of the recommender system. Two algorithms based on complex networks are proposed: a recommendation algorithm based on bipartite graph and PersonalRank (BGPR), and a recommendation algorithm based on single vertex set network and DeepWalk (SVDW). In both algorithms, loyalty is taken as an attribute of the customer, and the relationship between customers and products is abstracted into the network topology. During the random walk among nodes in the network, product recommendations for customers are completed. Taking a real estate group in Malaysia as an example, the experimental results verify that customer loyalty can indeed improve the accuracy of the recommender system. We can also conclude that companies are more effective at recommending customers with moderate loyalty levels.
1. Introduction
Advances in Internet technology have increased the way companies communicate with customers. The marketing strategy of modern enterprises has gradually changed from traditional profit-oriented to customer-oriented. Customer loyalty means that customers are willing to purchase products or services of the same brand continuously in the future, according to [1], customers’ preferences will persist due to changes in the market or advertising of other products. If familiar with the distribution of customer loyalty, companies will improve the quality of customer service, meet the personalized needs of high-loyal customers, and increase customers’ satisfaction.
The huge amount of shopping information in various e-commerce platforms expands the customer’s choice greatly, but it also brings the “information overload” problem [2]. Customers spend too much time reading and retrieving information, and cannot find the products they want quickly and accurately. The recommender systems solve this problem. It analyzes the past purchase records of customers and predicts customers’ preferable products. By presenting these predictions to customers, the e-commerce platform has implemented the product recommendation function.
The model and theory of complex networks appeared at the end of the 20th century. Its basic idea is to abstract entities of a complex system into nodes and relationships between entities into edges. It can represent complex systems in real life as mathematical models through network structures. In recent years, many scholars have studied recommender systems based on complex networks and achieved good results [3,4,5,6]. A product recommendation model based on a complex network establishes a network structure to describe the relationship between customers and products and calculates the similarity between products to recommend suitable ones to target customers based on their historical purchase records. Currently, few studies have combined customer loyalty with complex network recommendations. Customer loyalty is an important indicator of the relationship between customers and products. Therefore, it is a meaningful study to consider the impact of customer loyalty when building a recommender system based on a complex networks. In this study, the exogenous variable of customer loyalty is added into the recommender system based on complex network, and the recommendation effect is improved. Specifically, the main contents of this study are as follows:
- The recency–frequency–monetary lifetime (RFML) model is used for feature extraction of customer loyalty, and the k-means algorithm is used to cluster the features of customer loyalty, thereby distinguishing customers with different loyalty levels.
- A recommender system based on the bipartite graph is constructed, and the PageRank method is used for random walks (BGPR). After adding the exogenous variable of customer loyalty, the system compares the recommendation accuracy rate of customers with different loyalty levels and of the overall customers.
- A recommender system based on a single vertex set network and DeepWalk (SVDW) is constructed and the accuracy of adding the exogenous variable of customer loyalty is analyzed.
The framework of this study is shown in Figure 1. First, the RFML model extracts four features related to loyalty from the customer dataset: recency, frequency, monetary, and lifetime. Customers are then regarded as points in the four-dimensional space and clustered into several categories of different loyalty levels via the k-means algorithm. Finally, BGPR and SVDW, two complex network-based recommendation algorithms, make recommendations for customers of each level, and the recommendation effects are compared to draw relevant conclusions.
Figure 1.
Overall framework of this study.
2. Related Works
2.1. Customer Loyalty
Customer loyalty is a key factor for companies to enhance their competitive strength. Reference [7] proposed that loyal customers would have a greater willingness to purchase a larger number of products, pay less attention to the price of products, and recommend the brand to his family and friends. An important issue for customer loyalty is how to quantify and calculate it. There are three methods used commonly: expert experience scoring, long-term forecasting, and short-term forecasting.
2.1.1. Expert Experience Scoring
Each expert scores the loyalty degree of customers based on their purchase records. The advantage of this method is that it is comprehensive and the results have application significance. However, for different indicators, expert ratings may be subjective, and data processing methods are cumbersome. In [8], a customer segmentation method based on the customer life cycle is proposed. The characteristics of data and the experience of business experts were taken into account when constructing the judgment matrix. When designing the brand relationship questionnaire, 13 experts (all with a Ph.D. in marketing) were invited to evaluate the items of the dimension “love and passion” in [9].
2.1.2. Long-Term Forecasting
A common long-term forecasting method used to calculate customer loyalty is customer lifetime value (CLV). It has been described in [10] that lifetime value is the total revenue from customers minus the cost of attracting, selling, and servicing them, considering time. In [11], customer loyalty depends on the ability of customers to increase enterprises’ income and reduce enterprises’ costs at different stages in their lifetime. Experimental results based on different data sets in the literature [12,13,14] suggest that customer loyalty is a driver of CLV and a predictor of long-term profitability to a firm.
The concept of net present value in financial management is introduced into the calculation of CLV [15], which causes difficulties in estimating the parameters of the model [16]. CLV also ignores some non-money costs in the company and does not consider the randomness of the amount the customers spend, which makes CLV less accurate when simulating the real world. According to [17], many companies sell products to customers through retailers, lacking a process of direct communication with customers; due to customers’ privacy, insufficient data processing capabilities, and the high cost of collecting and analyzing data, CLV analysis is difficult to implement.
2.1.3. Short-Term Forecasting
The RFM model is often used to analyze customer loyalty. It utilizes the customers’ historical purchasing records to predict their likely consumption behavior for a short period in the future. The RFM model has three key indicators. R represents the time of last consumption, F is the frequency of consumption, and M is the total consumption. Because the three indicators of the RFM model are easy to obtain from customers’ consumption records, they are widely used in marketing [18,19,20,21]. The RFM model can categorize customers while analyzing customer loyalty. Its main idea is to classify customers by calculating the RFM value of the customers and comparing it with a threshold standard. Reference [22] calculates RFM values of customers in duty-free stores, and then subdivide customers into different groups through the Self-Organizing Map (SOM) method. The customer quintiles method was introduced in [19], which assigns a score of 1 to 5 to each indicator. The higher the score of an indicator, the better the customer’s performance on this indicator, so this method divides customers into 125 categories (5 × 5 × 5). Reference [23] proposed the RFML model based on RFM. A new indicator, the total length of time from the customer’s initial purchase to the customer’s final purchase, was introduced to the RMFL model. Reference [23] also used the k-means algorithm to cluster customers and computed the distance from the cluster’s center (R, F, M, L) to the coordinate origin (0, 0, 0, 0) to represent the loyalty of each type of customer. Experimental results show that the model has a strong ability to evaluate customer loyalty.
2.2. Recommender System
In the field of e-commerce, recommender systems are defined as implementing traditional marketing strategies via the Internet [24]. As a very important part of the e-commerce website, the recommender system can predict the potential consumption behavior of customers by learning and analyzing their previous behavior. Since the development of the recommender system in the 1990s, many different methods have been proposed, which can be roughly classified into content-based filtering, collaborative filtering, and hybrid filtering [25].
2.2.1. Content-Based Filtering Recommender Systems
According to the items the customer has selected in the past, the content-based filtering recommender systems show customers products that they may be interested in. It does not require the user ratings or opinions on items but just calculates the similarity between the products to be recommended and the user has purchased. The content-based filtering recommender systems have long been used in recommendations in media areas such as news, websites, and television [26,27,28,29].
2.2.2. Collaborative Filtering Recommender Systems
In the field of recommender systems, collaborative filtering is a mature algorithm, first proposed by [30]. There are two main types of collaborative filtering: one is based on customers and another is based on products. The basic idea of the one based on customers is that customers who have approximate scores may have similar interests, so they are likely to choose identical products. The collaborative filtering based on products is similar in principle. After calculating the similarity of various products, the system can recommend similar products to those who have purchased a certain product. The collaborative filtering recommender systems do not rely heavily on customers’ purchase records. As long as the customer has purchased the product, or commented the point he is interested in, the system can recommend related products and content to him [31,32,33,34].
Since the use of collaborative filtering algorithms, some shortcomings have been exposed, such as cold start and lack of scoring data. Reference [35] proposed a method based on clustering, which can solve the problem of recommending products for minority users in the absence of scoring data. A decision tree method was proposed in [36], which can deal with the problem of missing data in cold start, to implement the function of recommending products to new customers.
2.2.3. Hybrid Recommender Systems
A hybrid recommender system is a way to combine different technologies for the recommendation. In practical applications, considering the data sources and characteristics, hybrid recommender systems that meet specific needs will be constructed. WebBot, a hybrid recommender system containing content filtering and collaborative filtering, was proposed in [37]. Content-based filtering is used to record the relationship between the web page content and users’ preferences, and collaborative filtering is used to compare browsing records among different users. WebBot’s list will change as the page that the user is currently viewing, so its recommendations are flexible. In [38], a hybrid recommender system based on enhanced fuzzy multi-criteria collaborative filtering is applied to movie recommendation. The method considers demographic information and item-based ontology semantic filtering methods to improve the accuracy of recommendation. Reference [39] uses sequential pattern analysis to mine the customers’ purchase rules over time, and apply these rules to the recommender system. Therefore, the collaborative can still make recommendations without the customers’ explicit evaluation information and the quality of recommendations is improved concurrently.
2.2.4. Complex Network Recommender Systems
In recent years, complex networks have attracted interest from researchers in computer science, physics, mathematics, and management science. As a modeling method, a complex network can abstract the multiple entities and relationships into a network structure and describe them by nodes and edges of the network. Since the data sets in the field of recommender systems usually present a “customer-products” structure, the recommendation technology and complex networks have something in common. In [40], the bipartite graph model is used to describe the relationship between customers and products, which improves the recommendation quality of the spreading activation algorithm to a certain extent. A complex network is used to implement digital tourism assistance, which can recommend optimal routes and provide mobile guidance to the users in [41]. Reference [42] uses the standard complex network technology in the sample of social musician network and developed a derived complex network by confirming attribute similarity. The content-based recommendation algorithm is then used to calculate the similarity between two related music network databases to complete the recommendation.
3. Proposed Method
In this section, a method for calculating customer loyalty and two recommending algorithms based on complex network are introduced.
3.1. K-Means Clustering Method Based on the RFML Model: Designed for Customer Loyalty
3.1.1. The RFML Model
The RFML model measures customer loyalty through indicators, namely R: recent purchase, F: purchase frequency, M: total purchase amount, and L: lifetime. The specific calculation methods of the four indicators are as follows: R is calculated by counting the number of days between the time when the customer’s last purchase occurred and a specific date (used to separate the training set and the test set); F is obtained by counting the number of customer purchase records; M can be obtained by accumulating the customer’s consumption amount; L is obtained by calculating the number of days between the customer’s earliest purchase and the last purchase. When R is smaller, F is larger, M is larger, L is larger, and the customer is more loyal.
The four indicators have the same effect on customer loyalty, according to [43]. Using the same weighting method in this study, the RFML model is constructed as
3.1.2. K-Means Clustering
Clustering is the process of dividing similar data into clusters. A cluster is a collection of data that is similar to each other within the cluster and different from those in other clusters [44]. K-means is a classical method to solve the clustering problem. The basic idea of this method is: first, data from the set containing data are selected randomly as the initial cluster center. Then the distance from the remaining data to the previously centers (usually Euclidean distance) is calculated. Each remaining data will be assigned to the cluster to which the nearest cluster center belongs, according to the nearest neighbor principle. The mean of all data in each cluster is calculated as the new cluster center generated. If the difference between the new cluster center and that obtained in the previous iteration is less than the threshold, the algorithm converges and the iteration stops. Otherwise, the iterative process continues.
The k-means method has the advantages of fastness and high scalability, but its clustering result is greatly affected by the number of initial class centers . Given this problem, this study uses the Davies–Bouldin index (DB index) [45] to measure the clustering effect under different , and selects a better clustering result. DB Index is an internal scheme that evaluates the effect of clustering based on the scale and characteristics of the data set. The basic idea is to measure the effect of clustering by calculating the ratio of within-cluster similarity and among-cluster similarity. Because the idea of the clustering method is to make the within-cluster similarity as large as possible and otherwise the among-cluster similarity, it is obvious that the smaller the DB index, the better the clustering result.
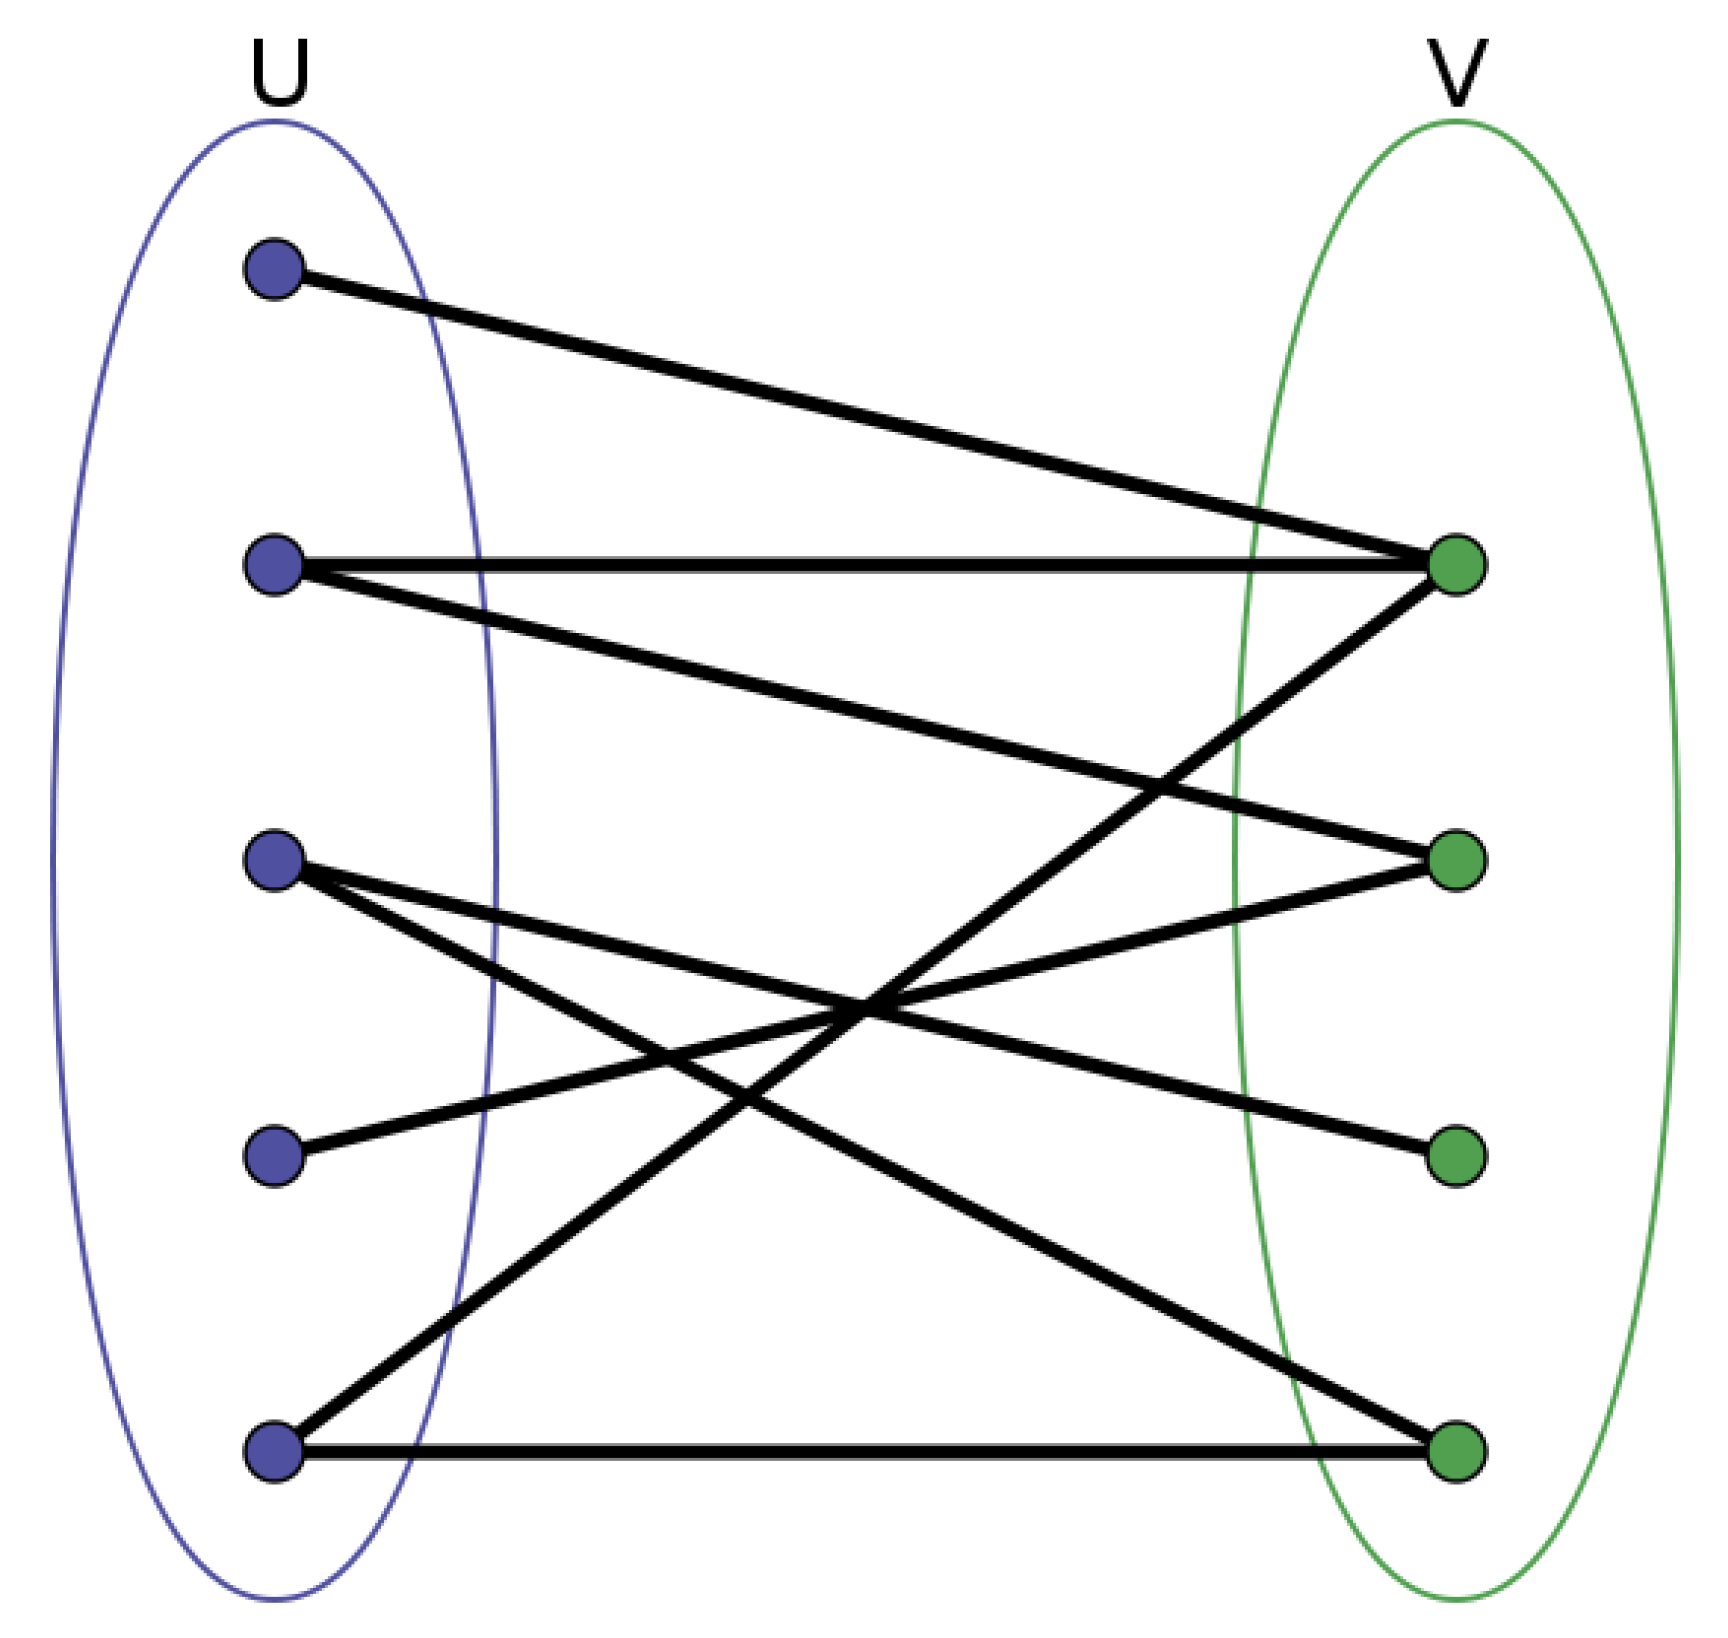
3.2. Recommender System Based on Bipartite Graph and Personal Rank (BGPR)
A recommender system based on a complex network utilizes nodes to describe customers and products and edges to describe purchase relationships of customers and products. There are two main network structures to describe a recommender system: the ‘customer–product’ bipartite graph and the ‘product–product’ single vertex set. Since the purpose of this study is to recommend shops to customers, in this section, a ‘customer–shop’ bipartite graph is constructed, and the PersonalRank algorithm is then used to recommend shops.
3.2.1. ‘Customer–Shop’ Bipartite Graph Network
A bipartite graph is a special model in graph theory. Its nodes can be divided into two independent and disjoint sets and V so that the two nodes connected by each edge belong to these two independent sets. The bipartite graph G is usually expressed mathematically as , where U and V represent two independent sets of nodes, and E represents a set of edges [46]. A bipartite graph is shown as Figure 2.
Figure 2.
An example of bipartite graph.
It should be noted that the degree of any node in the bipartite graph is the number of all edges connected to the node, or the number of all neighbor nodes of .
In the data of this study, each purchase record of a customer can be represented by a number pair to indicate that user u has purchased at shop m. The data of this structure can be easily represented by a bipartite graph. Let denote a ‘customer–shop’ bipartite graph, where represents the set of nodes for customers, represents the set of nodes for shops, and is the set of edges connecting the customers and shops. Each number pair has an edge in the graph . , and . There are no edges between nodes in the same set, according to the nature of the bipartite graph. Figure 3 is an example of ‘customer–shop’ bipartite graph.
Figure 3.
This is an example of a ‘customer–shop’ bipartite graph. The green nodes represent customers, the blue ones are shops, and the edges between the two nodes are the purchasing relationship between customers and shops. For instance, is connected to , , and , which means that customer 1 has purchased products in shops 1, 2, and 4.
3.2.2. PersonalRank for Recommender System
When a bipartite graph structure is used for recommendation, the task of recommending a shop to customer can be transformed into search of a shop node that is most likely to be connected with customer node . One solution is to measure the correlation between customer and the shops that have no edges connection with , and generate a recommendation list for customer according to the level of correlation. The graph ranking algorithm can be used to calculate the node correlation problem. PageRank is a classic algorithm for solving graph ranking problems, and the PersonalRank algorithm is the application of the PageRank algorithm to bipartite graphs [47]. PageRank is an algorithm designed by [48] based on citation analysis to solve the problem of graph ranking and is later applied in the search engine, Google.
When recommending an online shop to customer , the PersonalRank is similar to PageRank. It is assumed that the customer starts to walk from node and continuously to other nodes through the edges. The customer will choose to continue to walk with probability in each node or return to the last node with probability . This is a random process. After multiple rounds of iterations, the probability of each node being accessed will tend to converge. A node with a higher probability means that the customer is more likely to purchase in this shop. The formula of PersonalRank is
is the probability that node is visited. is the probability that customer keep walking. is the nodes set connected with node . is the nodes set connected with node . is the original node.
The pseudo code of BGPR is as follows (Algorithm 1):
| Algorithm 1 BGPR |
|
3.3. Recommender System Based on Single Vertex Set and DeepWalk (SVDW)
3.3.1. ‘Shop–Shop’ Single Vertex Set Network
The recommender systems based on the bipartite graph study the relationship between two node sets. Another approach is to study the relationships within the single vertex set. According to the requirements of the recommender system, the bipartite graph model needs to be mapped into a single vertex set network. One mapping method is: if two nodes in the same set are connected to at least one node in another set by an edge, then there is an edge in the single vertex set connecting the two nodes [49]. In the ‘customer–shop’ bipartite graph , there is an edge connection between two shop nodes if they have common neighbor nodes in the set of customers. The weight of the edge is the number of common neighbor nodes. After the above steps, the ‘customer–shop’ bipartite graph can be mapped to a directionless weighted network of shops, where is the shop node set and is the edge set. Figure 4 is an example of ‘shop-shop’ single vertex set network.
Figure 4.
An example of ‘shop–shop’ single vertex set network.
3.3.2. DeepWalk for Recommender System
DeepWalk is a method to learn the implicit representation of nodes in a complex network. Implicit representation refers to projecting the relationships between nodes in a continuous vector space to analyze the network. Deepwalk is a combination of RandomWalk and Word2Vec. RandomWalk has been used for similarity measurement in many machine learning problems such as content recommendation [50] and community discovery [51]. Word2vec can map words to a unified coordinate system based on text content to get a vector representation of each word. DeepWalk first utilizes weighted RandomWalk to randomly walk through the graph to collect node access sequences, then treats the node access sequences as a sentence and inputs them into the Word2Vec model, and vector representations of each node are obtained. Finally, the similarity between the nodes can be measured by calculating the distance between the corresponding vectors of the nodes to recommend shops for customers.
● RandomWalk
For node , is defined as a sequence that starts with . is a random process composed of variables . is equal to with probability . A node is selected from the neighbor nodes of , and the probability that is equal to this node is . The probability of selecting nodes from the neighbor nodes of is
where is one of the neighbor nodes of . is the weight of the edge connecting and . is the number of neighbor nodes of . is the length of each node sequence.
● Word2Vec
Word2Vec is a widely used word embedding model with the advantage of fast training speed. Word2Vec uses cross-entropy as a training target to replace the traditional maximum likelihood function, and at the same time introduces negative sampling and hierarchical softmax normalization function creatively, so that the model can be trained in a few hours. The Word2Vec model has two training methods, continuous bag-of-word (CBOW) and skip-gram. The difference is that the CBOW method uses context words to predict the central word, while skip-gram does the opposite. It uses the central word to predict the context words [52]. The purpose of this study is to recommend similar shops to customers based on their historical purchase records, which is more in line with skip-gram’s training hypothesis.
The pseudocode of the experimental process is as follows (Algorithm 2):
| Algorithm 2 SVDW |
|
3.4. Evaluation Index
Considering the balance between the accuracy and scale of recommendation, F1-Score is used in this study to evaluate the recommendation results.
● Accuracy
The percentage of shops that customer actually purchased to all the shops recommended by the system to the customer in the test set.
where is the set of shops recommended to the target customer set. is the set of new shops that the target customer set visit in the test data.
● Recall
The proportion of system-recommended shops in new shops visited by customers.
● F1-Score
F1-Score is the harmonized average of accuracy and recall.
4. Experiment and Analysis
4.1. Data Set Description
Group B is the largest real estate group in Malaysia. It operates more than 150 subsidiaries including tourism, resorts, hotels, shopping malls, and so on. Group B launched its customer loyalty program in 2010, aiming to create a platform using general points as a medium, bringing together shops in different fields to provide customers with rich points redemption options, thereby enhancing customer loyalty. Table 1 shows some basic information of the data set.
Table 1.
Distribution of data and the division of training and test sets.
4.2. K-Means Clustering Based on the RFML Model
The RFML loyalty score of each customer is first calculated, and each customer is regarded as a point in a four-dimensional space. The four dimensions are the four indicators of the RFML. K-means method is used to cluster the customer set. The initial k value range is 5–50, multiple clustering is performed, and the DB index is recorded during each clustering process. The k value corresponding to the minimum DB index is used as the optimal clustering result. The result is shown in Figure 5.
Figure 5.
DB index at different k values. The horizontal axis represents the k value, and the vertical axis represents the DB index. When k = 7, the DB Index value is minimum.
The RFML value of each cluster center and the value of each indicator are calculated separately. The results are as follows:
According to Section 3.1.1, a higher RFML value means higher customer loyalty. Furthermore, the data points are shown in the R–L and F–M cross coordinate systems, respectively, as shown in Figure 6.
Figure 6.
Visualization of clustering results.
According to Table 2 and Figure 6, the two types of customers with loyalty levels 6 and 7 are much less than the other types of data, showing the characteristics of outliers in the clustered image. Therefore, we classified these two types of customers into the cluster with a loyalty level of 5.
Table 2.
Results of clustering.
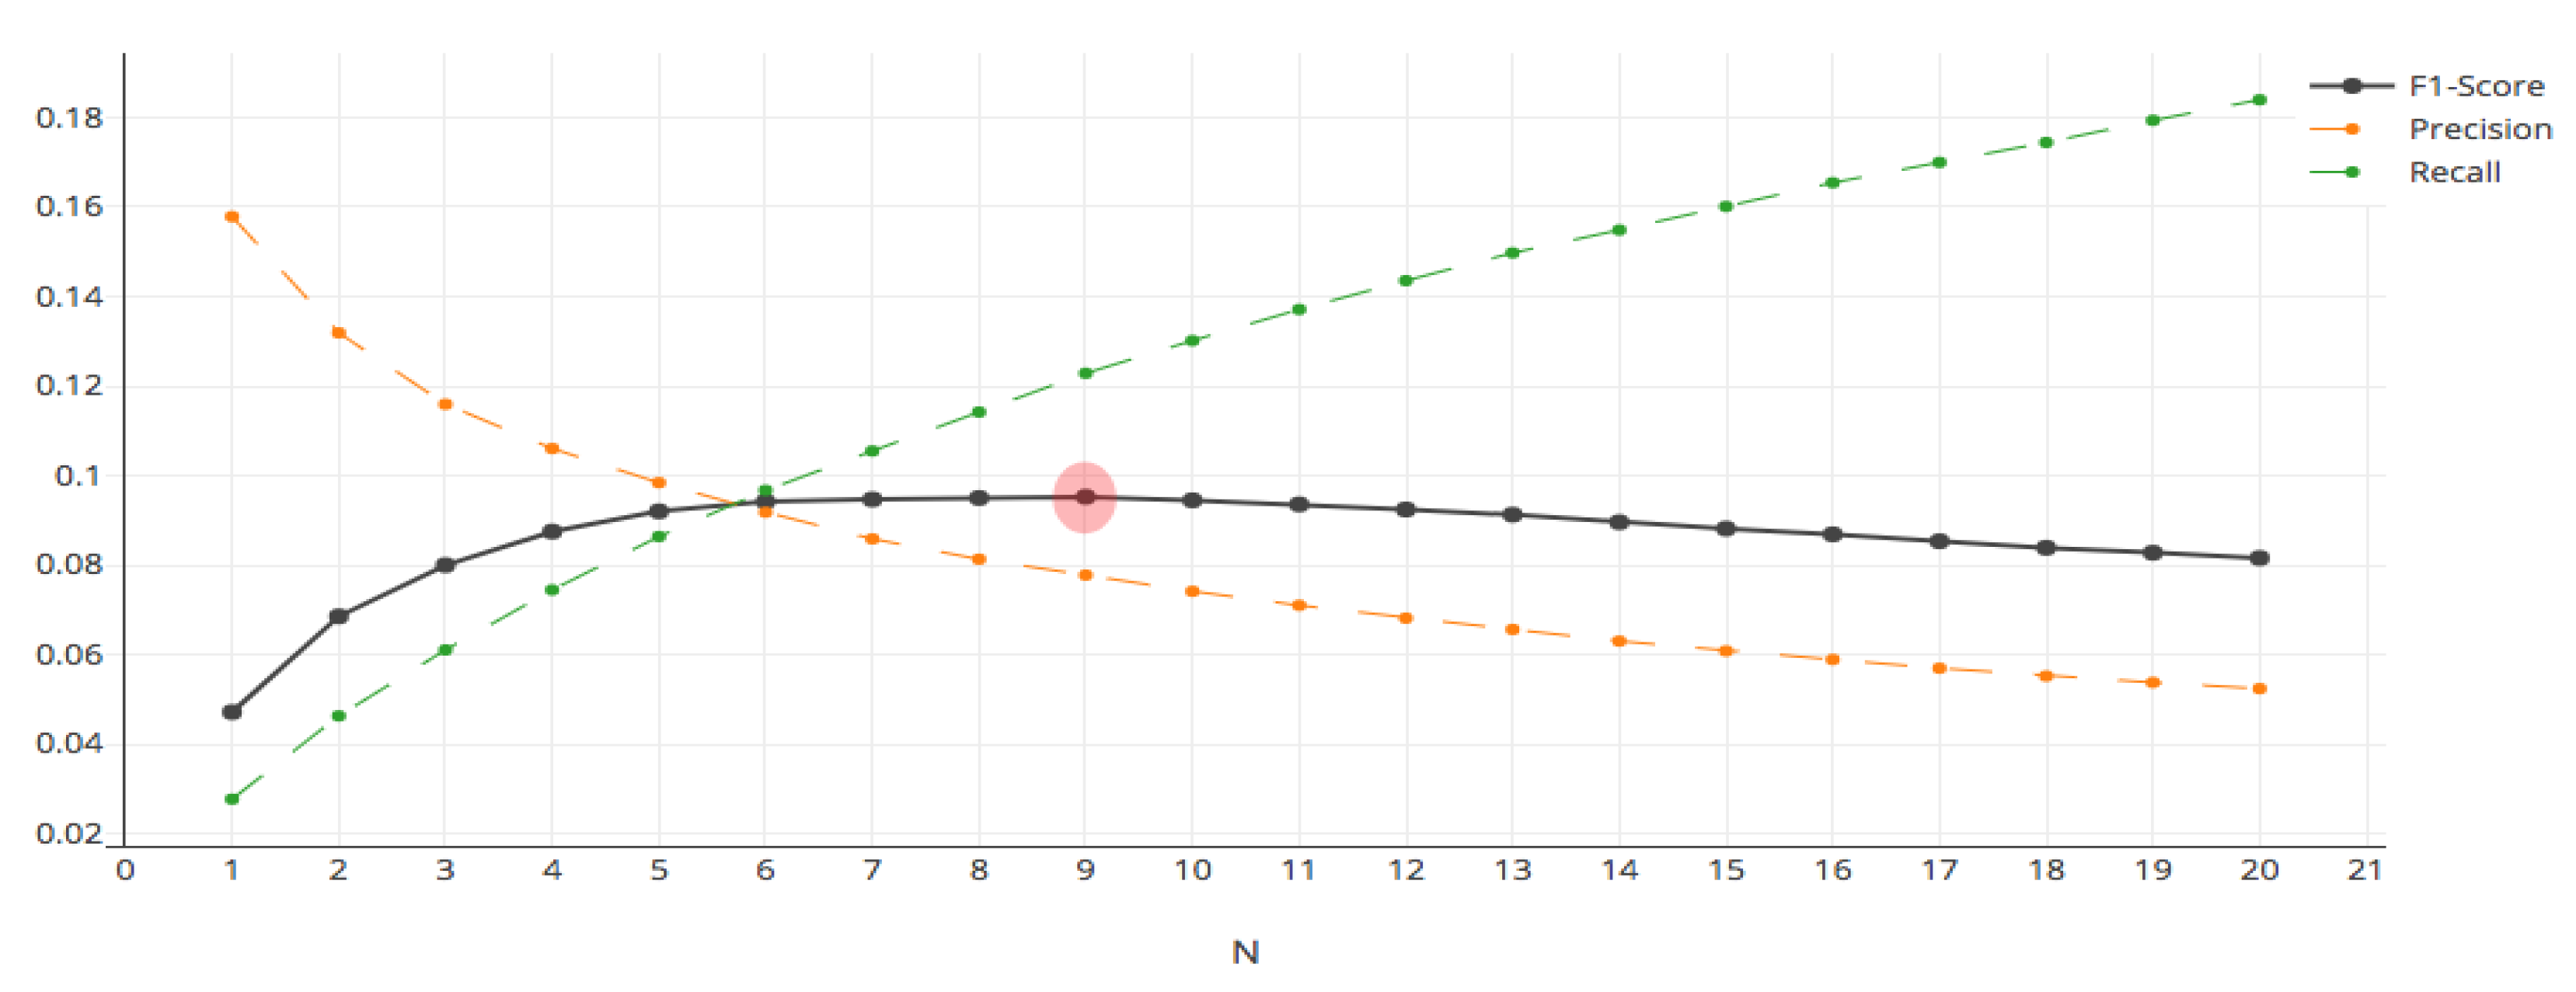
4.3. Impact of Customer Loyalty on BGPR
The purpose of this section is to explore whether customer loyalty affects the accuracy of a bipartite graph-based recommender system. We select customers that are included in both the training and test sets as target customers. The ‘customer–shop’ bipartite graph of the target customers is constructed from the training set data. Then BGPR is used to make recommendations for target customers.
The iterative approach is used to estimate (the number of shops recommended to each customer) in the experiment. The results of the iteration are shown in Figure 7.
Figure 7.
Iteration results of BGPR algorithm.
As increases, precision (accuracy) gradually decreases, recall gradually increases, and F1-Score increases first and then decreases. When is 9, F1-Score is 0.095, reaching the peak.
Considering customer loyalty, target customers are grouped according to different customer loyalty levels, and each group of customers is recommended. According to the above experimental results, let equal 9. The performance of the BGPR in different customer groups is shown in Table 3.
Table 3.
Recommendation effect of BGPR under different customer loyalty levels.
From Table 3, BGPR performs differently on customer groups with different loyalty levels. The recommendation effect is best when the loyalty level is 4. Compared with the experimental results without customer loyalty (see Table 4), the three evaluation indexes have improved, and the F1-Score improvement rate is 14.74%. Therefore, rationally adding the customer loyalty factor can improve the accuracy of the recommender system based on the bipartite graph.
Table 4.
Recommendation effect of PersonalRank with and without customer loyalty.
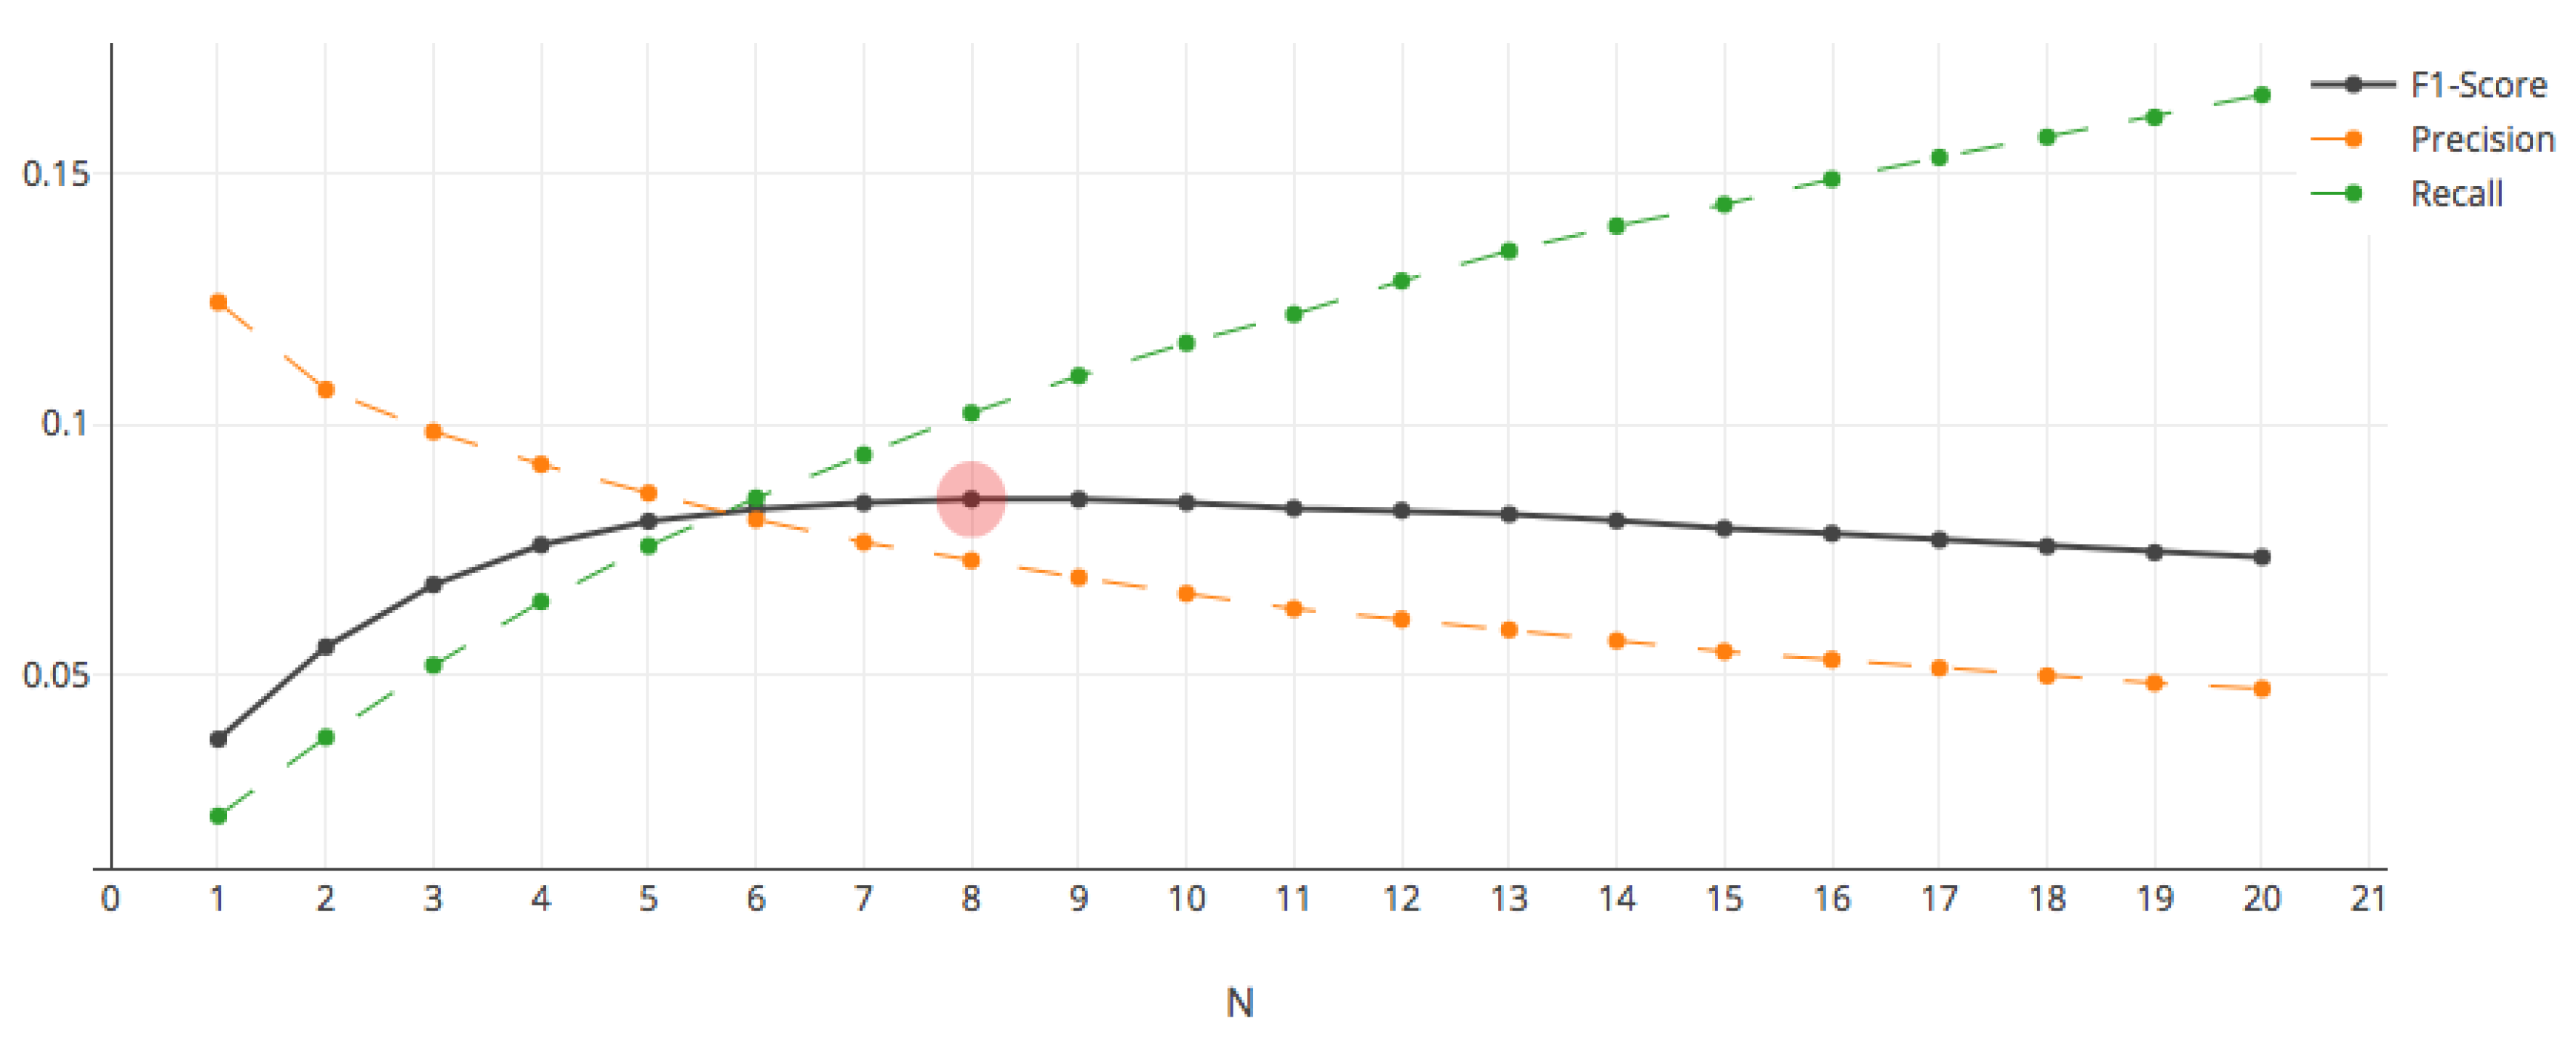
4.4. Impact of Customer Loyalty on SVDW
According to the bipartite graph in Section 4.3, a single vertex set network of shops is constructed. Based on the single vertex set network of shops, SVDW is used to calculate the similarity between the shops that the target customer has purchased and not. Shops where the target customer has purchased in the training data set are excluded. The remaining shops are sorted in the order of decreasing similarity, and the first N shops are selected to recommend to the target customers.
The experiment utilizes an iterative approach to estimate (the number of shops recommended to each customer), and the results of the iteration are shown in Figure 8.
Figure 8.
Iteration results of DeepWalk algorithm.
As increases, precision (accuracy) gradually decreases, recall gradually increases, and F1-Score increases first and then decreases. When is 8, F1-Score is 0.085, reaching the peak.
Considering customer loyalty, a method similar to Section 4.3 was adopted. The results of SVDW on different customer loyalty groups are shown in the Table 5.
Table 5.
Recommendation effect of SVDW under different customer loyalty levels.
From Table 5, SVDW performs differently on customer groups with different loyalty levels. The recommendation effect is best when the loyalty level is 4. Compared with the experimental results without customer loyalty (see Table 6), the three evaluation indexes have improved, and the F1-Score improvement rate is 16.47%. Therefore, rationally adding customer loyalty factors can improve the accuracy of the recommender system based on the single vertex set network.
Table 6.
Recommendation effect of DeepWalk with and without customer loyalty.
5. Conclusions
With the development of complex networks and recommender systems, the recommender system based on a complex network has gradually become a popular research direction. The main idea is to establish a network to describe the relationship between customers and products (or online shops). The mutual recommendation ability based on similarity is calculated, and related products (or online shops) are recommended to target customers.
In the field of marketing, customer loyalty is an important indicator to measure the preference relationship between customers and products. Therefore, introducing customer loyalty into a recommender system is a meaningful research direction. In this study, we consider the impact of customer loyalty on the accuracy of recommendation algorithms based on complex networks.
In this paper, the RFML model is used to extract four features related to customer loyalty: recency, frequency, monetary, and lifetime. Customers are clustered into groups of different loyalty levels via the k-means method. Drawing on previous work, we propose two complex network-based recommendation algorithms: BGPR and SVDW. The two algorithms abstract customers and products (shops) into a bipartite graph and a single vertex set network, respectively. The random walk method is used to implement the recommendation function. We apply both algorithms on customer groups with different loyalty levels, so as to grasp which types of customers have better recommendation results. We use the data set of Malaysia B Group as an example. The experimental results show: (1) the group recommendation is better than the overall recommendation; (2) the recommendation effect is best on the customer group with medium loyalty, which may be different from our common sense.
Author Contributions
Conceptualization, Formal analysis, Writing—original draft, Y.B.; Project administration, Writing—review and editing, S.J.; Data curation, S.W. and B.T.; Software, S.W.; Visualization, B.T. All authors have read and agreed to the published version of the manuscript.
Funding
This research received no external funding.
Conflicts of Interest
The authors declare no conflict of interest.
References
- Oliver, R.L. Whence consumer loyalty? J. Mark. 1999, 63 (Suppl. S1), 33–44. [Google Scholar] [CrossRef]
- Butcher, H. Information overload in management and business. In Proceedings of the IEE Colloquium on Information Overload, London, UK, 20 November 1995. [Google Scholar]
- Cano, P.; Celma, O.; Koppenberger, M. Topology of music recommendation networks. Chaos Interdiscip. J. Nonlinear Sci. 2006, 16, 013107. [Google Scholar] [CrossRef] [PubMed]
- Naruchitparames, J.; Güneş, M.H.; Louis, S.J. Friend recommendations in social networks using genetic algorithms and network topology. In Proceedings of the 2011 IEEE Congress of Evolutionary Computation (CEC), New Orleans, LA, USA, 5–8 June 2011. [Google Scholar]
- Li, J.; Ma, S.; Hong, S. Recommendation on social network based on graph model. In Proceedings of the 31st Chinese Control Conference, Hefei, China, 25–27 July 2012. [Google Scholar]
- Wang, Q.; Li, W.; Zhang, X.; Lu, S. Academic paper recommendation based on community detection in citation-collaboration networks. In Lecture Notes in Computer Science, Proceedings of the Asia-Pacific Web Conference, Suzhou, China, 23–25 September 2016; Springer: Cham, Switzerland, 2016. [Google Scholar]
- Reichheld, F.F.; Markey, R.; Hopton, C. The loyalty effect. Eur. Bus. J. 2000, 12, 134–139. [Google Scholar]
- Han, S.H.; Lu, S.X.; Leung, S.C. Segmentation of telecom customers based on customer value by decision tree model. Expert Syst. Appl. 2012, 39, 3964–3973. [Google Scholar] [CrossRef]
- Kressmann, F.; Sirgy, M.J.; Herrmann, A.; Huber, F.; Huber, S.; Lee, D.-J. Direct and indirect effects of self-image congruence on brand loyalty. J. Bus. Res. 2006, 59, 955–964. [Google Scholar] [CrossRef]
- Hwang, H.; Jung, T.; Suh, E. An LTV model and customer segmentation based on customer value: A case study on the wireless telecommunication industry. Expert Syst. Appl. 2004, 26, 181–188. [Google Scholar] [CrossRef]
- Jackson, B.B. Build Customer Relationships That Last; Harvard Business Review: Boston, MA, USA, 1985; Volume 11. [Google Scholar]
- Qi, J.-Y.; Zhou, Y.P.; Chen, W.J.; Qu, Q.X. Are customer satisfaction and customer loyalty drivers of customer lifetime value in mobile data services: A comparative cross-country study. Inf. Technol. Manag. 2012, 13, 281–296. [Google Scholar] [CrossRef]
- Zhang, J.Q.; Dixit, A.; Friedmann, R. Customer loyalty and lifetime value: An empirical investigation of consumer packaged goods. J. Mark. Theory Pract. 2010, 18, 127–140. [Google Scholar] [CrossRef]
- Safari, K.M.; Safari, K.Z. An empirical analysis to design enhanced customer lifetime value based on customer loyalty: Evidences from Iranian banking sector. Iranian J. Manag. Studies 2012, 5, 145–167. [Google Scholar]
- Andon, P.; Baxter, J.; Bradley, G. Calculating Customer Lifetime Value (CLV): Theory and Practice, in Kundenwert; Springer: New York, NY, USA, 2003; pp. 299–315. [Google Scholar]
- Fader, P.S.; Hardie, B.G.; Jerath, K. Estimating CLV using aggregated data: The Tuscan lifestyles case revisited. J. Interact. Mark. 2007, 21, 55–71. [Google Scholar] [CrossRef]
- Karvanen, J.; Rantanen, A.; Luoma, L. Survey data and Bayesian analysis: A cost-efficient way to estimate customer equity. Quant. Mark. Econ. 2014, 12, 305–329. [Google Scholar] [CrossRef]
- Yeh, I.-C.; Yang, K.-J.; Ting, T.-M. Knowledge discovery on RFM model using Bernoulli sequence. Expert Syst. Appl. 2009, 36, 5866–5871. [Google Scholar] [CrossRef]
- Miglautsch, J.R. Thoughts on RFM scoring. J. Database Mark. Cust. Strategy Manag. 2000, 8, 67–72. [Google Scholar] [CrossRef]
- Khajvand, M.; Zolfaghar, K.; Ashoori, S.; Alizadeh, S. Estimating customer lifetime value based on RFM analysis of customer purchase behavior: Case study. Procedia Comput. Sci. 2011, 3, 57–63. [Google Scholar] [CrossRef]
- Safari, F.; Safari, N.; Montazer, G.A. Customer lifetime value determination based on RFM model. Mark. Intell. Plan. 2016. [Google Scholar] [CrossRef]
- Ha, S.H.; Park, S.C. Application of data mining tools to hotel data mart on the Intranet for database marketing. Expert Syst. Appl. 1998, 15, 1–31. [Google Scholar] [CrossRef]
- Hosseini, S.M.S.; Maleki, A.; Gholamian, M.R. Cluster analysis using data mining approach to develop CRM methodology to assess the customer loyalty. Expert Syst. Appl. 2010, 37, 5259–5264. [Google Scholar] [CrossRef]
- Schafer, J.B.; Konstan, J.A.; Riedl, J. E-commerce recommendation applications. Data Min. Knowl. Discov. 2001, 5, 115–153. [Google Scholar] [CrossRef]
- Riyahi, M.; Sohrabi, M.K. Providing effective recommendations in discussion groups using a new hybrid recommender system based on implicit ratings and semantic similarity. Electron. Commer. Res. Appl. 2020, 40, 100938. [Google Scholar] [CrossRef]
- Yeung, K.F.; Yang, Y. A proactive personalized mobile news recommendation system. In Proceedings of the 2010 Developments in E-Systems Engineering, London, UK, 6–8 September 2010. [Google Scholar]
- Van Meteren, R.; Van Someren, M. Using content-based filtering for recommendation. In Proceedings of the Machine Learning in the New Information Age: MLnet/ECML2000 Workshop, Barcelona, Catalonia, Spain, 30 May 2000. [Google Scholar]
- Blanco-Fernandez, Y.; Pazos-arias, J.J.; Gil-Solla, A.; Ramos-Cabrer, M.; Lopez-Nores, M. Providing entertainment by content-based filtering and semantic reasoning in intelligent recommender systems. IEEE Trans. Consum. Electron. 2008, 54, 727–735. [Google Scholar] [CrossRef]
- Barragáns-Martínez, A.B.; Costa-Montenegro, E.; Burguillo, J.C.; Rey-López, M.; Mikic-Fonte, F.A.; Peleteiro, A. A hybrid content-based and item-based collaborative filtering approach to recommend TV programs enhanced with singular value decomposition. Inf. Sci. 2010, 180, 4290–4311. [Google Scholar] [CrossRef]
- Goldberg, D.; Nichols, D.; Oki, B.M.; Terry, D. Using collaborative filtering to weave an information tapestry. Commun. ACM 1992, 35, 61–70. [Google Scholar] [CrossRef]
- Linden, G.; Smith, B.; York, J. Amazon. com recommendations: Item-to-item collaborative filtering. IEEE Internet Comput. 2003, 7, 76–80. [Google Scholar] [CrossRef]
- Das, A.S.; Datar, M.; Garg, A.; Rajaram, S. Google news personalization: Scalable online collaborative filtering. In Proceedings of the 16th International Conference on World Wide Web, Banff, AB, Canada, 8–12 May 2007. [Google Scholar]
- Chen, J.; Zhang, H.; He, X.; Nie, L.; Liu, W. Attentive collaborative filtering: Multimedia recommendation with item-and component-level attention. In Proceedings of the 40th International ACM SIGIR Conference on Research and Development in Information Retrieval, Tokyo, Japan, 7–11 August 2017. [Google Scholar]
- Subramaniyaswamy, V.; Logesh, R.; Chandrashekhar, M.; Challa, A.; Vijayakumar, V. A personalised movie recommendation system based on collaborative filtering. Int. J. High Perform. Comput. Netw. 2017, 10, 54–63. [Google Scholar] [CrossRef]
- Ghazanfar, M.A.; Prügel-Bennett, A. Leveraging clustering approaches to solve the gray-sheep users problem in recommender systems. Expert Syst. Appl. 2014, 41, 3261–3275. [Google Scholar] [CrossRef]
- Golbandi, N.; Koren, Y.; Lempel, R. Adaptive bootstrapping of recommender systems using decision trees. In Proceedings of the Fourth ACM International Conference on Web Search and Data Mining, Hong Kong, China, 9–12 February 2011. [Google Scholar]
- Burke, R. Hybrid recommender systems: Survey and experiments. User Model. User Adapt. Interact. 2002, 12, 331–370. [Google Scholar] [CrossRef]
- Kermany, N.R.; Alizadeh, S.H. A hybrid multi-criteria recommender system using ontology and neuro-fuzzy techniques. Electron. Commer. Res. Appl. 2017, 21, 50–64. [Google Scholar] [CrossRef]
- Choi, K.; Yoo, D.; Kim, G.; Suh, Y. A hybrid online-product recommendation system: Combining implicit rating-based collaborative filtering and sequential pattern analysis. Electron. Commer. Res. Appl. 2012, 11, 309–317. [Google Scholar] [CrossRef]
- Huang, Z.; Chen, H.; Zeng, D. Applying associative retrieval techniques to alleviate the sparsity problem in collaborative filtering. ACM Trans. Inf. Syst. (TOIS) 2004, 22, 116–142. [Google Scholar] [CrossRef]
- Schering, A.-C.; Dueffer, M.; Finger, A.; Bruder, I. A mobile tourist assistance and recommendation system based on complex networks. In Proceedings of the 1st ACM International Workshop on Complex Networks Meet Information & Knowledge Management, Hong Kong, China, 6 November 2009. [Google Scholar]
- Fields, B.; Jacobson, K.; Rhodes, C.; d’Inverno, M.; Sandler, M.; Casey, M. Analysis and exploitation of musician social networks for recommendation and discovery. IEEE Trans. Multimed. 2011, 13, 674–686. [Google Scholar] [CrossRef]
- Hughes, A.M. Strategic Database Marketing: The Masterplan for Starting and Managing a Profitable, Customer-Based Marketing Program; McGraw-Hill: New York, NY, USA, 2000; Volume 12. [Google Scholar]
- Han, J.; Pei, J.; Kamber, M. Data Mining: Concepts and Techniques; Elsevier: Amsterdam, The Netherlands, 2011. [Google Scholar]
- Davies, D.L.; Bouldin, D.W. A cluster separation measure. IEEE Trans. Pattern Anal. Mach. Intell. 1979, 224–227. [Google Scholar] [CrossRef]
- Chartrand, G.; Zhang, P. Chromatic Graph Theory; Chapman and Hall/CRC: London, UK, 2008. [Google Scholar]
- Haveliwala, T.H. Topic-sensitive pagerank: A context-sensitive ranking algorithm for web search. IEEE Trans. Knowl. Data Eng. 2003, 15, 784–796. [Google Scholar] [CrossRef]
- Page, L.; Brin, S.; Motwani, R.; Winograd, T. The Pagerank Citation Ranking: Bringing Order to the Web; Stanford InfoLab: Stanford, CA, USA, 1999. [Google Scholar]
- Guillaume, J.-L.; Latapy, M. Bipartite graphs as models of complex networks. Phys. A Stat. Mech. Appl. 2006, 371, 795–813. [Google Scholar] [CrossRef]
- Fouss, F.; Pirotte, A.; Renders, J.-M.; Saerens, M. Random-walk computation of similarities between nodes of a graph with application to collaborative recommendation. IEEE Trans. Knowl. Data Eng. 2007, 19, 355–369. [Google Scholar] [CrossRef]
- Andersen, R.; Chung, F.; Lang, K. Local graph partitioning using pagerank vectors. In Proceedings of the 2006 47th Annual IEEE Symposium on Foundations of Computer Science (FOCS’06), Berkeley, CA, USA, 21–24 October 2006. [Google Scholar]
- Mikolov, T.; Sutskever, I.; Chen, K.; Corrado, G.S.; Dean, J. Distributed representations of words and phrases and their compositionality. In Proceedings of the Advances in Neural Information Processing Systems, Lake Tahoe, NV, USA, 5–10 December 2013. [Google Scholar]
© 2020 by the authors. Licensee MDPI, Basel, Switzerland. This article is an open access article distributed under the terms and conditions of the Creative Commons Attribution (CC BY) license (http://creativecommons.org/licenses/by/4.0/).