T-Coin: Dynamic Traffic Congestion Pricing System for the Internet of Vehicles in Smart Cities

Abstract

1. Introduction
- We propose a traffic control system that is based on road reservations, and therefore the proposed system ensures that the congestion never takes place;
- T-Coin is based on reward and punishment to encourage the drivers to take alternative paths that could alleviate traffic congestion;
- The path reservation can be traded among vehicles through a tender process, which prioritizes urgent path requests;
- A dynamic pricing model based on road length, road importance, and current traffic congestion is proposed.
2. Related Works
3. System Policies
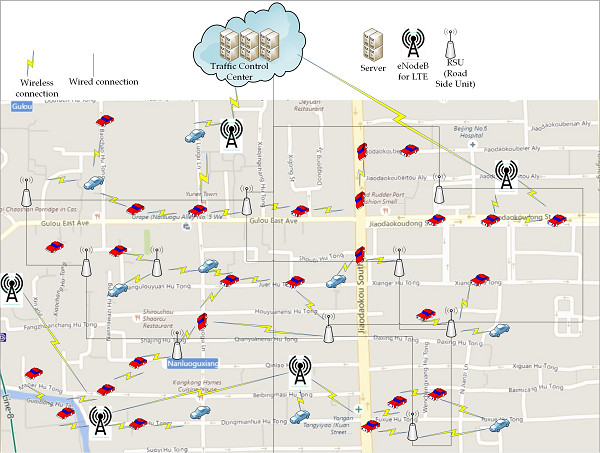
3.1. Vehicular Navigation Architecture
- Traffic Control Center (TCC) TCC is a server that manages the path reservation process. It maintains the road reservation matrix (RRM) that contains the information about the number of reserved, as well as free, positions in each road segment during different time slots. The TCC updates traffic statistics such as average speed per road segment and vehicle arrival rate and is also responsible for computing road pricing and managing T-Coin transactions between vehicles in the case of the tender process. For a large-scale road network, a single TCC is not able to maintain the traffic updates for such a huge number of vehicles. To solve this scalability problem, the road network could be segmented into multiple regions, where each region is managed by its own TCC, and the TCCs communicate with each other to resolve cross regional paths. The design of the TCC server is left as future work.
- Roadside Unit (RSU) An RSU is a wireless gateway that connects the vehicles to the wired network (i.e., the Internet). The RSU and the vehicles communicate through dedicated short-range communication (DSRC). Generally, RSUs are deployed near the intersection and they are connected to each other using a wired network. RSUs are considered to be the backbone of the communication network that connects the wirelessly connected vehicles to the TCC.
- eNodeB In the case of RSU failure or disconnectivity between the RSU and the vehicle due to the DSRC range limit, the vehicles could also connect to the TCC through eNodeB which is a base station that connects the vehicle to the 4 G-LTE cellular network. It enables the vehicles to access the TCC in a ubiquitous way.
- Vehicles To communicate with RSUs and eNodeBs, all the vehicles are equipped with a DSRC communication device embedded in their on-board unit (OBU). They are also equipped with a GPS-based navigation system that has a digital roadmap. The Vehicles report the updates about their travel experience in road segments and at intersections along their travel path to the traffic control center. Since the travel paths are very sensitive information, all the communications between vehicles and the server are encrypted.
3.2. T-Coin Balance
3.3. Road Reservation Policy
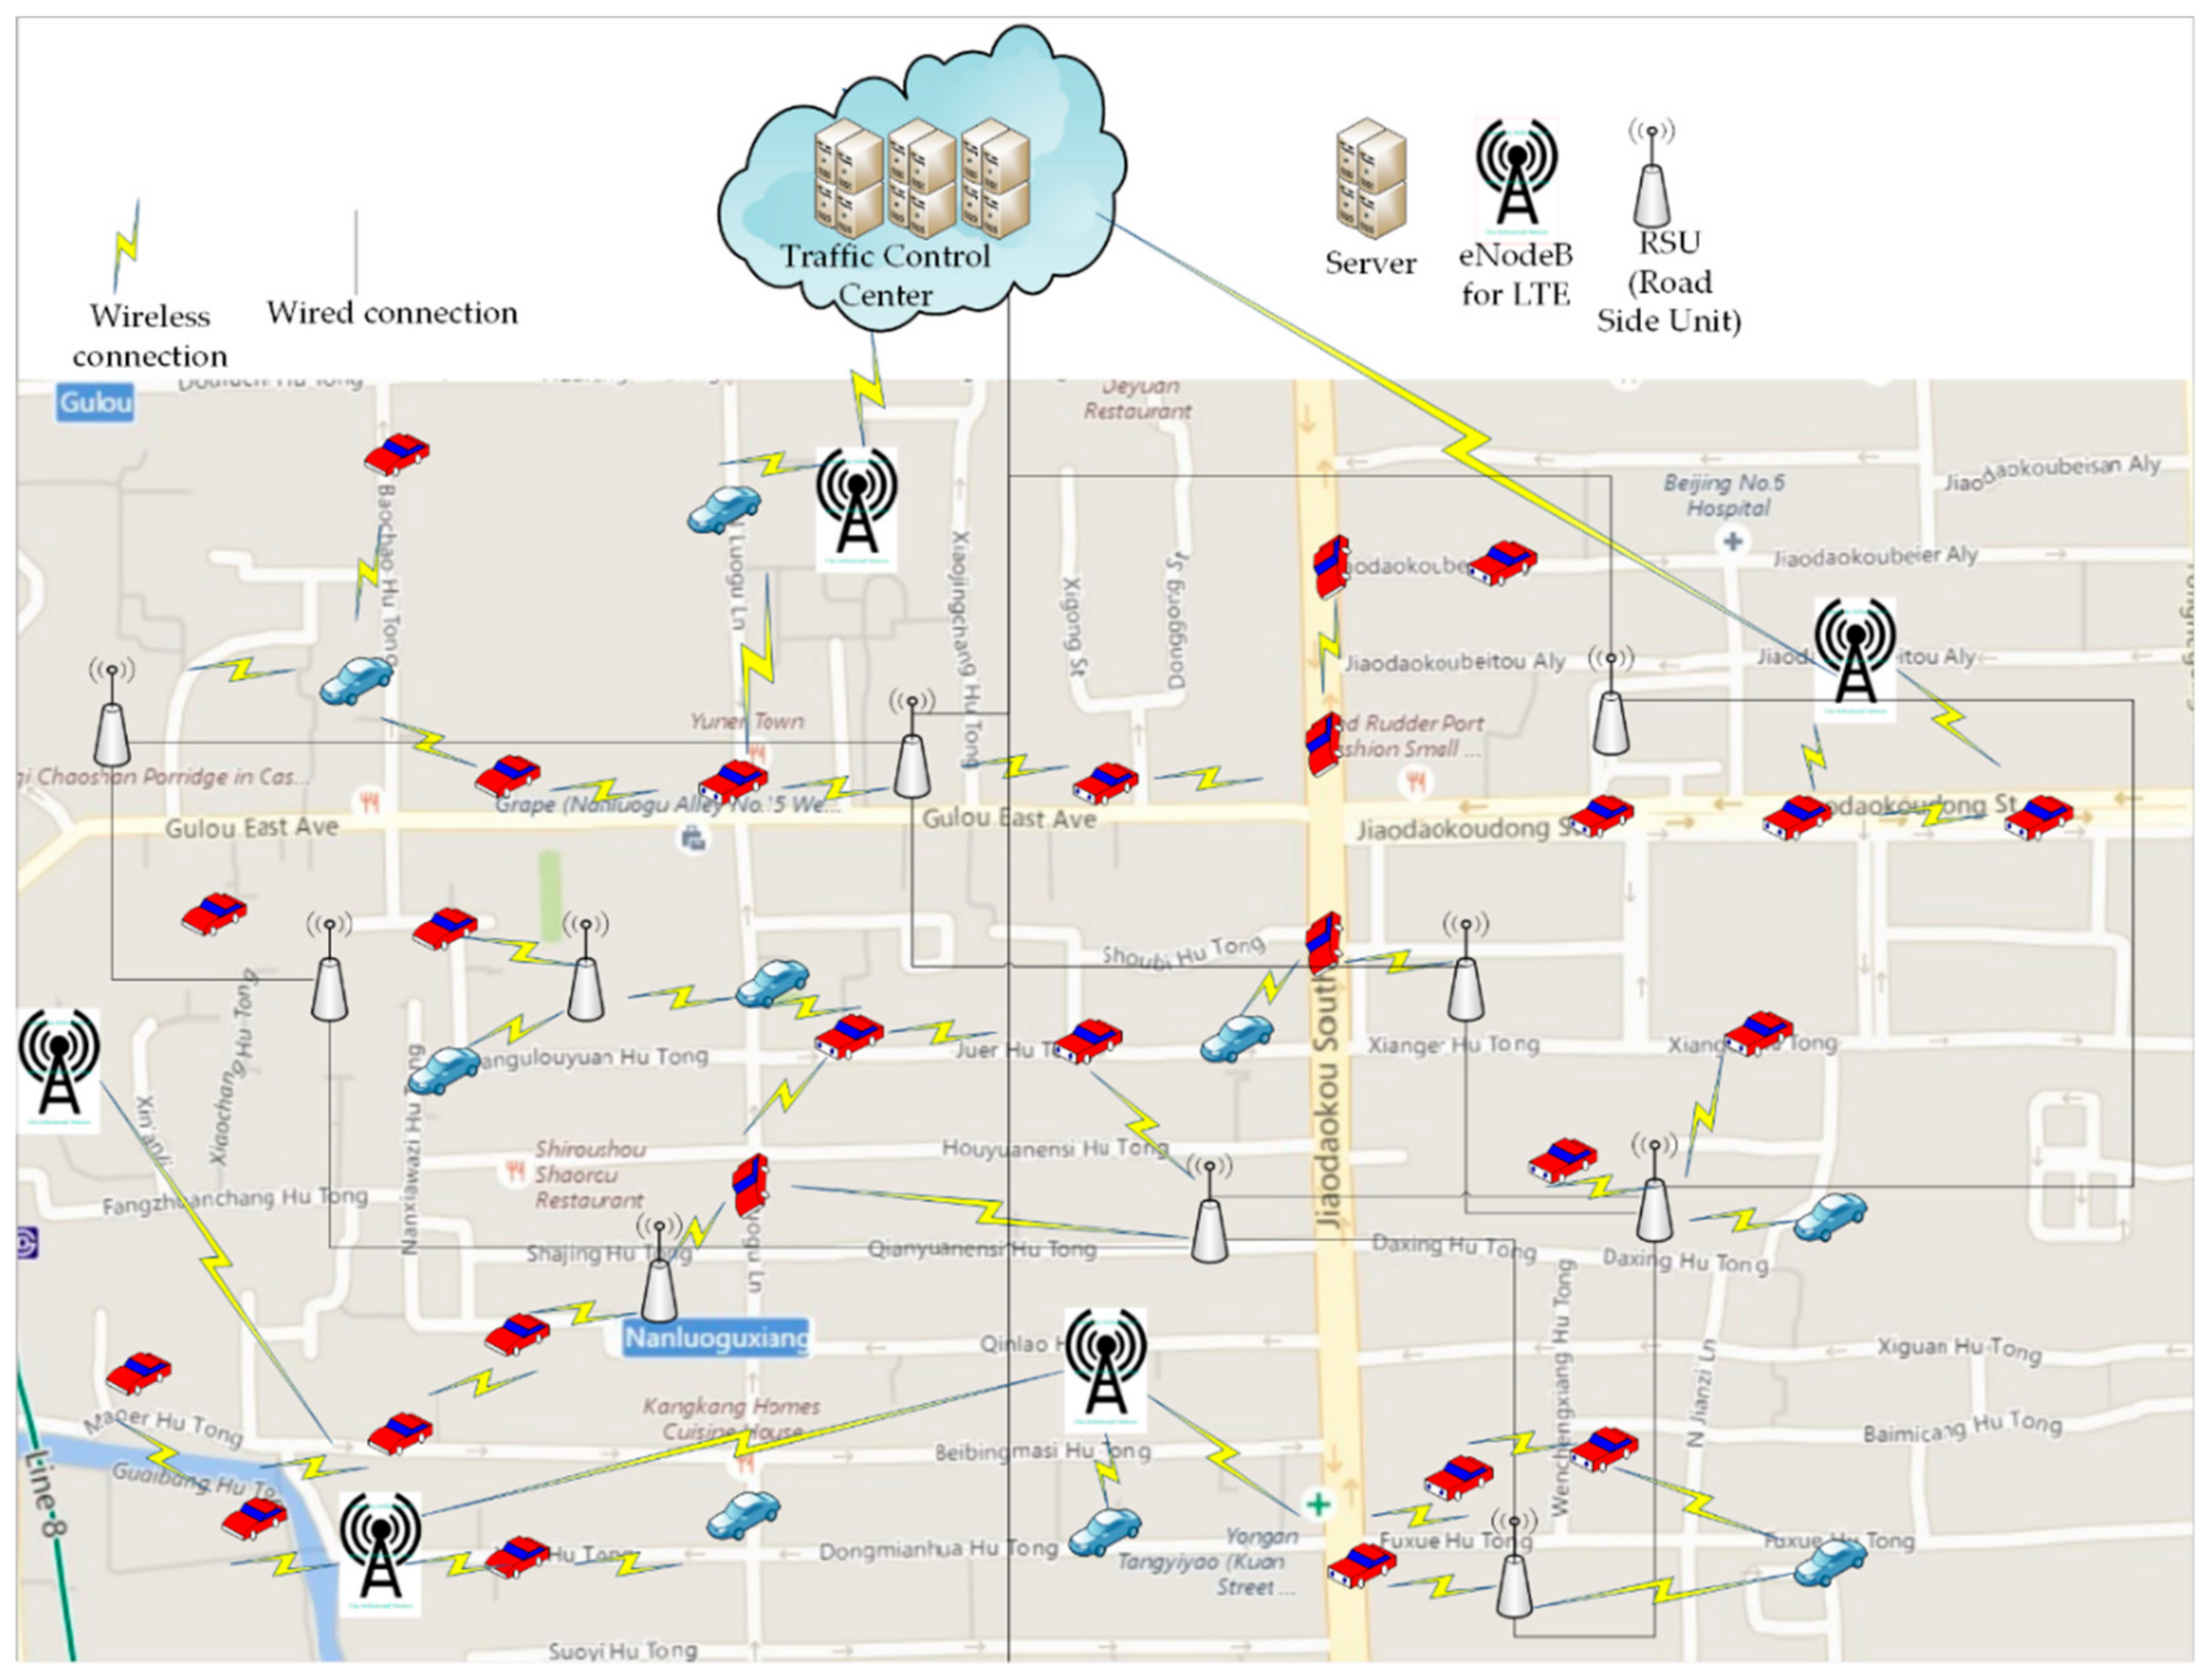
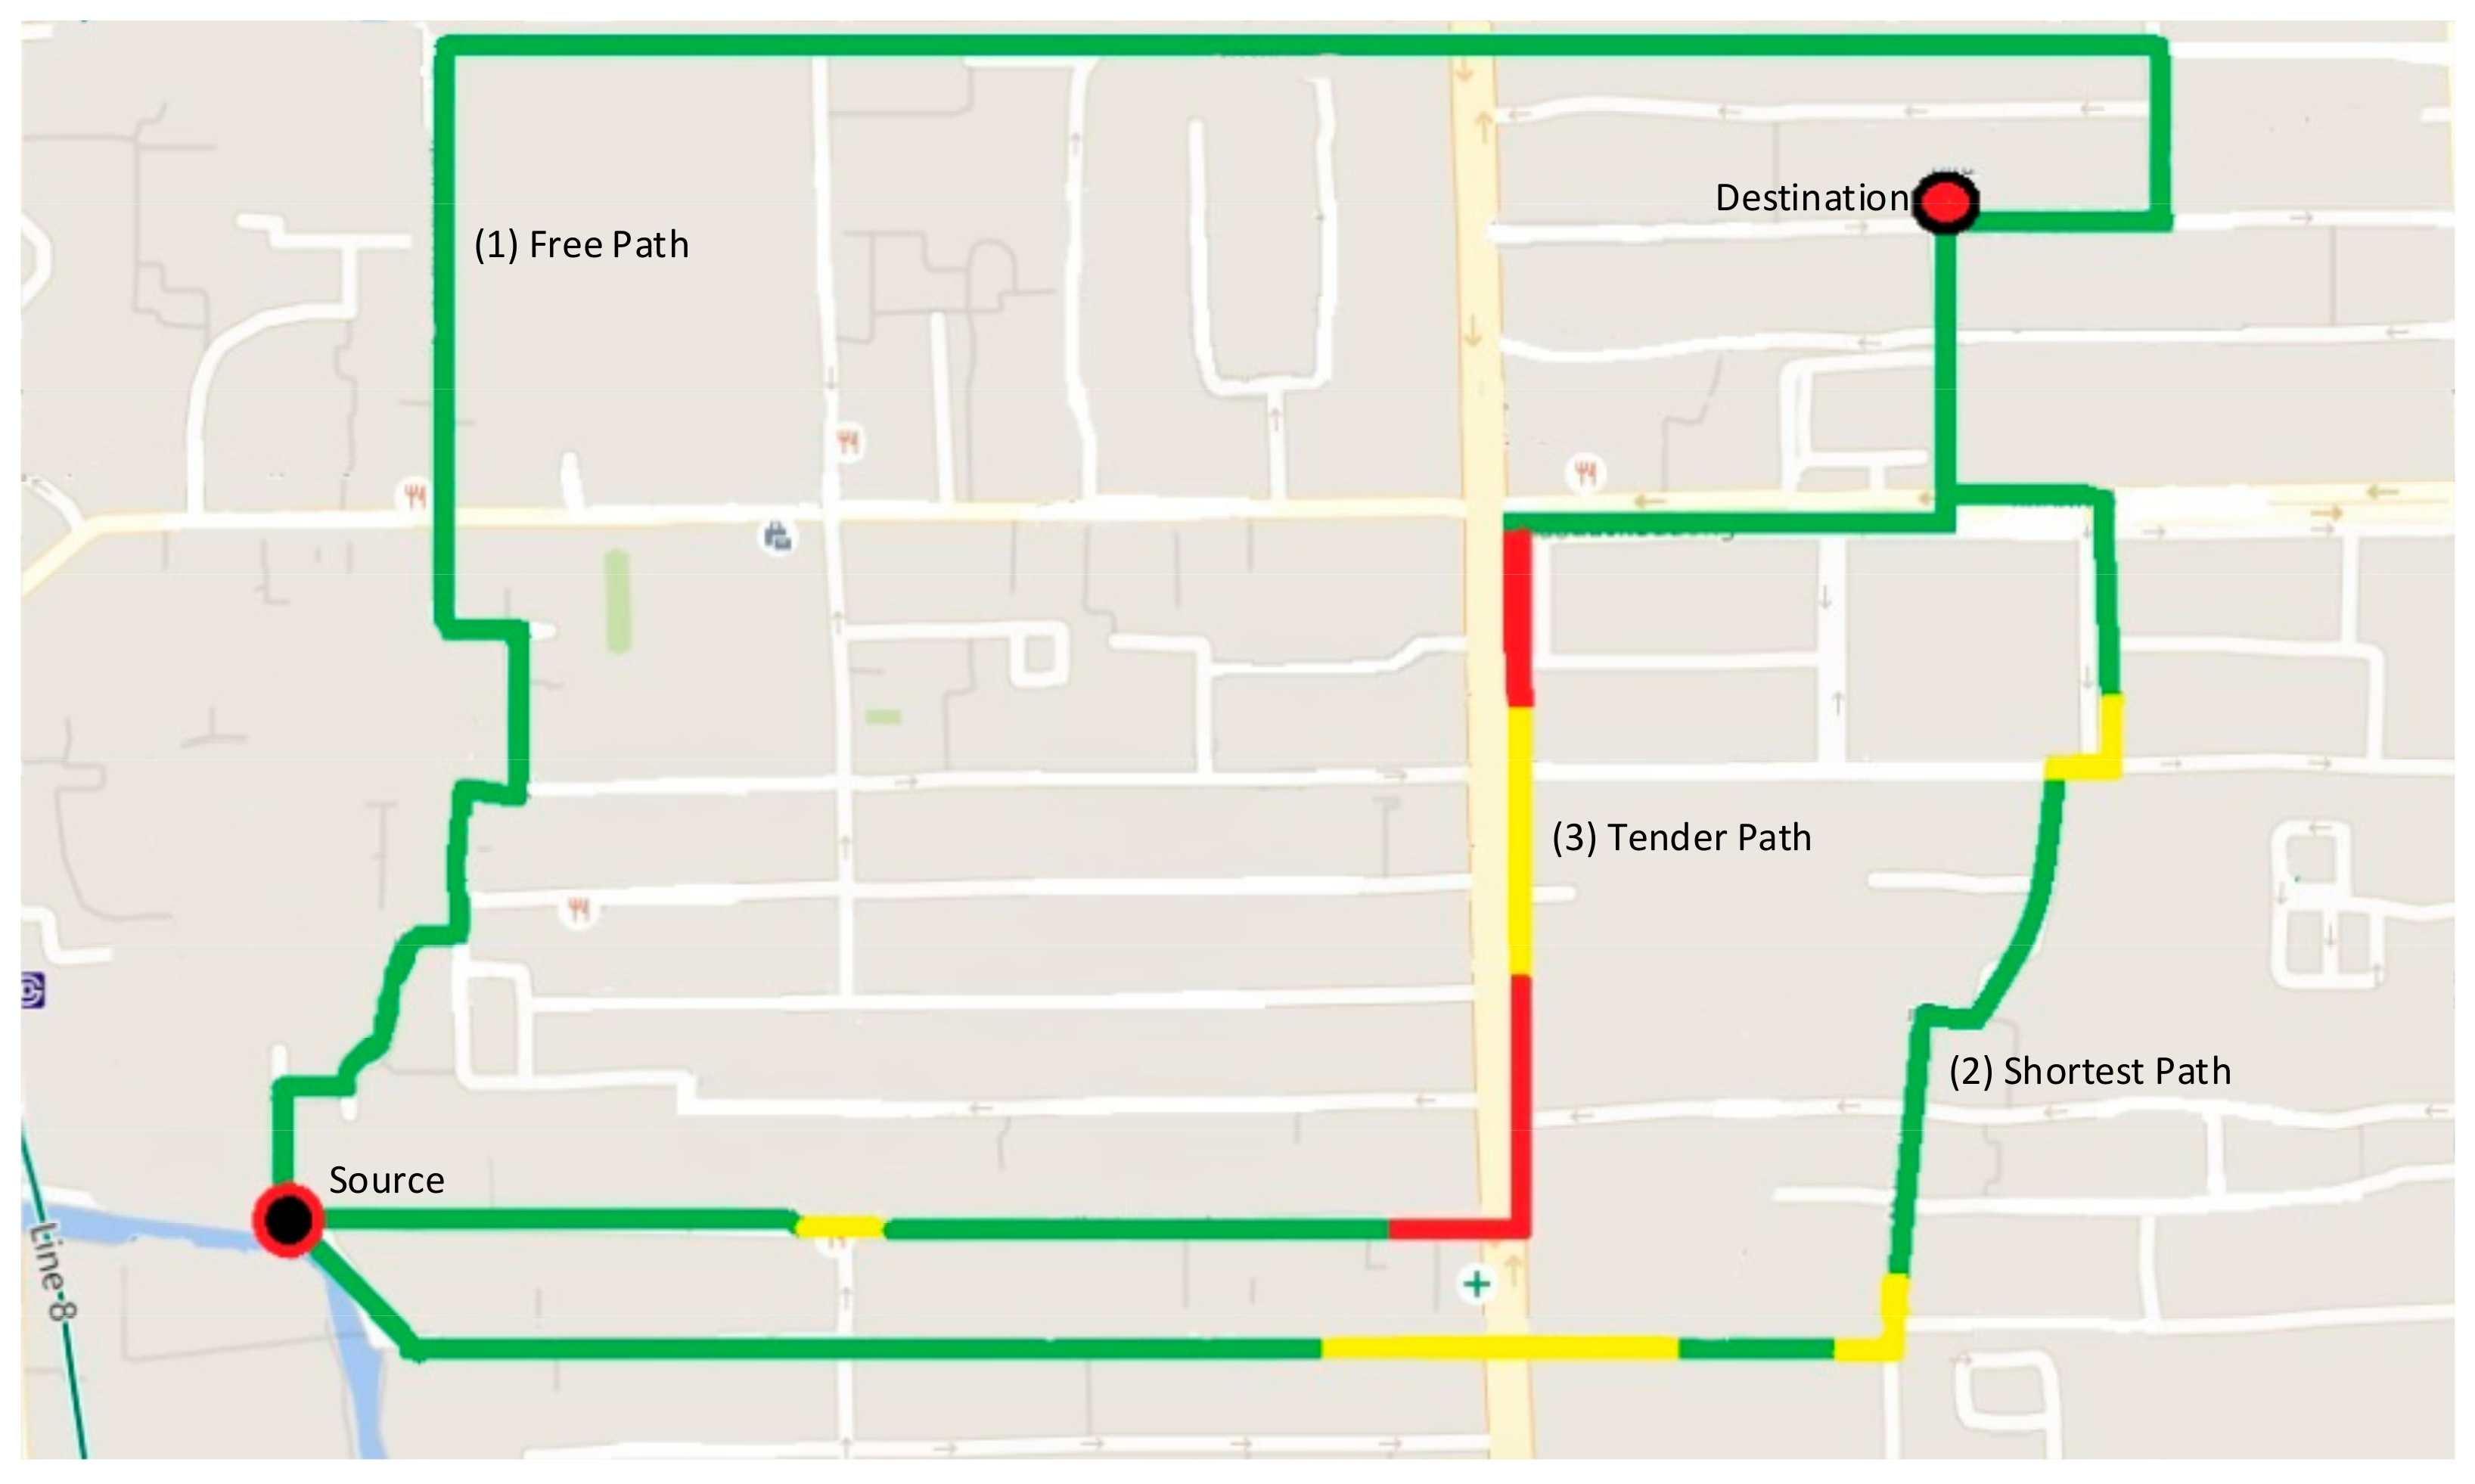
3.4. Reward and Punishment Policy
3.5. Traffic Tender
3.6. Misbehaviors Punishment
4. System Model
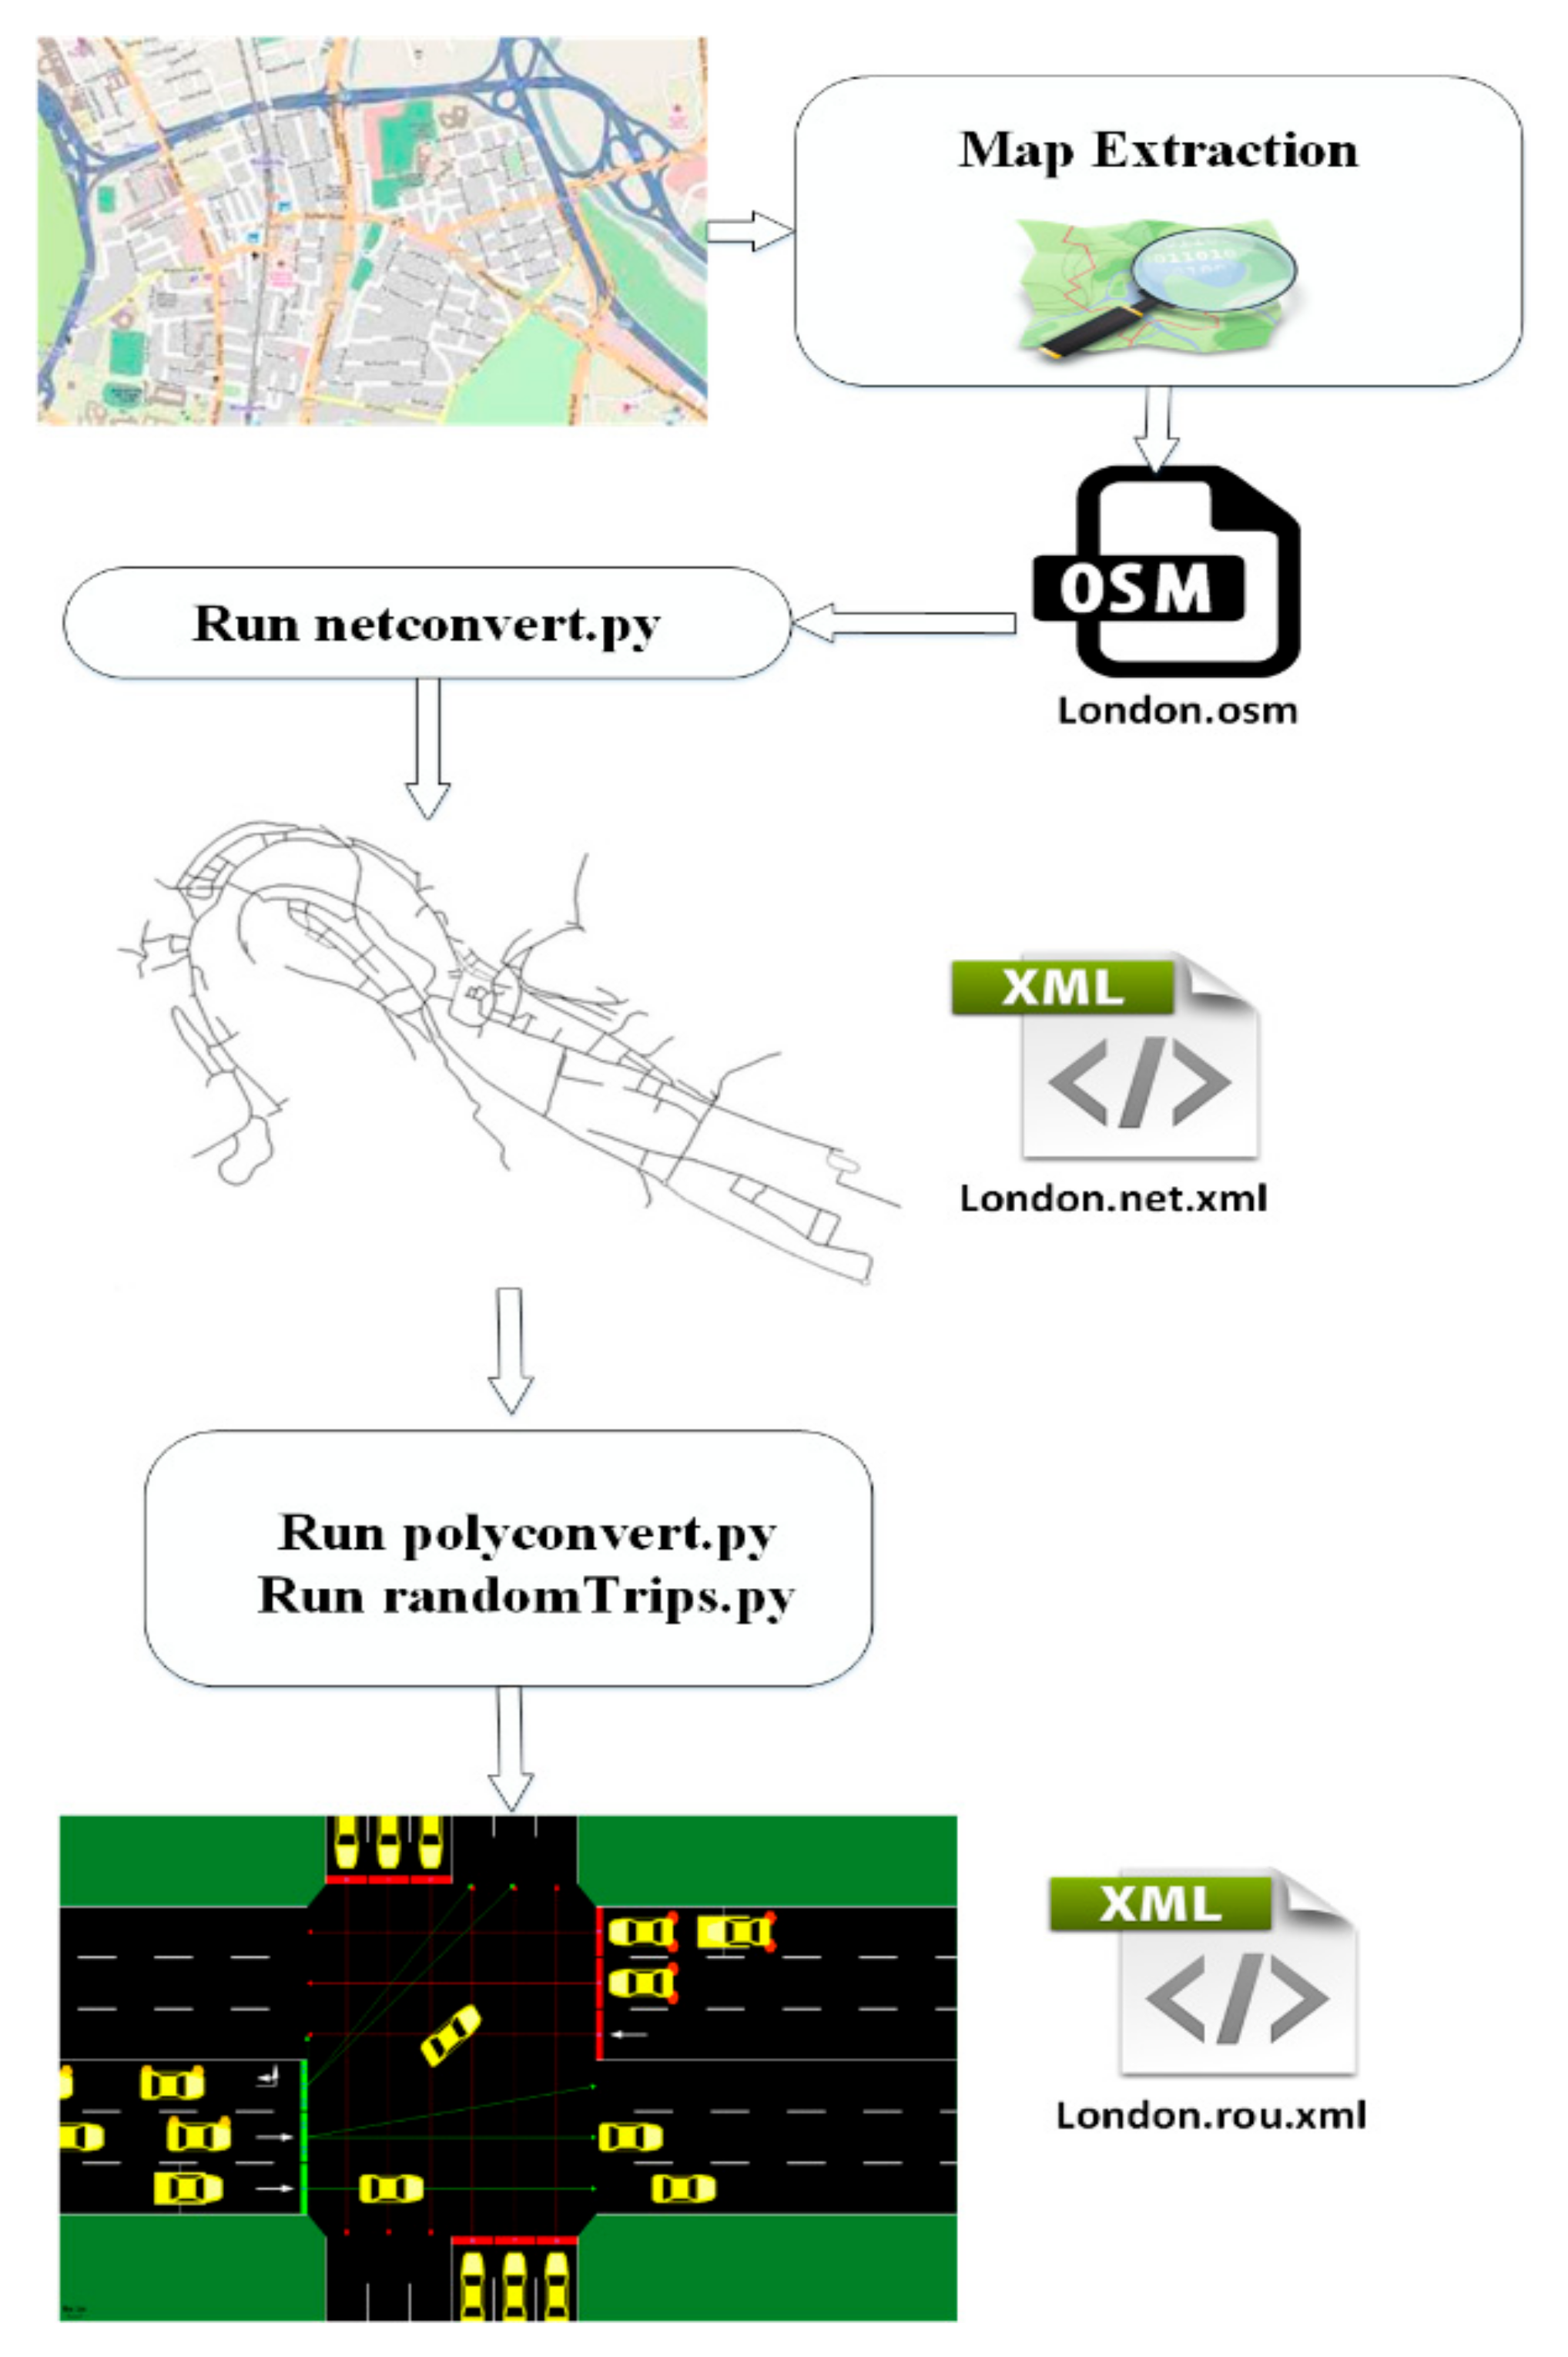
4.1. Map Modeling
4.2. Traffic Flow and Travel Delay
4.3. Path Reservation Process
4.3.1. Road Reservation Matrix
4.3.2. Traffic Quota Management
| Algorithm 1. Congestion aware traffic quota allocation. |
| 1: |
| 2: if then |
| 3: |
| 4: |
| 5: else |
| 6: if () then |
| 7: |
| 8: end if |
| 9: end if |
4.4. Dynamic Congestion Pricing
4.4.1. Punishment Pricing
4.4.2. Reward Pricing
5. Performance Evaluation
5.1. Baselines
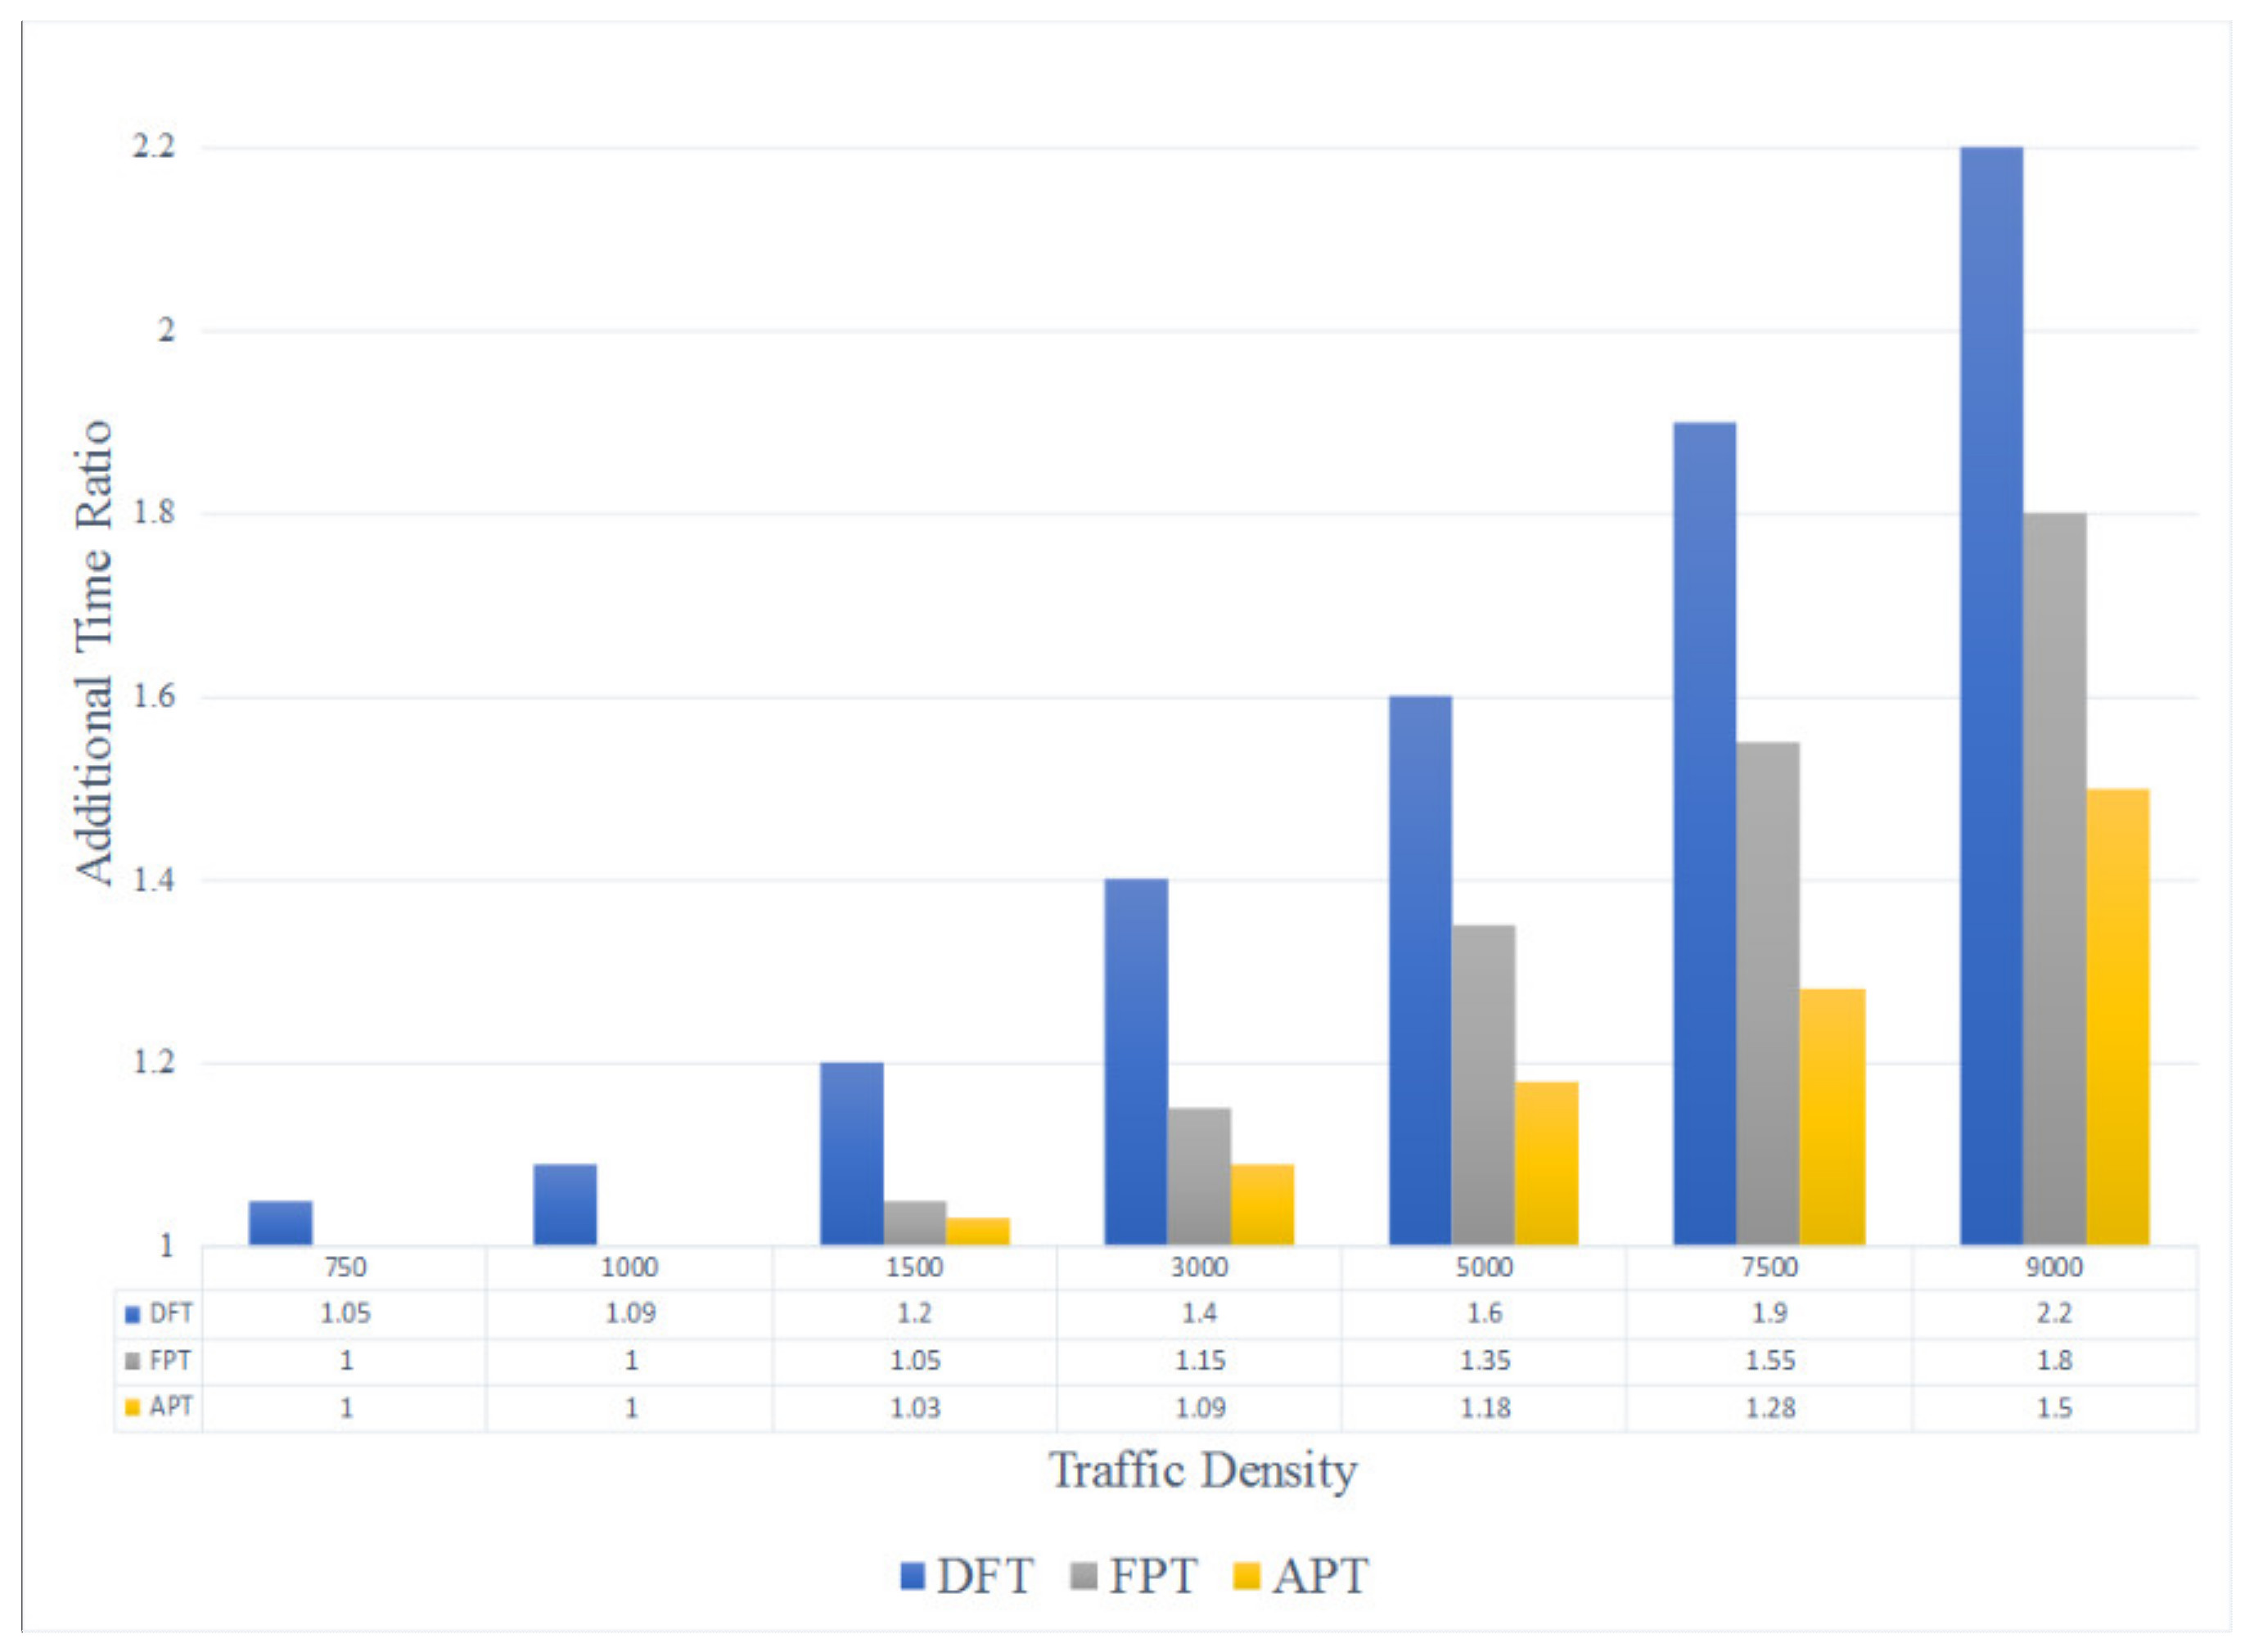
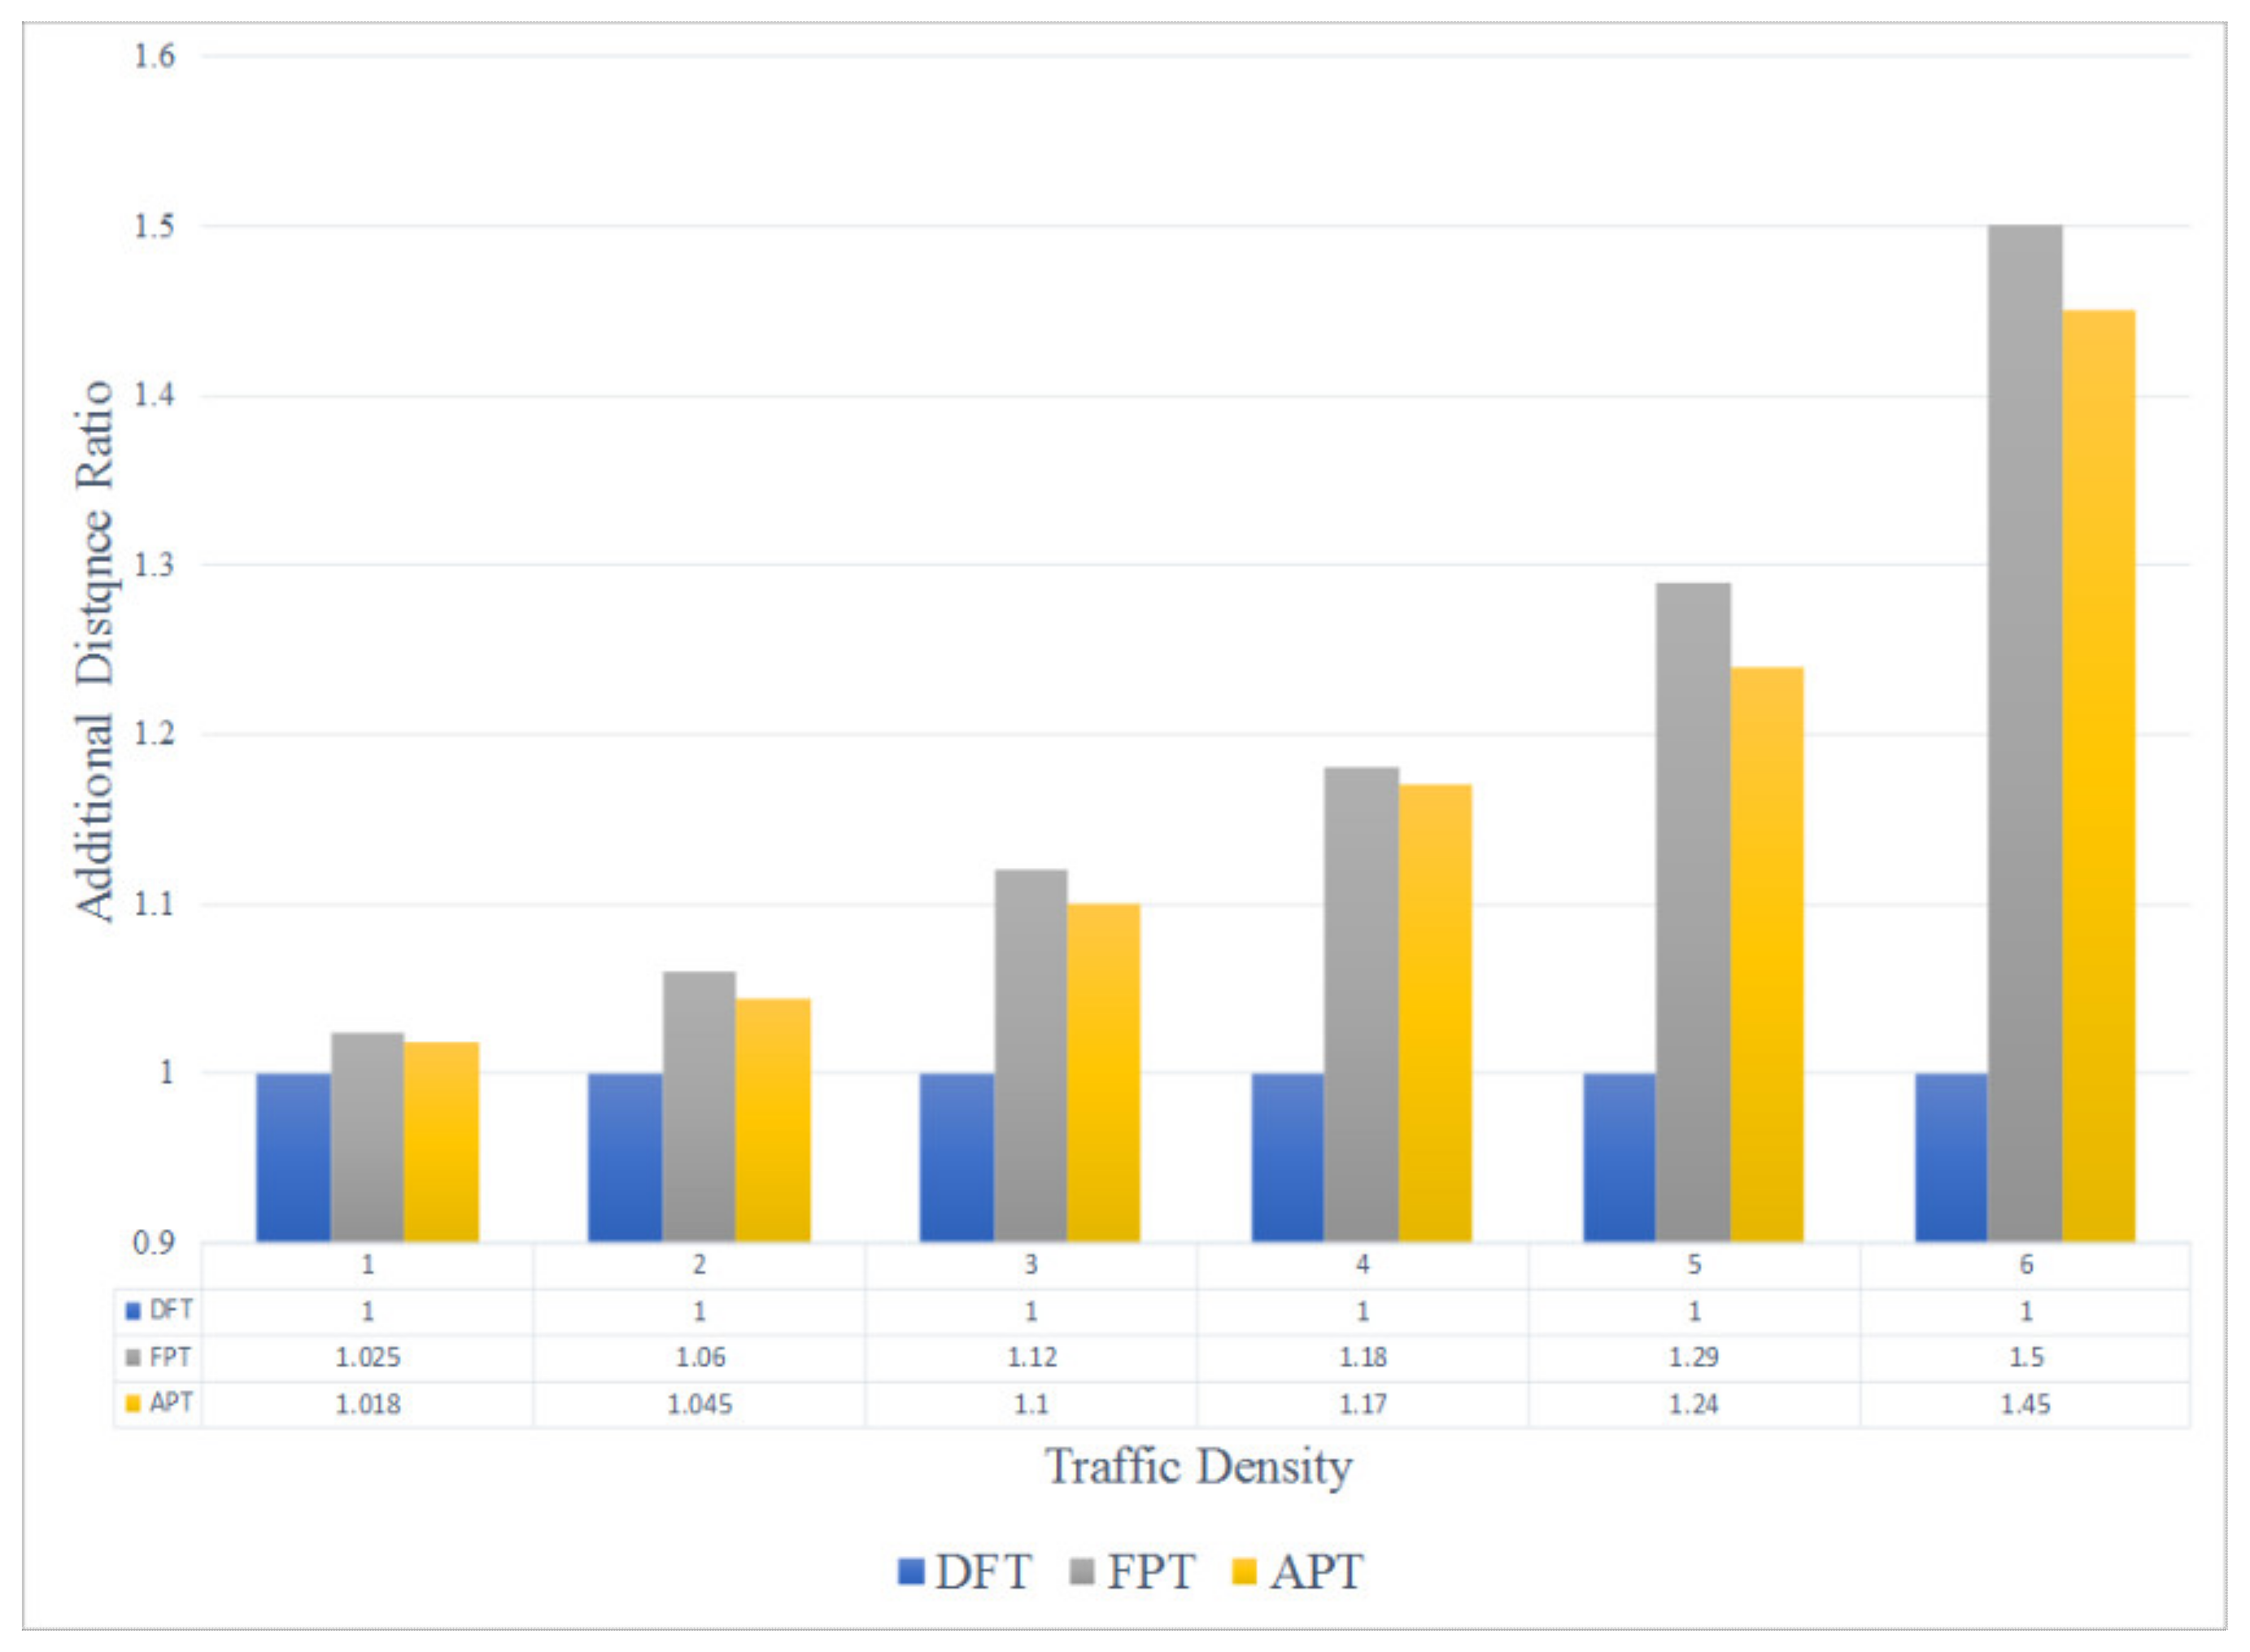
5.2. Performance Metrics
5.3. Evolution Parameters
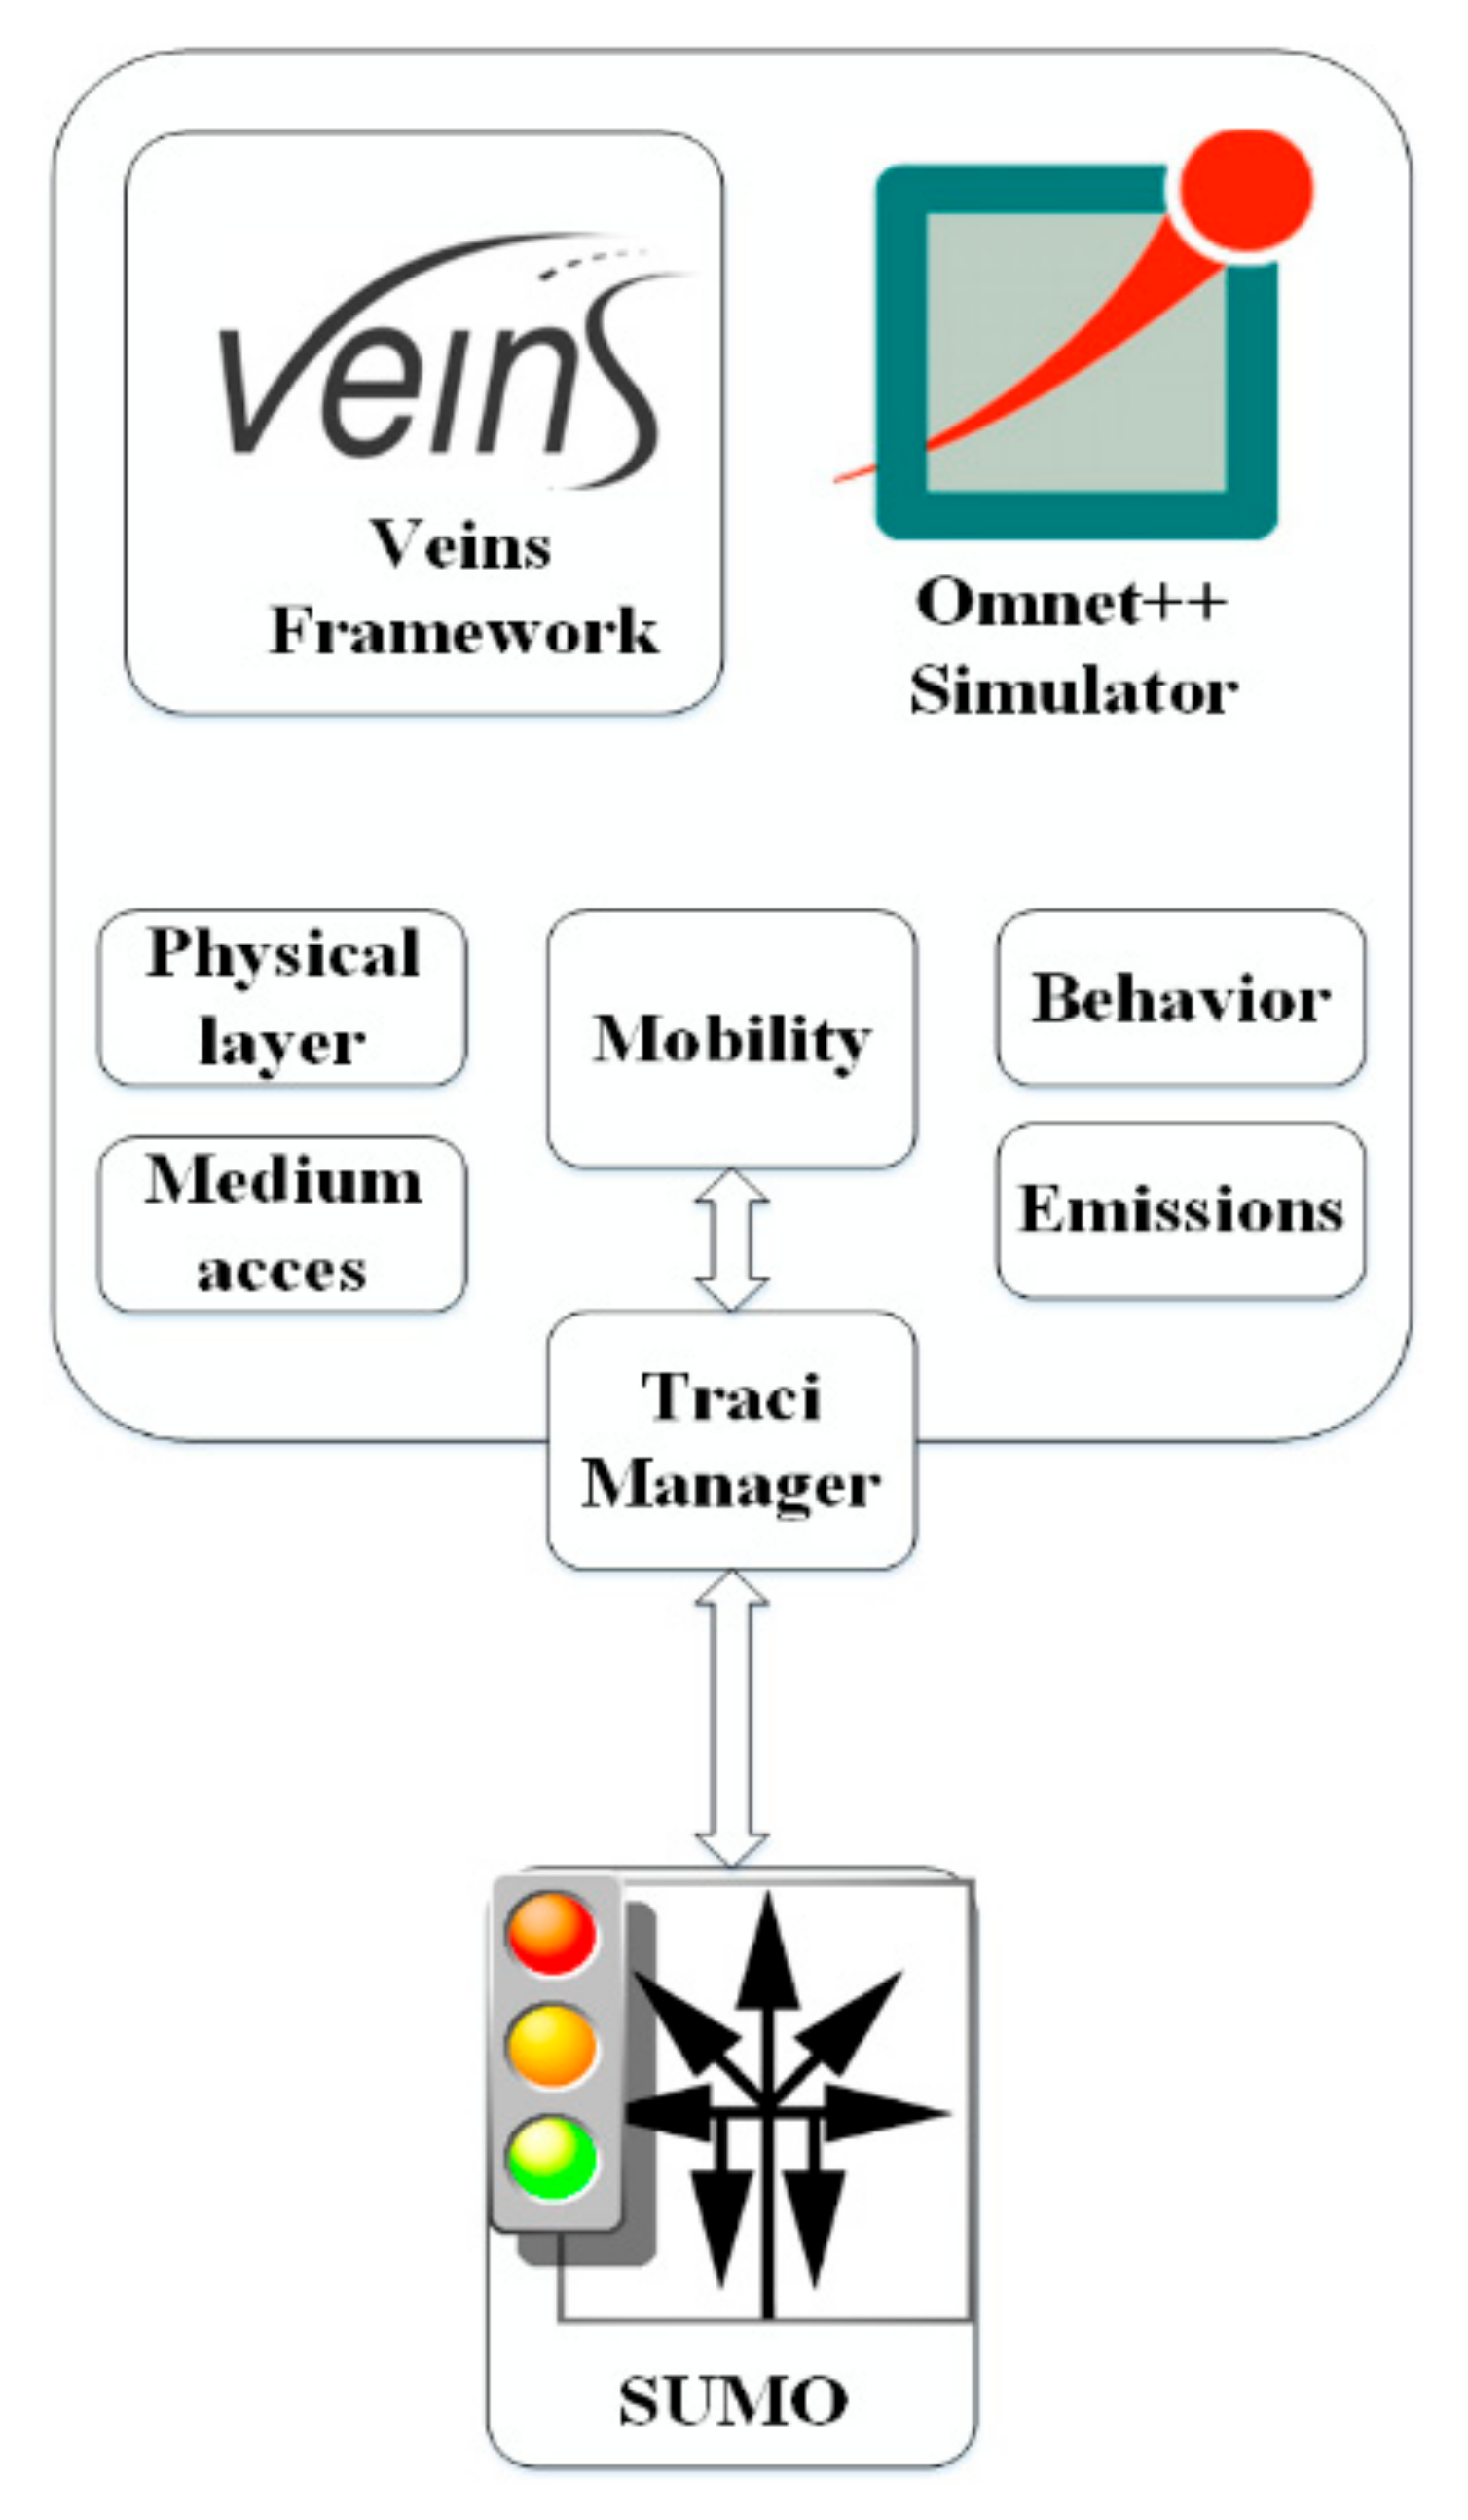
5.4. Simulation Environment
6. Results Discussion
7. Conclusions
- In this work, we assumed the static management of the traffic lights, incorporating a dynamic traffic lights management system with T-Coin is one of our future directions.
- The proposed system has been proven to be efficiency in alleviating traffic congestion, however, the vehicle’s path represents very private information, if disclosed by a malicious node during the communication between the vehicle and the traffic control center. Therefore, an in-depth study of the security and privacy of the T-Coin system is one of our future directions.
- In the proposed system, the traffic control system is considered to be a centralized server. Changing the server model to a distributed vehicular server, where the server’s computational responsibility is performed by the vehicles themselves, is one of our future directions.
Author Contributions
Funding
Conflicts of Interest
References
- Schrank, D.; Eisele, B.; Lomax, T. TTI’s 2012 Urban Mobility Report; Texas A&M Transportation Institute, The Texas A&M University System: College Station, TX, USA, 2012; p. 4. [Google Scholar]
- Zhang, K.; Batterman, S. Air pollution and health risks due to vehicle traffic. Sci. Total Environ. 2013, 450, 307–316. [Google Scholar] [CrossRef] [PubMed]
- De Palma, A.; Lindsey, R. Traffic congestion pricing methodologies and technologies. Transp. Res. Part C Emerg. Technol. 2011, 19, 1377–1399. [Google Scholar] [CrossRef]
- Haque, M.M.; Chin, H.C.; Debnath, A.K. Sustainable, safe, smart—three key elements of Singapore’s evolving transport policies. Transp. Policy 2013, 27, 20–31. [Google Scholar] [CrossRef]
- Santos, G. London congestion charging. Brook. Whart. Pap. Urban Aff. 2008, 2008, 177–234. [Google Scholar]
- Eliasson, J.; Hultkrantz, L.; Nerhagen, L.; Rosqvist, L.S. The Stockholm congestion--charging trial 2006: Overview of effects. Transp. Res. Part A Policy Pract. 2009, 43, 240–250. [Google Scholar] [CrossRef]
- Ben Sada, A.; Bensaad, M.L. Machine Learning for Automatic Plate Number Recognition. Int. J. Comput. Sci. Smart Syst. 2017, 1, 90–108. [Google Scholar]
- Ben-Elia, E.; Ettema, D. Carrots versus sticks: Rewarding commuters for avoiding the rush-hour—A study of willingness to participate. Transp. Policy 2009, 16, 68–76. [Google Scholar] [CrossRef]
- Aung, N.; Zhang, W.; Dhelim, S.; Ai, Y. Accident Prediction System Based on Hidden Markov Model for Vehicular Ad-Hoc Network in Urban Environments. Information 2018, 9, 311. [Google Scholar] [CrossRef]
- De Souza, A.M.; Braun, T.; Botega, L.C.; Cabral, R.; Garcia, I.C.; Villas, L.A. Better safe than sorry: A vehicular traffic re-routing based on traffic conditions and public safety issues. J. Internet Serv. Appl. 2019, 10, 17. [Google Scholar] [CrossRef]
- Dhelim, S.; Huansheng, N.; Cui, S.; Jianhua, M.; Huang, R.; Wang, K.I.K. Cyberentity and its consistency in the cyber-physical-social-thinking hyperspace. Comput. Electr. Eng. 2020, 81, 106506. [Google Scholar] [CrossRef]
- Hu, P.; Dhelim, S.; Ning, H.; Qiu, T. Survey on fog computing: Architecture, key technologies, applications and open issues. J. Netw. Comput. Appl. 2017, 98, 27–42. [Google Scholar] [CrossRef]
- Zhu, T.; Dhelim, S.; Zhou, Z.; Yang, S.; Ning, H. An architecture for aggregating information from distributed data nodes for industrial internet of things. Comput. Electr. Eng. 2017, 58, 337–349. [Google Scholar] [CrossRef]
- Ning, H.; Dhelim, S.; Aung, N. PersoNet: Friend Recommendation System Based on Big-Five Personality Traits and Hybrid Filtering. IEEE Trans. Comput. Soc. Syst. 2019, 6, 394–402. [Google Scholar] [CrossRef]
- Kachroo, P.; Gupta, S.; Agarwal, S.; Ozbay, K. Optimal control for congestion pricing: Theory, simulation, and evaluation. IEEE Trans. Intell. Transp. Syst. 2017, 18, 1234–1240. [Google Scholar] [CrossRef]
- Marefat, A.; Noor, R.M.; Anuar, N.B.; Hussin, N. The feasibility of employing IEEE802. 11P in electronic-based congestion pricing zone: A comparative study with RFID. Malays. J. Comput. Sci. 2016, 29, 247–261. [Google Scholar] [CrossRef][Green Version]
- Kachroo, P.; Özbay, K.M.A. Feedback Routing via Congestion Pricing. In Feedback Control Theory for Dynamic Traffic Assignment; Springer International Publishing: Cham, Switzerland, 2018; pp. 249–266. ISBN 978-3-319-69231-9. [Google Scholar]
- Zhou, Z.; Zhang, K.; Zhu, W.; Wang, Y. Modeling Lane-Choice Behavior to Optimize Pricing Strategy for HOT Lanes: A Support Vector Regression Approach. J. Transp. Eng. Part A Syst. 2019, 145, 04019004. [Google Scholar] [CrossRef]
- Tscharaktschiew, S.; Evangelinos, C. Pigouvian road congestion pricing under autonomous driving mode choice. Transp. Res. Part C Emerg. Technol. 2019, 101, 79–95. [Google Scholar] [CrossRef]
- Bouchelaghem, S.; Omar, M. Reliable and Secure Distributed Smart Road Pricing System for Smart Cities. IEEE Trans. Intell. Transp. Syst. 2019, 20, 1592–1603. [Google Scholar] [CrossRef]
- Jardí-Cedó, R.; Mut-Puigserver, M.; Castellà-Roca, J.; Magdalena, M.; Viejo, A. Privacy-preserving Electronic Road Pricing System for Multifare Low Emission Zones. In Proceedings of the 9th International Conference on Security of Information and Networks—SIN, Newark, NJ, USA, 20–22 July 2016; pp. 158–165. [Google Scholar]
- Zhang, W.; Aung, N.; Dhelim, S.; Ai, Y. DIFTOS: A Distributed Infrastructure-Free Traffic Optimization System Based on Vehicular Ad Hoc Networks for Urban Environments. Sensors 2018, 18, 2567. [Google Scholar] [CrossRef]
- Jeong, J.; Jeong, H.; Member, S.; Lee, E.; Oh, T.; Member, S.; Du, D.H.C. SAINT: Self-Adaptive Interactive Navigation Tool for Cloud-Based Vehicular Traffic Optimization. IEEE Trans. Veh. Technol. 2016, 65, 4053–4067. [Google Scholar] [CrossRef]
- Shen, Y.; Lee, J.; Jeong, H.; Jeong, J.; Lee, E.; Du, D.H.C. SAINT+: Self-Adaptive Interactive Navigation Tool+ for Emergency Service Delivery Optimization. IEEE Trans. Intell. Transp. Syst. 2018, 19, 1038–1053. [Google Scholar] [CrossRef]
- Pan, J.S.; Popa, I.S.; Borcea, C. DIVERT: A Distributed Vehicular Traffic Re-Routing System for Congestion Avoidance. IEEE Trans. Mob. Comput. 2017, 16, 58–72. [Google Scholar] [CrossRef]
- Zhu, Y.; Li, Z.; Zhu, H.; Li, M.; Zhang, Q. A compressive sensing approach to urban traffic estimation with probe vehicles. IEEE Trans. Mob. Comput. 2013, 12, 2289–2302. [Google Scholar] [CrossRef]
- Soriguera, F.; Robusté, F. Estimation of traffic stream space mean speed from time aggregations of double loop detector data. Transp. Res. Part C Emerg. Technol. 2011, 19, 115–129. [Google Scholar] [CrossRef]
- OpenStreetMaps. Available online: https://www.openstreetmap.org/ (accessed on 5 May 2019).
- Simulation of Urban Mobility. Available online: http://sumo.dlr.de/wiki/Simulation_of_Urban_MObility_-_Wiki (accessed on 5 May 2019).
- The Open Source Vehicular Network Simulation Framework. Available online: http://veins.car2x.org/ (accessed on 5 May 2019).


| System | T-Coin | DIFTOS | SAINT | DIVERT | |
|---|---|---|---|---|---|
| Feature | |||||
| Traffic Control Center | Centralized server | Hierarchal distributed vehicular servers | Centralized server | Distributed servers | |
| Road reservation strategy | First come first served + Tender process | First come first served | First come first served | First come first served | |
| Communication infrastructure dependency (V2I+4G) | Infrastructure required | Infrastructure not required | Infrastructure required | Infrastructure partially required | |
| Rerouting strategy | Yes | Yes | Yes | Yes | |
| Quota allocation | Yes | Yes | No | No | |
| Driver decides rerouting path | Yes | No | No | No | |
| Virtual currency | Yes | No | No | No | |
| Destination-aware rerouting prioritization | Yes | No | No | No | |
| Parameters | Description |
|---|---|
| Network Simulator | Omnet++5 |
| Traffic Simulator | Sumo 0.27.1 |
| Map Information | OpenStreetMap |
| Simulated Location | Beijing |
| Simulated area |
| Parameter | Value |
|---|---|
| PHY model | 802.11 p |
| Channel frequency | 5.890e9 Hz |
| Propagation model | Two ray |
| MAC model | EDCA |
| Propagation distance | 450 m |
| Maximum hop | 15 |
| Fading model | Jakes model rayleigh fading |
| Shadowing model | LogNormal |
| Antenna model | Omnidirectional |
| Transmission power | 20 mW |
© 2020 by the authors. Licensee MDPI, Basel, Switzerland. This article is an open access article distributed under the terms and conditions of the Creative Commons Attribution (CC BY) license (http://creativecommons.org/licenses/by/4.0/).
Share and Cite
Aung, N.; Zhang, W.; Dhelim, S.; Ai, Y. T-Coin: Dynamic Traffic Congestion Pricing System for the Internet of Vehicles in Smart Cities. Information 2020, 11, 149. https://doi.org/10.3390/info11030149
Aung N, Zhang W, Dhelim S, Ai Y. T-Coin: Dynamic Traffic Congestion Pricing System for the Internet of Vehicles in Smart Cities. Information. 2020; 11(3):149. https://doi.org/10.3390/info11030149
Chicago/Turabian StyleAung, Nyothiri, Weidong Zhang, Sahraoui Dhelim, and Yibo Ai. 2020. "T-Coin: Dynamic Traffic Congestion Pricing System for the Internet of Vehicles in Smart Cities" Information 11, no. 3: 149. https://doi.org/10.3390/info11030149
APA StyleAung, N., Zhang, W., Dhelim, S., & Ai, Y. (2020). T-Coin: Dynamic Traffic Congestion Pricing System for the Internet of Vehicles in Smart Cities. Information, 11(3), 149. https://doi.org/10.3390/info11030149