An Accurate GNSS-Based Redundant Safe Braking System for Urban Elevated Rail Maglev Trains
by
 , and
, and
João Batista Pinto Neto
1,2,†,‡, 
Lucas de Carvalho Gomes
1,† ,
,
Miguel Elias Mitre Campista
1,† and
Luís Henrique Maciel Kosmalski Costa
1,*,† 1
Grupo de Teleinformática e Automação, Universidade Federal do Rio de Janeiro, Rio de Janeiro 21941-901, Brazil
2
Instituto Federal de Educação, Ciência e Tecnologia de Rondônia (IFRO), Av. Governador Jorge Teixeira, Porto Velho 78905-160, Brazil
*
Author to whom correspondence should be addressed.
†
These authors contributed equally to this work.
‡
In memorian.
Information 2020, 11(11), 531; https://doi.org/10.3390/info11110531
Submission received: 23 September 2020
/
Revised: 11 November 2020
/
Accepted: 12 November 2020
/
Published: 15 November 2020
Abstract
:The association of elevated rail structures and Maglev (magnetic levitation) trains is a promising alternative for urban transportation. Besides being cost-effective in comparison with underground solutions, the Maglev technology is a clean and low-noise mass transportation. In this paper, we propose a low-cost automatic braking system for Maglev trains. There is a myriad of sensors and positioning techniques used to improve the accuracy, precision and stability of train navigation systems, but most of them result in high implementation costs. In this paper, we develop an affordable solution, called Redundant Autonomous Safe Braking System (RASBS), for the MagLev-Cobra train, a magnetic levitation vehicle developed at the Federal University of Rio de Janeiro (UFRJ), Brazil. The proposed braking system employs GNSS (Global Navigation Satellite System) receivers at the stations and trains, which are connected via an ad-hoc wireless network. The proposed system uses a cooperative error correction algorithm to achieve sub-meter distance precision. We experimentally evaluate the performance of RASBS in the MagLev prototype located at the campus of UFRJ, Brazil. Results show that, using RASBS, the train is able to dynamically set the precise location to start the braking procedure.
1. Introduction
Intelligent Transportation Systems (ITS) have attracted significant attention from the industry and academy with the appearance of new vehicular communication standards. There is a huge diversity of possible data that can be acquired from the multiple sensors available in this ecosystem. An example is information on the location and speed of vehicles, obtained using GNSS (Global Navigation Satellite System) receivers. Additionally, vehicles have become able to communicate with each other (Vehicle-to-Vehicle or V2V communications) and with fixed infrastructure alongside roads and streets (Vehicle-to-Infrastructure or V2I communications), by using IEEE 802.11p or cellular networks [1]. These conditions create an environment which is suitable for the development of many applications, ranging from autonomous and safe driving to entertainment.
ITS aim at improving the efficiency of the transportation services, providing more reliable traffic management and lower operational costs. In this sense, various active safety applications have been developed, for instance forward collision warning, risky overtaking warning and hard braking warning systems, which are considered active safety applications because they cooperatively avoid collisions. This idea contrasts with passive devices, such as airbags and safety belts, which can only minimize physical and material damages, but cannot avoid them [2]. Another possible application for vehicular networking is autonomous driving [3]. Nevertheless, it poses harsh requirements and challenges. In this case, a seamless communication between vehicles and infrastructure is essential to guarantee a safe transportation. With the use of GPS monitoring and dedicated networks, it is possible to provide a safe environment where vehicles can operate autonomously with minimized risks.
GNSS train positioning systems have gained significant attention by the railroad industry and academia due to the precision and reliability improvements to estimate speed and distance of modern GNSS receivers. Nevertheless, standard receivers cannot precisely identify locations in their trajectories because of the signal reflections on metal structures [4], demanding train navigation systems to be equipped with various sensors, such as Doppler radars, DGPS (Differential Global Positioning System), RFID (Radio Frequency Identification), INS (Inertial Navigation System) and tachometers. This diversity of sensor devices and positioning techniques ensures high accuracy, high precision and stability of train navigation system, being, however, very costly [5].
In this work, we develop an autonomous redundant braking system for the MagLev-Cobra train, which is a public transportation system based on magnetic levitation [6]. The MagLev-Cobra train already has an autonomous safe braking system composed of two stages. The first, which is the focus of this work, is responsible for determining the moment when the vehicle reaches a previously set safe distance at which the electric brake must actuate before reaching the next station. The second stage receives the control signal from the first and generates a constant slowdown, forcing the vehicle to obey a linear decay speed ramp until it reaches the station. The goal is to safely stop the train along the platform at the correct position at the railway station. Since this operation is highly sensitive, it cannot rely on a single braking system, requiring redundancy.
Currently, a high precision laser technology which detects the distance to the next station is under development for the main braking system of the MagLev-Cobra train. The Redundant Autonomous Safety Braking System (RASBS) proposed in the present work is a second system that acts in case of failure of the first one, improving the reliability of the whole system and the safety of the vehicle. RASBS uses three GNSS receivers inside three positioning modules. These modules, located inside the train and the previous and next stations, communicate via an ad hoc wireless network to cooperatively compute the safe braking distance with a high precision, overcoming the limited precision of the GNSS in its single point mode operation. The performance of RASBS is evaluated through experiments in the MagLev-Cobra prototype vehicle (Figure 1), installed in the campus of the Federal University of Rio de Janeiro (UFRJ), Brazil. The three RASBS modules installed in its stations and inside the train execute an algorithm which achieves a sub-meter distance precision, using the real distance between the train stations as the basic reference to adjust GNSS positional data. RASBS does not employ augmentation systems or additional sensors, only using GNSS receivers operating in single-point mode and wireless communications. It is, thus, less costly than similar proposals: the implementation presented here had an approximated cost of 887.00 USD. Even with less equipment, the performance evaluation has shown that RASBS is able to achieve sub-meter precision, attaining state-of-the-art performance and meeting the requirements for the safe braking application of the MagLev-Cobra train.
This paper is organized as follows. Section 2 presents related work. Section 3 introduces RASBS, focusing on the design of each module and their interaction. Section 4 presents the algorithm used to minimize the influence of the GPS update rate on the error of the calculated distance between the vehicle and the next station. Experimental results with the MagLev train are presented at Section 5. Finally, Section 6 concludes the paper and investigates future work.
2. Related Work
With the advent of Global Navigation Satellite Systems (GNSS), such as GPS, train positioning and speed evaluation systems have an additional cost-effective technology option. An inexpensive GPS-based train control system for secondary lines was proposed by Yamamoto et al. [8] to provide continuous positioning and speed control. To improve the GPS positioning reliability, they use the augmentation system MSAS (MTSAT Satellite-based Augmentation System) to correct malfunction-related data orbital errors, clock errors, and ionosphere time-delay errors. The authors used a low-cost standard SBAS (Satellite-based augmentation system) receiver jointly with GPS to achieve positioning errors under 2 m when the vehicle is running under open sky.
To improve safety and reliability, Liu et al. [9] presented a scheme for the integrity assurance of a GNSS-based train integrated positioning system. The proposed scheme collects data from various sensors, e.g., GNSS receiver, accelerator, gyroscope, and odometer and checks their integrity through a data fusion filter and a map matching algorithm. According to the authors, this scheme provides sensor fault detection, fault diagnosis, and isolation, which are necessary for a safety system. Another approach that uses a cooperative algorithm is presented by Roth et al. [10]. The authors ensure that the algorithm enables adjustment of GNSS pseudorange measurements coming from collaborating vehicles in the communication range, in order to use them for self-localization. The result is an improvement of positioning precision, mitigating the problem of satellite unavailability for urban environments.
The aforementioned related work differs from the present proposal, since it employs no augmentation system or additional sensor. RASBS only uses GNSS receivers working in single-point mode. With respect to the cooperative algorithm, our proposal is based only on wireless communications between train and stations. Even at such conditions, RASBS has been able to reach a sub-meter precision, achieving state-of-the-art performance with lower costs.
3. Redundant Autonomous Safe Braking System
The proposed Redundant Autonomous Safe Braking System (RASBS) is a secondary braking system for the MagLev-Cobra levitation vehicle. The objective of RASBS is the safe positioning of the train in the platform, based on a safe braking distance estimation. It is worth noting that, although applied to a train, the design of the system could be adapted to other vehicles and situations, e.g., autonomous cars or buses.
3.1. System Description
RASBS determines the distance to the next station using static and dynamic positioning procedures. The static one is carried out by all the system modules in a cooperative fashion. To perform it, stations exchange their coordinates and perform an error correction algorithm. The next station sends both its and its predecessor’s coordinates, plus the computed correction factor to the vehicle, which will use this received information jointly with GNSS data to determine its position. The dynamic positioning procedure is performed only by the train while it is moving, to compensate for the GNSS update rate.
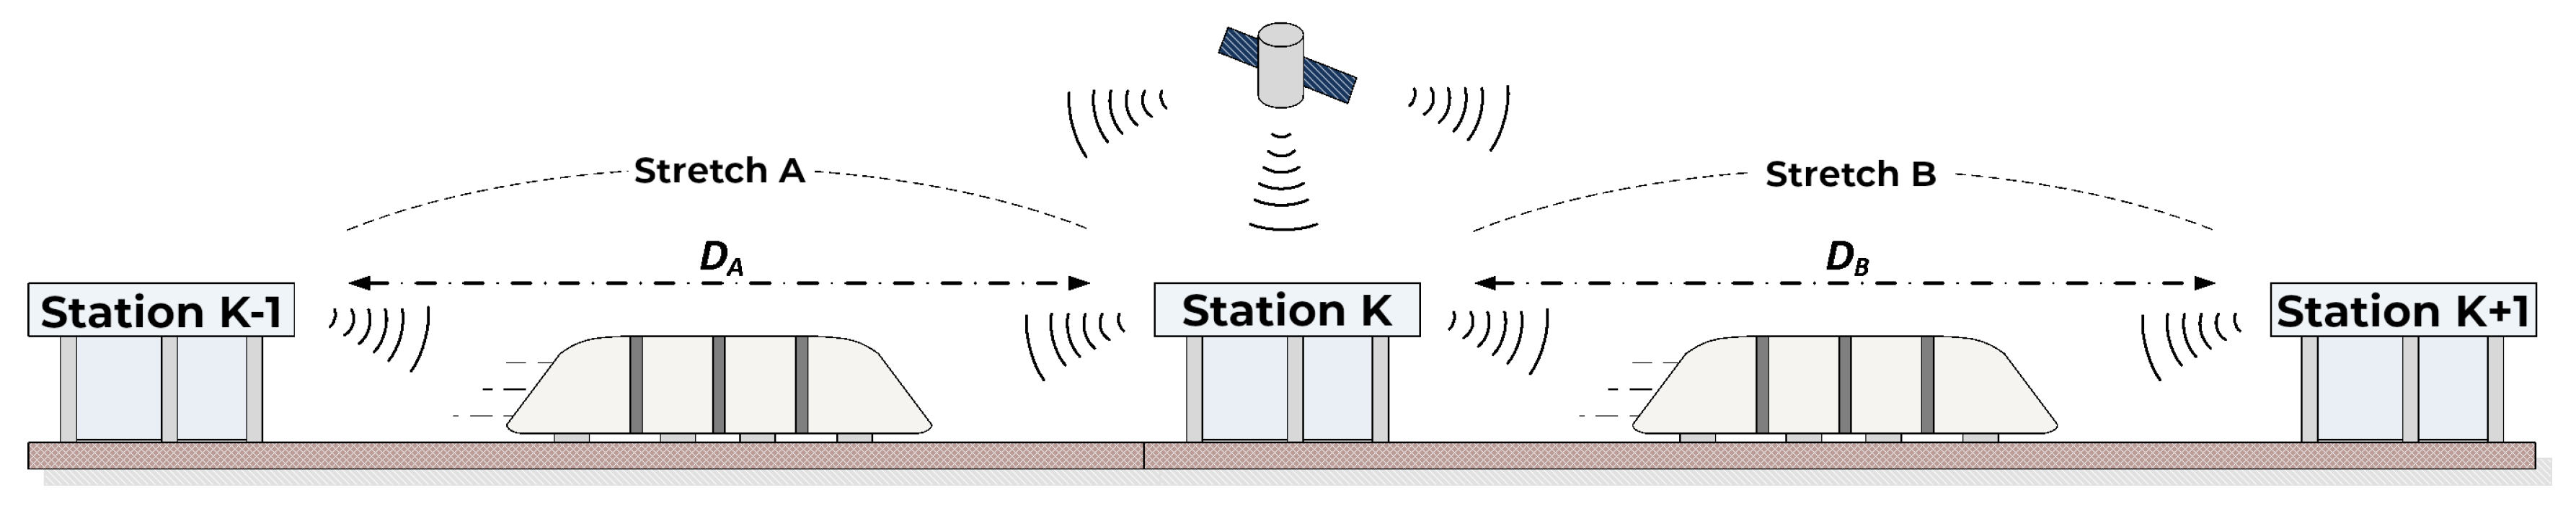
Figure 2 illustrates our application scenario. When it is determined that the train is between Stations K − 1 and K, the correction factors associated with , as well as the stations coordinates, are sent to the vehicle by Station K. As soon as the train crosses Station K, the vehicle starts to cooperate with the pair (Station K, Station K + 1), receiving the correction information from Station K + 1.
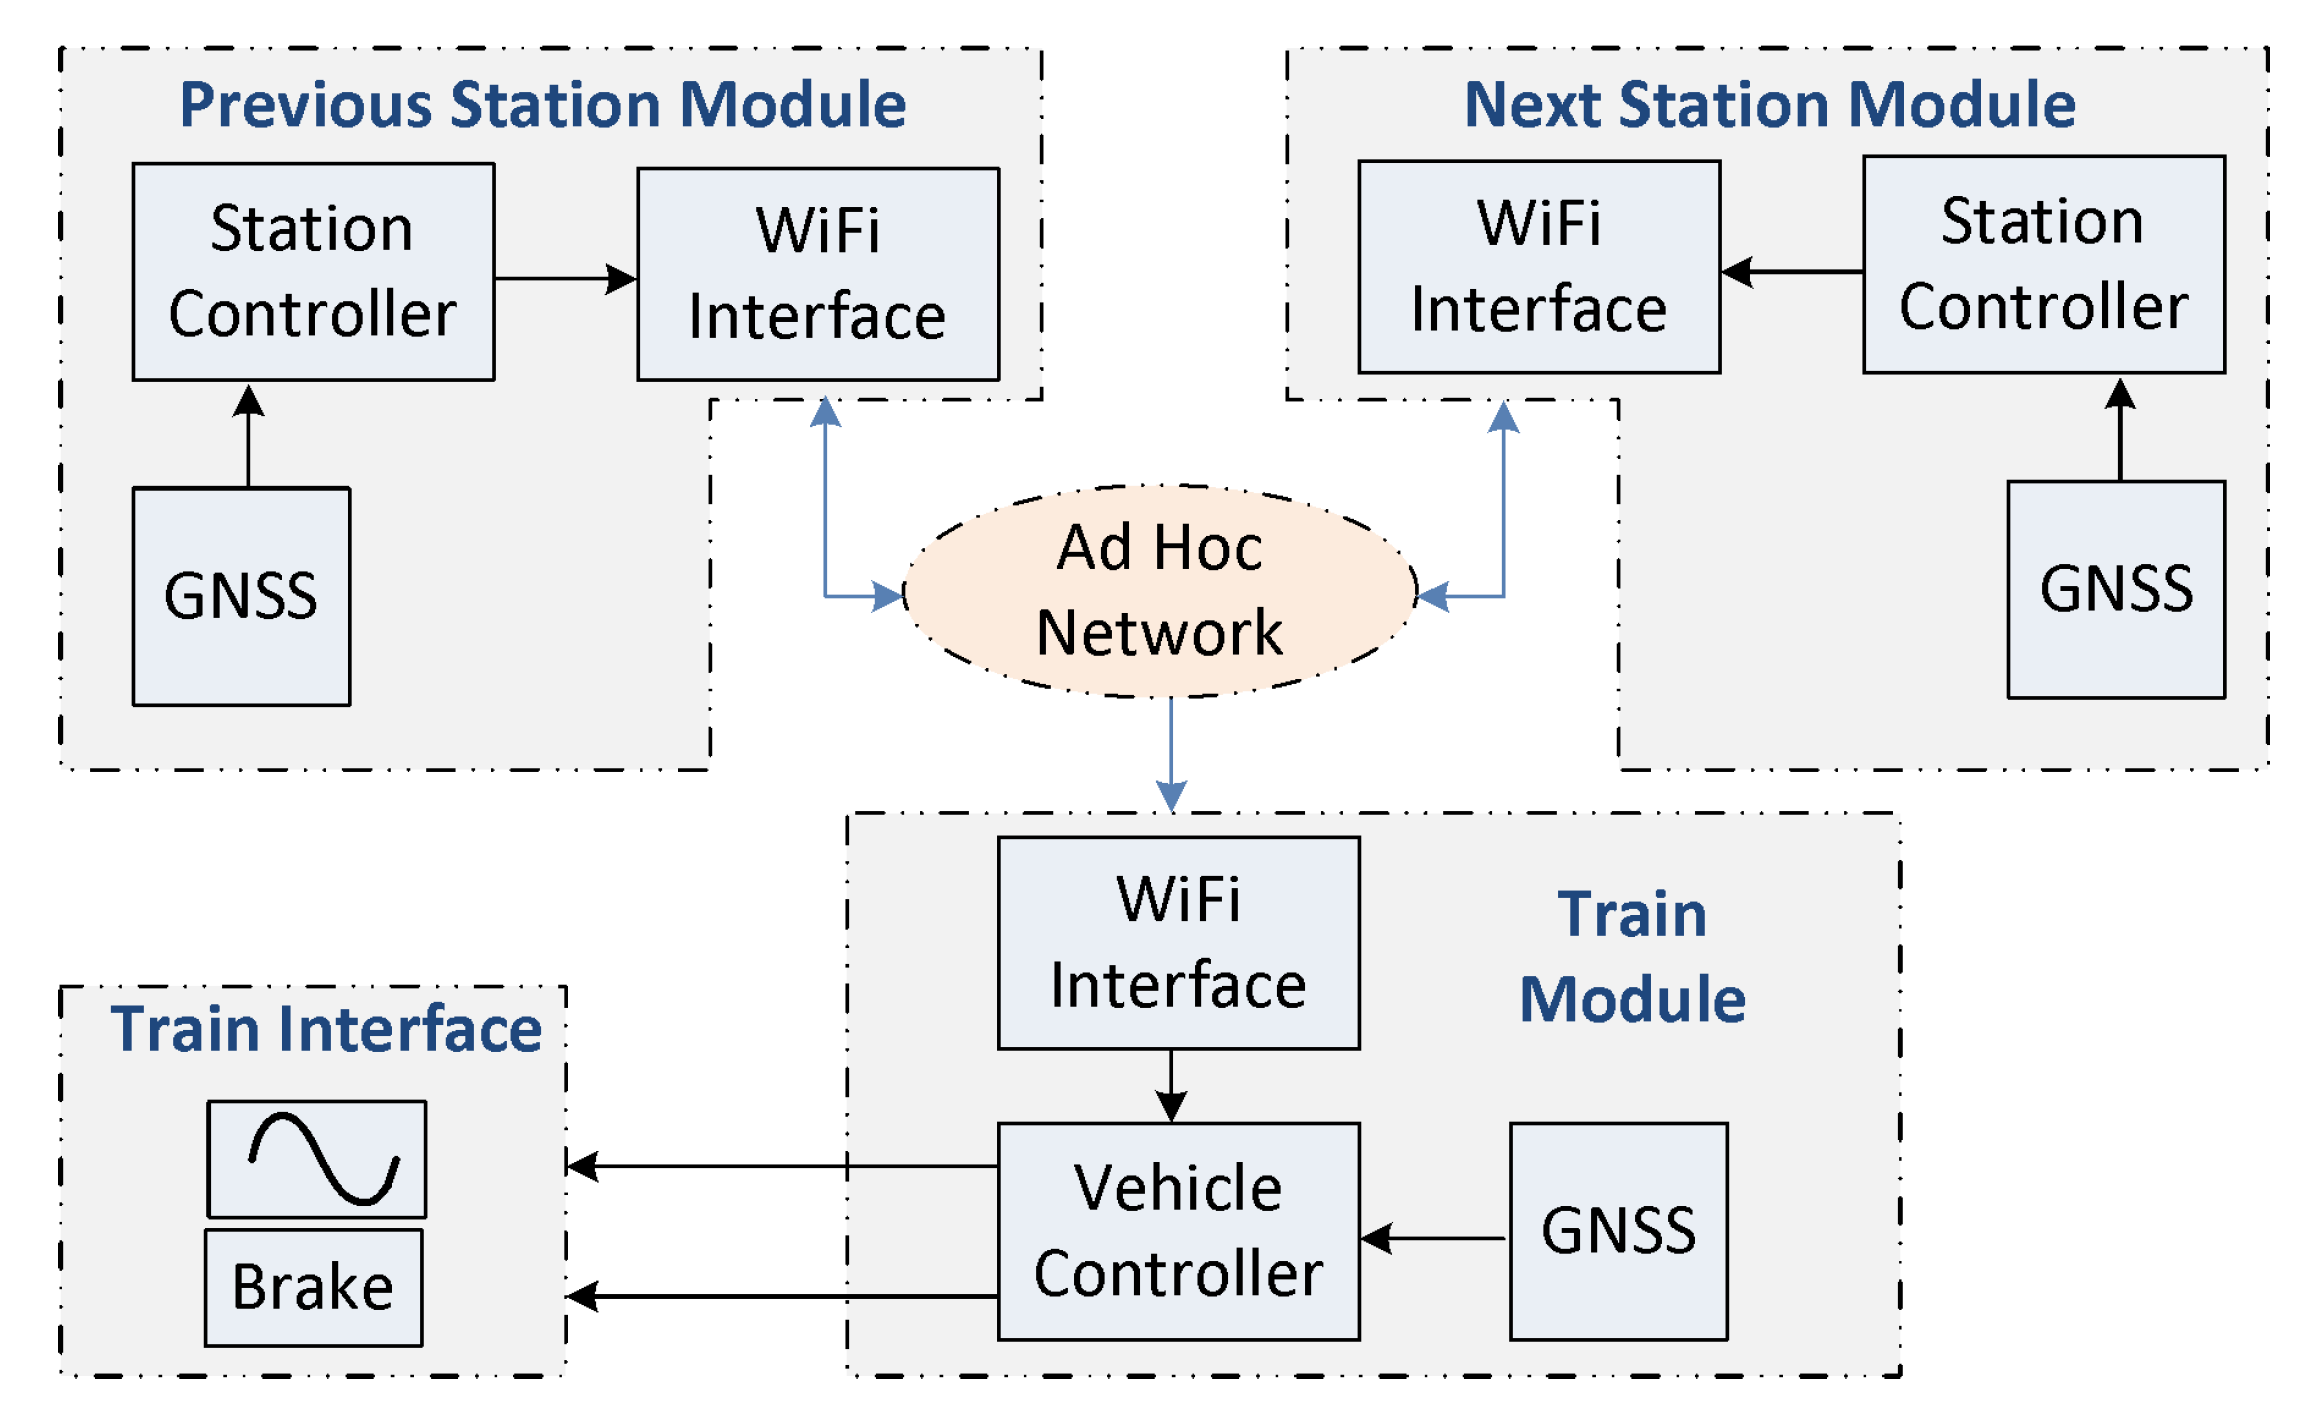
Figure 3 presents the components of each module, as well as the flow of information between their components, represented by directed arrows. The Previous Station and Next Station Modules exchange data between themselves, while the Train Module may receive data from both stations. When the safe braking distance is reached, the Vehicle Controller enables a control voltage to activate the brake control signal and plays a beep sound as a warning.
3.2. RASBS Positioning Design
GNSS are based on constellations of satellites that send their orbital positions to receivers on Earth, providing geographic position and high precision time. The position accuracy is variable, depending on weather conditions, visibility, and availability of the satellites, as well as on the reflection of signals. Currently, two navigation systems are operational: American GPS and Russian GLONASS. Although under control of their respective governments, both provide free of charge data with global coverage. The position can be determined by a single receiver (single point) or by two receivers working in differential mode (DGPS). The former mode, under ideal conditions, provides an accuracy around 5 m. The latter, with the support of a known geographic position from a ground station, can achieve millimeter precision [11].
For our implementation, the American GPS was chosen. However, the same approach could be employed with GLONASS. Therefore, the terms GPS and GNSS will henceforth be used interchangeably as synonyms.
The engineering team of MagLev-Cobra has defined an accuracy requirement lower than 1 m for the train positioning in the redundant braking system. The sub-meter accuracy is a major design challenge, considering the use of a single point GNSS as the distance information source to calculate the safe braking distance, given its standard accuracy of around 5 m.
At each point, 10 samples were collected; their means are plotted on Figure 4a. The green line represents the correct distance to CT2 and the red points are the respective GPS measurements. We observe that all GPS measures are under the green line, signaling a uniform error behavior, confirmed by Figure 4b. Using trial and error, small increments were equally added to the longitude and latitude until the Root Mean Square Error (RMSE) of the samples reached the minimum value. The correspondent increment, named , was applied to all measures, resulting in the corrected positions in Figure 4c. This demonstrates a significant error reduction, as plotted in Figure 4d.
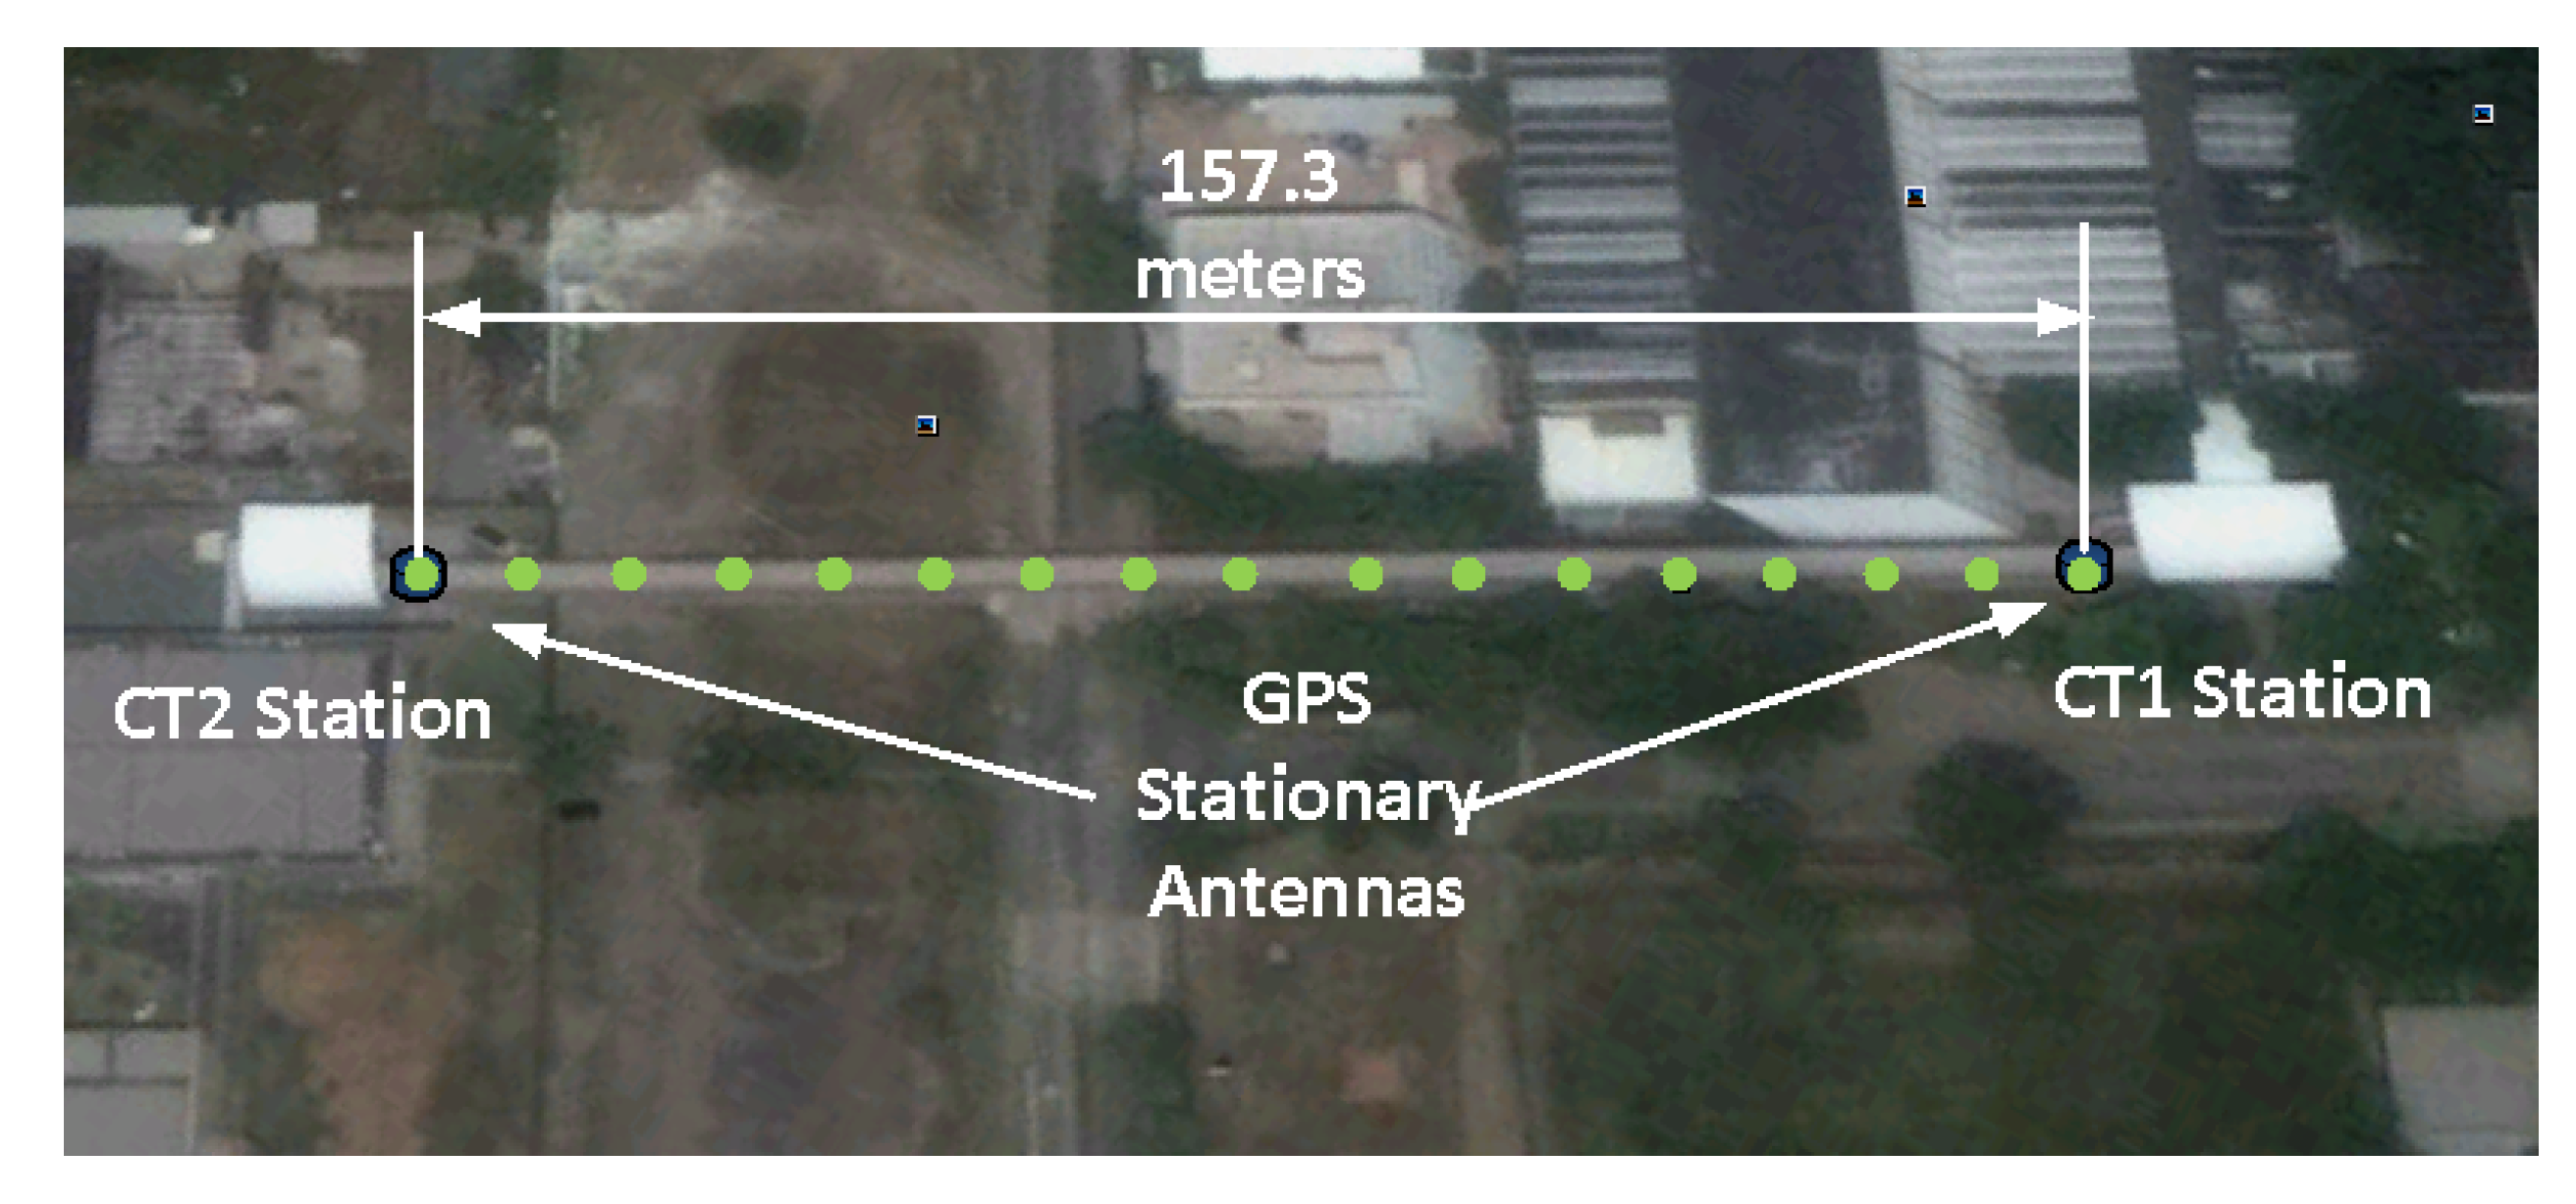
After acquiring the exact MagLev-Cobra railway track dimensions (Figure 5), two GNSS devices were installed at each train station (stations are named CT1 and CT2) and a series of static GPS distance measurements was carried out, beginning at the CT2 station. Reference measures were made every 10 m, using a measuring tape (Figure 5). The primary goal of this experiment was to measure the real distances between CT1 and CT2 and between CT2 and every track point. The Haversine formula [12] was employed to calculate the distance between CT2 Station and every track point.
3.3. Determination
As observed in the previous section, adding the value to a GPS measurement yields measures closer to the real position. Therefore, to automate its computation and guarantee the Root Mean Square Error (RMSE) convergence to a minimum value, a local search algorithm has been employed. For that, a search interval must be fixed. Nevertheless, if the search interval is too large, a major computational effort will be required. An alternative is to use the maximum distance error of each sample group as a first choice. For example, using the data of Figure 4, the maximum error is 6.13 m (Figure 4b), corresponding to degrees, which is the boundary of the interval. Therefore, the determination routine must execute a loop in the interval to degrees with steps of degrees, equivalent to 15 cm steps. At each iteration, GPS coordinates are incremented by the present loop value, computing the RMSE for all samples. The adjustment related to the smaller RMSE produces . To minimize the computational effort, the interval is calculated by multiplying the greatest sample error () by a factor proportional to GPS precision named Horizontal Dilution Of Precision (HDOP), provided by the GPS receiver and given by:
where and are normalized standard deviations of the horizontal coordinates X and Y [13]. Considering that a smaller HDOP results in a smaller coordinate position error, the search interval is .
3.4. Hardware Description
RASBS modules installed in MagLev-Cobra have their own GNSS receivers to provide time and location data used to perform a cooperative precision positioning system, managed by the controllers described later. The hardware devices that integrate the RASBS modules are shown in Table 1. The U-Blox EVK-7P kit, installed in the previous and next stations, operates in single-point mode with a 1 Hz update rate, while the GNSS receiver installed in the vehicle also operates in single-point mode, but with a 4 Hz update rate. The wireless interface is compliant with the IEEE 802.11n standard and runs in ad hoc mode, transmitting at 20 dBm. All controllers employ the Raspbian v7 operating system. For pairs of stations that are more distant from each other than the ones considered here, it is necessary to evaluate the performance of the wireless interfaces, to verify whether they would suffice and whether any adjustment on their parameters would be necessary, such as the transmission power. Such evaluation would consider network performance metrics, such as latency, packet delivery rate, and packet inter-reception time.
4. RASBS Operation
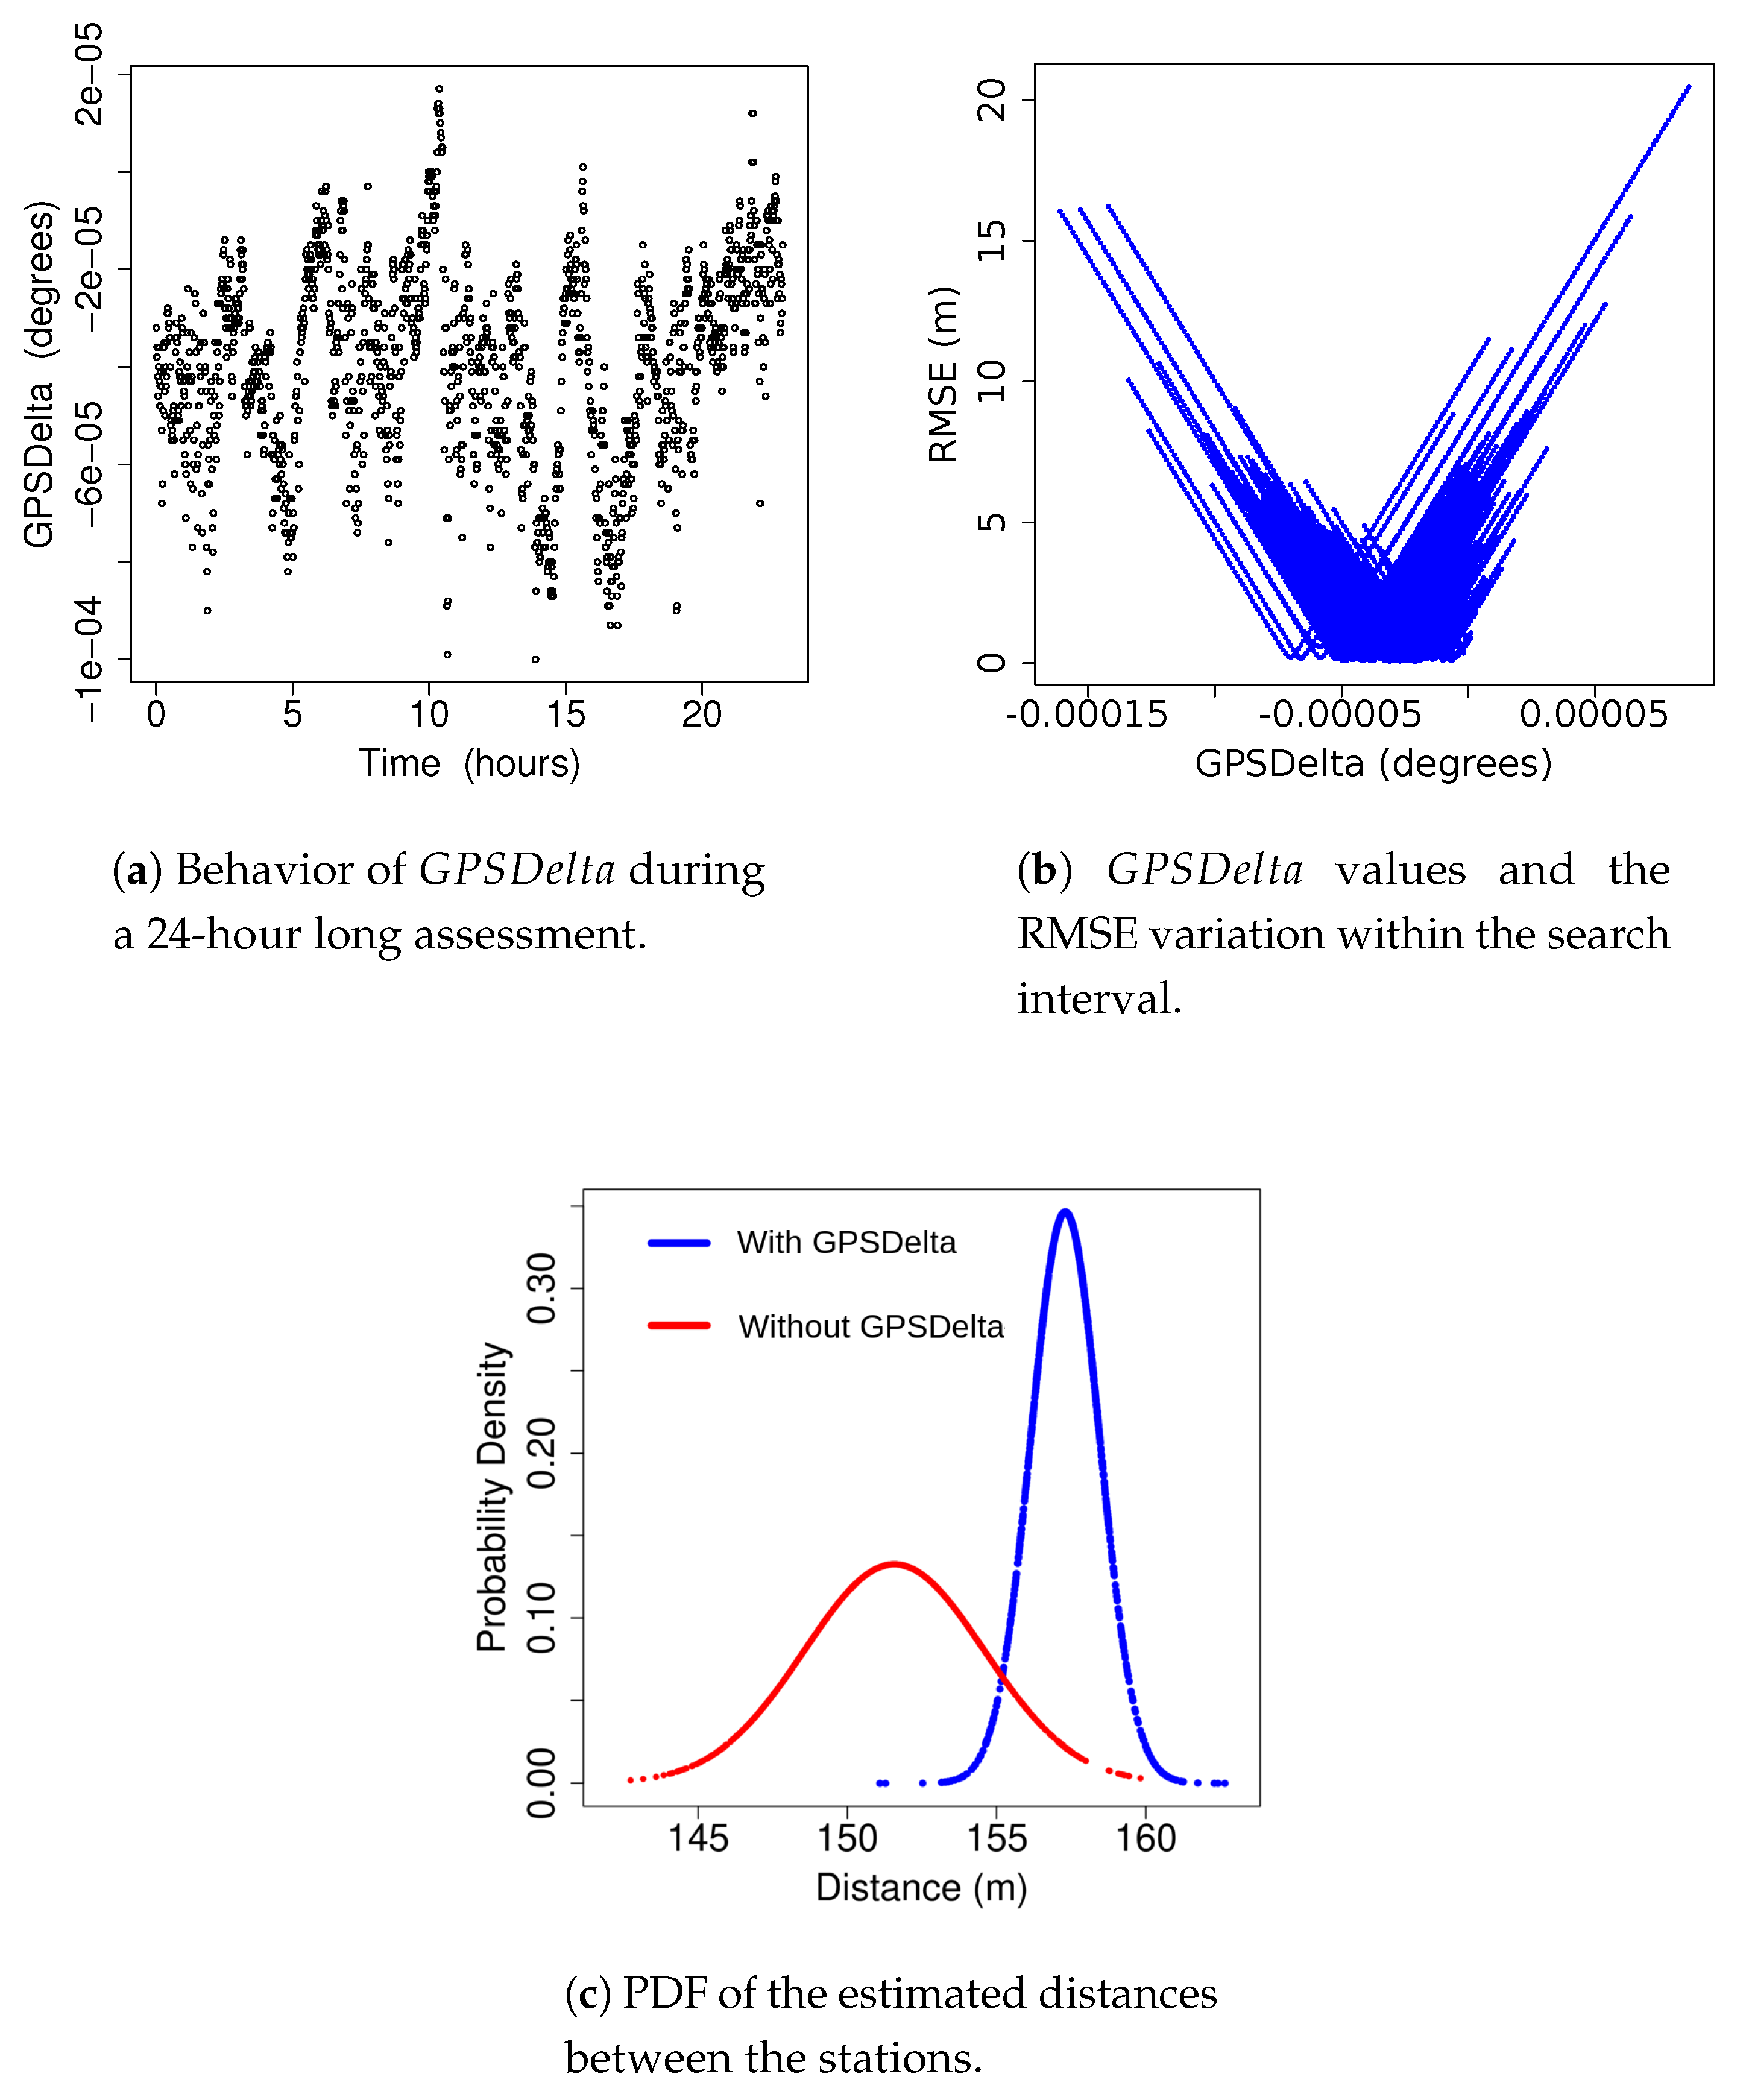
The controllers are the core of RASBS. They continuously exchange data to detect coordinate variations, which may happen due to changes of environmental conditions. The reason for installing one GPS device in each train station is justified by the fact that the estimated distances between CT1 and CT2, calculated by the GPS coordinates, vary significantly during a 24-h cycle. Figure 6a indicated that the variation during a day can be as high as degrees, which is equivalent to 18.9 m. Executing a periodic evaluation of the distance between stations guarantees the best values according to the up-to-date environment conditions. RASBS controllers exchange data through the wireless ad-hoc network presented in Figure 3. All transmissions are unicast.
To assess the RASBS performance in the real-life MagLev-Cobra experimental project, where only two stations exist, the following scenario was adopted: the module installed at the CT1 station only sends its coordinates to the module installed at the CT2 station, which executes Algorithm 1. The reason of this choice was to prove the RASBS performance with minimal resources.
4.1. CT1 Controller Description
The CT1 controller receives the NMEA raw sentences GPRMC (Recommended Minimum Specific GPS/TRANSIT Data) and GPGSA (GPS DOP and Active Satellites) [14] from the local GPS receiver at a 1 Hz update rate and converts the following data to float numbers:
- Latitude—latitude of CT1 station, in decimal degrees;
- Longitude—longitude of CT1 station, in decimal degrees;
- Time—UTC time provided by GPS satellite, given in the format HH:MM:SS;
- PDOP— Position Dilution Of Precision, provided by GPS receiver;
- HDOP—Horizontal Dilution Of Precision, provided by the GPS receiver.
After receiving valid data from the GPS receiver, the controller opens a socket connection with the CT2 station controller and sends all the fields received from the GPS, plus a message counter and a local epoch time, to keep track of the packet loss and the delay. This process is executed periodically, at a transmission rate of approximately one packet per 1.2 s.
4.2. CT2 Controller Description
The CT2 controller executes the basic positioning functions. It receives the same raw sentences of the CT1 controller from the local GPS receiver. After receiving a message with valid GPS data, the CT2 controller opens a socket to receive data from CT1 controller, which will be used to compute the distance between the two stations using Haversine formula and executing Algorithm 1. In short, the algorithm operates as follows. The CT2 controller receives GPS data from its receiver and from the CT1 controller, and calculates the distance between the stations based on these coordinates. At every 50 sets of locations and distances, the local search discussed on Section 3.3 is executed to find the GPSDelta which yields the minimal RMSE. This value is then sent to the Vehicle Module. This procedure repeats itself as long as the CT2 controller is operating.
| Algorithm 1:CT2 Module Procedure. |
 |
4.3. Vehicle Controller Description
The main function of RASBS is performed by the Vehicle Controller (Figure 3), executing Algorithm 2. While the vehicle is at the station, it receives data from the CT2 controller, which announces both stations coordinates and . The procedure executes in a loop until the speed exceeds a threshold (set to 1.5 m/s). Based on the updates of the distances to the stations, the controller determines the vehicle direction and starts a loop to compute the current distance to the source () and to the destination () stations, applying to perform corrections. The precision of the distance to the destination station after applying remains inside the confidence interval shown in Table 2, hence a second correction is made to increase the precision. Based on the assumption that + must be equal to 157.3 m, the distance to the next station () is given by:
where = 157.3 − ( + ).
The value of is computed and compared with the safe braking distance every 250 ms, the same frequency as the GPS update rate. The MagLev-Cobra experimental prototype has two different safe braking distances that depend on the vehicle direction. If the train moves towards CT1 station, the safe braking distance is 62 m; towards CT2 station, the distance is 18.5 m, because CT2 is more elevated than CT1. When reaches the safe braking distance, the Vehicle Controller emits a warning sound and activates the brake control signal. At low speeds, the 250 ms GPS update rate causes a small impact in the accuracy, but taking into account that MagLev-Cobra can develop speeds up to 70 km/h, the error introduced by the GPS update can reach 4.8 m. To compensate this effect, a dynamic error correction was implemented. The procedure, described in Algorithm 3, uses the actual vehicle speed data to detect when the time to reach the safe braking distance () is less than or equal to 250 ms, and applies a delay to anticipate the safe braking procedure, instead of waiting for the next distance evaluation.
| Algorithm 2:Vehicle Module Procedure. |
 |
| Algorithm 3:GPS update rate error correction. |
 |
5. Results
First, we assess the accuracy of the automatic calculation. Algorithm 1 was employed with , producing a reasonably small confidence interval. This process runs in an infinite loop with one iteration every 70 s, approximately. The algorithm was executed during 24 h. At each iteration, 50 new coordinates are processed and a new is calculated. Figure 6a indicates the determined values and Figure 6b indicates the RMSE variation. Each V-shaped dotted line corresponds to the RMSE variation during the search interval corresponding to 50 samples. Although the CT2 controller sends data at a rate of one packet every 1.5 s to the vehicle controller, the transmitted values remain unchanged until the next iteration. Figure 6c shows the Probability Density Function (PDF) of the estimated distance between stations CT1 and CT2 with and without the correction. Table 2 presents statistical data, including mean, standard deviation, and the 95% confidence interval of 1500 packets captured from the CT2 Controller to the Vehicle Controller. We can observe a shift of the CT1–CT2 mean distance to the real distance value (157.3 m) and a significant reduction in the standard deviation when is applied. Confidence intervals were calculated under Student’s t probability distribution area [15].
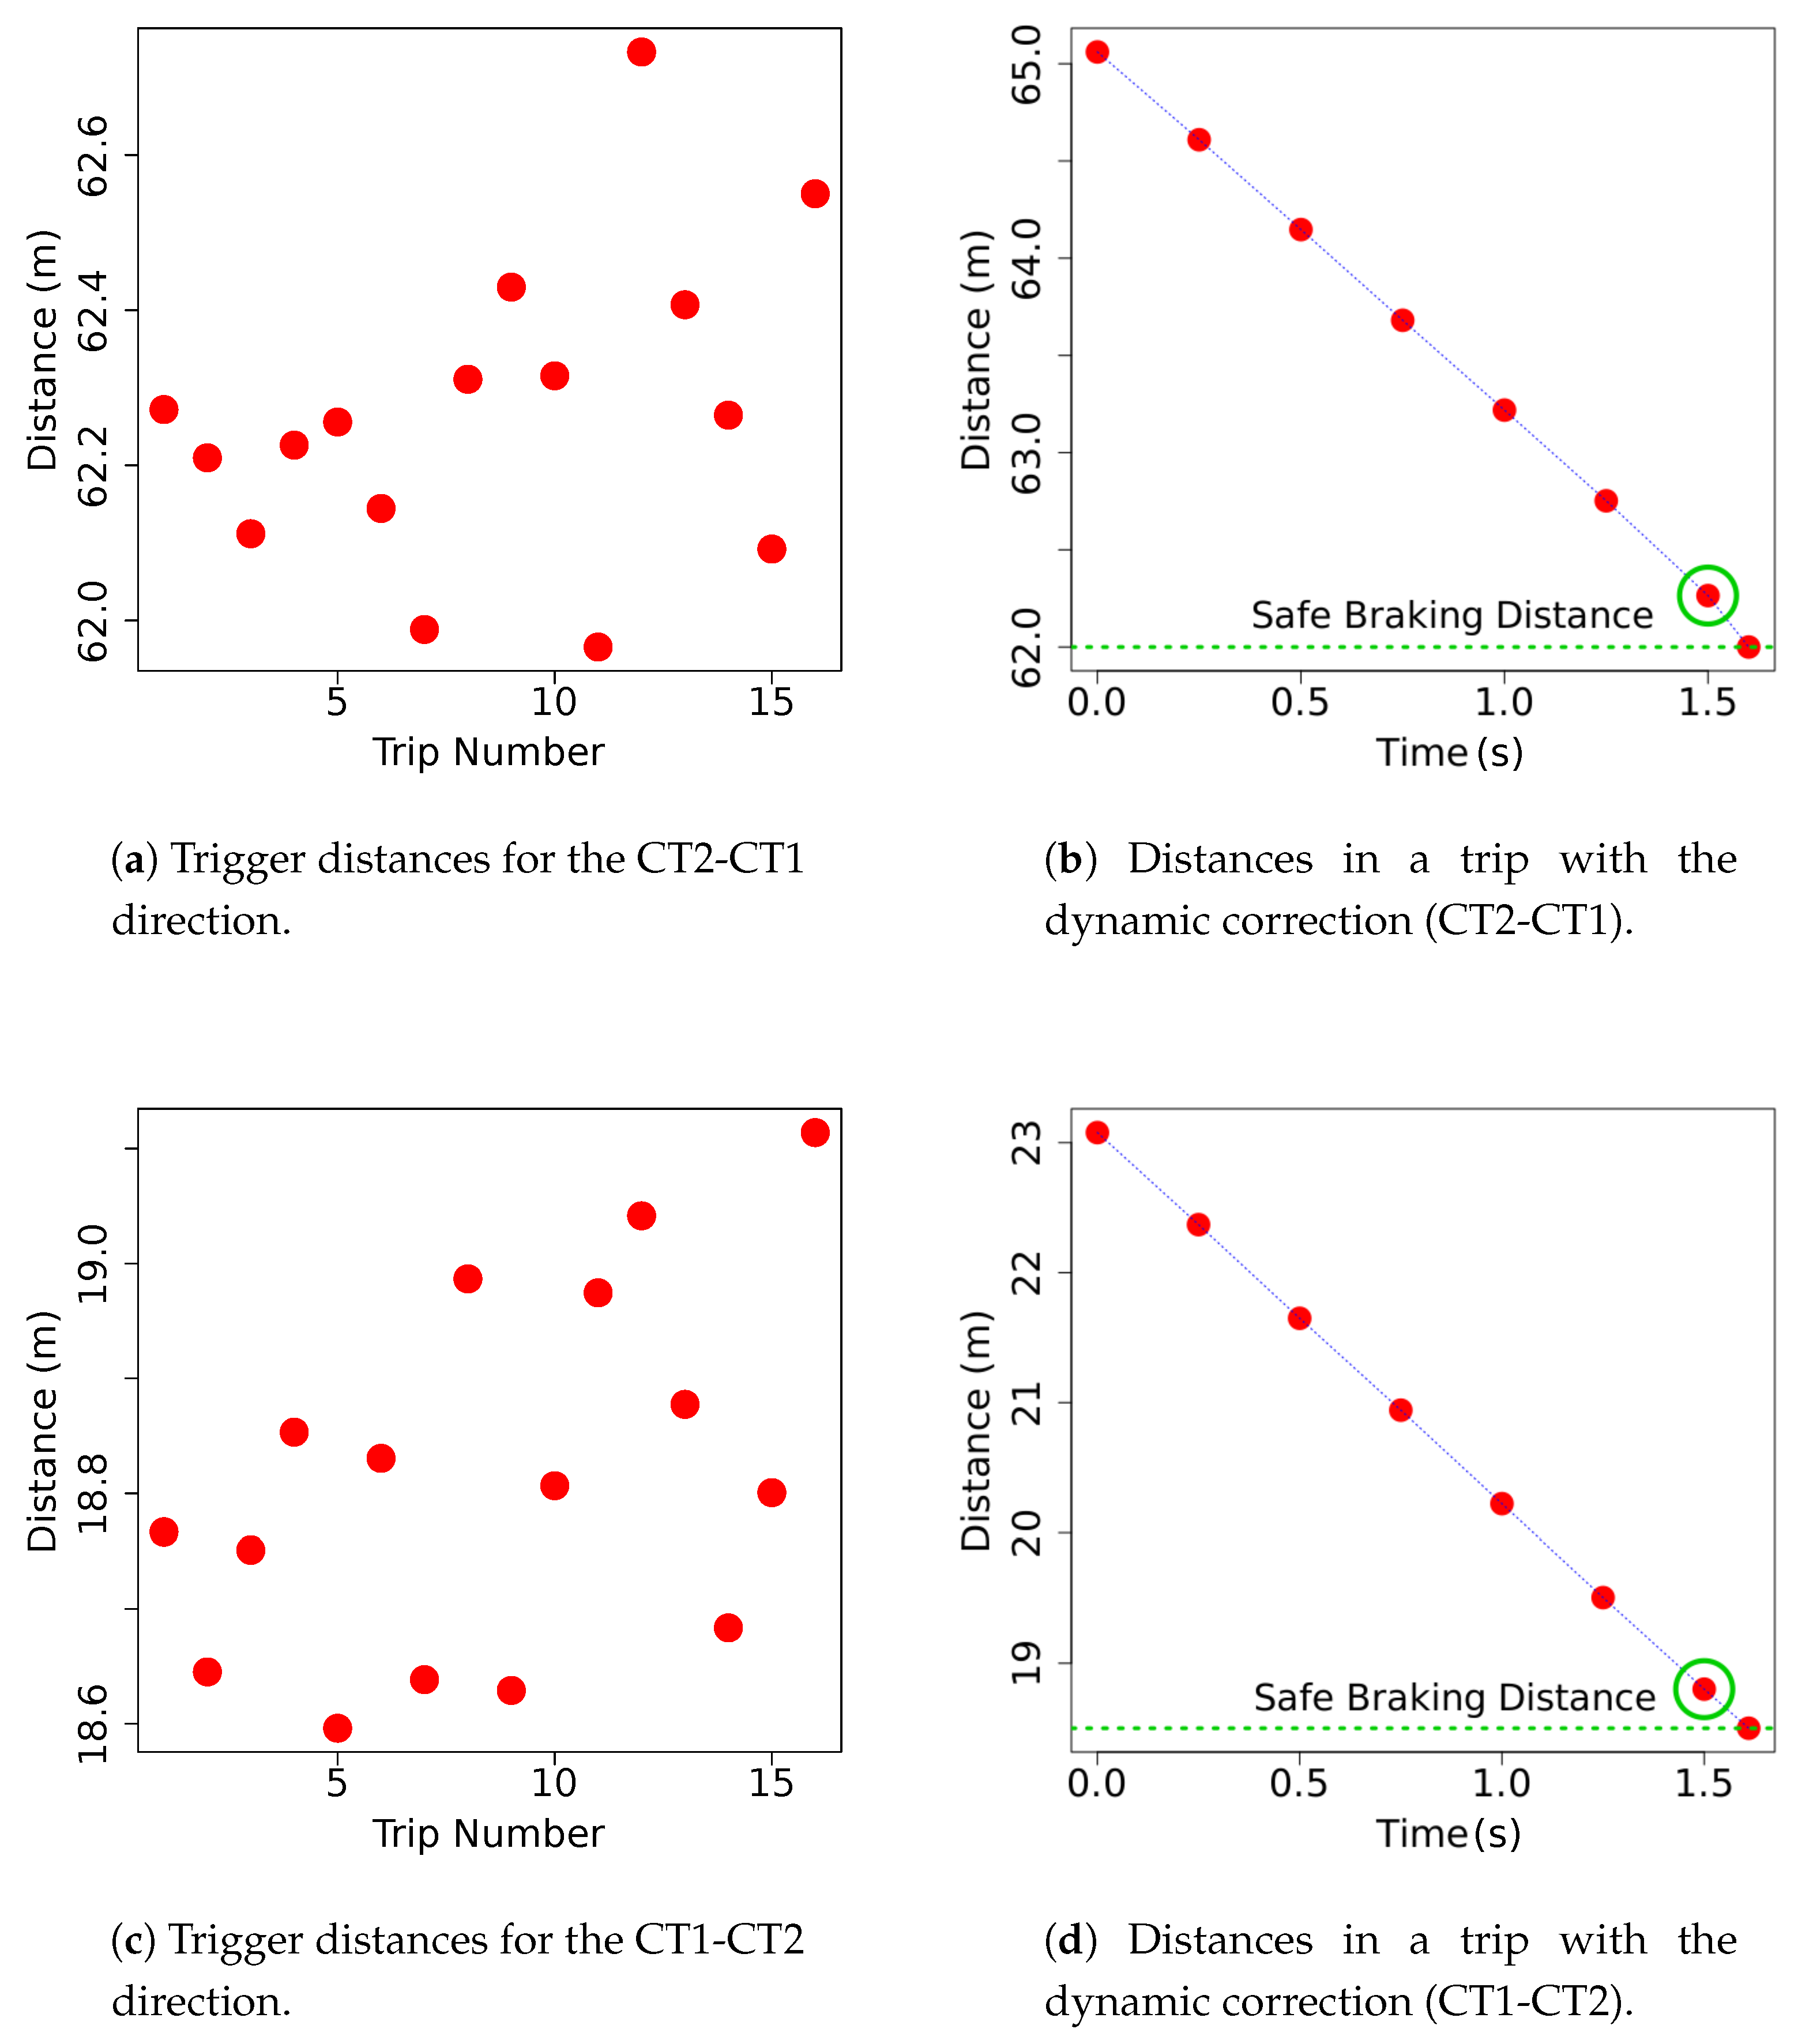
Afterwards, in a different day, the performance of the full system was evaluated by experiments carried out through sixteen round-trips in the MagLev-Cobra train. Figure 7a shows, for a set of trips from CT2 to CT1, the distance measured between the vehicle and the CT1 station at the moment when the safe braking mechanism was activated. The Vehicle Controller, then, triggers the GPS update rate error correction procedure, starting the delay. We can observe that trips 7 and 11 did not receive update rate error corrections due to the fact that and values were very close, resulting on 0.01 and 0.02 m errors, respectively. Figure 7b shows the last seconds before the start of the braking sequence, in one trip. The distance evaluation events, which occur every 250 ms (the GPS receiver update rate), are represented by red points, and the green circle indicates the triggering of the error correction procedure. The distance evaluations of all trips converge to the real value, 62 m, save for trips 7 and 11. Figure 7c,d show the same behavior for trips in the opposite direction (from CT1 to CT2). Here, the update rate error correction procedure actuated in every trip. The distance evaluation converges to the real value, 18.5 m for all trips. Table 3 shows statistical data related to Figure 7a,c, demonstrating a good reliability, since the standard deviation and confidence interval values are below 1 m in both directions, achieving our design requirement. Here confidence intervals were also calculated under Student’s t probability distribution area [15].
6. Conclusions
This work presented the Redundant Autonomous Safe Braking System (RASBS), a novel cooperative GNSS-based positioning algorithm designed for magnetic levitation trains. It relies on the cooperation of controllers equipped with GNSS receivers and wireless communication interfaces, being one controller installed in the vehicle and all the others in train stations. The cooperation always occurs between the vehicle controller and the controllers of the two stations between which the vehicle is moving, via an ad hoc network. By using the distance between them, a known value, as a reference, the , a correction factor used to adjust the latitude and longitude values, is calculated. Furthermore, the vehicle controller executes a dynamic correction procedure, ACORE, to compensate the GPS update rate. Experiments were conducted in the MagLev-Cobra vehicle, located at the campus of the Federal University of Rio de Janeiro (UFRJ), in Brazil. The obtained results have shown that the sub-meter specification objective was achieved. Moreover, we have demonstrated that the system can be deployed in a multiple-station scenario with low hardware and deployment costs. In future works, we aim to investigate a noise rejection procedure based on Kalman filters to further improve the system reliability. In addition, we plan to integrate our system with a dead reckoning approach. This will protect the system against signal losses and would make it more suitable for trains, which have short covered stretches in their trajectories, such as tunnels.
Author Contributions
Conceptualization, Data curation, Formal analysis, Investigation, Methodology, Resources, Software, Supervision, Validation, Visualization, Writing—original draft, Writing—review & editing, J.B.P.N.; Data curation, Formal analysis, Software, Visualization, Writing—original draft, Writing—review & editing, L.d.C.G.; Conceptualization, Funding acquisition, Methodology, Supervision, Writing—original draft, Writing—review & editing, M.E.M.C.; Conceptualization, Funding acquisition, Methodology, Supervision, Writing—original draft, Writing—review & editing, L.H.M.K.C. All authors have read and agreed to the published version of the manuscript.
Funding
This study was financed in part by the Coordenação de Aperfeiçoamento de Pessoal de Nível Superior—Brasil (CAPES)—Finance Code 001. It was also supported by CNPq, FAPERJ, FAPERO, and FAPESP Grants 15/24494-8 and 15/24490-2.
Acknowledgments
We would like to thank the Applied Superconductivity Laboratory Team for the cooperation on the MagLev-Cobra project. A special thanks to Eduardo M. Castanho for his contribution to the prototype implementation.
Conflicts of Interest
The authors declare no conflict of interest.
References
- Shladover, S.E. Connected and automated vehicle systems: Introduction and overview. J. Intell. Transp. Syst. 2018, 22, 190–200. [Google Scholar] [CrossRef]
- Shafiq, Z.; Khan, L.U.; Mahmud, S.A.; Khan, G.M. Context-Aware Cooperative Collision Avoidance Vehicle Braking Alert System for VANET. In Proceedings of the 3rd International Conference on Context-Aware Systems and Applications, Dubai, UAE, 15–16 October 2014; pp. 92–96. [Google Scholar]
- Lin, C.F.; Juang, J.C.; Li, K.R. Active collision avoidance system for steering control of autonomous vehicles. IET Intell. Transp. Syst. 2014, 8, 550–557. [Google Scholar] [CrossRef]
- Summerfield, C.; Greig, D. Precise positioning services in the rail sector. In Technical Report, Department of Innovation, Industry, Climate Change Science, Research and Tertiary Education; ACIL Allen Consulting: Melbourne, Australia, 2013. [Google Scholar]
- Kim, K.; Seol, S.; Kong, S.H. High-speed train navigation system based on multi-sensor data fusion and map matching algorithm. Int. J. Control Autom. Syst. 2015, 13, 503–512. [Google Scholar] [CrossRef]
- Sotelo, G.G.; de Andrade, R.; Dias, D.H.N.; Ferreira, A.C.; Costa, F.; Machado, O.J.; de Oliveira, R.A.H.; Santos, M.D.A.; Stephan, R.M. Tests With One Module of the Brazilian Maglev-Cobra Vehicle. IEEE Trans. Appl. Supercond. 2013, 23, 3601204. [Google Scholar] [CrossRef]
- de Oliveira, R.A.H.; Berger, D.; Schultz, L.; Stephan, R.M.; Ferreira, A.C. Finite element analysis of the forces developed on linear induction motors. In Proceedings of the IEEE 13th Brazilian Power Electronics Conference and 1st Southern Power Electronics Conference (COBEP/SPEC), Fortaleza, Brazil, 29 November–2 December 2015; pp. 1–6. [Google Scholar] [CrossRef]
- Yamamoto, H.; Sasaki, T.; Sugahara, H. Application of GPS to Train Control Systems for Secondary Lines. Q. Rep. RTRI 2010, 51, 196–204. [Google Scholar] [CrossRef]
- Liu, J.; Tang, T.; Gai, B.; Wang, J.; Chen, D. Integrity assurance of GNSS-based train integrated positioning system. Sci. China Technol. Sci. 2011, 54, 1779–1792. [Google Scholar] [CrossRef]
- Roth, J.; Schaich, T.; Trommer, G.F. Cooperative GNSS-based method for vehicle positioning. Gyroscopy Navig. 2012, 3, 245–254. [Google Scholar] [CrossRef]
- Williams, T.; Alves, P.; Lachapelle, G.; Basnayake, C. Evaluation of GPS-based methods of relative positioning for automotive safety applications. Transp. Res. Part C Emerg. Technol. 2012, 23, 98–108. [Google Scholar] [CrossRef]
- Ivis, F. Calculating Geographic Distance: Concepts and Methods. Available online: https://www.lexjansen.com/nesug/nesug06/dm/da15.pdf (accessed on 15 November 2020).
- Bensky, A. Wireless Positioning Technologies and Applications; Artech House, Inc.: Norwood, MA, USA, 2007. [Google Scholar]
- SiRF Technology, Inc. NMEA Reference Manual. Available online: http://www.sirf.com (accessed on 3 November 2019).
- Trivedi, K. Probability and Statistics with Reliability, Queuing, and Computer Science Applications, 2nd ed.; Wiley: Hoboken, NJ, USA, 2001. [Google Scholar]
Figure 1.
MagLev-Cobra prototype (Source: [7]).
Figure 1.
MagLev-Cobra prototype (Source: [7]).
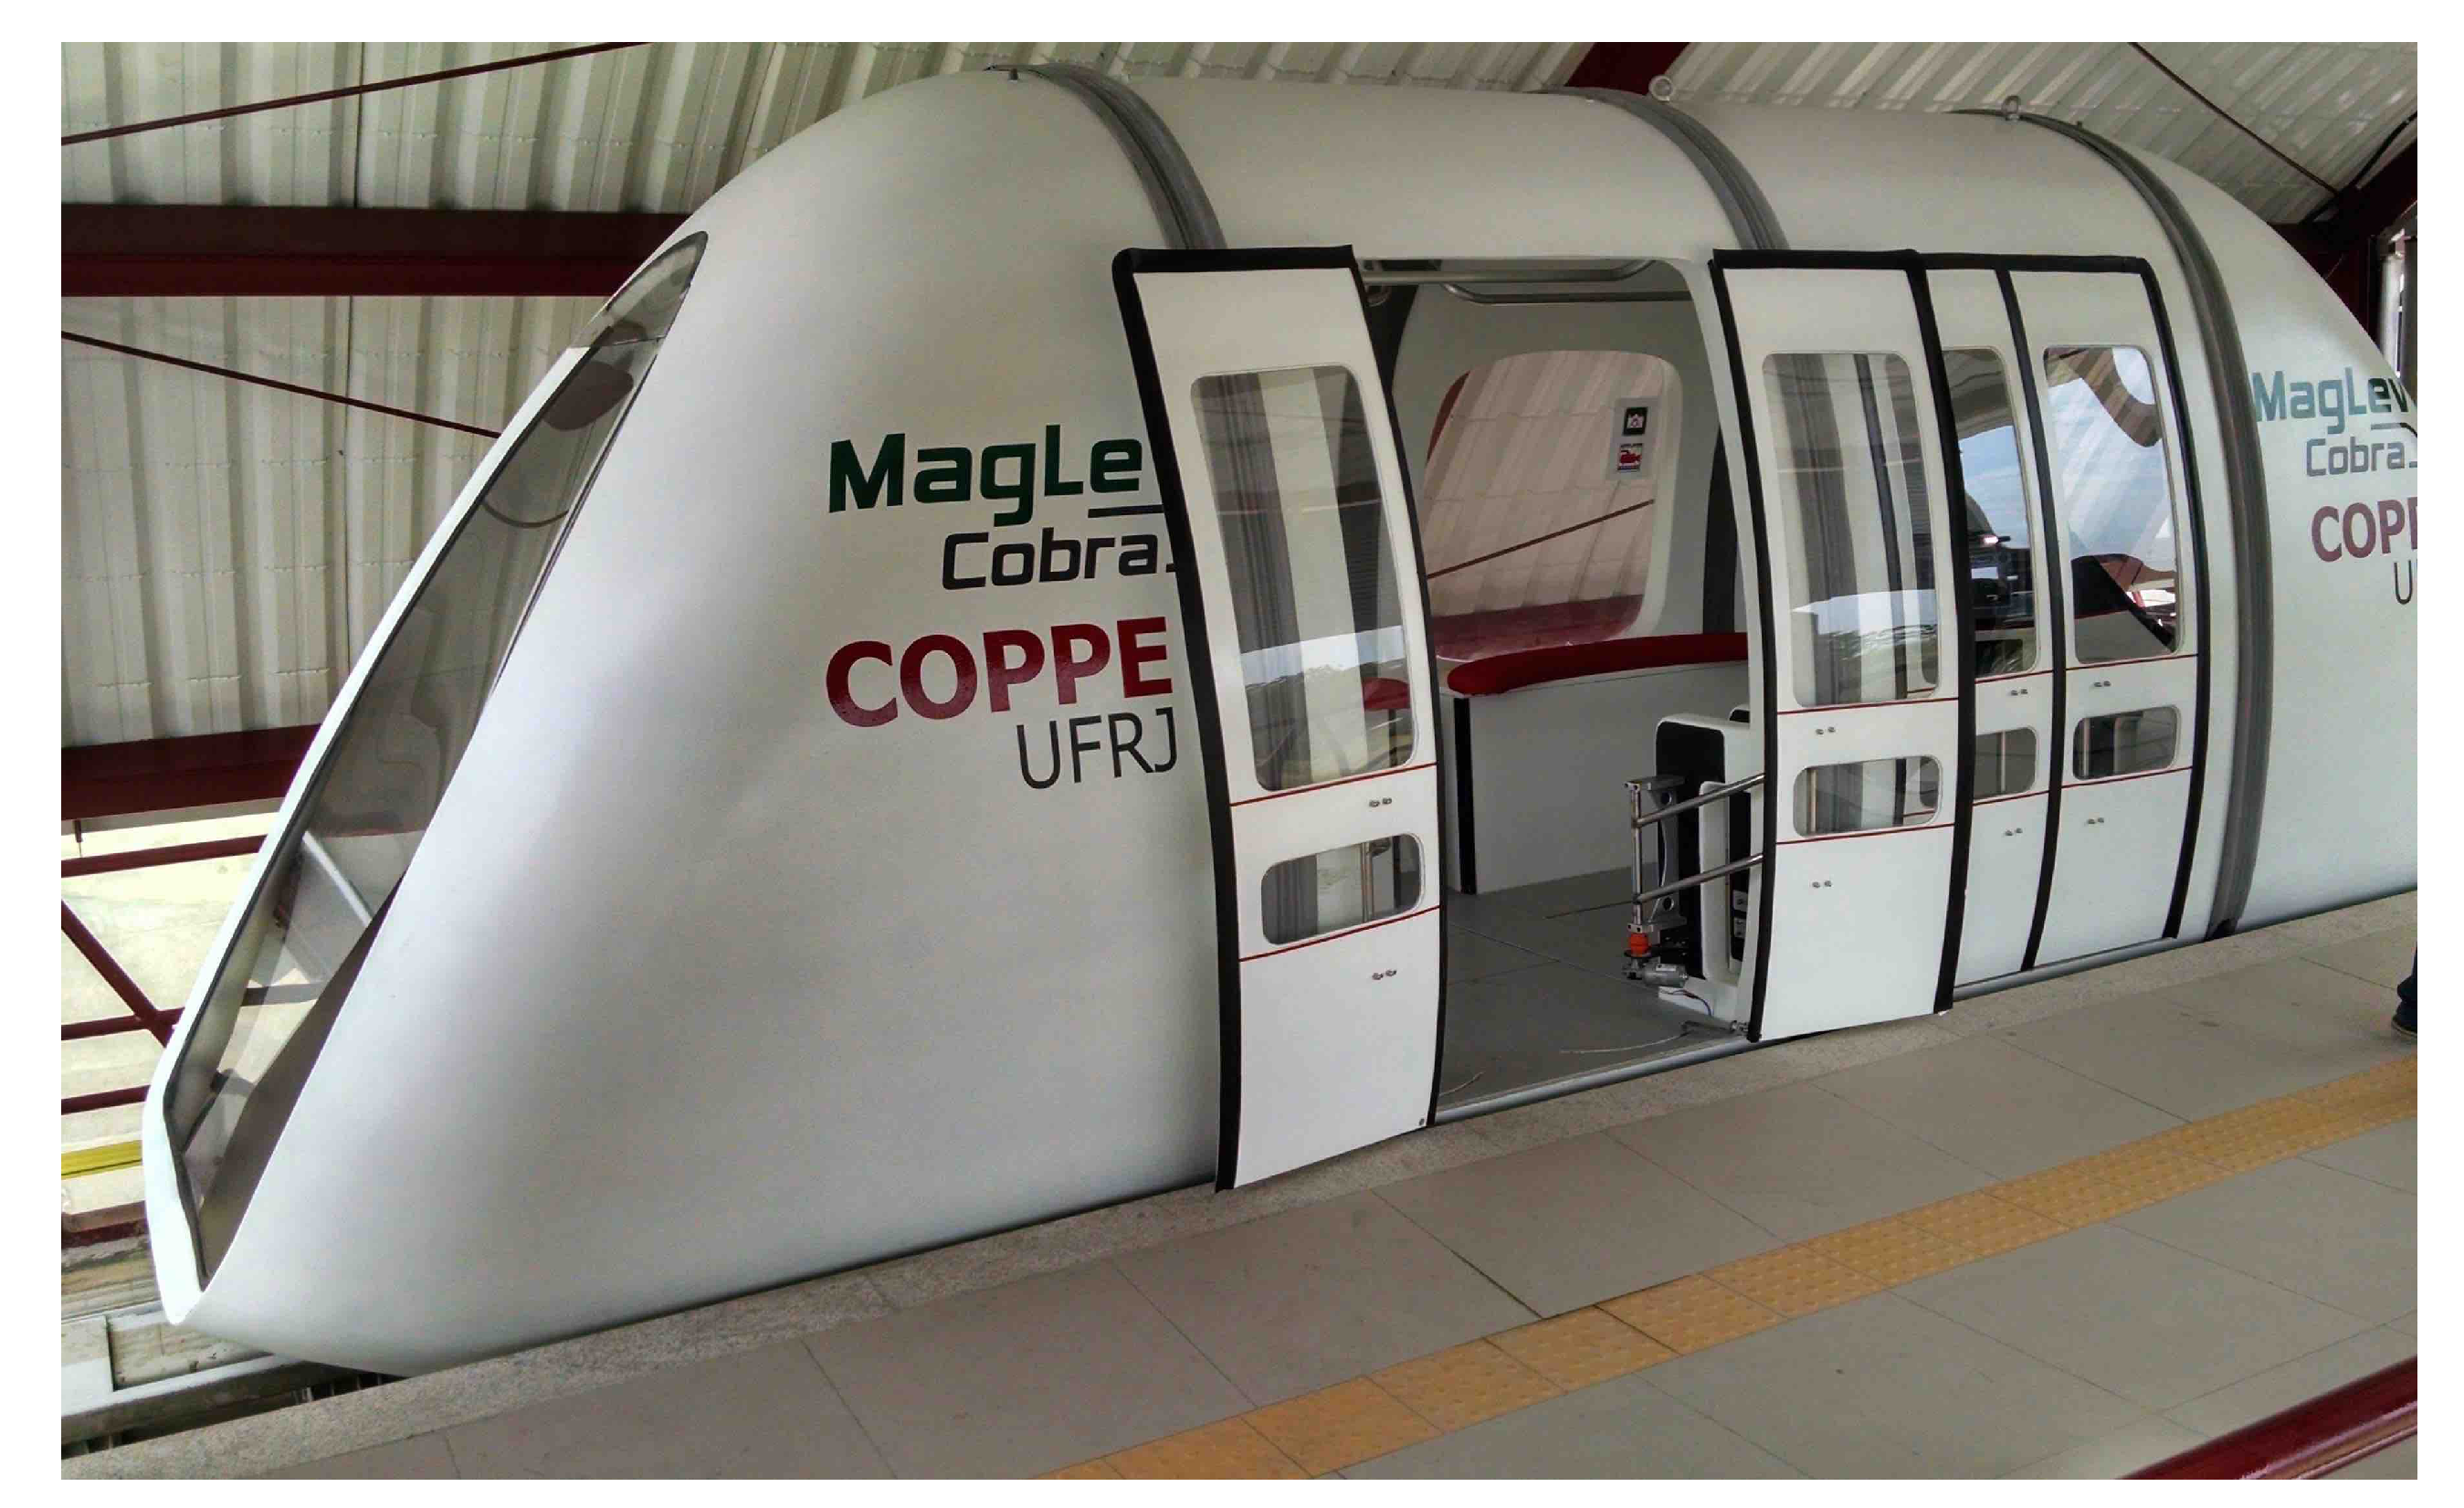
Figure 2.
Application scenario.

Figure 3.
Architecture of RASBS.

Figure 4.
GPS static measures versus real distances along MagLev-Cobra railway track.

Figure 5.
Experimental MagLev-Cobra railway track.

Figure 6.
RASBS performance evaluation metrics.

Figure 7.
RASBS safe distance detection performance.


Table 1.
RASBS hardware description.
| Device | Description |
|---|---|
| GNSS Receiver | U-Blox EVK-7P kit |
| WiFi Interface | TP-LINK TL-WN722N |
| Controllers | Raspberry Pi Model B+ v1.2 |
Table 2.
performance comparison (m).
| Distance CT1–CT2 | Mean | SD | 95% C.I. |
|---|---|---|---|
| Without GPSDelta | 151.13 | 3.15 | 6.18 |
| With GPSDelta | 157.31 | 1.24 | 2.43 |
Table 3.
Vehicle Controller performance (m).
| Direction | Mean | SD | 99% C.I. |
|---|---|---|---|
| CT1 to CT2 | 18.81 | 0.16 | 0.47 |
| CT2 to CT1 | 62.26 | 0.19 | 0.55 |
Publisher’s Note: MDPI stays neutral with regard to jurisdictional claims in published maps and institutional affiliations. |
© 2020 by the authors. Licensee MDPI, Basel, Switzerland. This article is an open access article distributed under the terms and conditions of the Creative Commons Attribution (CC BY) license (http://creativecommons.org/licenses/by/4.0/).
Share and Cite
MDPI and ACS Style
Neto, J.B.P.; Gomes, L.d.C.; Campista, M.E.M.; Costa, L.H.M.K. An Accurate GNSS-Based Redundant Safe Braking System for Urban Elevated Rail Maglev Trains. Information 2020, 11, 531. https://doi.org/10.3390/info11110531
AMA Style
Neto JBP, Gomes LdC, Campista MEM, Costa LHMK. An Accurate GNSS-Based Redundant Safe Braking System for Urban Elevated Rail Maglev Trains. Information. 2020; 11(11):531. https://doi.org/10.3390/info11110531
Chicago/Turabian StyleNeto, João Batista Pinto, Lucas de Carvalho Gomes, Miguel Elias Mitre Campista, and Luís Henrique Maciel Kosmalski Costa. 2020. "An Accurate GNSS-Based Redundant Safe Braking System for Urban Elevated Rail Maglev Trains" Information 11, no. 11: 531. https://doi.org/10.3390/info11110531
Note that from the first issue of 2016, this journal uses article numbers instead of page numbers. See further details here.