Abstract
This paper explores the usability of the Dice CAPTCHA via analysis of the time spent to solve the CAPTCHA, and number of tries for solving the CAPTCHA. The experiment was conducted on a set of 197 subjects who use the Internet, and are discriminated by age, daily Internet usage in hours, Internet experience in years, and type of device where a solution to the CAPTCHA is found. Each user was asked to find a solution to the Dice CAPTCHA on a tablet or laptop, and the time to successfully find a solution to the CAPTCHA for a given number of attempts was registered. Analysis was performed on the collected data via association rule mining and artificial neural network. It revealed that the time to find a solution in a given number of attempts of the CAPTCHA depended on different combinations of values of user’s features, as well as the most meaningful features influencing the solution time. In addition, this dependence was explored through prediction of the CAPTCHA solution time from the user’s features via artificial neural network. The obtained results are very helpful to analyze the combination of features having an influence on the CAPTCHA solution, and consequently, to find the CAPTCHA mostly complying to the postulate of “ideal” test.
1. Introduction
A program-based puzzle for which a solution can be easily found by human subjects, and at the same time, hardly found by machines, is known as CAPTCHA test. The goal of the CAPTCHA is the same as in the standard Turing test—to test if the computer can simulate the human behavior. A human subject and the computer in the Turing test have to answer a set of questions. The human judge evaluates the obtained answers. If the machine can answer the questions in the same way as a human, then it is said that the machine has intelligence. In the CAPTCHA test, the evaluator of the answers is not a human, but a machine (computer). That is the reason the CAPTCHA is sometimes called a reverse Turing test.
The bots are computer programs which simulate the human behavior. There are many different algorithms which can be incorporated into the bots [1], such as speech recognition algorithms, Optical Character Recognition (OCR) algorithms, etc. There are many types of CAPTCHA, but many of them are not in use because of a poor security level in the practical use, due to attacks made by bots.
A successful CAPTCHA must operate in the area where the human ability is stronger than the computers, such as: (i) image analysis; (ii) video processing; and (iii) puzzle solving. The most promising ones are CAPTCHAs which are based on a puzzle. Although real puzzles are based on recognizing images, the puzzle-based CAPTCHA does not include image elements. This CAPTCHA needs a longer time to be solved and it has no easy solution for the users. On the other side, finding the solution for this CAPTCHA with the bots is almost impossible.
Finding the most influencing factors on the CAPTCHA solution is very useful. Accordingly, Brodić et al. [2] used traditional statistical analysis in terms of Mann–Whitney U test for detecting the user’s factors affecting the Dice CAPTCHA solution time among age, gender and education level. The goal was to detect if the Dice CAPTCHA could be compliant to the“ideal” model (a solution to the CAPTCHA should be provided in short time—lower than 30 s—and the time spent to find the solution should not be influenced by personal user’s features [3]). Brodić et al. [4] proposed to extend this statistical analysis with new user’s factors, including the Internet experience, type of device on which the Dice CAPTCHA is solved and number of attempts for obtaining a correct solution. They explored the influence of the co-occurrence of the different user’s features on the Dice CAPTCHA solution time by association rule mining. There are different aspects which are not considered in this investigation. In particular, association rule mining only provides unsupervised analysis of this dependence, missing the aspect of predicting the solution time given the user’s factors. To overcome this limitation, Amelio et al. [5] proposed an artificial neural network model for predicting the solution time to the Dice CAPTCHA from the user’s age, Internet experience and device type on which the Dice CAPTCHA is solved.
In this study, we extended the previous analysis on 197 subjects who use the Internet, characterized by age, education level, Internet use, and number of attempts for successfully solving the Dice CAPTCHA. The solution time was measured for the whole group of Internet users. The investigation was performed on a laptop or tablet for a given number of attempts. This work analyzed the combination of user’s features influencing the time to correctly solve the Dice CAPTCHA using: (i) association rule mining (unsupervised method); and (ii) prediction by artificial neural network (supervised method).
To summarize, the main contributions of this work vs. the literature are the following:
- Differently from the authors of [2,4,5], a more complete experiment was performed, involving both an unsupervised method (association rule mining) and a supervised method (artificial neural network).
- A traditional statistical analysis as in [2] makes preliminary assumptions on the data. By contrast, the association rule mining does not need any initial assumption on the data, and is able to capture dependences of multiple user’s factors on the Dice CAPTCHA solution time.
- The set of the adopted user’s features is different from the set in [2]. It includes age, education level, Internet use, device type on which Dice CAPTCHA is solved and number of attempts for obtaining a correct solution. Gender is omitted since it has no influence in both association rule mining and artificial neural network analysis.
- Differently from Amelio [5], the artificial neural network model was extended with the number of attempts for successfully solving the Dice CAPTCHA as a new input parameter. It brings new results completing the analysis in [5].
The rest of the paper has the following organization. Section 2 makes an overview of the related works, while Section 3 describes the basics of the Dice CAPTCHA. The experimental part is given in Section 4 as well as the explanation of the association rule mining and artificial neural network. The results of the investigations together with the discussion are given in Section 5 and Section 6, respectively. Finally, the conclusions and guidelines for the future work are presented in Section 7.
2. Related Work
Different works on the usability of the CAPTCHA can be found in the literature. Singh and Pal [6] investigate the drawbacks of different types of CAPTCHA. In particular, text-based CAPTCHAs are usually hard to solve because it is difficult to correctly identify the characters. The users have problems in solving image-based CAPTCHAs when their vision is impaired, or when the images presented are blurred. Audio-based CAPTCHAs are usually presented in English language, which is a limitation for non-native English speakers or people who do not comprehend English, while for the video-based CAPTCHAs, the users have issues with downloading and finding the correct CAPTCHA. In the end, the CAPTCHAs based on puzzles are more difficult to be solved since usually the solution time is longer, and the user needs to correctly identify the solution to the puzzle.
Fidas et al. [7] investigated users’ perceptions, preferences and usage of the CAPTCHA. The authors used a survey to collect responses, and concluded that the CAPTCHAs are hard to be solved by humans. From 210 collected surveys, the authors concluded that every other participant needs more than one try to solve the CAPTCHA. Moreover, the background patterns are identified as the main barrier when solving the CAPTCHA.
In [8], usability and usability issues of the CAPTCHA design were investigated. The authors proposed a framework for investigating the usability of the CAPTCHA, consisting of three dimensions: (1) distortion; (2) content; and (3) presentation. Based on this framework, the following usability issues were identified. First, foreigners have some difficulty to find a solution to CAPTCHAs based on text due to the language barrier. Second, the use of the color in a CAPTCHA affects both its usability and security. Lastly, the ability to predict the CAPTCHA sequence may have serious implications on the usability of the CAPTCHA.
Beheshti and Liatsis [9] used a survey which consisted of 13 questions to evaluate the users’ experience and performance when solving the reCAPTCHA. Users’ age, gender, vision impairment, and monitor type were considered in the analysis. Their results showed that, from 100 participants, 61% solved the reCAPTCHA in one try, while 28% of the users solved the reCAPTCHA in two attempts, and the rest of the users needed three attempts to correctly solve the CAPTCHA. Moreover, most of the users solved the reCAPTCHA in less than 5 s, while only 5% of them needed more than 10 s to solve it. The results also showed that a high character distortion leads to a longer solution time. In addition, most of the participants evaluated the ambiguity level of the CAPTCHA characters as moderately clear, moderately unclear, and very unclear.
In [10], the Dynamic Cognitive Game (DCG) CAPTCHA was evaluated from a perspective of usability and security. The gender, age, and education of the participants were taken into account when the authors performed the analysis of the solution time, user experience, and success rate of solving the CAPTCHA, but no meaningful relation was found. The results show that this type of CAPTCHA remains secure in terms of completely automated attacks.
In addition, Conti et al. [11] introduced a new image-based CAPTCHA called CAPTCHaStar!, based on the identification of different shapes in a confused environment. A usability analysis involving a population of 281 users was performed on the proposed CAPTCHA in terms of success rate and solution time. The obtained results prove that CAPTCHaStar! has a higher than 90% success rate.
The first large scale assessment of the CAPTCHA test was provided in [12] for evaluating the difficulty level of solving different types of CAPTCHA. The analysis involved more than 318,000 CAPTCHA tests of 21 different types, including 13 image-based and 8 audio-based CAPTCHAs. The obtained results show that humans have difficulties in solving the CAPTCHA test, in particular the audio-based CAPTCHA. In addition, for non-native English speakers, the solution to English-based CAPTCHA types can be slower and less accurate.
Brodić et al. [13] investigated the influence of the CAPTCHA based on image and text on the users’ solution time, based on their age, gender, level of education, and Internet experience. The obtained results prove that younger users solve the CAPTCHA faster, while no statistically significant differences in solution time were found between male and female users. Moreover, users with a level of higher education are faster in solving the CAPTCHA. Lastly, this research showed that users with a higher Internet experience solve the CAPTCHA slightly more quickly than users with less Internet experience. Brodić et al. [2] investigated the aspects of usability in the Dice CAPTCHA solved on a laptop and tablet using traditional statistical analysis (Mann–Whitney U test). Specifically, the analysis explored the user’s factors influencing the Dice CAPTCHA solution time. The authors concluded that the Dice CAPTCHA can be considered as very close to an “ideal” test, i.e. the CAPTCHA does not depend on the user’s age, education and gender, and can be solved in less than 30 s [3]. The same authors [4] extended the previous analysis using association rule mining, which explored the dependence of co-occurrence of the user’s factors on the Dice CAPTCHA solution time. Finally, Amelio et al. [5] analyzed the prediction ability of the user’s factors on the Dice CAPTCHA solution time using an artificial neural network model. Both works [4,5] investigated which Dice CAPTCHA type (among the analyzed ones) is closer to the “ideal” model.
3. The Dice CAPTCHA
The Dice CAPTCHA is a type of CAPTCHA based on a puzzle, the aim of which is the solution of a puzzle showing a dice at the center of the panel [14]. In that sense, the user is required to find a solution to the dice puzzle to be recognized as a human subject and differentiated from a bot. If a correct solution is provided to the puzzle, then the user will be classified as a human, otherwise it will be considered as a bot.
The Dice CAPTCHA is proposed as Homo-sapiens Dice CAPTCHA (also called Dice 1) and All-the-rest Dice CAPTCHA (also called Dice 2), corresponding to two different variants for web protection from attacks made by the bots [14].
In Dice 1, the user is required to roll the dice and fill the text field with the sum of the digits appearing on the dice’s faces (see Figure 1a). By contrast, in Dice 2, the user is asked to roll the dice and fill the text field with the digits which are depicted on the dices’ faces [14] (see Figure 1b).

Figure 1.
The two types of Dice CAPTCHA: (a) Dice 1; and (b) Dice 2.
4. Materials and Methods
We analyzed the usability aspects related to the solution to Dice 1 and Dice 2 CAPTCHA of a set of Internet users on laptop or tablet. Specifically, the study investigated the combination of users’ features influencing the time to successfully find a solution to both CAPTCHAs in a given number of attempts. This dependence was modeled by the unsupervised method of the association rules and the supervised method of the Artificial Neural Network (ANN).
4.1. Participants
The participants to the experiment are a set of 197 subjects who use the Internet and are operated in contexts of everyday life. All subjects are voluntary experimenters whose consent to anonymously provide their data for research and analysis was required through an online form. To avoid being influenced, the subjects were not informed about the scope of the analysis, or the collected data types. The task of each user was to find a solution to both Dice 1 and Dice 2 while working on laptop or tablet. Each user is characterized by: (i) age; (ii) number of years of Internet experience; (iii) daily Internet usage in number of hours; and (iv) device type (tablet or laptop) used to solve the CAPTCHA. In addition, for each user, the solution time (in seconds) to the CAPTCHAs and the number of required attempts were measured from the time when the task was started by the user until its completion.
4.2. Materials
The collected data were stored into a dataset of 197 instances, one for each user, and the following six variables: (i) age; (ii) Internet experience in number of years; (iii) daily Internet usage; (iv) device type (tablet or laptop) on which the CAPTCHA solution is found; (v) number of attempts for solving the CAPTCHA; and (vi) CAPTCHA solution time. Data were statistically processed, which confirmed their statistical significance.
On a total of 197 subjects, 100 of them found the solution on a tablet, and 97 of them on a laptop. The maximum number of attempts given to find a successful solution to Dice 1 or Dice 2 was 3. It was observed that 163 subjects successfully solved Dice 1 in one attempt, 26 subjects in two attempts, and 8 subjects in three attempts. By contrast, 182 subjects found a solution to Dice 2 in one attempt, 10 subjects in two attempts, and 5 subjects in three attempts.
All subjects have an age in the range 28–62 years, an Internet experience between 1 and 19 years, and a daily Internet usage between 1 and 6 h.
Figure 2a shows the age distribution of the subjects, while Figure 2b shows their Internet experience in number of years. It can be observed that the Internet experience distribution has a shape which is close to a Gaussian function. By contrast, the daily Internet usage distribution, which is shown in Figure 2c, is slightly deviating from a Gaussian function.
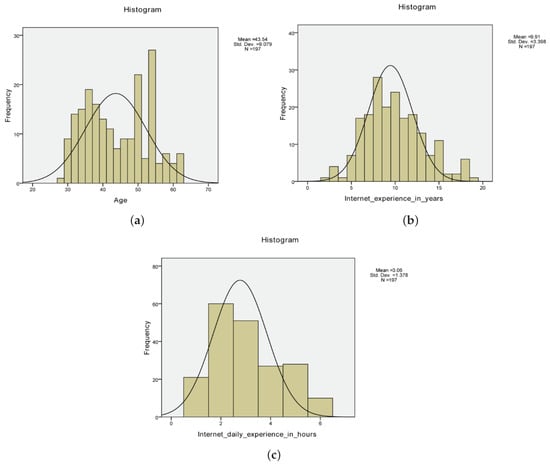
Figure 2.
Distribution of: (a) users’ age; (b) Internet experience in number of years; and (c) daily Internet usage in number of hours.
For Dice 1, the solution time distribution is bounded between 1.4 and 31 s (see Figure 3a), with a median value of 8.00 s and mean value of 9.48 s. A solution time of 8.00 s was obtained by the most subjects, i.e., 49 users. In addition, solution times of 12.09 s and 6.78 s were typically obtained on tablet and laptop, respectively.
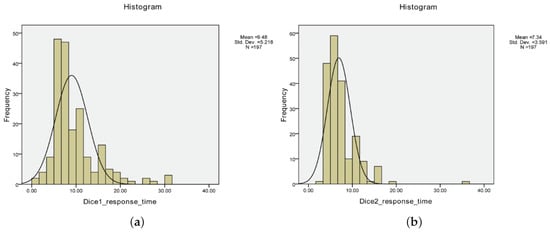
Figure 3.
Distribution of the CAPTCHA solution time for: (a) Dice 1; and (b) Dice 2.
For Dice 2, the solution time distribution is bounded between 3 and 35 s (see Figure 3b), with a median value of 6.00 s and a mean value of 7.34 s. A solution time of 6.00 s was obtained by the most subjects, i.e., 60 users. In addition, solution times of 8.59 s and 6.04 s were typically obtained on tablet and laptop, respectively.
From a depth observation of the Dice 1 and 2 distributions, it can be concluded that the users need less time to solve Dice 2 than Dice 1, which was also less than 30 s.
4.3. Methods
4.3.1. Modeling Features Dependence by Association Rule Mining
A discretization of the dataset variables was performed as follows. The age was split into two intervals: (i) users with age lower than 35; and (ii) users with age higher than 35 years. The Internet experience was divided into four ranges: (i) less than or equal to 5 years (low Internet experience); (ii) from 6 to 10 years (middle Internet experience); (iii) from 11 to 15 years (high Internet experience); and (iv) higher than 15 years (very high Internet experience). The daily Internet usage was split into three ranges: (i) less than or equal to 2 h (low usage); (ii) from 3 to 4 h (moderate usage); and (iii) higher than 4 h (high usage). Finally, the CAPTCHA solution time was split into five ranges: (i) less than or equal to 5.8 s (very quick); (ii) from 5.8 to 8.2 s (quick); (iii) from 8.2 to 13 s (intermediate); (iv) from 13 to 22 s (slow); and (v) higher than 22 s (very slow).
The Internet use was split into intervals of the same width using an approach of equal width binning [15]. The equal width partitioning divides the values of Internet use into K intervals of the same size. In particular, let a and b be the lowest and highest values of Internet use in the dataset, and the width of the intervals is . By contrast, K-Medians clustering [16] was applied on the solution time, since it revealed the best performance on the final result. The K-Medians algorithm finds a partitioning of the solution time values into clusters (intervals) that minimizes the total distance between each value and its cluster center. In Step 1, the algorithm randomly selects K cluster centers from the values, where K is an input parameter setting the number of clusters. In Step 2, each value is assigned to its closest center based on the Manhattan distance. In Step 3, the cluster centers are re-computed as the median value of each cluster. Steps 2 and 3 are iterated until the cluster centers no longer move their position closer to the actual centers of the data points distributions.
The number of intervals was varied in the equal width binning and K-Medians for discretizing both the Internet use and solution time. Finally, the number of intervals obtaining the best performances for the current task was selected in both methods.
After discretization of the users’ features, an approach based on Association Rules (ARs) was applied for detecting how different combinations of the values of age, device type, Internet experience and daily Internet usage influence the time to successfully solve the Dice 1 and 2 CAPTCHAs.
Each dataset row can be considered as a transaction characterized by a set of items. Each item corresponds to a feature value. Accordingly, an AR shows the dependence of the itemset B (called consequent) on the itemset A (called antecedent) in the form of an implication [17]. The strength of an AR is measured by four performance measures:
- support
- confidence
- lift
- conviction
The support S measures how much the AR is statistically significant. It is the ratio between the number of transactions with and the transactions number in the dataset:
where is the number of transactions with , and T is the transactions number in the dataset. A high support indicates that the AR often occurs in the dataset.
The confidence C quantifies the probability of occurrence of the antecedent A given the consequent B. It is the ratio of the number of transactions with and the number of transactions with the only antecedent A:
A high confidence indicates that the consequent B of the AR often occurs when the antecedent A occurs in the transactions.
The lift L measures the correlation between the consequent B and the antecedent A. It is the ratio between the confidence of the AR and the support of the consequent B:
A high lift value indicates a high correlation between the consequent B and the antecedent A of the AR in the dataset.
The conviction is defined as the ratio between the frequency of itemsets not containing the consequent B and the frequency of incorrect predictions. It is computed as follows:
The aim of the association rule mining is the extraction of the ARs having support and confidence values higher than or equal to minsupport and minconfidence thresholds, respectively. The FP-Growth algorithm is used for this purpose [17]. This algorithm is composed of two steps for the generation of the frequent itemsets from which the ARs are extracted:
- FP-tree creation
- Extraction of the frequent itemsets by FP-tree traversal
Step 1 is characterized by two scans of the dataset. In the first scan, the unfrequent items with support lower than minsupport are deleted from the dataset. Then, the remaining items of each transaction are sorted from maximum to minimum support. In the second scan, each transaction is associated with a path in the FP-tree, such that transactions with a common set of items share a portion of the path from the root. In the tree, each node represents an item, with the only exception of the root, which is a pointer. In addition, each node keeps information about the number of transactions sharing the itemset from the root to that node. Step 2 employs on the FP-tree a recursive approach from the leaves up to the root for detecting the frequent itemsets.
4.3.2. Modeling Features Dependence by Artificial Neural Network
Having the personal and demographic features of the Dice 1 and 2 CAPTCHAs’ users, it becomes possible to predict the solution time in solving posed tasks also by means of the artificial neural networks use. The users’ age, their Internet experience in number of years, device type and number of guesses to solve the CAPTCHA were considered as input parameters to the ANN. It is a fully connected network with a single neuron taking each input value independently and thus forming along with all the other input neurons the input layer. The output layer consists of neurons, which produce one single value as an output (see Figure 4).
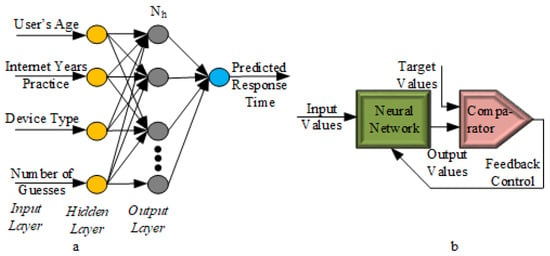
Figure 4.
(a) ANN proposed structure; and (b) ANN learning principle.
The selected type of ANN is actually a feed-forward—one of the simplest, yet the most efficient in terms of training time needed to sustain a desired accuracy during the actual prediction [18]. The training of the ANN is presented by a basic concept shown in Figure 4b.
The inputs of the ANN are represented as a vector where is the user’s age, is the number of years of Internet experience, is the device type, and is the number of attempts. The single neuron in the output layer has activation function of a linear type denoted with while all neurons from the hidden layer—sigmoidal function of one and the same type g. ANN is thus composed of a total of layers, of which only one is hidden. The output is one-dimensional given by a scalar o corresponding to the predicted solution time. It is a fully connected ANN with all neurons from layer connected to all neurons from layer . No connections exist among neurons from one and the same layer. The weight of neuron j from layer through which it accesses to neuron i from the th layer is . Given the layer , each neuron i in it has its bias . The product sum for the same neuron with the bias is and its output is . is the number of nodes in layer .
All weights for the neuron i from layer could be embedded into a vector . The same could be done with all the outputs from layer : . The initialization of the input layer starts with setting the outputs to the input values from the vector , that is . For the hidden layer , the product sums are calculated according to for .
The outputs then come as for . For the output layer the product sum and the output are and , respectively.
The training of the selected ANN is based on iterative updates of the components of and given the pairs with the desired outputs , , so that the Mean Squared Error (): is minimized [19]. Adjusting and relies on the gradient descent approach following the equations [19]:
where is the learning rate. The delta values that are the changes of weights and bias for each neuron’s connections at a given iteration are passed backward through the network from where comes its full name—feed-forward neural network with backpropagation.
The number of neurons in the hidden layer could not be initially selected optimally. It was discovered by a trial-an-error approach, as described in Section 5.2, which led to a good generalization capability.
5. Results
5.1. Association Rule Mining Results
The association rule mining experiment was run in Matlab R2017a (Natick, MA, USA). A trial and error approach extracted the ARs with different combinations of support and confidence thresholds from 5% to 90%. This range was chosen based on: (i) how many ARs were extracted; (ii) number of solution time values and attempts in the rules’ consequent; and (iii) how many different values of the users’ factors were present in the rules’ antecedent. The final combination of support and confidence thresholds was 5% and 40% since it brought the lowest number of ARs with the highest number of different values, capturing the most relevant information patterns. Finally, the only ARs with values of solution time and number of attempts in the consequent were kept in the pool.
Table 1 and Table 2 report the ARs in terms of antecedent and consequent, together with the corresponding support (S), confidence (C), lift (L), and conviction () obtained for Dice 1 and 2 CAPTCHA. In addition, the distribution of the ARs given support, confidence and lift, and the solution time for Dice 1 and 2 CAPTCHA are shown in Figure 5 and Figure 6, respectively.

Table 1.
The set of the extracted association rules for Dice 1 CAPTCHA. The number of attempts in the consequent is 1 for all ARs (consequently, it is omitted).

Table 2.
The set of the extracted association rules for Dice 2 CAPTCHA. The number of attempts in the consequent is 1 for all ARs (consequently, it is omitted).
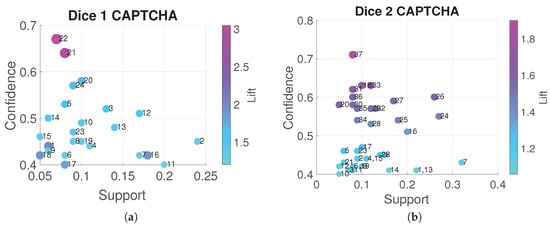
Figure 5.
Scatter plot of the ARs given: (i) support; (ii) confidence; and (iii) lift, for Dice 1 and 2. Each coloured point represents an AR identified by its numerical ID (see Table 1 and Table 2). The position of each point depends on the support and confidence values of the corresponding AR. The colour of each point represents the lift value of the corresponding AR.
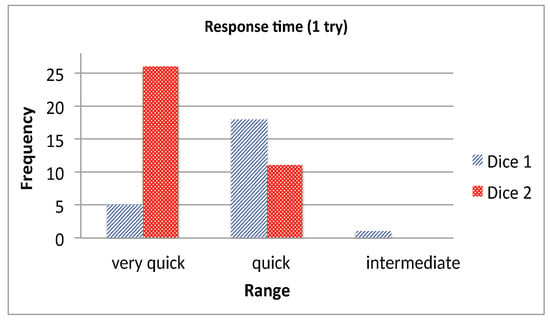
Figure 6.
Distribution of the discretized solution time in Dice 1 and 2 datasets.
It is worth noting that Dice 1 is more difficult to solve than Dice 2 in one attempt, since the solution time to Dice 2 is smaller than Dice 1 in most of the ARs (see Figure 6). In addition, we can observe that the users had more difficulty to solving Dice 1 on a tablet than on a laptop in one attempt (in the case of a laptop, the solution time in the rules’ consequent was quick or very quick; on the contrary, it was intermediate or quick in the case of a tablet—see Table 1). A similar trend can be observed for Dice 2, where the tablet is associated to a quick solution time, while the laptop is associated to a very quick solution time (see Table 2).
Another important aspect is that the age groups do not show any statistically significant difference in terms of time to solve the CAPTCHA in one attempt. This is visible from the AR 4 of Dice 1, which includes an age < 35 years, while there is no similar rule for age > 35, thus we cannot make any conclusion in terms of age difference. Although ARs 4 and 7 of Dice 2 capture a difference in terms of solution time in one attempt between the two age groups, they exhibit a lift which is not high (in the range 1.16–1.19, see Figure 5b). The same is for the conviction, with a value in the range 1.10–1.12. This indicates that the age groups do not affect meaningfully the solution time.
By contrast, some differences are visible for age groups in combination with multiple factors, such as the device type or the Internet use. Specifically, when the users solved Dice 1 on tablet, the age difference influenced the solution time in one attempt (see ARs 1 and 6 with a value of lift up to 2 and conviction up to 1.4, where the solution time is intermediate for users with age > 35 years—Figure 5a). By contrast, for Dice 1 on laptop, users of age > 35 years with high Internet experience solved the CAPTCHA very quickly in one attempt, while the same users with a middle Internet experience solved the CAPTCHA quickly in one attempt (see ARs 13 and 22 obtaining a high value of lift up to 3 and conviction up to 2.3, and a value of confidence up to 0.67). It is worth noting that the time needed for solving Dice 1 in one attempt by users with age > 35 years is not influenced by the daily Internet usage (see ARs 18 and 24 where a very quick solution time is determined by a low daily Internet usage, while a quick solution time is determined by a middle daily Internet usage).
Differently from Dice 1, in Dice 2, neither Internet experience nor daily usage influences the time of solving the CAPTCHA in one attempt on laptop for users with age > 35 years (see ARs 27, 29, 33, and 37 where a very quick solution time is present in all cases, regardless of the Internet use values). In conclusion, a quick solution time of Dice 1 in one attempt is only caused by a long Internet experience. On the contrary, the solution time of Dice 2 is slightly affected by both Internet experience and daily usage. We can conclude that the daily Internet usage is a parameter with small influence on the Dice CAPTCHA solution time.
5.2. Artificial Neural Network Results
The original dataset with no discretization of the variables was adopted for this analysis. To correctly perform the training and testing of the ANN, all measured values first needed to be normalized. The normalization was done within the range [0, 1] as follows:
where is the result from the normalization and is the initial value of the parameter. Its minimum and maximum along the whole registered series are and . respectively. After the prediction was done, the estimated solution time needed to be denormalized using the opposite relation to Equation (7). Afterwards, the prediction accuracy of the ANN could be found.
As stated in Section 4.3.2, ANN has a single hidden layer in which the number of neurons (simplified as ) may be selected in the most precise fashion by using a trial-and-error approach. In the current experimentation, was varied between 5 and 50 with a step of 5. That leads to 10 independent testing sets, whose results are shown below.
All captured values from the participating users were split into three groups: a training set with 75% of the samples, 10% for validation and 15% for testing. The Levenberg–Marquardt algorithm [20] was used for training the ANN with a maximum epochs number of 1000. The measure of deviation from the desired output was the . The training ended when the latter became smaller than a preliminary set threshold.
The achieved accuracy of the prediction was calculated by the Pearson’s correlation coefficient [21] R between the target and predicted values and by their difference (see Figure 7 and Figure 8). It could be relied on since it proved its efficiency as a statistical measure investigating complex intelligence based systems [22].
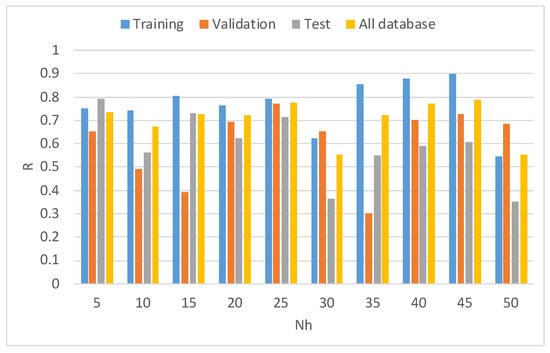
Figure 7.
Pearson’s correlation coefficient R between the target and predicted solution time for one training, validation, and test part of the Dice 1 dataset and for the whole dataset varying the number of neurons () in the hidden layer of the ANN model.
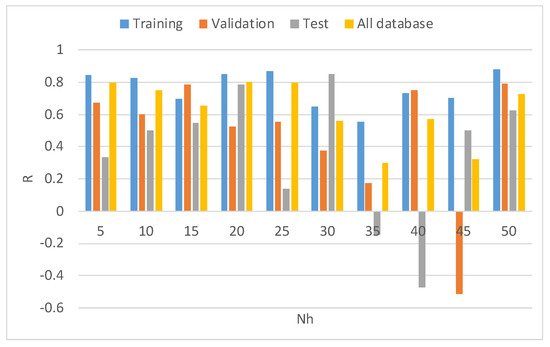
Figure 8.
Pearson’s correlation coefficient R between the target and predicted solution time for one training, validation, and test part of the Dice 2 dataset and for the whole dataset varying the number of neurons () in the hidden layer of the ANN model.
We can observe that in the hidden layer the best neurons number achieving the highest R coefficient was = 45 for Dice 1 and = 20 for Dice 2. For both CAPTCHAs, in these cases, the achieved was also smaller. The precise values for R over the whole dataset concerning the two puzzles are given in Table 3. The global maximum for Dice 1 occurred for = 45 with R = 0.79 and that for Dice 2 happened for = 20 while R = 0.80. Accordingly, a detailed analysis and discussion of the experimental results is given further for these two cases.

Table 3.
Pearson’s correlation coefficient for the whole dataset from Dice 1 and Dice 2. The best values are marked.
The distribution of the obtained error from the predicted solution time of Dice 1 CAPTCHA is given in Figure 9a. In addition, Figure 9b shows the trend of the target and estimated by the ANN solution time for the whole dataset. The same parameters for Dice 2 CAPTCHA are presented in Figure 9c,d. Finally, Figure 10 shows the trend of the error (target—predicted solution time) for Dice 1 and 2 CAPTCHA over the Internet users. Differently from Amelio [5], it is worth noting that the Dice 2 error is smaller than the Dice 1 error. In fact, the instances are distributed in a range of higher error values for Dice 1 (see Figure 9a,c). Given the direct comparison between target and predicted values, the bigger shifting for Dice 1 additionally supports that observation (see Figure 9b,d). This was also confirmed by the trend of the error for both CAPTCHAs (see Figure 10).
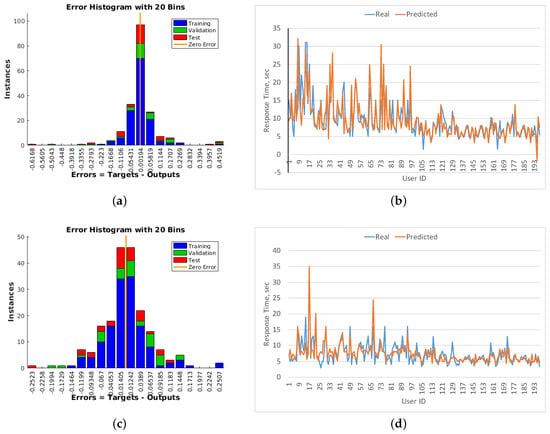
Figure 9.
(a) Histogram of the error (target—predicted solution time) for one training, validation, and test part of the Dice 1 dataset ( = 45); (b) trend of the target vs. predicted solution times for the Dice 1 dataset; (c) histogram of the error (target—predicted solution time) for one training, validation, and test part of the Dice 2 dataset ( = 20); and (d) trend of the target vs. predicted solution times for the Dice 2 dataset.
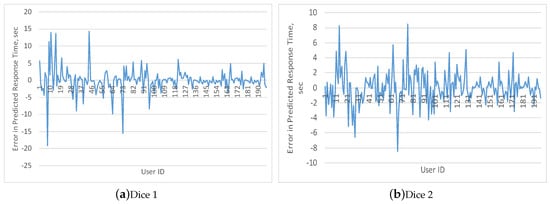
Figure 10.
Trend of the error computed as target—predicted solution time over the Internet users.
In addition to the error distributions, regression was also applied over the pairs—predicted against target solution time for all sub-sets of data—training, validation and test one, and to the whole dataset as well. Figure 11 contains the results for Dice 1 and Figure 12 for Dice 2. The total correspondence between all pairs would be present if all of them lying over the bisector of the coordinate system.
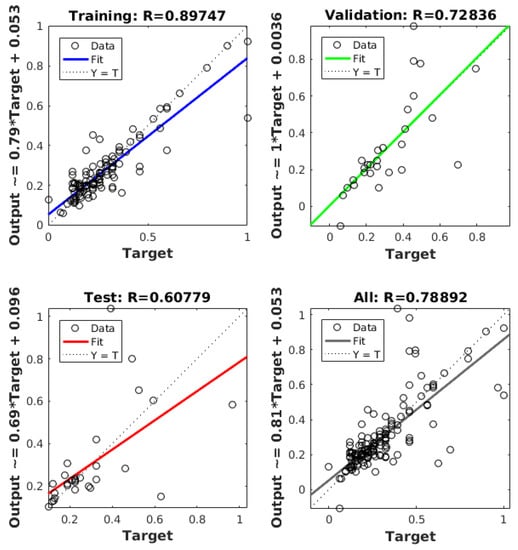
Figure 11.
Regression results (target vs. predicted solution time) for one training, validation, test part of the Dice 1 dataset and for the whole dataset ( = 45).
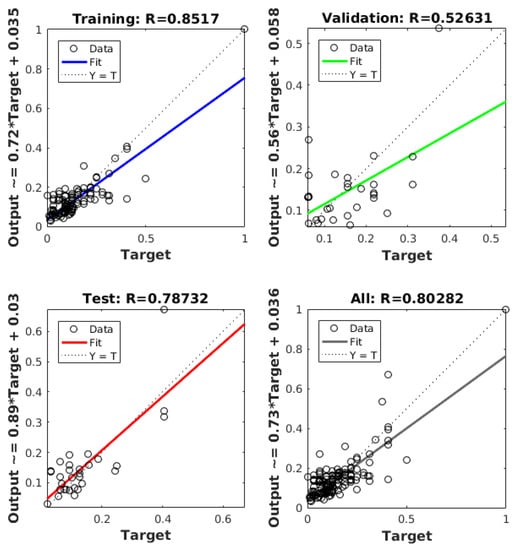
Figure 12.
Regression results (target vs. predicted solution time) for one training, validation, test part of the Dice 2 dataset and for the whole dataset ( = 20).
Differently from Amelio [5], we can observe that the distribution of the pairs for Dice 1 is worse than for Dice 2. Specifically, for Dice 1, R is up to 0.61 when analyzing the test set and up to 0.79 for the whole dataset. The values of R for Dice 2 are 0.79 for the test set and 0.80 for the whole dataset.
From a comparison with Amelio [5], it is visible an enhancement in prediction of the solution time when the number of attempts is added as new input parameter of the model. For Dice 2, it is considerable—the difference in R is over 0.13. For Dice 1, the overall error is almost the same, while the R difference is around 0.03.
6. Discussion
From the extracted ARs, we can make the following considerations: (1) Dice 1 is more difficult to solve than Dice 2; (2) a laptop is an easier device than a tablet on which the users are able to solve both types of CAPTCHA; (3) the age difference does not show a statistical significance in influencing the solution time of both types of CAPTCHA for a given number of attempts; (4) in Dice 1, the age difference shows a statistical significance in influencing the solution time of users which operate on tablet; (5) a reduction of the solution time on laptop is determined by a long Internet experience in Dice 1, and, in contrast, the solution time of users with age > 35 years is not influenced by the Internet experience in Dice 2; and (6) the time of the users with age > 35 years to solve Dice 1 and 2 in one attempt on laptop is not influenced by the daily Internet usage.
These results prove that considering the sum of the digits depicted on the dice’s faces, like in Dice 1, is more difficult than considering only the digits, such as in Dice 2. In addition, it is visible that solving the Dice CAPTCHA on a tablet is more difficult than on a laptop. This difference, which is observable from the solution times, can be due to multiple factors, including: (1) the touchscreen in the tablet, on which the digits are more difficult to be typed on the virtual keyboard for some subjects who use the Internet; and (2) the reduced screen dimension in the tablet, which can cause difficulties in recognizing the numbers depicted on the dice.
The results from ANN in [5] prove a higher prediction ability of the solution time to Dice 1 vs. Dice 2, which is here contradicted when the number of attempts is added as input feature. This indicates that, regardless of the solution time being lower than 30 s, Dice 2 CAPTCHA is still far from the “ideal" model. Consequently, effort is still needed for designing new types of CAPTCHA, which could be closer to it.
7. Conclusions
This analysis detected the co-occurrence of personal and demographic users’ factors (age, device type, Internet use and number of attempts) which has a relevant influence on the Dice CAPTCHA solution time. It was performed by extracting the association rules from the dataset of users’ features and corresponding time and number of attempts to solve the CAPTCHA.
The proposed experiment showed that age and Internet use have more influence on Dice 1 than on Dice 2. Nonetheless, further investigation is necessary for constructing a Dice CAPTCHA which is less influenced by personal and demographic features of the users who solve it. In fact, solving the Dice CAPTCHA on tablet still represents a critical task in terms of solution time.
In addition to the results obtained by applying the association rules, the ability of making prediction of the solution time to Dice CAPTCHA by feed-forward neural networks makes them a useful tool in the overall evaluation of the applicability of the first. Given the personal features of the users, it becomes possible to evaluate in advance the suitability of a particular type of CAPTCHA—Dice 1 or Dice 2—prior to its full implementation for a particular application. Differently from our previous study, more predictable tends to be the solution time for Dice 2 vs. Dice 1 when the number of attempts is added as input feature of the neural network. Consequently, effort is still required in the future for designing new CAPTCHA types which could be closer to the “ideal” model.
Author Contributions
Conceptualization, A.A. and D.T.; methodology, A.A., D.T., I.R.D., and R.J.; and validation, A.A. and R.J.
Funding
This work was supported by the Mathematical Institute of the Serbian Academy of Sciences and Arts (Project III44006).
Acknowledgments
The authors are fully grateful to the voluntary participants for anonymously providing their data. This paper is dedicated to Darko Brodić with full gratitude.
Conflicts of Interest
The authors declare no conflict of interest. The funders had no role in the design of the study; in the collection, analyses, or interpretation of data; in the writing of the manuscript, or in the decision to publish the results.
References
- Ye, G.; Tang, Z.; Fang, D.; Zhu, Z.; Feng, Y.; Xu, P.; Chen, X.; Wang, Z. Yet Another Text Captcha Solver: A Generative Adversarial Network Based Approach. In Proceedings of the 2018 ACM SIGSAC Conference on Computer and Communications Security, CCS ’18, Toronto, ON, Canada, 15–19 October 2018; pp. 332–348. [Google Scholar]
- Brodić, D.; Amelio, A.; Draganov, I.R. Statistical Analysis of Dice CAPTCHA Usability. arXiv 2017, arXiv:1706.10177. [Google Scholar]
- Von Ahn, L.; Blum, M.; Hopper, N.; Langford, J. CAPTCHA: Using hard AI problems for security. In Advances in Cryptology—EUROCRYPT 2003, Proceedings of the International Conference on the Theory and Applications of Cryptographic Techniques, Warsaw, Poland, 4–8 May 2003; Biham, E., Ed.; Lecture Notes in Computer Science; Springer: Berlin/Heidelberg, Germany, 2003; Volume 2656, pp. 294–311. [Google Scholar]
- Brodić, D.; Amelio, A.; Draganov, I.R.; Janković, R. Exploring the Usability of the Dice CAPTCHA by Advanced Statistical Analysis. In Artificial Intelligence: Methodology, Systems, and Applications, Proceedings of the 18th International Conference AIMSA 2018, Varna, Bulgaria, 12–14 September 2018; Agre, G., van Genabith, J., Declerck, T., Eds.; Lecture Notes in Computer Science; Springer: Berlin/Heidelberg, Germany, 2018; Volume 11089, pp. 152–162. [Google Scholar]
- Amelio, A.; Janković, R.; Tanikić, D.; Draganov, I.R. Predicting the Usability of the Dice CAPTCHA via Artificial Neural Network. In Digital Libraries: Supporting Open Science, Proceedings of the 15th Italian Research Conference on Digital Libraries, Pisa, Italy, 31 January–1 February 2019; Manghi, P., Candela, L., Silvello, G., Eds.; Communications in Computer and Information Science; Springer: Berlin/Heidelberg, Germany, 2019; Volume 988, pp. 44–58. [Google Scholar]
- Singh, V.P.; Pal, P. Survey of different types of CAPTCHA. Int. J. Comput. Sci. Inf. Technol. 2014, 5, 2242–2245. [Google Scholar]
- Fidas, C.A.; Voyiatzis, A.G.; Avouris, N.M. On the necessity of user-friendly CAPTCHA. In Proceedings of the SIGCHI Conference on Human Factors in Computing Systems, Vancouver, BC, Canada, 7–12 May 2011; pp. 2623–2626. [Google Scholar]
- Yan, J.; El Ahmad, A.S. Usability of CAPTCHAs or usability issues in CAPTCHA design. In Proceedings of the 4th Symposium on Usable Privacy and Security, Pittsburgh, PA, USA, 23–25 July 2008; pp. 44–52. [Google Scholar]
- Beheshti, S.M.R.S.; Liatsis, P. CAPTCHA Usability and Performance, How to Measure the Usability Level of Human Interactive Applications Quantitatively and Qualitatively? In Proceedings of the International Conference on Developments of E-Systems Engineering (DeSE), Duai, UAE, 13–14 December 2015; pp. 131–136. [Google Scholar]
- Mohamed, M.; Gao, S.; Sachdeva, N.; Saxena, N.; Zhang, C.; Kumaraguru, P.; Van Oorschot, P.C. On the security and usability of dynamic cognitive game CAPTCHAs. J. Comput. Secur. 2017, 25, 205–230. [Google Scholar] [CrossRef]
- Conti, M.; Guarisco, C.; Spolaor, R. CAPTCHaStar! A Novel CAPTCHA Based on Interactive Shape Discovery. In Applied Cryptography and Network Security, Proceedings of the International Conference on Applied Cryptography and Network Security, Guildford, UK, 19–22 June 2016; Manulis, M., Sadeghi, A.-R., Schneider, S., Eds.; Lecture Notes in Computer Science; Springer: Berlin/Heidelberg, Germany, 2016; Volume 9696, pp. 611–628. [Google Scholar]
- Bursztein, E.; Bethard, S.; Fabry, C.; Mitchell, J.C.; Jurafsky, D. How Good Are Humans at Solving CAPTCHAs? A Large Scale Evaluation. In Proceedings of the 2010 IEEE Symposium on Security and Privacy, Berkeley/Oakland, CA, USA, 16–19 May 2010; pp. 399–413. [Google Scholar]
- Brodić, D.; Amelio, A.; Janković, R. Exploring the influence of CAPTCHA types to the users response time by statistical analysis. Multimed. Tools Appl. 2017, 77, 12293–12329. [Google Scholar] [CrossRef]
- Wilkins, J. Strong CAPTCHA guidelines v1.2 Retrieved Nov. Available online: http://www.123seminarsonly.com/Seminar-Reports/008/47584359-captcha.pdf (accessed on 25 June 2019).
- Sullivan, D.G. Data Mining V: Preparing the Data; Boston University: Boston, MA, USA, 2013. [Google Scholar]
- Bradley, P.S.; Mangasarian, O.L.; Street, W.N. Clustering via Concave Minimization. In Advances in Neural Information Processing Systems, Proceedings of the Conference on Neural Information Processing Systems, Princeton, NJ, USA, 1–7 December 1996; ACM: New York, NY, USA, 1996; pp. 368–374. [Google Scholar]
- Tan, P.-N.; Steinbach, M.; Kumar, V. Introduction to Data Mining, 1st ed.; Addison–Wesley Longman Publishing Co.: Boston, MA, USA, 2005. [Google Scholar]
- Tanikić, D.; Marinković, V.; Manić, M.; Devedžić, G.; Randelović, S. Application of response surface methodology and fuzzy logic based system for determining cutting temperature. Bull. Pol. Acad. Sci. Tech. Sci. 2016, 64, 435–445. [Google Scholar] [CrossRef][Green Version]
- LeCun, Y. A Theoretical Framework for Back-Propagation. In Proceedings of the Connectionist Models Summer School, Pittsburgh, PA, USA, 17–26 June 1988; pp. 21–28. [Google Scholar]
- Levenberg, K. A Method for the Solution of Certain Non-Linear Problems in Least Squares. Q. Appl. Math. 1944, 2, 164–168. [Google Scholar] [CrossRef]
- SPSS Tutorials: Pearson Correlation. Available online: https://libguides.library.kent.edu/SPSS/PearsonCorr (accessed on 25 June 2019).
- Iantovics, B.; Corina, R.; Muaz, N. MetrIntPair—A novel accurate metric for the comparison of two cooperative multiagent systems intelligence based on paired intelligence measurements. Int. J. Intell. Syst. 2018, 33, 463–486. [Google Scholar] [CrossRef]
© 2019 by the authors. Licensee MDPI, Basel, Switzerland. This article is an open access article distributed under the terms and conditions of the Creative Commons Attribution (CC BY) license (http://creativecommons.org/licenses/by/4.0/).