Article

Exploring Whether Data Can be Represented as a Composite Unit in Form Processing Using the Manufacturing of Information Approach

by
Monica Blasco-Lopez
1,2,*,
Robert Hausler
1,
Rabindranarth Romero-Lopez
2,
Mathias Glaus
1 and
Rafael Diaz-Sobac
3,4
1
Station Expérimentale des Procédés Pilotes en Environnement, École de Technologie Supérieure, Université du Québec, 1100, rue Notre-Dame Ouest Local A-1500, Montréal, QC H3C 1K3, Canada
2
Unidad de Investigación Especializada en Hidroinformática y Tecnología Ambiental, Facultad de Ingeniería Civil, Universidad Veracruzana, Lomas del Estadio s/n, Zona Universitaria, Xalapa 91000, Mexico
3
Instituto de Ciencias Básicas, Universidad Veracruzana, Av. Luis Castelazo Ayala, s/n. Col. Industrial Animas, Xalapa 91190, Mexico
4
Universidad de Xalapa, Carretera Xalapa-Veracruz- Km2. No.341, Col. Acueducto Animas, Xalapa 91190, Mexico
*
Author to whom correspondence should be addressed.
Information 2019, 10(5), 156; https://doi.org/10.3390/info10050156
Submission received: 5 March 2019 / Revised: 24 April 2019 / Accepted: 24 April 2019 / Published: 26 April 2019
(This article belongs to the Section Information Applications)

Abstract

:
Data and information quality have been recognized as essential components for improving business efficiency. One approach for the assessment of information quality (IQ) is the manufacturing of information (MI). So far, research using this approach has considered a whole document as one indivisible block, which allows document evaluation only at a general level. However, the data inside the documents can be represented as components, which can further be classified according to content and composition. In this paper, we propose a novel model to explore the effectiveness of representing data as a composite unit, rather than indivisible blocks. The input data sufficiency and the relevance of the information output are evaluated in the example of analyzing an administrative form. We found that the new streamlined form proposed resulted in a 15% improvement in IQ. Additionally, we found the relationship between the data quantity and IQ was not a “simple” correlation, as IQ may increase without a corresponding increase in data quantity. We conclude that our study shows that the representation of data as a composite unit is a determining factor in IQ assessment.

1. Introduction

Data quality (DQ) and information quality (IQ) are recognized by business managers as key factors affecting the efficiency of their companies. In the U.S. economy alone, it is estimated that poor data quality costs 3.1 trillion U.S. dollars per year [1]. In order to obtain better information quality, researchers have suggested considering data as a product, and have established the manufacturing of information (MI) approach [2], where data are input to produce output data [3,4,5,6,7,8,9] or output information [10,11,12].
The concept of quality for products has been defined as “fitness for use” [5,13,14,15,16,17]. Meanwhile, for information products (IP), this definition applies only for “information quality” (not for the information alone), because it depends on the perspective of the user. According to the context, one piece of information could be relevant for one user and not relevant for another [16]. For that reason, data and information quality assessment should be evaluated according to required attributes for the business. Some desirable attributes are accuracy, objectivity, reputation, added value, relevancy (related to usefulness), timeliness (related to temporal relevance), completeness, appropriate amount of data (here called “sufficiency”), interpretability, ease of understanding, representational consistency, accessibility, and access security [6,16,17,18,19,20,21]. Although extensive research has been carried out in this field, data units (dus) have always been represented as indivisible blocks (file, document, and so on). No single study exists that represents a du in a different way.
For the DQ and IQ assessment, for our part, we consider that the du structure constitutes a data block (DB), such as a document. This DB is composed of several dus, and each du can be represented according to its particular characteristics for two types of materials: the first being a pure (simple) material, and the second being a composite material (formed from two or more elements). These characteristics relate to the attributes of sufficiency and relevance and, thus, could have some impact on the IQ assessment of the information products (IP). Relevance has been related to the concept of usefulness [6,16,22], and sufficiency is related to having a quantity of data that is good enough for the purposes for which it is being used [6], not too little nor too much [23]. Both attributes are closely interconnected. The sufficiency of data is a consequence of counting only the relevant information in the system [6]. In order to have relevant information, the document should ideally have only a sufficient quantity of data.
Therefore, the aim of this paper is to explore the effectiveness of representing the data as a composite unit, rather than as an indivisible data block, as has been previously considered. This paper conducts research by the model CD-PI-A (classification of data, processing data into information, and assessment), which is developed to class data, weigh it, and assess the information quality. Data quality is considered to be a dependent factor of (1) the degree of usefulness of the data and (2) the data composition.
The applicability of this model is presented through the processing analysis of two organizational forms. These forms are considered as the communication channel which contains requested data. The message is communicated between a sender and a recipient. Once the message is received, the data is transformed into information. The policy, proceedings, and regulations of the organization constitute the context in which communication is done.
In summary, the main contributions of this paper are as follows:
  • The results suggest that this new representation of the data input should be considered in the evaluation of information quality output from a communication system (CS). With the application of the CD-PI-A model developed here, we show that it is possible to pursue and achieve the same objective with two different documents. Thus, it is possible to capture the same information content with a smaller amount of data and produce a better quality of information;
  • This new representation and model for evaluating data and information should help highlight the necessity of the consistent use of data and information terminology;
  • This study shows that, for the already established attributes, a new classification should be considered, according to the moment when the analysis process is made;
  • From the applicability of the CD-PI-A model, we found that the quality of information output can increase without necessarily having a corresponding increase in the quantity of data input.
The remainder of this article is organized as follows: in Section 2, the main case of analysis, an application form is presented. Then, in Section 3, the CD-PI-A model is developed. In Section 4, the results, and its respective discussions are presented. Finally, in Section 5, we present our main conclusions and perspectives for further research.

2. Case of Analysis

The presented case corresponds to the processing of a printed application form (here called F1–00), which flows through the CS of a higher-education institution. Its objective, according to institutional policies, is to grant (or deny) access of a certain installation belonging to the institution. The application form can be filled out by an internal user (belonging to the institution) or an external user (as a guest).
The F1–00 application form is comprised of 32 fields in total, divided into eight sections (as shown in Table 1). The application form consists of open, closed, and multiple-choice fields to fill out. For this analysis, each field was considered as one data unit. The document must pass through two different departments. In these departments, there are three stations that the document must go through to be processed. A station is understood as the point where du is transformed into semi-processed information (IU), since the person who processes the document makes a change to the process. The first station is where the user or the department secretary fills out the application form with the user data. The second station corresponds to the department director responsible for granting or denying access to the requested installation. Finally, the third station corresponds to the security department that verifies and ends document processing. Semi-structured interviews were conducted with the responsible document processors. From these interviews, du were classified according to their characteristics (as will be described in Section 3) and are presented in Table 1.

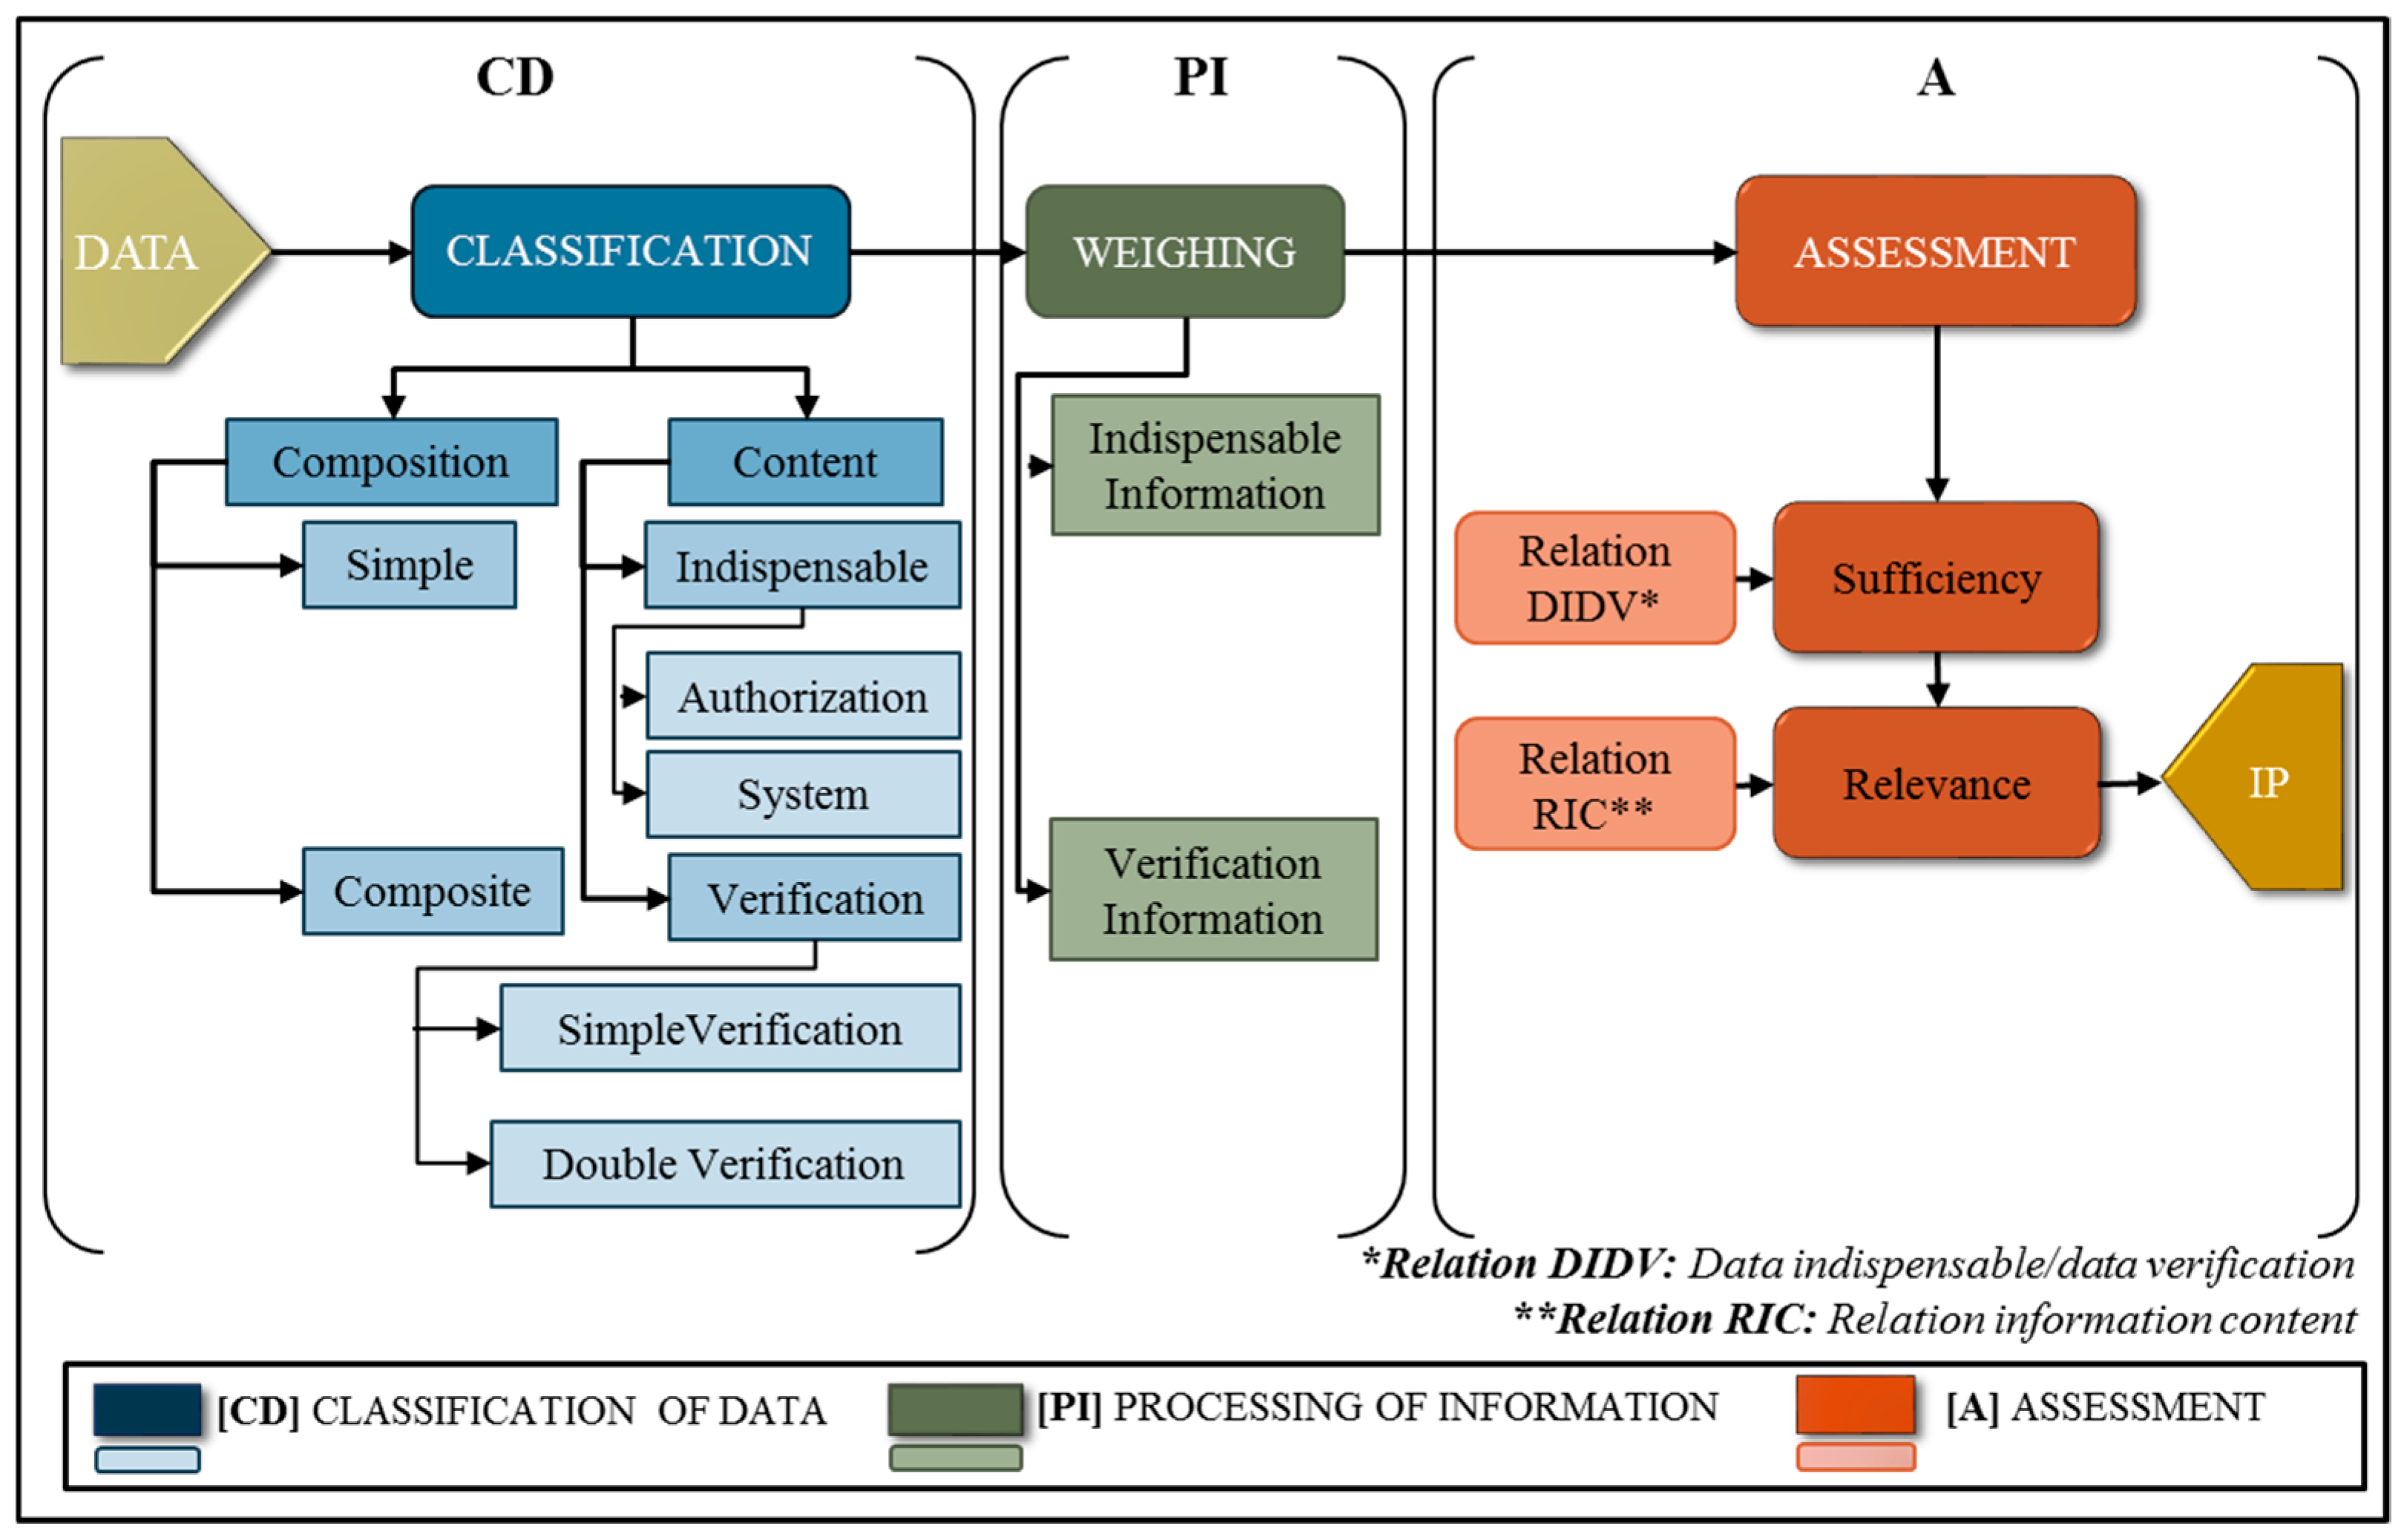
3. Model of Information Quality Assessment: CD-PI-A

The purpose of the model CD-PI-A is to explore the effectiveness of representing the composition of data in information quality assessment. This model is comprised of three phases: (1) classification of data [CD], (2) processing data into information [PI], and (3) assessment of information quality [A], as shown in Figure 1.
Regarding the CS from the context of the MI approach, it is possible to distinguish three main stages in the data processing: (1) the raw material at the entrance (data); (2) the processing period, where data is transformed into pre-processed information. It is considered to be pre-processed as the information that passes from one phase will be the raw material for the next phase, until the end of the process; and (3) the finished product—the information products obtained at the output of the system.
This model initially considers the distinction between the data and information concepts. Here, data has been defined as a string of elementary symbols [24] that can be linked to a meaning related to communication and can be manipulated, operated, and processed [25], and information [26,27] has been defined as a coherent collection of data, messages, or signs, organized in a certain way that has meaning in a specific human system [28]. In addition, we assume that (1) the communication system works technically well, (2) the office document referred to is a form that belongs to an administrative process, (3) this form is the communication channel in the simplest information system (see reference [29]), and (4) the form flows inside an organization according to its objectives and policies.

3.1. Classification of Data (CD)

Classification involves the process of grouping data into different categories according to similar characteristics [30]. Data is tagged and separated in order to form the groups. In this case, tags are put onto form fields. The classification is made in accordance with the results of semi-structured interviews with the processors of the form. The processors are considered to be skilled and experienced workers in information product manufacturing.
The fields (data collectors) are each recognized as a unit that will host one datum. We consider two types of data representation criteria. It is assumed that each type is associated with a fixed value. The first criterion is its composition. The composition representation has one sub-classification: (1) simple (or pure) data, which considers one symbol to contain only one word; one phrase; one choice box; or, in general, one unit corresponding to one and only one piece of data; and (2) composite data, which is a compound of more than one simple piece of data (more extensive explanation below). The second criterion is its content, which corresponds to the degree in which it is placed, according to importance and frequency-of-use scales. Likewise, the content representation has one sub-classification: (1) indispensable data, which corresponds to data that is absolutely necessary; and (2) verification data, which is used to check the indispensable data. For this second criterion, the order system and the frequency of use are facts dependent on the context. In an office document, the objectives and proceedings, considered as the context, grant the meaning and usefulness levels of the requested data.
We denote TD (total data) as all incoming data units to the system, classifying them as follows:
  • For their composition, the data units can be tagged into two types: (1) simple or (2) composite.
    (1) Simple (Ds). Ds = {Dsi|i = 1, …, I}. This is the set of simple data units, where Dsi is the ith data unit and I is the total number of simple dus. This type of du is composed of one and only one element, such as a name, local identification number, date, signature, and so on. In its transformation into information, the data unit takes the weight value w. The value of w is assigned according to the content classification, which is explained via
    D s   =   w .
    (2) Composite (Dc) Dc = {Dck|k = 1, …, K}. This is the set of data unit composites, where Dck is the kth du and K is the total number of composite data units. This type of data unit is a compound of two or more simple data units, which can be, for example, a registration number, social security number, institutional code, and so on. In its transformation into information, the corresponding weight w is multiplied by the factor x, which depends on the number of simple data (Ds) units that form the composite data unit:
    D c = w x ,
    where
    x   =   s = 1 n D s .
  • For content, the data units are classified into two types of data representation. These two types of data are indispensable and verification data.
From this classification, the weight value, w, is assigned. The weight w is given by the personnel in charge of carrying out the process, since it is assumed that they have the best knowledge of the criteria of data unit importance and the frequencies of use required to process the document. A comprehensive and elaborate case study, presented in reference [31], argues that, through the use of interviews and surveys as a method of analysis, it is possible to examine the factors and the levels of influence of data quality in an organization.
This weight captures the relative importance of a data unit within the process in question. We propose the use of a quantitative scale of discrete values, from 4 to 1, to classify the document fields. The field (or du) is classified according to the importance degree for the document processing and the frequency of its use, where 4 corresponds to very important and always used, 3 to important and always used, 2 to slightly important and not always used, and 1 to not at all important and not always used.
(1)
Indispensable data (DI), DI = {Dia + Dis}. This type of data unit always appears at some stage in the process and can be one of the following two types:
  • Authorization (Dia): Dia = {Diam|m = 1, …, M}. This is the type of indispensable du for authorization, where Diam is the mth data unit and M is the total number of indispensable dus for authorization. This type of du corresponds to the highest value of the weight w, since it is considered to be a very important du for processing. Without this, the system cannot produce the information products. This depends on the approval (or rejection) given by the responsible personnel, according to the policies or organizational procedures.
  • System (Dis): Dis = {Disn|n = 1, …, N}. This is the set of dus indispensable for the system, where Disn is the nth du and N is the total number of indispensable dus in the system. This data type is considered to be important. This du type is essential within the process and, usually, it corresponds to questions such as who, what, when, where, why, and who authorizes. Without them, the processing of information cannot be completed.
(2)
Verification data (DV). DV = {Dv + Dvv}. This du type is found frequently during processing; although, in some cases, document processing is carried out without it. This type of du can be of two types:
  • Simple verification data (Dv). Dv = {Dvs|s = 1, …, S} This is the simple verification du set, where Dvs is the sth du and S is the total number of simple verification dus. Some decision-makers consider it necessary to have this kind of unit to make the decision-making process safer [32]. However, without some of these dus, data can still be processed. This type of du is sometimes used for processing, and it can be considered slightly important;
  • Double verification data (Dvv). Dvv = {Dvvt|t= 1, …, T}. This is the double verification du set, where Dvvt is the tth du and T is the total number of double verification dus. This du type is rarely used to verify essential data and it may be not at all important to processing but, in some cases, they are still requested.

3.2. Processing Data into Information (PI)

In a communication system, there must be a context that serves as a benchmark to determine the pertinence of a du in communication. The manufacturing process of information is considered the transformation of raw material (data) into finished products, information. This transformation is represented by the weighting of data after classification (for composition and content).
Data transformation into information leads us to give a value to the data units that are at the intersection of the composition and content classifications. Therefore, the possible resulting sets are of two types: (1) Ds ∩ Dia; Ds ∩ Dis; Ds ∩ Dv; Ds ∩ Dvv, where the value of the data unit (duv) corresponds to the weight w assigned according to the importance and frequency of use criteria mentioned above; and (2) Dc ∩ Dia; Dc ∩ Dis; Dc ∩ Dv; Dc ∩ Dvv, where the duv corresponds to the weight w multiplied by the x factor. It is clear that all these sets are mutually exclusive.
Finally, at the system exit, information output is the result of the intersections mentioned above and is grouped in the following manner:
  • Indispensable information (II), which is the result of transforming indispensable du (simple or composite, catalogued as either for authorization or for the system transformation) into information through its corresponding duv assignment.
  • Verification information (VI), which is the result of transforming verification du (simple or composite catalogued as either as simple verification or double verification) into information through its corresponding duv assignment.

Data Unit Value (duv)

To determine the data unit value (duv), the combination of both data classifications (composition and content) must be taken as a reference; that is, for its composition (simple or composite data) and for its contents (indispensable or verification). Table 2 shows the values already mentioned.
In a form, there is usually more than just one type of data; therefore, it is necessary to calculate the data unit value for the same dataset. This is called duvset, and it is calculated by the following equation, where f is the frequency of the same type of data:
d u v s e t = f ( d u v ) .
The information relative value (Irel) for the document, as an information product, will result in a value between 0 and 1, where 0 corresponds to a null value and 1 to the total of the information products contained in the document. Ireli, for one type of information, will be calculated from the following equation, where i is the set of same type of data (Dc/Dia, Ds/Dia, Dc/Dis, Ds/Dis, Dc/Dv, Ds/Dv, Dc/Dvv, Ds/Dvv) and DT the total sum of all duvset.
I r e l i = d u v s e t ( i ) D T ( d u v s e t ) .
The cumulative relative information products (Irelacc) calculation is performed according to the following classification:
  • Information products of the indispensable units (II): this type of IP results from indispensable (simple and composite) du. It must be ordered as follows: first, the information derived from the authorization type (Dc/Dia, Ds/Dia); and second, for the system (Dc/Dis, Ds/Dis):
    I I r e l a c c =   I r e l ( I I ) .
  • Information products of the verification units (IV): this type results from simple verification and double verification data units. It must be ordered as follows: first, the information that corresponds to Dc/Dv and Ds/Dv; and second, the information that derives from the double verification du (Dc/Dvv, Ds/Dvv):
    I V r e l a c c =   I r e l ( I V ) .

3.3. Assessment (A)

The last stage of the CD-PI-A model corresponds to the assessment. In order to evaluate the quality of both the data input and the information output, two relationships were developed. These two relationships work as a reference between the real state and the ideal state of the system. They play the role of an indicator of (a) the sufficiency of the requested data (relationship DIDV) and (b) the usefulness of the information gathered through the form (relationship RIC).

3.3.1. Relationship DIDV

The simple ratio as data indispensable/data verification (DIDV) has been used before, to express the desired outcomes to total outcomes [23]. It has been used to evaluate the free-of error, completeness, and consistency [2,33,34]. In this case, the ratio DIDV works as a tool to assess the inbound data unit quality considering the quantity of current data. It indicates, in a simple mode, how many of the verification dus exist in relation to the indispensable dus. Ideally, in order to reduce the extra amount of dus in the data processing and, furthermore, produce a better-quality IP, the form should have a smaller amount of verification dus in relation to indispensable dus. The formal definition of DIDV is as follows:
D I D V = 1 : ( D V ) ( D I ) .

3.3.2. Relationship RIC

The relation information content (RIC) allows us to know the quality of the information content at the output of the system once the transformation of du into an IP is made. The RIC relation considers not only the content but also the du composition. This relation expresses, in terms of information, what portion of it is relevant to the aim pursued. Given a comparison between two scenarios of the same form, the one with the lower value represents the best option, as fewer requested fields are used to verify the indispensable information. This ratio is calculated from the following equation:
R I C = I V r e l a c c I I r e l a c c .

4. Results and Discussion

Once the data were classified and organized according to their composition and content (Table 3), the d u v was assigned. In form F1–00, two redundant fields were detected. This was possibly due to the structure and organization of the form; the two fields were student ID and employee ID. For our analysis, these two fields were in one instance considered as indispensable data and the rest of the time as double verification data, as it was required only once to carry out the processing.
As shown in Table 3, in F1–00 there are six indispensable du and 26 verification du, which leads to a DIDV 1:4.33 ratio. This is to say, that for each indispensable data that is requested, there are four data units used to verify it. The current structure and design of the form contributes to the generation of data overload in the information manufacturing system. In this case, the data quality attribute of sufficiency is, consequently, not achieved. Unless a security information criterion exists, this relation can be improved by making the relation between different factors shorter. If a security information aspect is not what led to this ratio of 1:4.33, it is necessary to consider form re-engineering in the structure and field composition to request such data. If the organization continues to use the present form, it will continue to contribute to data overload problems in the system.
Regarding the RIC relationship, which considers, in addition to the content, the composition that generates this information, the F1–00 form has 0.57 information productss of a verification type (IVacc), and 0.43 information productss of an indispensable type (IIacc). According Equation (9), the RIC is equal to 1.32. Ideally, this value should be equal to or less than 1, because the form should request the same amount or less verification information than that of the indispensable type. This relationship works as an indicator of the relevant information content in the CS.
Due to the results of both relationships, it strongly recommended that the form is re-designed. In this case, we present an alternative.

4.1. Re-Engineering

As the proceedings for the F1–00 did not establish any set-points regarding extreme security concerns about data gathering, following the document processor’s recommendations, we propose a new design for this form. The new design was called F1–01, which is comprised of three main sections: (I) identification, (II) status, and (III) authorization; five fewer sections than the original. Furthermore, the new form is comprised of 16 fields in total.
If the document is chosen to be computerized, then the fields are proposed as drop-down menus. If it is chosen to be in paper format, multiple-option questions are proposed. At a data unit level, in an efficiency assessment we would get a higher value simply by reducing the amount of du. At an information product level, due to its contextual aspect, it is necessary to follow the DC-PI-A model in order to assess its quality. Once the results are obtained, it is possible to observe the impact of representing the du composition in the assessment of the information quality.
Table 4 shows the data classification and its corresponding transformation into information for the F1–01. A total of 100% of the du in the F1–00 form was taken as a reference to calculate the F1–01 form.
As shown in 
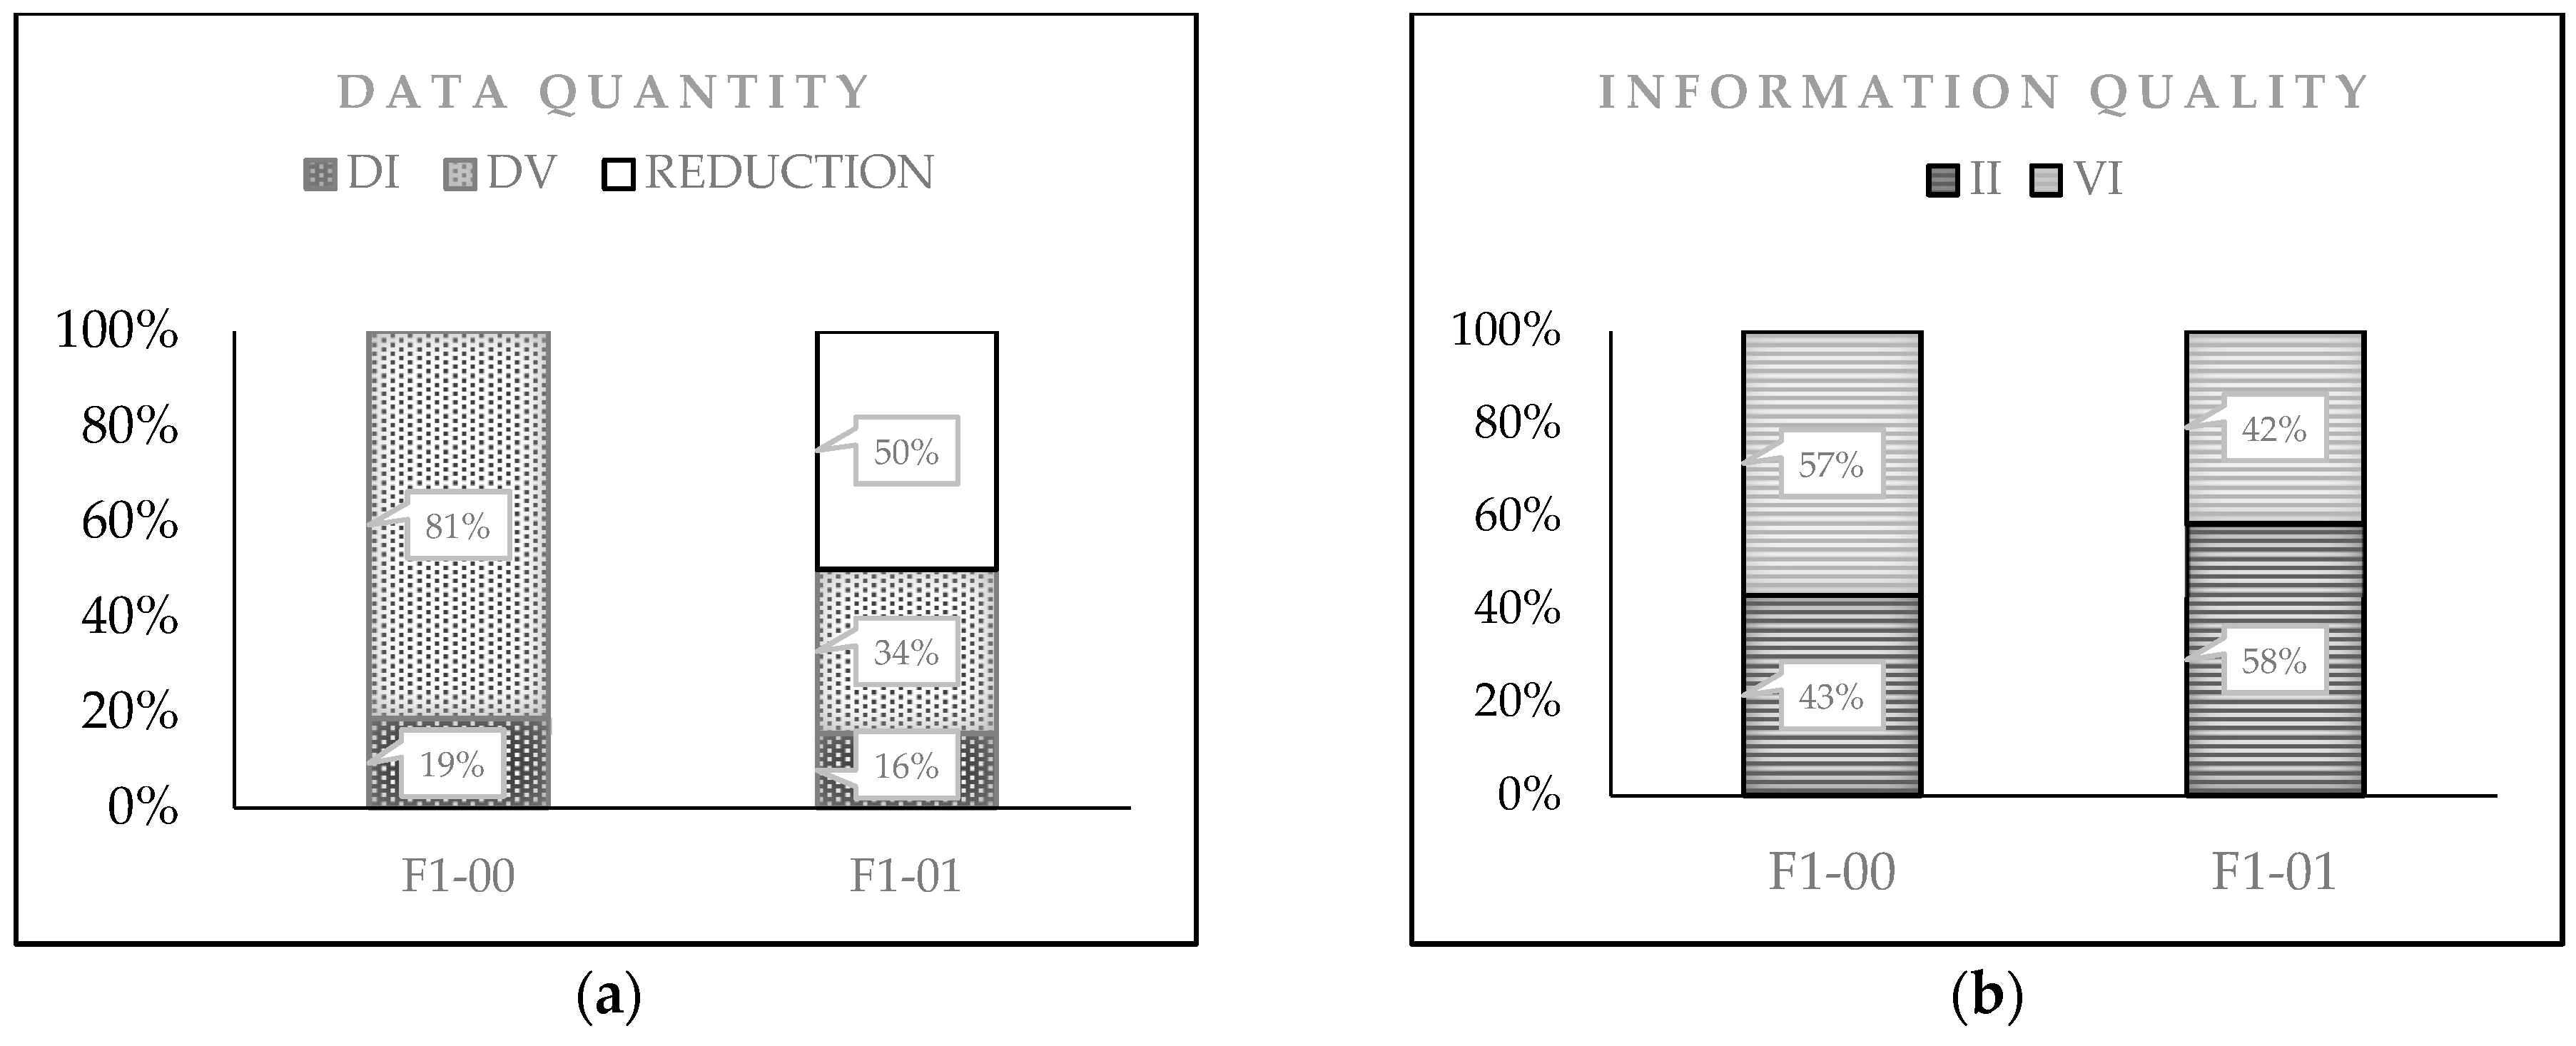
Table 4, in the F1–01 form, five dus correspond to indispensable data. These represent 16% (31% of 50%) of the content that was retained in the document. The 11 remaining dus represent 34% (69% of 50%) of the same. In the case of the information products, 58% of the preserved fields represent indispensable information, while 42% remained as verification information.
With the new streamlining of the form, it is possible to (1) reduce the data requested, (2) enhance the information quality produced, and (3) improve the efficiency of the CS. This finding, while preliminary, suggests that a reduction of data does not necessarily mean an improvement in quality of information but a change in the composition of the dus do. Additionally, this implies that the quality of information output can increase without necessitating a corresponding increase in the quantity of the data input.
As shown in Figure 2, the inbound du amount into the system was reduced by 50% in the F1–01 form. This reduction was achieved due to the four major modifications made to the document. In the first place, the redundant fields were eliminated: in the F1–00 form, there were eight different fields asking for the same du type. In the second place, in the F1–00 form two dus that were considered as indispensable and simple data (first name and last name) were merged in the F1–01 form, becoming only one indispensable composed du. The way to convert these du from simple to composite (2 Ds times w) was by writing in the same field (with a low ink saturation) the format in which it is expected to become the new du (last name/first name). In the third place, the computerization of the document considers the possibility of using drop-down menus to select a choice among those already established. The F1–01 form has fewer open fields and more multiple-option fields. Finally, in the fourth place, as a consequence of this type of menu, now there are more explanatory texts that attempt to clarify and specify to the user the requested du.
With regard to the two proposed relationships (DIDV and RIC) to evaluate the du input and information output (see Table 5), we can mention the following.
First, the DIDV relation for the F1–00 is equal to 1:4.33 and, for F1–01, this same relation is equal to 1:2.2. In the current study, comparing both results shows that with the new streamlining of the form, the ratio was cut in half. This new design of the form uses only two fields to verify every one. This certainly leads to an improvement in the efficiency of the organization’s information system.
Second, for the RIC ratio, the result for the F1–00 form was 1.32 and the result for the F1–01 was 0.71. Due to the proposed re-engineering, the RIC ratio for the F1–01 is less than 1. This means that there was less information to verify than indispensable information to achieve the process.
The difference in percentage points of the relevant (or indispensable) information quality between the F1–00 and F1–01 forms was 15 points (43% versus 58%). Accordingly, we can infer that the information quality was improved by 15%. What is most interesting is that we pursued the same objective with both forms (the F1–00 and F1–01); both forms achieved the same purpose and captured the same content information and, yet, the second form contained a smaller amount of data and, therefore, a better quality of information.
Below is presented another applicability case where the requested fields have a different characterization in their classification.

4.2. Another Example of Applicability

The form FIAP–00 has as objective to recollect and summarize all needed data for a research project within an educational institution. The FIAP-00 alternates its format on paper and in electronic within the CS. The document is an internal communication medium; therefore, there are no external agents involved in the information-product manufacturing system. FIAP–00 application form is comprised of 79 fields in total divided into four sections. The application form consists of open, closed, and multiple-choice fields to fill out. The document must pass through five different interchange stations belonging to three different departments. In department 1, the first station is where the agent a fills out the application form with the project data. In department 2, the second station is where the agent b fills out the budget data of the project. The form returns to department 1 where the next two stations are; the third station corresponds to the agent c who fills out another project data; and agent d corresponds to the department director, responsible for granting the authorization. Finally, in department 3, the fifth station corresponds to the agent e, who verifies and ends document processing. In the case of the FIAP-00 form, fields are not promptly mentioned for safety reason but in Table 6 their classification and transformation into information phases are presented.
Once the data were classified and organized according to their composition and content (Section 3), the d u v was assigned. In form FIAP–00, no double verification data were detected. Table 6 shows the data classification with its corresponding weighting, information relative value (Irel), and accumulated information relative value (Irelacc), from Equations (4)–(7). Because there are different composite data in the form and to make clearer the data transformation into information process, in Table 6 two columns were added: factor x, which corresponds to Equation (3), and weight w, which correspond to Table 2.
Unlike the F1–00, the form FIAP–00 has more Dc/Dis than Ds/Dv type. The DIDV relation for the FIAP–00 results in 1:0.72; this means that there was less than one data to verify the indispensable information to achieve the process. In the case of the RIC relationship, the FIAP–00 form is equal to 0.24. This means that only one quarter of the fields are used to verify the indispensable information. In the FIAP–00 case, to have more Dc/Dis types, it helps to have a higher quality information channel in the CS. The combination of these findings provides some support for the conceptual premise that the data representation as either simple or composite in the information quality assessment is relevant.
The results of this study imply several benefits for organizations. In the first place, it reinforces the fact that the document has sufficient data for its processing. In the second place, this analysis helps to mitigate problems, such as data overload, that affect the majority of organizations. In the third place, the analysis leads to an improvement in the efficiency of the organization’s information system. In the fourth place, it generates a new method for monitoring the quality of the data input and information output.
The F1–00 form possibly contributes to generating the effects of data overload [35,36] in workers and to the accumulation of an excess of useless data within the information system. This action, in the end, leads to wastes of material, human, and financial resources. On the contrary, with the use of the F1–01 or FIAP–01, the organization could contribute to decreasing the data overload of the manufacturing information system, making it more efficient and environmentally friendly.

4.3. Comparison with Previous Work

The CD-PI-A model presented in this paper is distinguished from others models that use the manufacturing of information or information as a product [2,7] approach as a reference according to the following characteristics:
  • Reports that had used the manufacturing of information approach generally used the terms data and information interchangeably, giving them the same value at the entrance and at the exit of the system [2,21,37,38,39]. Very few reports were found that made a distinction between these two terms [5,12], and those that did were only at a conceptual level. The fact of addressing the information at the same level of data leads us to consider the system by which the flow of data acts more like a transmission than a communication system. In this paper, we established, to the extent possible, the distinction between these two concepts in order to avoid misunderstandings and to be consistent with the proposal. The criterion to underline the difference between these two concepts was to use the terms according to the processing moment in which they were applied.
  • With regards to the proposal of reference [12], where information was considered as an output of a communication system, different alternatives for measuring the information were presented. Three levels of information were considered: technical, semantic, and pragmatic, and a fourth level, the functional, was also added. Regarding the semantic aspect, it was mentioned that the information could be measured by the numbers of meaningful units between the sender and receiver. However, a method to carry it out was not presented. For our part, we propose a method to evaluate the semantic level, which considers the information as an output of the CS.
  • Additionally, in contrast to previous reports [2,11,40] that considered the document as a data unit, this research considers one document as a data block container of several data units, dus, that are represented according to their distinctive properties. The distinction among these dus is established through a classification, in accordance with their composition and content. This representation creates a distinction between data quantification and information assessment. Furthermore, it considers that data input and data output could be useful in a technical analysis of data transmission. However, the vision of data input and information output implies that, in the quality information assessment, the finished product has a different value than the initial raw material.

5. Conclusions

The present study was designed to explore the effectiveness of representing data as composite entities rather than indivisible blocks in the manufacturing of information domain, in order to assess the quality of information produced.
In order to evaluate this effectiveness, the authors opted to integrate a communication system vision into the manufacturing information approach in order to establish a new data classification method that considered the context in which this information was produced.
Based on this approach, a new model to evaluate the information product quality was developed: the DC-PI-A model. This model uses three stages: data classification (DC), processing of data into information (PI), and quality assessment (A). In the first stage, data are classified according to their usefulness and composition. In the second stage, the previous classification data are weighted in order to process them. In the third stage, in order to conduct the assessment, two relationships are proposed. These relationships work as indicators of the attributes mentioned below.
The relationship DIDV works as an indicator of the sufficiency of the input data. In an investigation, with the application of this relationship and the new streamlining of a form, 50% of the input data to a system was reduced. The relationship RIC works as an indicator of relevance of information output of the system. In our case, the comparison between the original form F1–00 and the re-designed form F1–01 showed that the quality of information, in relation to its relevance, could be improved by 15%.
We pursued the same objective with different forms (F1–00 and F1–01), where both forms achieved the same purpose and captured the same information content, yet the second form contained a smaller amount of data and, therefore, had better quality of information. Additionally, it was shown that by using more composite type data (FIAP–00) it can be possible to have higher information quality channels within the CS.
The results of this investigation show that both the content and the composition of data (among other factors) are important aspects of determining the value of the information; value that, in the end, will have an impact on the quality of the whole communication and information system. We found that the relation between data quantification and information quality evaluation is not just a “simple” positive correlation. The quality of information output can increase without there necessarily being any corresponding increase in the quantity of the data input.
This new representation and model for evaluating data and information should help to highlight the necessity of consistent use of data and information terminology. In the information era, it is not possible to continue to use these two terms as synonyms. Once delimiting this distinction, users can treat their data in a more conscious and responsible way.
This study shows that the attributes already established should be considered as a new classification. This new classification should be applied at the moment of the process when the analysis is made. If it is at the beginning of the process, the entities must be treated as data and have to be evaluated with data quality attributes (in this case, sufficiency). If it is at the exit of the system, the entities must be treated as information and have to be evaluated with an information quality attribute (in this case, relevance).
Additionally, this study has raised important questions about the nature of the design of forms. This should be a matter of content more than an aesthetic issue. Inside an organization, the forms should respond to the particular business requirements, where the context determines the meaning.
The scope of this study was limited to exploring only two attributes of quality: sufficiency and relevance. Further work will need to be done to determine more accurate information values from this same approach. We wish to include other attributes, such as accuracy, completeness, or timeliness. Additionally, including the syntactic and pragmatic levels of information would be valuable. Likewise, as one external reviewer suggested, the inter-connection between the DB concept, here presented, and the data granularity linked with different types of documents may be of interest.
The findings of this study have a number of practical implications in the field of information management. One example of these implications would be the development of new methodologies to evaluate the IQ. These methodologies could be converted into tools for business management. These tools would be used to design better forms that gather useful and sufficient data. All these changes would lead us, in general, to have more efficient and environmentally friendly information manufacturing systems.
We hope our study exploring the effectiveness of representing data as composite units will introduce some guidelines for further research and will inspire new investigations in the same field but at a more detailed level.

Author Contributions

M.B.-L. developed the approach and model, managed the data, and wrote the manuscript draft. R.H. contributed to the original idea of data classification and the relationship with the data overload problem. M.G. contributed to the original idea, the data classification weighting, information ordering analysis, and reviewed the manuscript draft. R.R.-L. reviewed the manuscript draft. R.D.-S. reviewed each section draft in detail and the coherence of the manuscript draft in general.

Funding

This research received no external funding.

Acknowledgments

The authors thank financial support of the PRODEP and SEV programs. The authors also would like to thank Prasun Lala, Christine Richard, and the external reviewers for their valuable comments.

Conflicts of Interest

The authors declare no conflict of interest.

References

  1. IBM Big Data and Analytics Hub. Extracting Business Value from the 4 V’s of Big Data. Available online: https://www.ibmbigdatahub.com/infographic/extracting-business-value-4-vs-big-data (accessed on 24 April 2019).
  2. Ballou, D.P.; Wang, R.; Pazer, H.; Tayi, G.K. Modeling Information Manufacturing Systems to Determine Information Product Quality. Manag. Sci. 1998, 44, 462–484. [Google Scholar] [CrossRef]
  3. Arnold, S.E. Manufacturing: The Road To Database Quality. Database 1992, 15, 32–39. [Google Scholar]
  4. Huh, Y.; Keller, F.; Redman, T.; Watkins, A. Data quality. Inf. Softw. Technol. 1990, 32, 559–565. [Google Scholar] [CrossRef]
  5. Ronen, B.; Spiegler, I. Information as inventory: A new conceptual view. Inf. Manag. 1991, 21, 239–247. [Google Scholar] [CrossRef]
  6. Wang, R.Y.; Strong, D.M. Beyond Accuracy: What Data Quality Means to Data Consumers. J. Manag. Inf. Syst. 1996, 12, 5–33. [Google Scholar] [CrossRef]
  7. Wang, R.Y.; Lee, Y.W.; Pipino, L.L.; Strong, D.M. Manage Your Information as a Product. Sloan Manag. Rev. 1998, 39, 95–105. [Google Scholar]
  8. Wang, Y.R.; Madnick, S.E. A Polygen Model for Heterogeneous Database Systems: The Source Tagging Perspective. In Proceedings of the 16th International Conference on Very Large Data Bases, Brisbane, Australia, 13–16 August 1990; pp. 519–538. [Google Scholar] [CrossRef]
  9. Wang, R.Y. A Product Perspective on Total Data Quality Management. Commun. ACM 1998, 41, 58–65. [Google Scholar] [CrossRef]
  10. Shankaranarayanan, G.; Blake, R. From Content to Context: The Evolution and Growth of Data Quality Research. J. Data Inf. Qual. 2017, 8, 1–28. [Google Scholar] [CrossRef]
  11. Shankaranarayanan, G.; Cai, Y. Supporting data quality management in decision-making. Decis. Support Syst. 2006, 42, 302–317. [Google Scholar] [CrossRef]
  12. Masen, R.O. Measuring Information Output a communication systems approach. Inf. Manag. 1978, 1, 219–234. [Google Scholar] [CrossRef]
  13. Juran, J.M. Juran on Leadership for Quality; Free Press: New York, NY, USA, 1989. [Google Scholar]
  14. Deming, W.E. Out of the Crisis; MIT Press: Cambridge, MA, USA, 1986. [Google Scholar]
  15. Batini, C.; Scannapieco, M. Data and Information Quality—Dimensions, Principles and Techniques; Springer: Berlin/Heidelberg, Germany, 2016. [Google Scholar]
  16. Bovee, M.; Srivastava, R.P.; Mak, B. A conceptual framework and belief-function approach to assessing overall information quality. Int. J. Intell. Syst. 2003, 18, 51–74. [Google Scholar] [CrossRef]
  17. Wand, Y.; Wang, R.Y. Anchoring data quality dimensions in ontological foundations. Commun. ACM 1996, 39, 86–95. [Google Scholar] [CrossRef]
  18. Ballou, D.P.; Pazer, H.L. Modeling completeness versus consistency tradeoffs in information decision contexts. IEEE Trans. Knowl. Data Eng. 2003, 15, 241–244. [Google Scholar] [CrossRef]
  19. DeLone, W.H.; McLean, E.R. Information Systems Success: The Quest for the Dependent Variable. Inf. Syst. Res. 1992, 3, 60–95. [Google Scholar] [CrossRef]
  20. Jarke, M.; Lenzerini, M.; Vassiliou, Y.; Vassiliadis, P. Fundamentals of Data Warehouses; Springer: Berlin/Heidelberg, Germany, 1999. [Google Scholar]
  21. Michnik, J.; Lo, M.C. The assessment of the information quality with the aid of multiple criteria analysis. Eur. J. Oper. Res. 2009, 195, 850–856. [Google Scholar] [CrossRef]
  22. Redman, T.C. The impact of poor data quality on the typical enterprise. Commun. ACM 1998, 41, 79–82. [Google Scholar] [CrossRef]
  23. Pipino, L.L.; Lee, Y.W.; Wang, R.Y. Data Quality Assessment. Commun. ACM 2002, 45, 211. [Google Scholar] [CrossRef]
  24. Meadow, C.T.; Yuan, W. Measuring the impact of information: Defining the concepts. Inf. Process. Manag. 1997, 33, 697–714. [Google Scholar] [CrossRef]
  25. Yu, L. Back to the fundamentals again. J. Doc. 2015, 71, 795–816. [Google Scholar] [CrossRef]
  26. Bawden, D.; Robinson, L. A few exiting words: Information and Entropy revisited. J. Assoc. Inf. Sci. Technol. 2015, 66, 1966–1987. [Google Scholar] [CrossRef]
  27. Robinson, L.; Bawden, D. Mind the gap: transitions between concepts of information in varied domains. In Theories of Information, Communication and Knowledge; Ibekwe-SanJuan, F., Dousa, T.M., Eds.; Springer: Berlin/Heidelberg, Germany, 2013; pp. 121–141. ISBN 978-94-007-6973-1. [Google Scholar]
  28. Ruben, B. Communication and Human Behavior; Prentice-Hall: Upper Saddle River, NJ, USA, 1992. [Google Scholar]
  29. Denning, P.J.; Bell, T. The information paradox. Am. Sci. 2012, 470–477. [Google Scholar] [CrossRef]
  30. Han, J.; Pei, J.; Kamber, M. Data Mining: Concepts and Techniques, 3rd ed.; Elsevier: Boston, MA, USA, 2012. [Google Scholar]
  31. Tee, S.W.; Bowen, P.L.; Doyle, P.; Rohde, F.H. Factors Influencing Organizations to Improve Data Quality in their Information Systems. Account. Finance 2007, 47, 335–355. [Google Scholar] [CrossRef]
  32. Ackoff, R.L. Management Misinformation Systems. Manag. Sci. 1967, 14, 147–156. [Google Scholar] [CrossRef]
  33. Ballou, D.P.; Pazer, H.L. Modeling data and process quality in multi-input, multi-out- put information systems. Manag. Sci. 1985, 31, 123–248. [Google Scholar] [CrossRef]
  34. Redman, T.C. La qualité des données à l’âge de l’information; InterÉditions: Paris, France, 1998. [Google Scholar]
  35. Eppler, M.J.; Mengis, J. The concept of information overload: A review of literature from organization science, accounting, marketing, MIS, and related disciplines. Inf. Soc. 2004, 20, 325–344. [Google Scholar] [CrossRef]
  36. Edmunds, A.; Morris, A. The problem of information overload in business organisations: A review of the literature. Int. J. Inf. Manag. 2000, 20, 17–28. [Google Scholar] [CrossRef]
  37. Lee, Y.W.; Strong, D.M.; Kahn, B.K.; Wang, R.Y. AIMQ: A methodology for information quality assessment. Inf. Manag. 2002, 40, 133–146. [Google Scholar] [CrossRef]
  38. Kaomea, P.; Page, W. A flexible information manufacturing system for the generation of tailored information products. Decis. Support Syst. 1997, 20, 345–355. [Google Scholar] [CrossRef]
  39. Botega, L.C.; de Souza, J.O.; Jorge, F.R.; Coneglian, C.S.; de Campos, M.R.; de Almeida Neris, V.P.; de Araújo, R.B. Methodology for Data and Information Quality Assessment in the Context of Emergency Situational Awareness. Univers. Access Inf. Soc. 2016, 889–902. [Google Scholar] [CrossRef]
  40. Shankaranarayanan, G.; Wang, R.Y.; Ziad, M. IP-MAP: Representing the Manufacture of an Information Product. In Proceedings of the 2000 Conference on Information Quality, Cambridge, MA, USA, 20–22 October 2000; pp. 1–16. [Google Scholar]
Figure 1. The classification of data, processing data into information, and assessment (CD-PI-A) model.
Information 10 00156 g001
Figure 2. (a) Data quantification comparison and (b) quality of produced information for the two forms. Left bar of both graphics: F1–00. Right bar of both graphics: F1–01.
Information 10 00156 g002
Table 1. (Form F1–00). Structure and du classification according to their characteristics. Ds = simple data; Dc = composite data; Dia = indispensable data for authorization; Dis = indispensable data for the system; Dv = simple verification data; and Dvv = double verification data.
Section No.Section NameData ID.DataData Classification
1Identification1Last nameDs/Dis
2First nameDs/Dis
3Home phoneDs/Dv
4Work phoneDs/Dvv
5Extension phoneDs/Dvv
2Paid Employee6Employee IDDc/Dis
7Student IDDc/Dis
8Multiple choice 1Ds/Dv
3Paid Partial Time Teaching9Employee IDDs/Dvv
10Student IDDs/Dvv
11Multiple choice 2Ds/Dv
12Class nameDs/Dv
13Beginning dateDs/Dvv
14End dateDs/Dvv
4Paid Researcher15Employee IDDs/Dvv
16Student IDDs/Dvv
5Student by Session17Student IDDs/Dvv
18Multiple choice 3Ds/Dv
19Club nameDs/Dv
20TutorDs/Dv
21Other specify 1Ds/Dv
6Other (Unpaid or non-students)22Temporal IDDc/Dis
23Multiple choice 4Ds/Dv
24Other specify 2Ds/Dv
25SponsorDs/Dv
26Reason 1Ds/Dv
7Locals27Local numbersDs/Dis
28Expiration dateDs/Dis
29Access out hoursDs/Dv
30Reason 2Ds/Dv
8Authorization31SignatureDs/Dia
32DateDs/Dv
Table 2. Data unit value (duv) for simple data, corresponding to the weight w (which is related to its content). Dia: indispensable data for authorization; Dis: indispensable data for the system; Dv: simple verification data; Dvv: Doble verification data.
Attribute Contentw
Dia4
Dis3
Dv2
Dvv1
Table 3. Data classification and weighting. Frequency of accumulated data according information type zone (Dacc), relative frequency of accumulated data according information type zone (Drelacc), information relative value (Irel), and accumulated information relative value (Irelacc) for the F1–00 form.
Information TypeData TypefDaccDrelacc d u v d u v s e t IrelIrelacc
IIDs/Dia1 440.05
Signature
Dc/Dis1 15150.21
Student ID or employee ID or other ID
Ds/Dis460.193120.170.43
Last name, first name, locals, expiration date
IVDs/Dv15 2300.42
Home phone, multiple choice 1, multiple choice 2, class name, multiple choice 3, club, tutor, other—specify 1, multiple-choice 4, other specify 2, sponsor, raison 1, access out, raison 2, date
Ds/Dvv11260.811110.150.57
Work phone, ext-phone, beginning date, end date, redundant IDs (seven times)
Table 4. Data classification and its transformation into information, frequency of accumulated data according information type zone (Dacc), relative frequency of accumulated data according information type zone (Drelacc), information relative value (Irel), and accumulated information relative value (Irelacc) for the F1–01 form.
Information TypeData TypefDaccDrelaccduvduvsetIrelIrelacc
II Ds/Dia1 410.08
Signature
Dc/Dis1 15150.28
Student ID or employee ID or other ID
Dc/Dis1 660.11
Last name/first name
Ds/Dis250.16360.110.58
Locals, expiration date
VI Ds/Dv11110.3422220.420.42
Contact phone, phone type, satatus 1, status 2-A, out hours, specify hours, status 2-B, class name, club or tutor or another name, specify another date
n/aDs/Dvv-------
TOTALS 160.50 53 1.00
Table 5. Results for the relations data indispensable/data verification (DIDV) and relation information content (RIC) of the forms F1–00 and F1–01.
FormRelation DIDVRelation RIC
F1–001:4.331.32
F1–011:2.20.71
Table 6. Data classification and its transformation into information for the form FIAP–00.
Information TypeData TypeFactor xwfDaccDrelaccduvduvsetIrelIrelacc
IIDs/Dia 42 480.02
Dc/Dis1131 33330.10
931 27270.08
731 21210.06
632 18360.11
531 15150.04
431 12120.03
331 990.03
231 660.02
Ds/Dis 335460.5831050.310.80
VIDs/Dv 233 2660.20
Ds/Dvv 10330.421000.20
TOTALS 791.00 3381.001.00

