Abstract
The implementation of ubiquitous learning (u-learning) is a good opportunity to address the affordability, accessibility, and quality issues of the higher education sector that are present in many countries. However, its broad application is still limited within the instructionist paradigm. Improving its implementation performance is a challenge for researchers and practitioners. This study aimed to understand the readiness and success status of u-learning implementation in Indonesia and to assess factors influencing the status based on stakeholder perspectives. A mixed methods inquiry with the sequential nested strategy was carried out by focusing on a quantitative analysis. The findings revealed that the readiness constructs influence u-learning performance. The study may contribute, theoretically and practically, to future studies, especially u-learning implementation studies, from the perspective of a developing country.
1. Introduction
Inevitably, mobile technology use among developing countries has been increasing since the last decade [1]. The subscription rate of cellular technology per 100 inhabitants is more than 100, and more than 80 of those 100 are Internet users. This technology has contributed to enabling the development of higher education in various countries [2,3]. This is related to affordability, accessibility, and quality issues in education [4]. One of the implementation trends in this sector is u-learning. Virtanen, et al. [5] described it as being similar to mobile learning (m-learning) or electronic learning (e-learning) in terms of the learning context. The difference is in regard to the technology used [5]. In this case, e-learning refers to the interactivity and personalization of the learning aspects of computer network technology; m-learning extends this with the mobility aspects by using mobile devices; and u-learning covers both learning systems with context awareness and flexibility aspects of mobile technology. A number of studies (e.g., [5,6,7]) explain that u-learning is like the next generation of m-learning. Despite the fact that using u-learning does not guarantee outcomes of learning activities, it is like a catalyst to improve the affordability, accessibility, and quality of the learning process [4,8]. A meta-analysis study by Pimmer, Mateescu and Gröhbiel [6] confirmed findings of previous studies [9,10], that is, that the use of mobile technology for educational purposes has shown positive learning outcomes.
Unfortunately, despite the use of ubiquitous technology in education being proven to have a positive effect on learning outcomes, its broad application in higher education is still limited [6]. In addition, Pimmer, Mateescu and Gröhbiel [6] also indicated that the expected higher education transformation is still unconfirmed, because most studies on the topic tend to employ instructionist paradigms. Not only among developing countries, but even in other countries, attaining benefits may also still be a challenge among higher education institutions (HEIs). Chan and Reich [11] and Subiyakto and Ahlan [12] revealed that in order to obtain technology implementation benefits, the first challenge is how to be successful in the implementation. Conversely, failure of implementation will bring losses or even influence business operation continuity [13]. This may be related to the digital divide issue [6,14,15]. A statistical report by International Telecommunication Union (ITU) [1] demonstrated that despite the fact that the number of mobile users in developing countries has been increasing significantly since the 2000s, this has not resulted in Internet subscription growth. Beringer, et al. [16], Davis [17], and Subiyakto, et al. [18] noted that technological implementation performance may also refer to stakeholder perceptions. Many previous studies about information technology (IT) implementation success [19,20,21,22,23,24] reported that the performance of technology implementation demonstrates the efficiency, effectiveness, user satisfaction, and conformity with a development plan. Referring to Parasuraman and Colby [25], this may relate to technology readiness issues.
With respect to the above-mentioned phenomenon, this study aimed to understand the readiness and success status of u-learning implementation and to assess factors influencing the status. An understanding based on the perspectives of involved stakeholders and an assessment following the research model were the objectives of the study. The expectations were that the findings could be among the theoretical points regarding the readiness and success of u-learning implementation from the Indonesian HEI perspective in particular. We hope that the findings can offer practical help to stakeholders for implementation in the sampled institution. In order to guide the research process, two research questions were asked:
- How can we know the status of the readiness and success of u-learning implementation?
- What are the factors influencing the readiness and success of u-learning implementation?
This article is divided into six sections. The first section is the introduction and describes the research programs. In the second section, we elucidate a literature review of the topic and present the model and hypothesis of development used in the study. The third section describes the methodological aspects of this mixed methods study. It is followed by the results in the fourth section. In the fifth section, we interpret and discuss the study results, elucidate limitations of the study, and offer suggestions for future work. Lastly, the paper ends with a conclusion.
2. Theoretical Framework
Researchers and practitioners have been interested in the performance constructs of information technology (IT) projects since the early times of the computer-based business era of the 1960s. In that era, efficiency and effectiveness constructs were popular research themes. These themes were then extended into different constructs, such as usability, satisfaction, acceptance, readiness, and success [25,26,27,28,29,30,31,32,33]. The incision, interrelations, and combinations among the constructs can be clearly seen across the above-mentioned extensions, for example, the unified theory of acceptance and use of technology (UTAUT) [34] and technology readiness and acceptance (TRA) [35] models. In short, this is why several scholars [36,37,38] indicated that most information system (IS) models are developed based on prior model theories rather than using empirical research.
In this study, Subiyakto’s [39,40] information system readiness and success (ISRS) model was adopted and adapted in the context of u-learning implementation performance (Figure 1) in terms of continuous model development [41,42]. The model itself was developed by combining Delone and McLean’s [43] IS success (ISS) model and Parasuraman and Colby’s [25] technology readiness index (TRI) model [39,40]. The combination was done following the processional and causal model assumption of the ISS model [43,44,45].
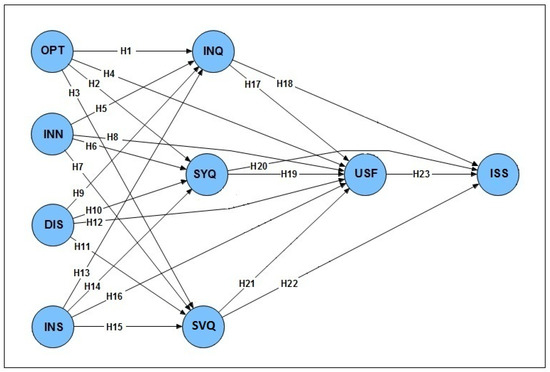
Figure 1.
Research model adopted and adapted from Subiyakto’s [39,40] ISRS model.
Like Delone and McLean’s assumption, which combined the logic of communication [46] and information influence theories [47], the ISRS model was proposed by adopting the above-mentioned logic and combining it with Parasuraman and Colby’s [25] readiness constructs. Subiyakto [39,40] explained that the combination assumption was developed by considering the essential issues of stakeholder readiness in IT/IS projects [12,16,17,18,48,49,50,51] referring to the input–process–output (IPO) logic of Davis and Yen’s [52] information processing theory and the process logic of Kellogg’s [53] model development theory. The readiness constructs of the TRI model [25], namely, optimism (OPT), innovativeness (INN), discomfort (DIS), and insecurity (INS), were then placed in the input dimension of the ISRS model. The four constructs of the ISS model [43], namely, information quality (INQ), system quality (SYQ), service quality (SVQ), and user satisfaction (USF), were then positioned in the process dimension, and the information system success (ISS) construct adapted from the net benefits of the ISS model was used to construct the output dimension. In brief, 23 relational hypotheses of the ISRS model were then proposed based on the assumption of model development (Figure 2).
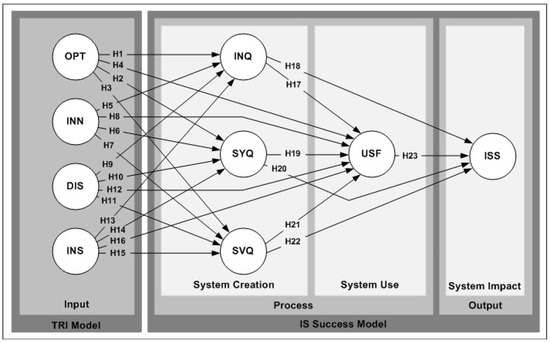
Figure 2.
Hypothesis development of ISRS model following its development assumption [25,39,40,43].
With respect to the research implementation, Table 1 and Table 2 present a list of indicators for each variable and a list of statements used in the questionnaire in the study, respectively.

Table 1.
List of indicators [39,40].
Table 2.
List of questionnaire statements [39,40].
3. Research Methods
This mixed methods study was conducted in eight phases (Figure 3). A sequential nested strategy with major quantitative inquiry was used in the study [54,55,56]. The population was composed of approximately 25,776 people, including students, staff members, managers, and academicians of the sampled university. Multistage purposive sampling was determined by considering the key informant characteristics [57,58,59] of the participants, especially with regard to their direct involvement in the system’s implementation. About 150 respondents were chosen for the survey and 3 for the interview. With respect to the research program, the researchers developed the research model (Figure 1) by adopting and adapting Subiyakto’s [39,40] ISRS model in the third phase of the study.
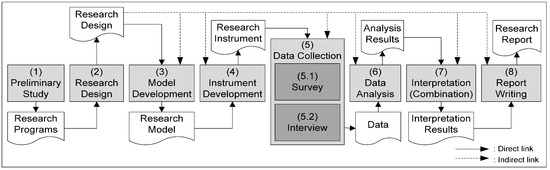
Figure 3.
The research procedure shows that the study was implemented in eight phases from the preliminary study to the report writing.
In the instrument development phase, in addition to questionnaires broken down from the developed model and interview questions developed referring to the project management phases (initiation, planning, implementation, and impact steps), tools were also developed considering the research questions proposed in the study. The questionnaire comprised 48 questions, including 3 respondent profile questions, 1 question on the readiness success profile, and 44 examination questions on a 5-point Likert scale (Table 2). On the other side, the researchers emphasized the interview within four themes to explore the status of the system implementation project, that is, the project initiative, its management, system implementation, and impact.
With respect to the research strategy, the researchers sequentially collected data using the survey and then interviews. First, the paper-based questionnaire was distributed to the selected respondents, with respect to the response rate of the survey method [60]. This was followed by interviews with the participants. Approximately 150 valid responses and a number of interview transcripts were then processed with MS Excel 2013 and MS Word 2013 as the input materials of the data analysis stage. The researchers used IBM SPSS 20 to analyze the demographic data in the descriptive data analysis phase. As described by Christopher, et al. [61], this analysis stage was then used to predict the data distribution in terms of confirming the inferential analysis results in the interpretation stage. The partial least squares structural equation modeling (PLS-SEM) method using SmartPLS 2.0 was used to analyze the 5-point Likert data related to the outer and inner assessment parts of the model. The analysis software was selected by considering the relatively small amount of collected data and the power analysis point of the tools [62,63,64,65,66,67]. Sequentially, the collected documents and transcripts of the interview were analyzed through categorizing and indexing the content tendencies following the four processional themes determined previously [68,69,70] using MS Word 2013 and MS Excel 2013.
In the interpretation phase, the researchers interpreted the results of the data analysis by considering each research question, respectively. In addition to the results of the descriptive analysis being used to present the data distribution, these results were also combined with the results of the content analysis for answers to the first question of the study, how to describe the status of the readiness and success of system implementation. Sequentially, results of the PLS-SEM analysis were used to analyze responses to the second question, in regard to factors influencing the readiness and success of the u-learning implementation. In this phase, the researchers focused on the results of the hypothetical examinations. It was performed appropriate to the research strategy, which focused on the quantitative method. In short, referring to Venkatesh, Brown and Bala [55], this was done to determine the complement, completeness, development, expansion, confirmation, compensation, and diversity points of the findings. The inferences were then discussed by comparing the basic theories used in the model development and findings from previous studies. Lastly, conclusions were proposed together with the contribution, limitation, and recommendation points of the research.
4. Results
4.1. Results of the Descriptive Analysis
Table 3 presents the respondent profiles in terms of gender, age, position, and education characteristics. It can be seen that there were more male respondents (±55%) than female respondents (±45%). The majority (±96%) were third-year students at the university under 25 years old. Descriptively, Table 4 shows that most respondents (about 137, ±92%) revealed considerable effects of the readiness constructs of the system performance and around 48 persons (±32%) expressed the significant impact of the performance.
Table 3.
Profiles of respondents.
Table 4.
Influences of readiness issue on the success of u-learning.
4.2. Results of the Inferential Analysis
Referring to a number of PLS-SEM studies [62,63,64,65,66,67], the outer model assessments were conducted to assess the psychometric properties of the indicators. Four sequential and repeated assessments of this analysis stage were indicator reliability, internal consistency reliability, convergent validity, and discriminant validity assessment.
- The indicator reliability assessment was carried out using two criteria: the threshold rate of the item loading value being 0.7 or above and a comparison of the item cross-loading values among the variables. In the sequence and repetition procedure with the internal consistency reliability assessment using composite reliability (CR) with the threshold level of 0.7 or above, both assessments rejected 17 of the 44 indicators: OPT1, OPT2, INN1, INN4, INS2, INS3, INS4, DIS1, DIS2, INQ2, SYQ1, SYQ2, SYQ5, SVQ3, SVQ4, ISS4, and ISS5 (Figure 4 and Table 5).
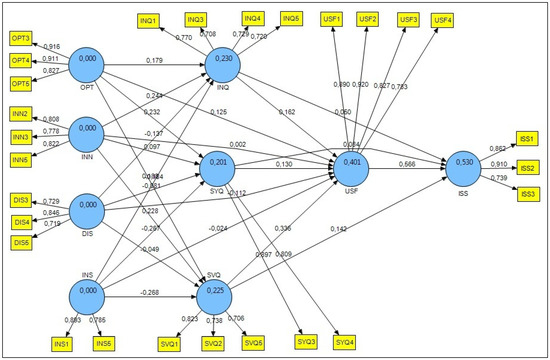 Figure 4. Results of SmartPLS calculation, with respect to measurement model assessments.
Table 5. Cross-loading of indicator items.
Figure 4. Results of SmartPLS calculation, with respect to measurement model assessments.
Table 5. Cross-loading of indicator items. - The convergent validity assessment was conducted using the average variance extracted (AVE) value with a threshold of 0.5 or above. Table 5 shows that AVE values of the nine variables met the threshold.
- The discriminant validity assessment was tested by analyzing Fornell and Larcker’s [71] square root matrix of the AVE for prevention of multicollinearity issues. Table 6 presents the results.
Table 6. Fornell and Larcker’s [71] square root matrix.
In short, the results of these outer model assessments demonstrate that the outer part of the model shows statistically good psychometric properties. Details can be in Figure 4 and Table 5 and Table 6. In regard to the reliability and validity level of the indicator items, structural model assessments were then recommended [62,63,64,65,66,67].
Structural model assessments were carried out in order to analyze the outer part of the model using the path coefficient (β), the coefficient of determination (R2), t-test, effect size (f2), predictive relevance (Q2), and relative impact (q2) assessment [62,63,64,65,66,67].
- The β assessment was performed using a threshold of 0.1 or above to identify the significance of the path influences among variables of the model. Figure 4 and Table 7 present 11 significant paths and 12 insignificant ones.
Table 7. Results of structural model assessments.
- The R2 assessment was done using three thresholds: around 0.670, substantial; about 0.333, moderate; and approximately 0.190 or lower, weak. Figure 4 and Table 5 and Table 7 demonstrate that R2 of ISS was the highest among variances of the five target endogenous variables. This means that the INQ, SYQ, SVQ, and USF variables described almost substantial variance (±53%) of the variable. Meanwhile, variances of the INQ, SYQ, and SVQ variables were explained weakly in around 23%, 20%, and 22%, respectively, by the OPT, INN, DIS, and INS variables. The variance of the USF variable was explained by the OPT, INN, DIS, INS, INQ, SYQ, and SVQ variables in the moderate value (±40%).
- The t-test was performed by employing a two-tailed test with t-values 1.96 (significance level of 5%) to present the hypothesis acceptances. Table 7 and Figure 5 show 10 acceptances and 13 rejections of the hypotheses.
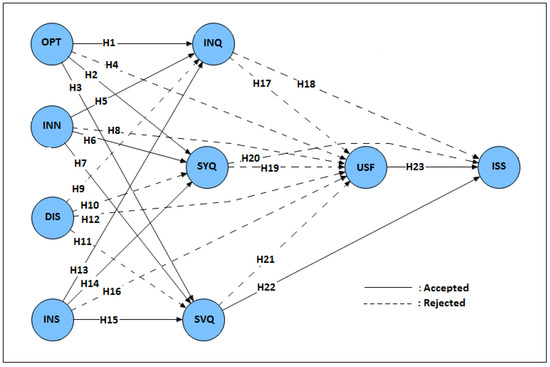 Figure 5. Results of hypothetical assessment with 13 hypothesis rejections.
 - The f2 assessment was performed to predict the influence of each variable on another one in the inner part of the model using thresholds of approximately 0.02, small; 0.15, medium; and 0.35, large influence. USF→ISS is the only path with a large effect and the rest have small effects (Table 7).
- The Q2 assessment was conducted via a blindfolding method using a threshold above zero for presenting predictive relevance of the target endogenous variable. Table 7 shows that all of the paths presented their predictive relevance.
- The q2 assessment was done via the blindfolding method with thresholds of 0.02, 0.15, and 0.35 for small, medium, and large effect sizes. The aim was to know the relative impact of the predictive relevance. Table 5 shows that USF and ISS are the only two paths with medium effect size; the others have small effect sizes.
In summary, the inferential analysis results describe two points. First, despite the fact that 17 of the model indicators are rejected in the outer model assessment, the results provide good psychometric properties for the inner model assessment. Second, it can be clearly seen that only 10 of 23 hypotheses are accepted in the data analysis stage.
4.3. Results of the Content Analysis
Referring to the previous research programs, this analysis emphasized four themes: the project initiative, its management, system implementation, and impact. Three descriptions below elucidate the results.
First, the u-learning implementation was initiated from the top management (C1). It was performed based on cooperation among the institution, a South Korean company, and its representative company following a memorandum of understanding about the project in 2016 (C2). The system implementation itself was one of three pilot projects carried out in Indonesia (C3), with similar projects at Pasundan University and the University of Indonesia. Specifically, the learning technology implementation at the sampled university was the pilot project for Islamic HEIs in Indonesia. As reported by the institutional press release citing the CEO of the foreign company, “This new program we apply in the area of West Java [province] has not entered into Jakarta. So, we wanted this university [the sampled institution] to become a pilot for the public and religious universities in the Jakarta area.” The pilot project was then determined by selecting the Faculty of Science and Technology of the university, in regard to ensuring the readiness and success of the learning technology implementation. The rector said, “We [will first implement u-learning and] see progress in the Faculty of Science and Technology. If [the implementation is] effective, we will apply [u-learning] in the other faculties” (C4). In short, it can be clearly seen that the u-learning implementation was initiated from the top management level (C1) in regard to the benefit expectations (C4).
Second, the u-learning implementation was managed based on the previous three-party agreement (C2). In respect to the initiative scheme, the u-learning implementation was managed by an ad hoc committee at the HEI by involving the Center for Science and Technology Development, the Center for Information Technology and Database, and the Department of Information System (C5). The committee itself managed the project, cooperating with a local representative company of the vendor. It is clear that management of the u-learning implementation project was carried out following a top-down initiative scheme (C1).
Third, in terms of the computer-based learning experience, besides u-learning, e-learning—which is integrated with academic IS—was also implemented by the sampled institution more than seven years ago; however, current e-learning can be indicated as an unsuccessful function. One of the indications is that the e-learning is like an unused learning function in the integrated IS. Here, the authors identified three implementation issues: manager expectations (C3), uncoordinated implementation (C6), and insufficient infrastructure (C7).
- As indicated by the first theme, the u-learning implementation was a top-down initiative (C1). This means that the top management levels realized the benefits of the system implementation and hoped for it (C4). It is consistent with the rector’s descriptions of learning effectiveness, in terms of the internationalization mission of the university (C4). There was also a similar response from one of the managers at the faculty level: “I think u-learning is essential for this faculty [the Faculty of Science and Technology] [C4]. It is better for students rather than they look a presentation slide at front of a class, in terms of its point of view of the eye. Despite the implementation is for lecturers who have taken training, it will be implemented gradually in the next stage. It is the implementation policy”.
- On the other hand, an uncoordinated indication (C6) was also found in the u-learning implementation. As expressed by the head of the selected department, ”From the side of this department, we don’t know yet [about the u-learning implementation]. It is because we only follow by order of the management in the faculty and university levels. The implementation, it has not been implemented as a whole. It has only for certain lecturers. There is no socialization for all the faculty members [C6]. The one who determined the policy was the rector, after that it was only the dean. The head of the department was only running policy of the leaders” (C6).
- In the last issue, the researchers identified that u-learning was only implemented in three courses in the Department of Information System using the Multimedia Laboratory. It was determined by the ad hoc committee (C5) following fulfilment of the infrastructure requirements (C7).
In summary, it is clear that u-learning was implemented based on a top-down initiative (C1), managed by an ad hoc committee (C5) involving three parties (C2), and implemented with expectations of benefit at the management level (C4), lack of coordination (C6), and insufficient infrastructure (C7).
5. Discussion
In regard to the research design, the authors interpreted the results of the analysis by combining quantitative and qualitative points of view in order to develop meta-inferences. In this section, the inferences are discussed by benchmarking the findings with findings from previous studies. The elucidation is guided by following the developed research questions. It is then followed by limitations and contributions of the study at the end of the section.
5.1. Readiness and Success Status of the U-Learning Implementation
Generally, it can be seen that the readiness factors influenced the performance of the u-learning implementation at the sampled institution. Table 4 shows that the majority of respondents (about 137 persons, ±92%) mentioned considerable effects of the readiness factors of the system performance. Almost 48 people (±32%) expressed the significant impact of the readiness constructs of the above-mentioned performance. This is consistent with the findings of a previous study [39] in terms of the influential indications between the readiness and success constructs. In the context of Davis and Yen’s [52] IPO logic, used for developing the readiness and success model, the objects are different, but the findings of this study support the indication of Subiyakto’s [39] research.
Figure 6 presents the formulated interrelationships among points of the content analysis. In regard to the processional dimensions of the u-learning implementation project from the initiation stage to the impact stage, points of the findings can be placed to see their interrelationships in order to illustrate the readiness and success status of the implementation.
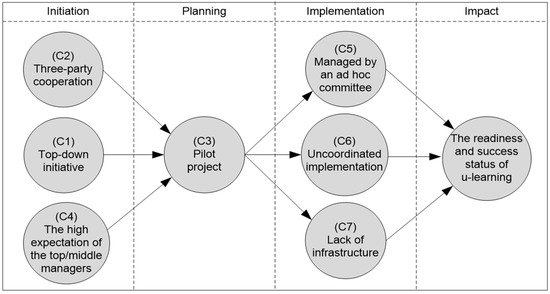
Figure 6.
Readiness and success status of u-learning based on its implementation points.
- The u-learning implementation was started based on the cooperation of the three parties and expectations of top and middle management in regard to the benefits to the university. Clearly, the implementation was carried out using a top-down initiative.
- Referring to the initiative, the implementation was determined within a pilot project in one of the departments at the university. The lecturers and infrastructure readiness were the consideration points of the selection.
- In the implementation, the pilot project was managed by an ad hoc committee. However, two issues of the implementation stage were lack of coordination among the involved units and availability of the required infrastructure.
In summary, the findings highlight the influence of readiness constructs on the success constructs of the u-learning implementation in the sampled HEI. In this case, coordination among stakeholders and availability of system infrastructure may have been the two main points influencing the readiness and success status. It may be consistent with previous studies [6,14,15], which described the issues of availability of IT infrastructure among developing countries.
5.2. Factors Influencing the Readiness and Success of the U-Learning Implementation
5.2.1. Influential Paths of the Readiness Dimension in the System Creation and System Use Dimensions
Findings of the hypothetical assessments revealed that among the 16 paths between variables of the readiness dimension and variables of the system creation and system use dimensions (see Figure 2), only eight paths are influential. As demonstrated in Table 7 and Figure 5, the hypothetical links are H1 (OPT→INQ), H3 (OPT→SYQ), H4 (OPT→SVQ), H5 (INN→INQ), H6 (INN→SYQ), H7 (INN→SVQ), H13 (INS→INQ), H14 (INS→SYQ), and H15 (INS→SVQ). The three underlined points are around the paths of the discomfort and user satisfaction variables.
- As an independent variable, all hypothetical paths of the discomfort variable were rejected. Similarly, the rejection findings are consistent with insignificance coefficients of the paths and the weak coefficient of determination of the system creation variables (approximately 0.225) (see Figure 4 and Figure 5, Table 5 and Table 7). Excluding DIS→SVQ, the findings are consistent with Subiyakto’s [39] study. In contrast, the negative influences are inconsistent with the basic theory [25,40] used in the model development. This may relate to the compulsory use of the system [44,72,73]. The comfort issues may not be considered here because the use of u-learning was compulsory in this implementation case.
- On the other hand, the findings also show that all hypothetical paths of the readiness variables toward the user satisfaction variable are rejected. Similarly, it is also consistent with [39], excluding INS→USF. This indicates that user satisfaction of the u-learning implementation was unaffected by the readiness factors.
In short, it is clear that eight hypotheses related to variables of the readiness dimension (H1, H2, H3, H5, H6, H13, H14, and H15) were the accepted hypotheses. The other eight (H4, H7, H8, H9, H10, H11, H12, and H16) were the rejected hypotheses. This study proved that the readiness factors influenced the success factors of the u-learning implementation. Moreover, it may be similar to the compulsory issue of system use; the discomfort variable of the readiness dimension can be ignored in the readiness assessment because the u-learning use was compulsory.
5.2.2. Influential Paths between the System Creation and System Use Dimensions
Like the hypothetical paths from the readiness variables to the user satisfaction variable (see Figure 2), a similar illustration is also presented by the three hypothetical paths from the system creation variables to the above-mentioned dependent variable, namely, INQ→USF, SYQ→USF, and SVQ→USF (see Figure 4 and Figure 5, Table 5 and Table 7). However, the coefficient of determination of user satisfaction was above the moderate threshold level (approximately 0.401), but the seven paths were rejected in this study. This is inconsistent with Delone and Mclean’s [43] processional and causal dimension of the model development [40,44]. The researchers predict that it may relate to the study phenomenon itself, the data used, or the instrument of data collection.
In brief, the findings of the study demonstrate that three hypotheses (H17, H19, and H21) regarding variables of the system creation and system use dimensions were rejected. It can be clearly seen that user satisfaction is not a variable that mediates the other variables with the success IS variable in terms of the readiness and success of u-learning implementation.
5.2.3. Influential Paths of the System Creation and System Use Dimensions in the System Impact Dimension
Table 7 and Figure 5 show that among the four variables of the system creation and system use dimensions, only two variables had a positive influence on variables of the system impact dimension SVQ and USF. Thus, the hypotheses of SVQ→ISS and USF→ISS were accepted. With respect to the coefficient of determination value, both SVQ and USF variables presented almost substantial (±53%) variance of the ISS variable. In terms of the study, it can be said that SVQ of u-learning and its USF are two determinant factors of system performance. Both factors may have directly influenced the performance. It may be in regard to the study phenomenon itself, data used in the study, characteristics of the respondents, or the instrument of data collection. In addition, Figure 3 clearly shows that despite SVQ being explained weakly (±22.5%) by the three readiness variables (OPT, INN, and INS), SVQ mediated influential paths of the three variables into ISS. Although the above-mentioned findings show that only SVQ mediated three variables of the readiness dimension with the variable of system impact, the mediation was only weakly (±22.5%) shown by the three variables. Moreover, the mediation proved the processional and causal relationship across the readiness, system creation, system use, and system impact dimensions of the developed model.
In short, the statistical findings of this study show that 10 of the 23 proposed hypotheses are accepted (see Table 7 and Figure 5). Among the four variables of the readiness dimension, only DIS did not influence the success dimension of the u-learning implementation. In addition, only SVQ mediated three variables of the readiness dimension with the variable of system impact.
In conclusion, the findings of the study indicate that u-learning may have been unsuccessfully implemented in the sampled HEI. Findings of both qualitative and quantitative inquiries show that the implementation performance may have been affected by the readiness constructs. In addition to the implementation being initiated by top management, the qualitative findings also show that the system implementation tended to be done with uncoordinated management and a lack of infrastructure. On the other hand, the quantitative investigation demonstrated that 13 of the 23 proposed hypotheses were rejected. Only DIS among the four variables of the readiness constructs did not influence the success constructs of the u-learning implementation, and only SVQ mediated the readiness constructs with the system performance construct.
Currently, there are no reports published on u-learning implementation in Indonesia, especially on the three pilot projects of u-learning implementation. Therefore, the findings of this study may be practical consideration points for stakeholders of technology implementations. In addition, the findings may also be theoretical evidence that the constructs of the readiness model affect the IS success model. As indicated by previous studies [25,43,44,45], the popularity of a model does not mean that the model does not need to be developed again. Of course, in addition to the assumptions and theories used in the model development, the samples, data, techniques, and tools used in this study may need to be reviewed in the context of future studies. The findings shown here cannot be a fixed justification for other study contexts. Thus, the model development and research methodology issues mentioned above may be among the consideration points in future studies.
6. Conclusions
It is inevitable that the use of u-learning may be a solution in terms of affordability, accessibility, and quality issues in developing countries. This study investigated a pilot project of u-learning implementation in Indonesia. The researchers employed mixed methods by combining quantitative and qualitative methods to understand the performance status of the u-learning implementation and factors that affected the status. The research model adopted a previously developed readiness and success model. In short, both quantitative and qualitative findings revealed that the implementation performance may have been affected by the readiness constructs. Moreover, the study may contribute theoretically and practically to future studies, especially as it shows the implementation of a u-learning pilot project from the perspective of a developing country.
Author Contributions
A.S.: conceptualization, methodology, software, formal analysis, data curation, writing—original draft preparation, review, and editing, visualization, supervision. N.A.H.: validation, formal analysis, writing—review and editing, supervision, project administration, funding acquisition. G.G.: software, validation, investigation, resources, data curation, writing—original draft preparation. M.A.H.: software, validation, investigation, resources, data curation, writing—original draft preparation.
Funding
This research was funded by the Directorate General of Islamic Education, Ministry of Religious Affairs, Indonesia, grant no. 4842, year of registration 2018, no. 181020000009515.
Acknowledgements
The researchers thank reviewers of the research project for their assessment and guidance and staff members of the project for their cooperation during the research implementation stages. The researchers also appreciate reviewers of the manuscript for their comments and suggestions during the review and revision processes of the paper submission.
Conflicts of Interest
The authors declare no conflict of interest. The funders had no role in the collection, analysis, and interpretation of data, and in the writing of the manuscript.
References
- ITU. ICT Facts and Figures 2017. Available online: https://www.itu.int/en/ITU-D/Statistics/pages/facts/ default.aspx (accessed on 14 February 2019).
- Patel, C.J.; Gali, V.S.; Patel, D.V.; Parmar, R.D. The effects of information and communication technologies (ICTs) on higher education: From objectivism to social constructivism. Int. J. Vocat. Tech. Educ. 2011, 3, 113–120. [Google Scholar]
- Pucciarelli, F.; Kaplan, A. Competition and strategy in higher education: Managing complexity and uncertainty. Bus. Horiz. 2016, 59, 311–320. [Google Scholar] [CrossRef]
- Hong, K.-S.; Songan, P. ICT in the changing landscape of higher education in Southeast Asia. Australas. J. Educ. Tech. 2011, 27, 8. [Google Scholar] [CrossRef]
- Virtanen, M.A.; Haavisto, E.; Liikanen, E.; Kääriäinen, M. Ubiquitous learning environments in higher education: A scoping literature review. Educ. Inf. Tech. 2018, 23, 985–998. [Google Scholar] [CrossRef]
- Pimmer, C.; Mateescu, M.; Gröhbiel, U. Mobile and ubiquitous learning in higher education settings. A systematic review of empirical studies. Comput. Hum. Behav. 2016, 63, 490–501. [Google Scholar] [CrossRef]
- Park, Y. A pedagogical framework for mobile learning: Categorizing educational applications of mobile technologies into four types. Int. Rev. Res. Open Distrib. Learn. 2011, 12, 78–102. [Google Scholar] [CrossRef]
- Pavel, A.-P.; Fruth, A.; Neacsu, M.-N. ICT and e-learning–catalysts for innovation and quality in higher education. Procedia Econ. Finance 2015, 23, 704–711. [Google Scholar] [CrossRef]
- Hwang, G.-J.; Tsai, C.-C. Research trends in mobile and ubiquitous learning: A review of publications in selected journals from 2001 to 2010. Br. J. Educ. Tech. 2011, 42, E65–E70. [Google Scholar] [CrossRef]
- Wu, W.-H.; Jim Wu, Y.-C.; Chen, C.-Y.; Kao, H.-Y.; Lin, C.-H.; Huang, S.-H. Review of trends from mobile learning studies: A meta-analysis. Comput. Educ. 2012, 59, 817–827. [Google Scholar] [CrossRef]
- Chan, Y.E.; Reich, B.H. It alignment: What have we learned? J. Inf. Tech. 2007, 22, 297–315. [Google Scholar] [CrossRef]
- Subiyakto, A.; Ahlan, A.R. A coherent framework for understanding critical success factors of ICT project environment. In Proceedings of the 2013 International Conference on Research and Innovation in Information Systems (ICRIIS), Kuala Lumpur, Malaysia, 27–28 November 2013; pp. 342–347. [Google Scholar]
- Xu, X.; Zhang, W.; Barkhi, R. It infrastructure capabilities and it project success: A development team perspective. Inf. Tech. Manag. 2010, 11, 123–142. [Google Scholar] [CrossRef]
- West, D.M. Digital Divide: Improving Internet Access in the Developing World through Affordable Services and Diverse Content; Brookings Institution: Washington, DC, USA, 2015. [Google Scholar]
- Sobaih, A.E.E.; Moustafa, M.A.; Ghandforoush, P.; Khan, M. To use or not to use? Social media in higher education in developing countries. Comput. Hum. Behav. 2016, 58, 296–305. [Google Scholar] [CrossRef]
- Beringer, C.; Jonas, D.; Kock, A. Behavior of internal stakeholders in project portfolio management and its impact on success. Int. J. Proj. Manag. 2013, 31, 830–846. [Google Scholar] [CrossRef]
- Davis, K. An empirical investigation into different stakeholder groups perception of project success. Int. J. Proj. Manag. 2017, 35, 604–617. [Google Scholar] [CrossRef]
- Subiyakto, A.; Ahlan, A.R.; Kartiwi, M.; Sukmana, H.T. Measurement of information system project success based on perceptions of the internal stakeholders. Int. J. Electr. Comput. Eng. 2015, 5, 271–279. [Google Scholar]
- Nguyen, T.D.; Nguyen, T.M.; Cao, T.H. Information systems success: A literature review. In Proceedings of the International Conference on Future Data and Security Engineering, Ho Chi Minh City, Vietnam, 23–25 November 2015; pp. 242–256. [Google Scholar]
- Almajed, A.I.; Mayhew, P. An empirical investigation of it project success in developing countries. In Proceedings of the Science and Information Conference (SAI), London, UK, 27–29 August 2014; pp. 984–990. [Google Scholar]
- Hughes, D.L.; Dwivedi, Y.K.; Simintiras, A.C.; Rana, N.P. Project failure and its contributing factors. In Success and Failure of IS/IT Projects; Springer: Cham, Switzerland, 2016; pp. 3–25. [Google Scholar]
- Joosten, D.; Basten, D.; Mellis, W. Measurement of information system project success in German organizations. In Project Management: Concepts, Methodologies, Tools, and Applications; IGI Global: Hershey, PA, USA, 2016; pp. 1175–1196. [Google Scholar]
- Nizamani, S.; Khoumbati, K.; Ismaili, I.A.; Nizamani, S.; Nizamani, S.; Basir, N. Testing and validating the ERP success evaluation model for higher education institutes of Pakistan. Int. J. Bus. Inf. Syst. 2017, 25, 165–191. [Google Scholar] [CrossRef]
- Subiyakto, A.; Ahlan, A.R.; Kartiwi, M.; Putra, S.J. Measurement of the information system project success of the higher education institutions in Indonesia: A pilot study. Int. J. Bus. Inf. Syst. 2016, 23, 229–247. [Google Scholar]
- Parasuraman, A.; Colby, C.L. An updated and streamlined technology readiness index: Tri 2.0. J. Serv. Res. 2015, 18, 59–74. [Google Scholar] [CrossRef]
- Madan, A.; Dubey, S.K. Usability evaluation methods: A literature review. Int. J. Eng. Sci. Technol. 2012, 4, 2. [Google Scholar]
- Baumann, C.; Hamin, H.; Marakarkandy, B.; Yajnik, N. Re-examining and empirically validating the end user computing satisfaction models for satisfaction measurement in the internet banking context. Int. J. Bank Mark. 2013, 31, 440–455. [Google Scholar]
- Alexandre, B.; Reynaud, E.; Osiurak, F.; Navarro, J. Acceptance and acceptability criteria: A literature review. Cognit. Technol. Work 2018, 20, 165–177. [Google Scholar] [CrossRef]
- Marangunić, N.; Granić, A. Technology acceptance model: A literature review from 1986 to 2013. Univers. Access Inf. Soc. 2015, 14, 81–95. [Google Scholar] [CrossRef]
- Larasati, N.; Santosa, P.I. Technology readiness and technology acceptance model in new technology implementation process in low technology SMEs. Int. J. Innov. Manag. Tech. 2017, 8, 113. [Google Scholar]
- Godoe, P.; Johansen, T. Understanding adoption of new technologies: Technology readiness and technology acceptance as an integrated concept. J. Eur. Psychol. Stud. 2012, 3, 38–52. [Google Scholar] [CrossRef]
- Wang, Y.; So, K.K.F.; Sparks, B.A. Technology readiness and customer satisfaction with travel technologies: A cross-country investigation. J. Travel Res. 2017, 56, 563–577. [Google Scholar] [CrossRef]
- Dwivedi, Y.K.; Wastell, D.; Laumer, S.; Henriksen, H.Z.; Myers, M.D.; Bunker, D.; Elbanna, A.; Ravishankar, M.; Srivastava, S.C. Research on information systems failures and successes: Status update and future directions. Inf. Syst. Front. 2015, 17, 143–157. [Google Scholar] [CrossRef]
- Venkatesh, V.; Davis, F.D. A theoretical extension of the technology acceptance model: Four longitudinal field studies. Manag. Sci. 2000, 46, 186–204. [Google Scholar] [CrossRef]
- Lin, C.H.; Shih, H.Y.; Sher, P.J. Integrating technology readiness into technology acceptance: The tram model. Psychol. Mark. 2007, 24, 641–657. [Google Scholar] [CrossRef]
- Anfara, V.A., Jr.; Mertz, N.T. Theoretical Frameworks in Qualitative Research; SAGE Publications: Thousand Oaks, CA, USA, 2014. [Google Scholar]
- Belout, A.; Gauvreau, C. Factors influencing project success: The impact of human resource management. Int. J. Proj. Manag. 2004, 22, 1–11. [Google Scholar] [CrossRef]
- Subiyakto, A.; Ahlan, A.R. Implementation of input-process-output model for measuring information system project success. TELKOMNIKA Indones. J. Electr. Eng. 2014, 12, 5603–5612. [Google Scholar] [CrossRef]
- Subiyakto, A. Assessing information system integration using combination of the readiness and success models. Bull. Electr. Eng. Inform. 2018, 7, 400–410. [Google Scholar]
- Subiyakto, A. Development of the readiness and success model for assessing the information system integration. In Proceedings of the International Conference on Science and Technology (ICOSAT), Ancol, Indonesia, 10 August 2017. [Google Scholar]
- Wu, W.-C.; Perng, Y.-H. Research on the correlations among mobile learning perception, study habits, and continuous learning. Eurasia J. Math. Sci. Tech. Educ. 2016, 12, 1665–1673. [Google Scholar]
- Chen, K.-D.; Chen, P.-K. Research on the relation the characteristics of the faculty and the commitment to continuous improvement of motivations and student study processes. Asia Pac. Educ. Rev. 2017, 18, 439–449. [Google Scholar] [CrossRef]
- DeLone, W.H.; McLean, E.R. The delone and mclean model of information systems success: A ten-year update. J. Manag. Inf. Syst. 2003, 19, 9–30. [Google Scholar]
- Petter, S.; DeLone, W.; McLean, E. Measuring information systems success: Models, dimensions, measures, and interrelationships. Eur. J. Inf. Syst. 2008, 17, 236–263. [Google Scholar] [CrossRef]
- Urbach, N.; Müller, B. The updated delone and mclean model of information systems success. In Information Systems Theory; Springer: Berlin/Heidelberg, Germany, 2012; pp. 1–18. [Google Scholar]
- Shannon, C.E.; Weaver, W. The Mathematical Theory of Information; The University of Illinois Press: Urbana, IL, USA, 1949. [Google Scholar]
- Mason, R.O. Measuring information output: A communication systems approach. Inf. Manag. 1978, 1, 219–234. [Google Scholar] [CrossRef]
- Achterkamp, M.C.; Vos, J.F. Investigating the use of the stakeholder notion in project management literature, a meta-analysis. Int. J. Proj. Manag. 2008, 26, 749–757. [Google Scholar] [CrossRef]
- Achterkamp, M.C.; Boonstra, A.; Vos, J.F. A bilateral, double motive perspective on stakeholder management in healthcare EIS projects. Procedia Technol. 2013, 9, 167–178. [Google Scholar] [CrossRef]
- Putra, S.J.; Subiyakto, A.; Ahlan, A.R.; Kartiwi, M. A coherent framework for understanding the success of an information system project. TELKOMNIKA (Telecommun. Comput. Electron. Control) 2016, 14, 302–308. [Google Scholar] [CrossRef]
- Subiyakto, A.; Ahlan, A.R.; Kartiwi, M.; Sukmana, H.T. Influences of the input factors towards success of an information system project. TELKOMNIKA (Telecommun. Comput. Electron. Control) 2015, 13, 686–693. [Google Scholar] [CrossRef]
- Davis, W.S.; Yen, D.C. The Information System Consultant’s Handbook: Systems Analysis and Design; CRC Press: Boca Raton, FL, USA, 1998. [Google Scholar]
- Kellogg, W. Logic Model Development Guide; W.K. Kellogg Foundation: Michigan, MI, USA, 2004. [Google Scholar]
- Creswell, J.W. Research Design: Qualitative, Quantitative, and Mixed Methods Approaches; SAGE Publications: Thousand Oaks, CA, USA, 2013. [Google Scholar]
- Venkatesh, V.; Brown, S.A.; Bala, H. Bridging the qualitative-quantitative divide: Guidelines for conducting mixed methods research in information systems. MIS Q. 2013, 37, 21–54. [Google Scholar] [CrossRef]
- Douglass, J.A. Higher Education’s New Global Order: How and Why Governments Are Creating Structured Opportunity Markets; University of California: Berkeley, CA, USA, 2009. [Google Scholar]
- Yazdani, A.; Hilbrecht, M.; Imbeau, D.; Bigelow, P.; Neumann, W.P.; Pagell, M.; Wells, R. Key informants’ perspectives: Management commitment, training, and worker participation in the prevention of musculoskeletal disorders. IISE Trans. Occup. Ergon. Hum. Factors 2017, 5, 172–184. [Google Scholar] [CrossRef]
- Joseph, S. Relationality and ethnographic subjectivity: Key informants and the construction of personhood in fieldwork. In Feminist Dilemmas in Fieldwork; Routledge: Abingdon, UK, 2018; pp. 107–121. [Google Scholar]
- Homburg, C.; Klarmann, M.; Reimann, M.; Schilke, O. What drives key informant accuracy? J. Mark. Res. 2012, 49, 594–608. [Google Scholar] [CrossRef]
- Leisher, C. A comparison of tablet-based and paper-based survey data collection in conservation projects. Soc. Sci. 2014, 3, 264–271. [Google Scholar] [CrossRef]
- Christopher, J.; Schertzer, C.B.; Schertzer, S. Accounting faculty internships: A descriptive study. SAGE Open 2013, 3. [Google Scholar] [CrossRef]
- Henseler, J.; Ringle, C.M.; Sinkovics, R.R. The use of partial least squares path modeling in international marketing. Adv. Int. Mark. 2009, 20, 277–319. [Google Scholar]
- Urbach, N.; Ahlemann, F. Structural equation modeling in information systems research using partial least squares. J. Inf. Tech. Theory Appl. 2010, 11, 5–40. [Google Scholar]
- Hair, J.F.; Ringle, C.M.; Sarstedt, M. PLS-SEM: Indeed a silver bullet. J. Mark. Theory Pract. 2011, 19, 139–152. [Google Scholar] [CrossRef]
- Hair, J.F.; Sarstedt, M.; Ringle, C.M.; Mena, J.A. An assessment of the use of partial least squares structural equation modeling in marketing research. J. Acad. Mark. Sci. 2012, 40, 414–433. [Google Scholar] [CrossRef]
- Afthanorhan, W. A comparison of partial least square structural equation modeling (PLS-SEM) and covariance based structural equation modeling (CB-SEM) for confirmatory factor analysis. Int. J. Eng. Sci. Innov. Technol. 2013, 2, 198–205. [Google Scholar]
- Wong, K.K.-K. Partial least squares structural equation modeling (PLS-SEM) techniques using SmartPLS. Mark. Bull. 2013, 24, 1–32. [Google Scholar]
- Elo, S.; Kääriäinen, M.; Kanste, O.; Pölkki, T.; Utriainen, K.; Kyngäs, H. Qualitative content analysis: A focus on trustworthiness. SAGE Open 2014, 4. [Google Scholar] [CrossRef]
- Vaismoradi, M.; Turunen, H.; Bondas, T. Content analysis and thematic analysis: Implications for conducting a qualitative descriptive study. Nurs. Health Sci. 2013, 15, 398–405. [Google Scholar] [CrossRef] [PubMed]
- Ryan, G.W.; Bernard, H.R. Techniques to identify themes. Field Methods 2003, 15, 85–109. [Google Scholar] [CrossRef]
- Fornell, C.; Larcker, D.F. Structural equation models with unobservable variables and measurement error: Algebra and statistics. J. Mark. Res. 1981, 18, 382–388. [Google Scholar] [CrossRef]
- Floropoulos, J.; Spathis, C.; Halvatzis, D.; Tsipouridou, M. Measuring the success of the Greek taxation information system. Int. J. Inf. Manag. 2010, 30, 47–56. [Google Scholar] [CrossRef]
- Seddon, P.; Kiew, M.-Y. A partial test and development of DeLone and McLean’s model of IS success. Australas. J. Inf. Syst. 1996, 4. [Google Scholar] [CrossRef]
© 2019 by the authors. Licensee MDPI, Basel, Switzerland. This article is an open access article distributed under the terms and conditions of the Creative Commons Attribution (CC BY) license (http://creativecommons.org/licenses/by/4.0/).