Article

Efficient Detection of Ventricular Late Potentials on ECG Signals Based on Wavelet Denoising and SVM Classification

Dipartimento di Ingegneria Elettrica e dell’Informazione, Politecnico di Bari, via E. Orabona 4, 70125 Bari, Italy
*
Author to whom correspondence should be addressed.
Information 2019, 10(11), 328; https://doi.org/10.3390/info10110328
Submission received: 19 September 2019 / Revised: 16 October 2019 / Accepted: 17 October 2019 / Published: 23 October 2019

Abstract

:
The analysis of cardiac signals is still regarded as attractive by both the academic community and industry because it helps physicians in detecting abnormalities and improving the diagnosis and therapy of diseases. Electrocardiographic signal processing for detecting irregularities related to the occurrence of low-amplitude waveforms inside the cardiac signal has a considerable workload as cardiac signals are heavily contaminated by noise and other artifacts. This paper presents an effective approach for the detection of ventricular late potential occurrences which are considered as markers of sudden cardiac death risk. Three stages characterize the implemented method which performs a beat-to-beat processing of high-resolution electrocardiograms (HR-ECG). Fifteen lead HR-ECG signals are filtered and denoised for the improvement of signal-to-noise ratio. Five features were then extracted and used as inputs of a classifier based on a machine learning approach. For the performance evaluation of the proposed method, a HR-ECG database consisting of real ventricular late potential (VLP)-negative and semi-simulated VLP-positive patterns was used. Experimental results show that the implemented system reaches satisfactory performance in terms of sensitivity, specificity accuracy, and positive predictivity; in fact, the respective values equal to 98.33%, 98.36%, 98.35%, and 98.52% were achieved.

1. Introduction

The use of science and technology in medicine is an evolving field that addresses complex medical issues by integrating the latest advancements in the fields of biology, chemistry, and physics with engineering and medicine for solving challenges in human health [1,2,3].
In medical signal processing, the accurate diagnosis and/or assessment of a disease depends on both signal acquisition and interpretation. Medical signal interpretation processes can benefit from computer technology [4,5,6]. It can help clinicians to screen abnormalities and the risks associated with them and contribute to the diagnosis of clinical signs for the purpose of recognizing the nature and cause of the pathological event [7,8]. Computer-aided interpretation is particularly useful when either a large amount of data has to be analyzed or the observation time is long, as is the case for the diagnosis of cardiovascular diseases. Since the state of the heart is related to the shape of the electrocardiogram signal (ECG) and to the heart rate, cardiologists consider the ECG to be a representative signal of cardiac physiology which is useful for detecting cardiac pathologies.
Due to the nonstationary behavior of the ECG signal, disease indicators may be present all the time, or may occur at random during certain irregular intervals of the day. Therefore, the study of ECG patterns by analysts may have to be carried out over several hours, with a high probability of missing vital information.
The detection of high frequency, microvolt-level cardiac electrical activity in the terminal portion of QRS complexes is the expression of abnormal ECG signals owing to the existence of ventricular late potentials (VLPs). They represent areas of slow conduction resulting from fragmentation of electromotive forces in abnormal areas of ventricular myocardium; in fact, the necrosis or ischemic death of myocardial cells causes the formation of high-resistivity areas where the propagation of cardiac action potential is delayed [9,10] VLPs are considered as electrophysiological indicators both for stratifying the risk of ventricular arrhythmias development in people who are recuperating from myocardial infarction [11,12], and for the early detection of malignant arrhythmias in people having ischemic heart pathology incurring in sudden syncope [13].
Prior studies have highlighted the analysis of VLPs in assessing the risk of ventricular arrhythmias for symptomatic and asymptomatic patients with Brugada syndrome [14], Chagas disease patients [15], and patients with arrhythmogenic right ventricular cardiomyopathy [16]. Moreover, other studies have investigated the association of ventricular late potentials with left ventricular hypertrophy in patients affected by hypertension [17], diabetes mellitus [18], obesity [19], and other indicators of metabolic syndrome [20,21]. A robust correlation has also demonstrated between QRS fragmentation and late potentials [22].
The analysis carried out in the literature has shown that there is a high negative prediction value of VLPs for arrhythmic events coupled with a low measured positive prediction if used as a unique screening parameter: the combination of VLP analysis with patient history and other diagnostic tests can help physicians during diagnostic investigations [11,23].
Correct VLP detection is actually considered a helpful and non-invasive diagnostic tool in patients with arrhythmogenic right ventricular cardiomyopathy for preventing malignant ventricular arrhythmias such as ventricular tachycardia and ventricular fibrillation. In fact, the prediction of ventricular tachycardia/ventricular fibrillation before their occurrence is essential to prevent delay of rescue procedures [23,24,25].
In this paper, the machine learning approach is proposed for VLP detection in HR-ECG signals. The implemented computer-aided detection (CAD) method adopts the wavelet transform to perform efficient signal denoising and the support vector machine (SVM) technique to carry out a beat-to-beat analysis.
Adopting the PTB (Physikalisch-Technische Bundesanstalt) Diagnostic ECG Database for procedure testing [26], sensitivity, specificity, and accuracy are considered for the method performance evaluation. The obtained results show both the method validity and its capability to detect VLPs in HR-ECG signals independently from QRS complex morphologies.
Following the introduction that highlights the ventricular late potential validity as an electrophysiological indicator, in Section 2, a summary of the prior research on VLP detection is presented. In Section 3, the characteristics of the VLP signal are indicated while Section 4 deals with the techniques adopted for method implementation. Section 5 contains an in-depth presentation of the implemented CAD system and Section 6 includes the obtained results. Moreover, some conclusions are drawn out.

2. Prior Research

VLP detection and quantification are hard tasks, since their amplitude is often too small to show up on a normal ECG. For this reason, high-resolution ECG (HR-ECG) is adopted as an electrocardiographic technique which is characterized by great amplitude resolution and a high sampling rate. Due to their low amplitude, VLPs are covered by both low-frequency high-amplitude deflections of ECG and by high-frequency interference arising from biomedical instrumentation and muscular activity signals. Several procedures of signal enhancement and feature selection for VLP detection have been implemented over the years. Generally, three orthogonal leads measure the ECG signals from the body surface which are then amplified and digitized at a sampling rate of 1000 samples per second. To improve the ECG signal-to-noise ratio (SNR) and, consequently, to better identify VLPs, several cardiac cycles are cross-correlated with a template, aligned, and averaged to obtain the so-called signal-averaged electrocardiograph. The signal-averaged electrocardiography (SAECG) signal is analyzed in either the time or frequency domain. The time domain study for VLP detection requires high amplification and a suitable filtering phase for the rejection of low frequencies associated with the repolarization phases of the action potential, ST segment, and T wave. The filter passband and its characteristics are very important for the accuracy of results. Most often linear, shift-invariant (time-invariant) digital filter is implemented in the time domain as a convolution sum so to avoid phase distortion in a single processing step. A bidirectional four-pole Butterworth high-pass filter has been used by Simson [27] to improve the sensitivity and specificity of the method for adoption in clinical environments. In this way, the filter ringing effect in the terminal parts of the QRS complexes has been avoided. Also, obtaining the localization of the QRS complex endpoint position is a hard task because of noise occurrence, which makes the portion of signal following the QRS unstable. Standards have proposed the automatic estimation of the initial and final points of the filtered QRS complex [27]. However, the incomplete characterization of reentrant activity, poor accuracy of positive prediction [28], and impossibility in detecting VLPs in patients with bundle branch block pathology [29] are the major limitations of time domain analysis.
Fractal dimension analysis has also been implemented as a diagnostic tool to detect and quantify the complexity degree of VLPs in the microvoltage 3D space [30].
Unlike time analysis, a standard for the frequency domain approach has not yet been defined. Several studies have considered Fourier transformation [31] and the short-time Fourier transform, other methods have used maximum entropy spectrum estimation [32,33], time-variant autoregressive spectral study [34], spectral turbulence analysis [35,36] and Wigner distribution [37]. Some evident limits of the aforementioned methods concern the fixed duration of the window adopted for selection of QRS complex segments, the generation of interference terms, and poor choice of a fixed time-frequency resolution for the analysis of nonstationary signals such as VLPs.
Wavelet transform is also adopted because, in the analyzed signal, it provides the possibility of good tracking of sudden changes [38,39,40].
Although approaches based on SAECG signals give useful results, they both remove any beat-to-beat variations from the signal and require that the signal is present for a considerable number of beats. For these reasons, some alternative techniques have been proposed, such as adaptive filtering [41,42] (for the suppression of noise having a spectrum which overlaps with the VLPs), wavelet transform [2,43], and hybrid procedures which make use of several techniques, such as time sequence adaptive filter for SNR enhancement, wavelet transform for time-frequency achievement of filtered signals and artificial neural network for VLP detection and localization [44]. Moreover, the bidimensional cross-correlation between a time–frequency template map of VLP and the time–frequency template of each individual beat of the ECG has adopted for the study of VLP beat-to-beat variability [45].

3. Ventricular Late Potential Characteristics

VLPs are cardiac signals of high frequency content (in the range of 40–250 Hz) and very low voltage (between 1 and 20 μV) which are located at the end of QRS complex but may also extend into the early part of an ST segment (Figure 1). They are considered nonstationary and non-Gaussian signals and are generated in cardiac tissue zones whose architecture has been altered due to necrosis, fibrosis, or dystrophy. The resulting delayed and fragmented depolarization causes the occurrence of high-resistivity areas where the speed of cardiac impulse decreases. Such heterogeneous areas giving rise to ventricular late potentials represent an electrophysiological substrate for the development of reentrant ventricular tachycardia [46].
As ventricular late potentials are at least two orders of magnitude smaller than the typical ECG signal, they remain hidden below the noise produced by the acquisition hardware and by noncardiac signals. For this reason, VLPs are not visible on standard ECG and require a high-resolution ECG technique [47]. It follows that noise reduction is an essential and delicate phase when cardiac signals are processed for VLP detection and localization.

4. Techniques Adopted for the Method Implementation

4.1. Wavelet Transform

Wavelet transform is a suitable tool for studying nonstationary signals. In fact, both the property of time-frequency localization and the multirate filtering option make wavelet transform an effective tool in signal processing analysis [48]. It decomposes the signal into several components with various scales or resolutions. The compactness of wavelet functions makes them a useful procedure for signal processing. In fact, the characteristic of wavelet coefficients of measuring variations around a small zone of data makes easy identification of the data features (spikes, edges of objects, etc.) possible.
As the aim of this paper is the implementation of a fast algorithm, the type of nonredundant wavelet decomposition that has been chosen is one which is better for data reduction. To determine the best wavelet function to be used, the VLP signal properties have been studied, such as the shape and their localization inside the ECG signal.

4.2. Support Vector Machine

The support vector machine (SVM) is a collection of supervised learning tools derived from statistical learning adopted for classification and regression. For classification purposes, the main idea of the SVM technique is to separate classes in a mapped high-dimensional feature space with a hyperplane that maximizes the separation margin between them [49].
Denoting with:
  • xRn as a vector which represents a pattern to be classified;
  • y as a scalar which represents the class label (i.e., y ∈ {±1});
  • S = {(xi, yi); I = 1, 2, …, l} for a given set of l training examples.
The aim is the implementation of a decision function f(x) able to classify an input pattern x that is not necessarily from the training set:
f ( x ) = i = 1 l α i y i K ( x i , x ) + α 0
where αi are determined through training and K(.,.) is a kernel function. The kernel function transforms data into a higher-dimensional space to make data separation possible.
For a given training set, while there may exist many hyperplanes that separate the two classes, the SVM classifier selects the one that maximizes the separating margin between the two classes. In other words, SVM finds the hyperplane or hypersurface that causes the largest separation between the decision function values for the “borderline” examples from the two classes called support vectors. By definition, support vectors are elements of the training set that lie either on or near to the decision boundaries of the decision function. They consist of those training examples that are very difficult to classify and, for this reason, they are defined as “borderline” examples. The SVM classifier then defines the decision boundary between the two classes by “memorizing” these support vectors.
Training an SVM requires the solution of a very large quadratic programming optimization problem. A simple and widely used method for training SVM is the sequential minimal optimization (SMO) algorithm. The main idea is derived from solving the dual quadratic optimization problem by optimizing the minimal subset including two elements at each iteration. The advantage of SMO is that it can be implemented simply and analytically.

5. Developed Method for VLP Detection

The implementation of the method is split into three distinct steps, namely, preprocessing, feature extraction, and classification. Results generated by the generic ith step represent inputs for the (i+1)th step.

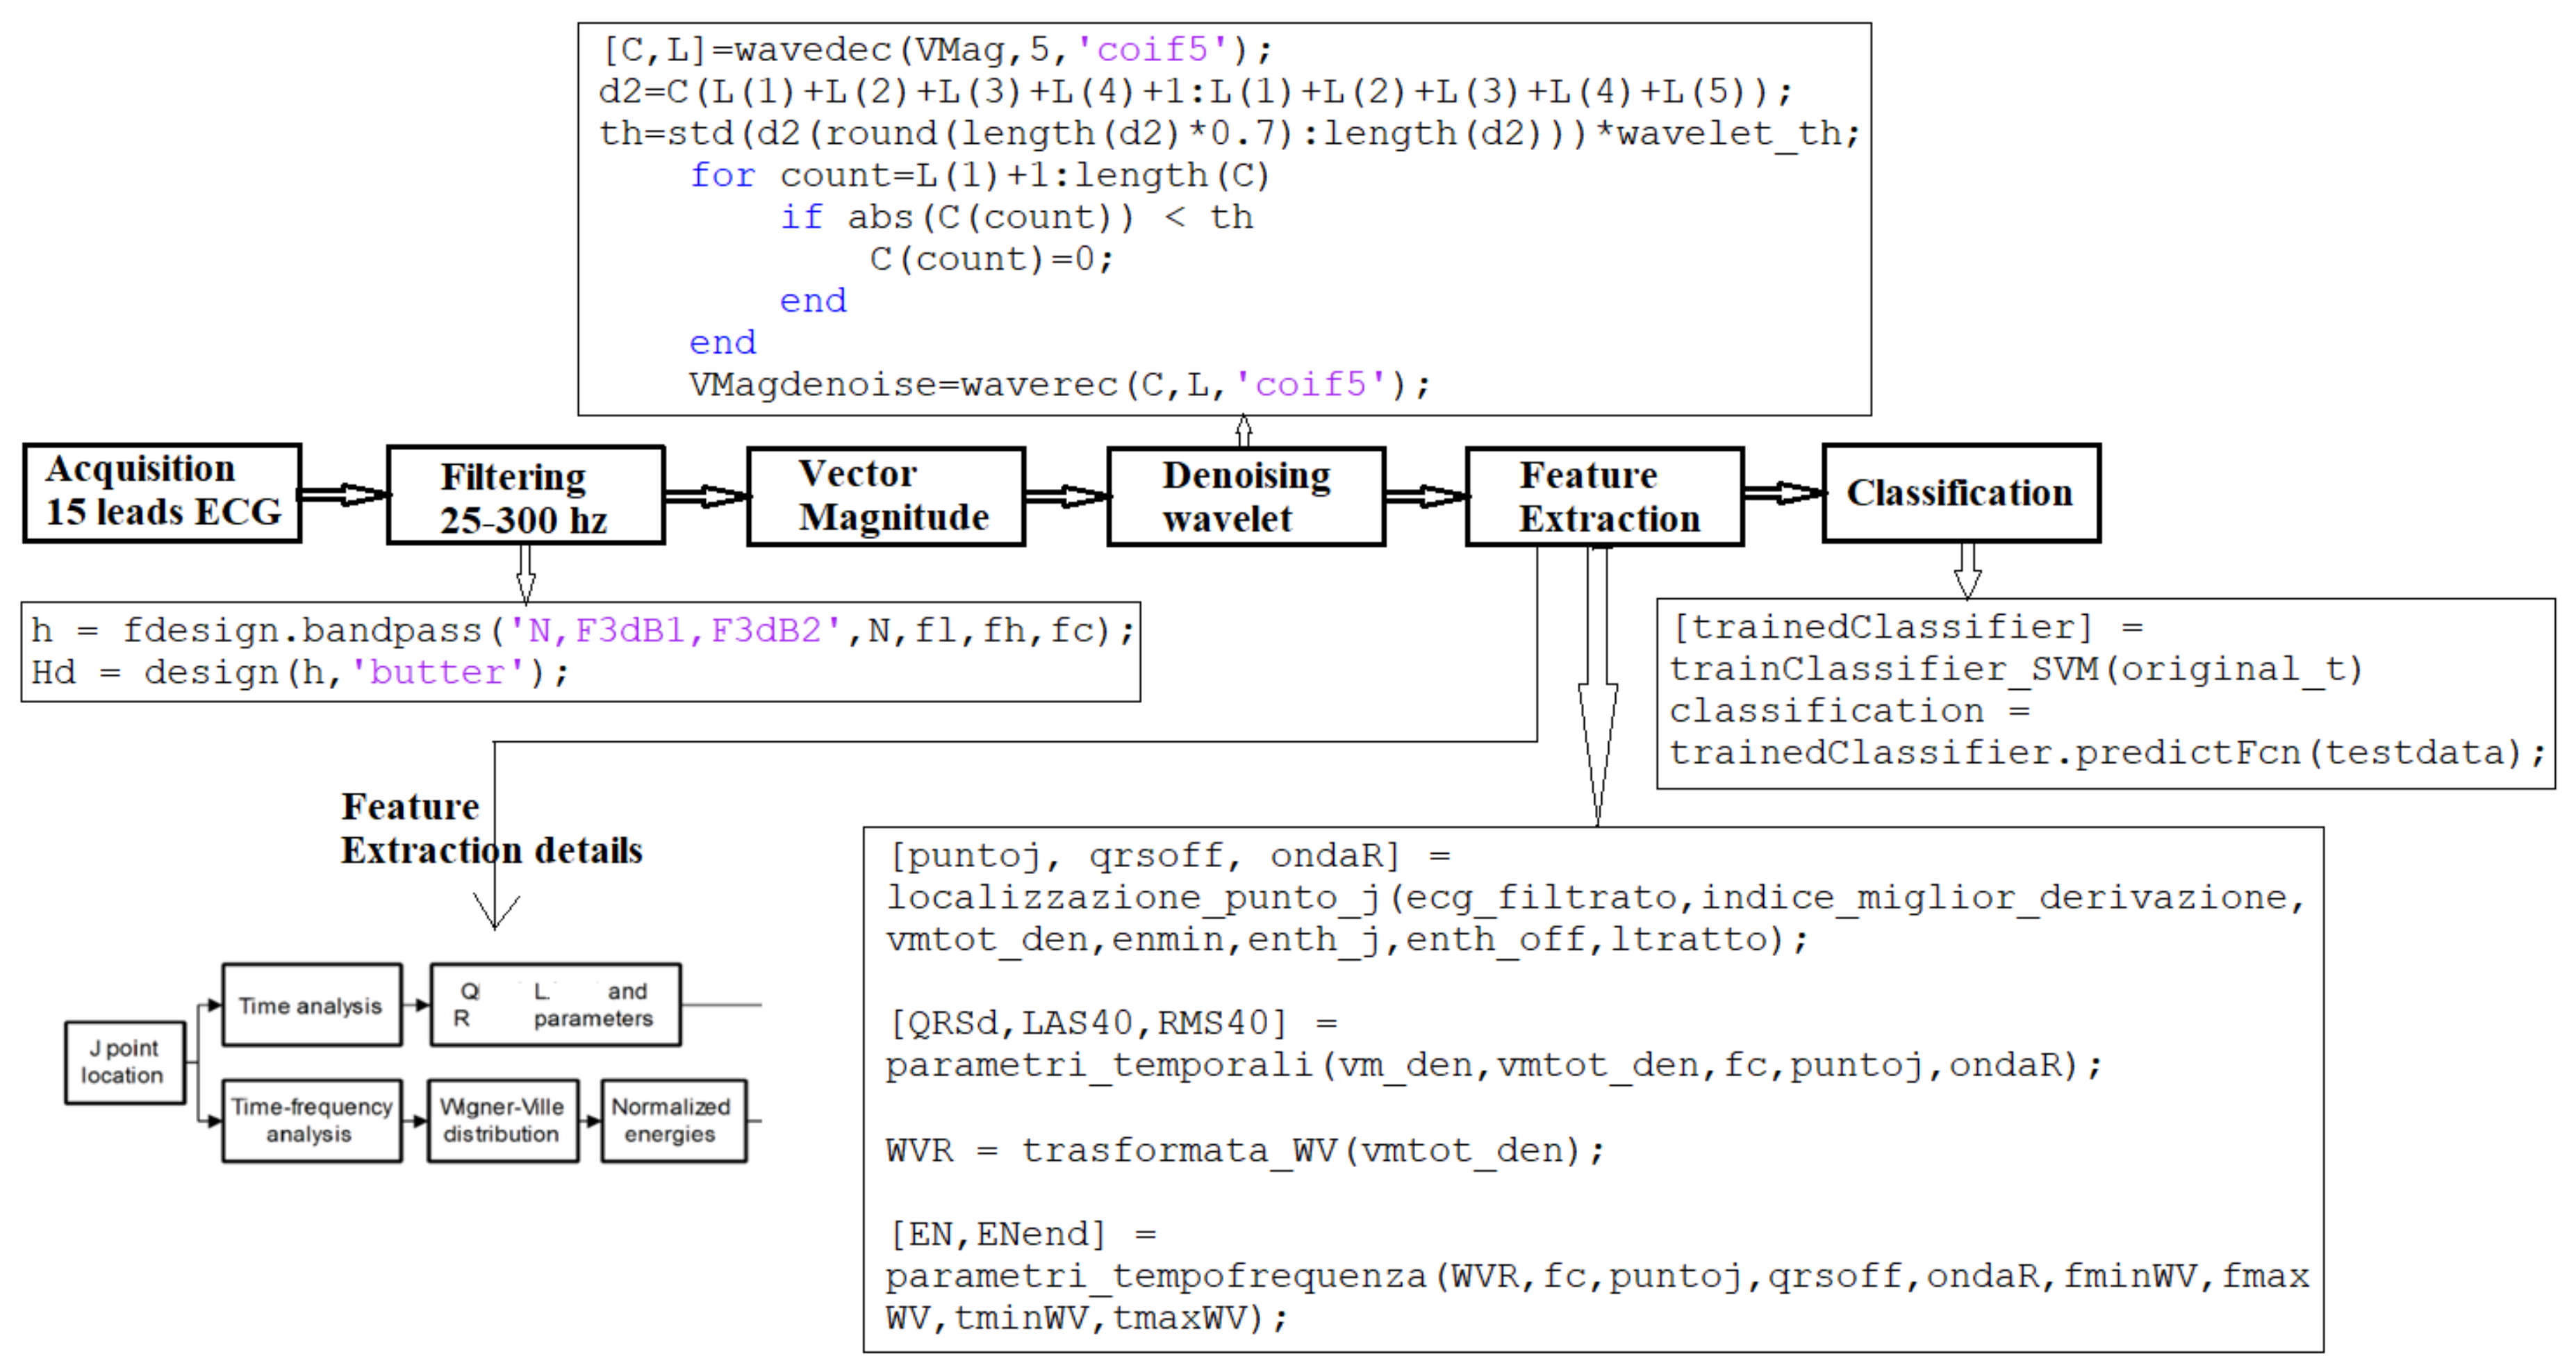
5.1. Step I: Signal Preprocessing

The aim of the signal preprocessing phase is baseband filtering and noise level reduction.

5.1.1. Filtering

The filtering procedure is introduced to:
  • remove both the DC component and the signal wandering due to low frequency terms;
  • limit the noise energy by restricting the bandwidth of the acquired HR-ECG signal to the components of interest.
To achieve this aim, a fourth-order bandpass Butterworth filter with cutoff frequencies at 25 and 300 Hz has been used. To reduce misleading effects on test signals coming from the 50 Hz noise and all its harmonics (which are caused by the power supply section of the acquisition system), a subsequent second-order stopband comb filter with a 5 Hz attenuated bandwidth was adopted.

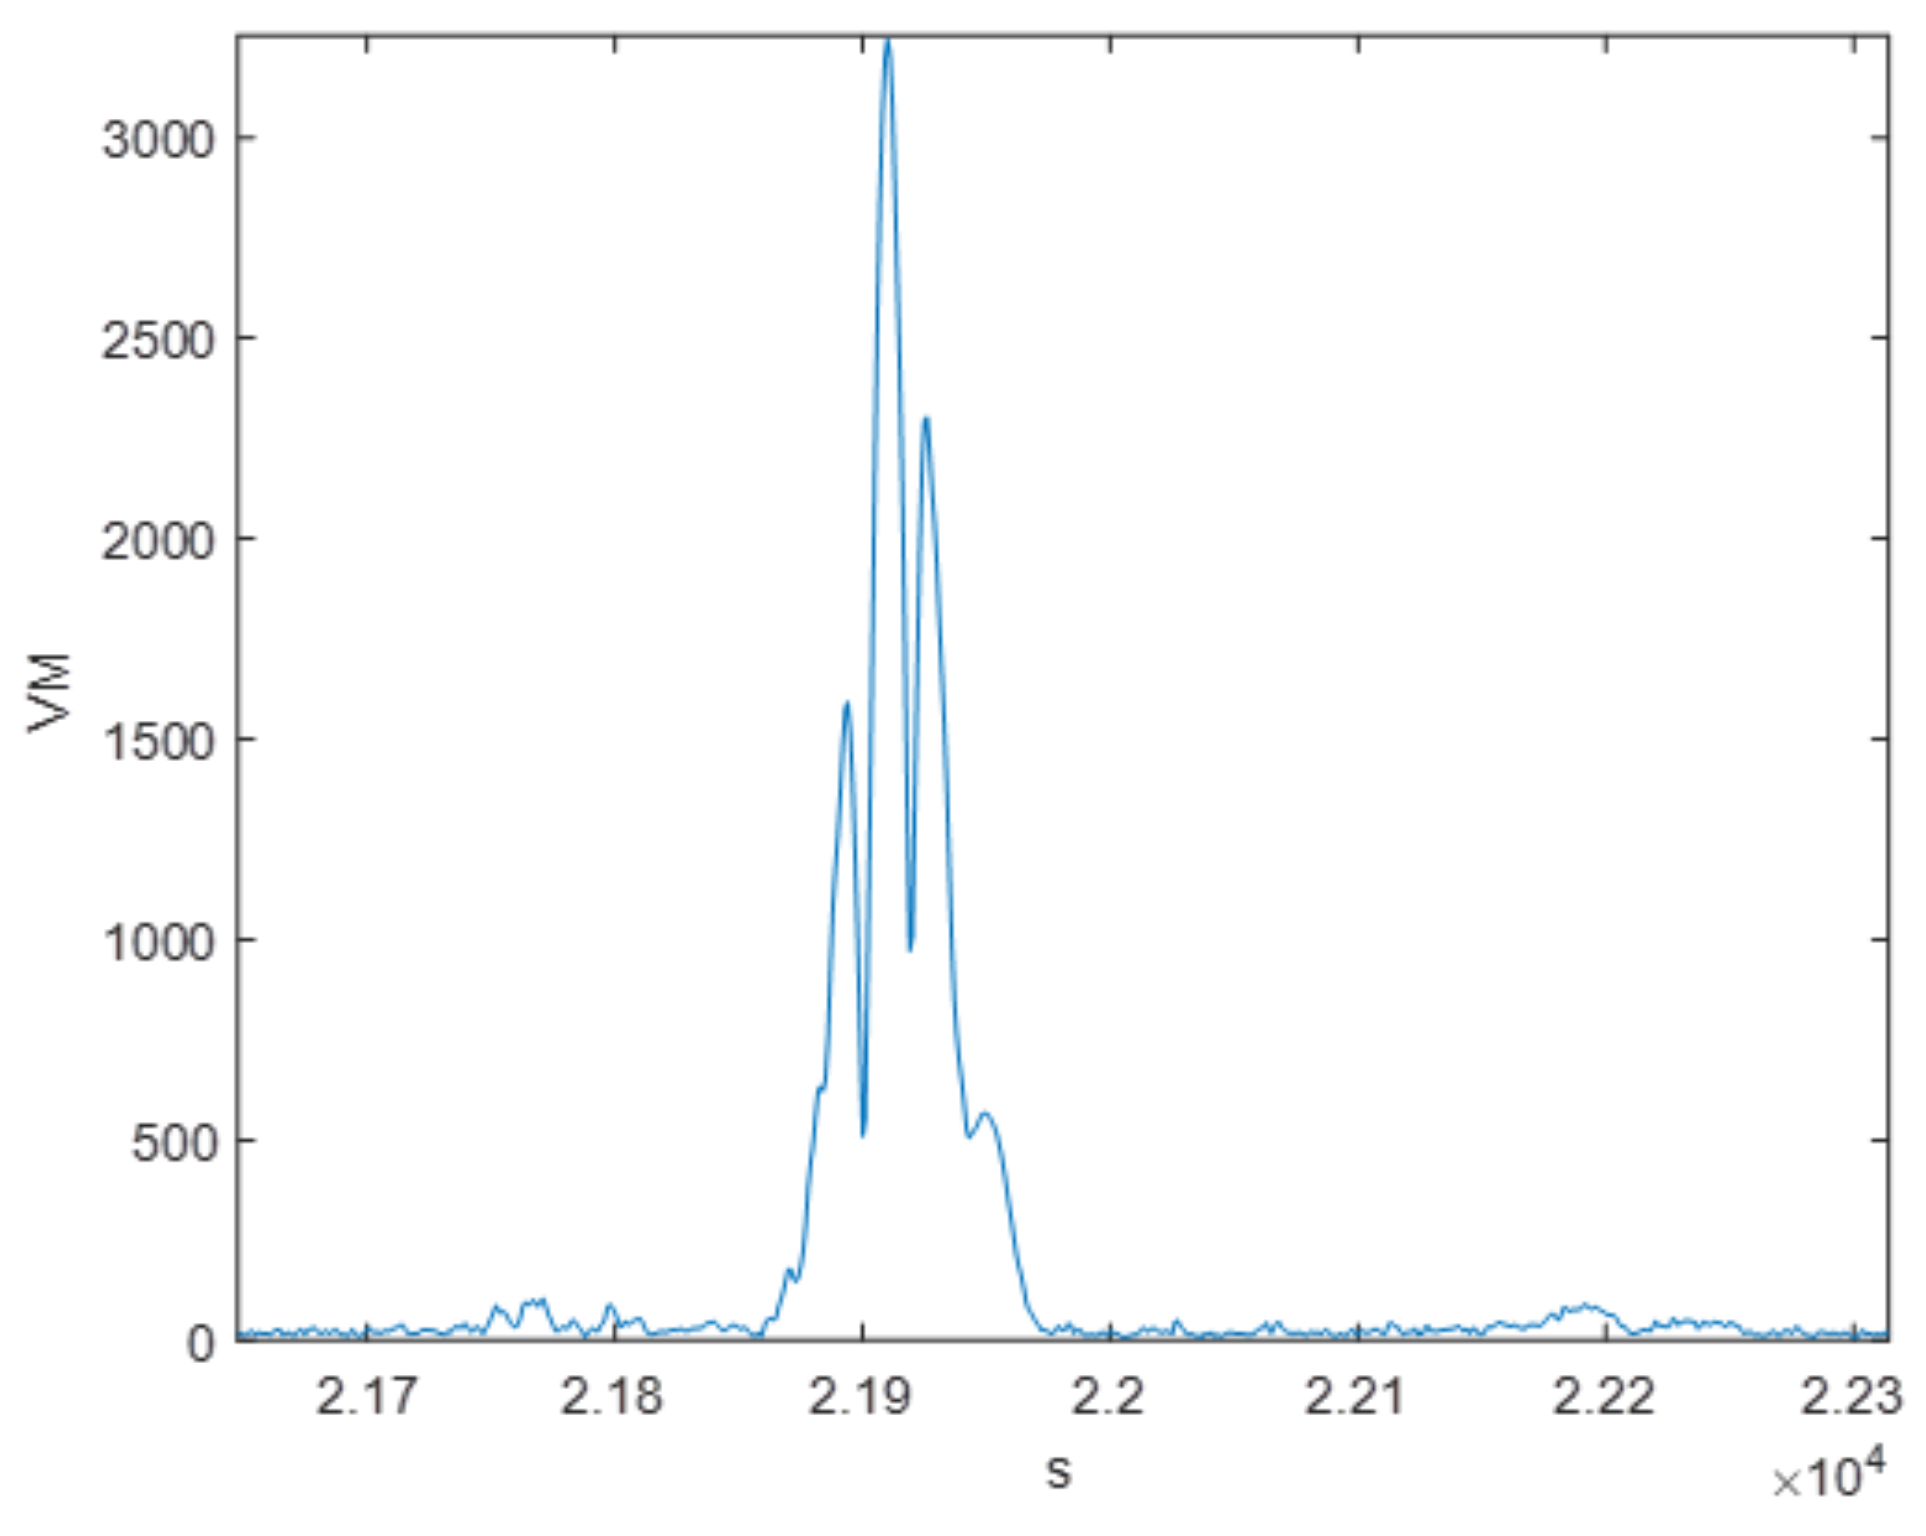
5.1.2. Vector Magnitude Evaluation

The vector magnitude (VM) is recognized as a standard for VLP analysis by the Task Force Committee of the European Society of Cardiology, the American Heart Association, and the American College of Cardiology [50].
The VM standard definition quantifies the energy measured by the three bipolar ECG leads. In this study, the extension of its definition to all available leads of the cardiac signal is carried out. Therefore, adopting a HR-ECG system equipped with N leads, the VM evaluation has been determined using the following equation:
V M = ( k = 1 N X k 2 ( t ) ) 1 2
where Xk(t) is the sample of the kth lead signal at time t.
Therefore, the implemented procedure evaluates one VM for each N-led HR-ECG signal.
In Figure 2, the waveform of one VM signal produced by the implemented tool is indicated.

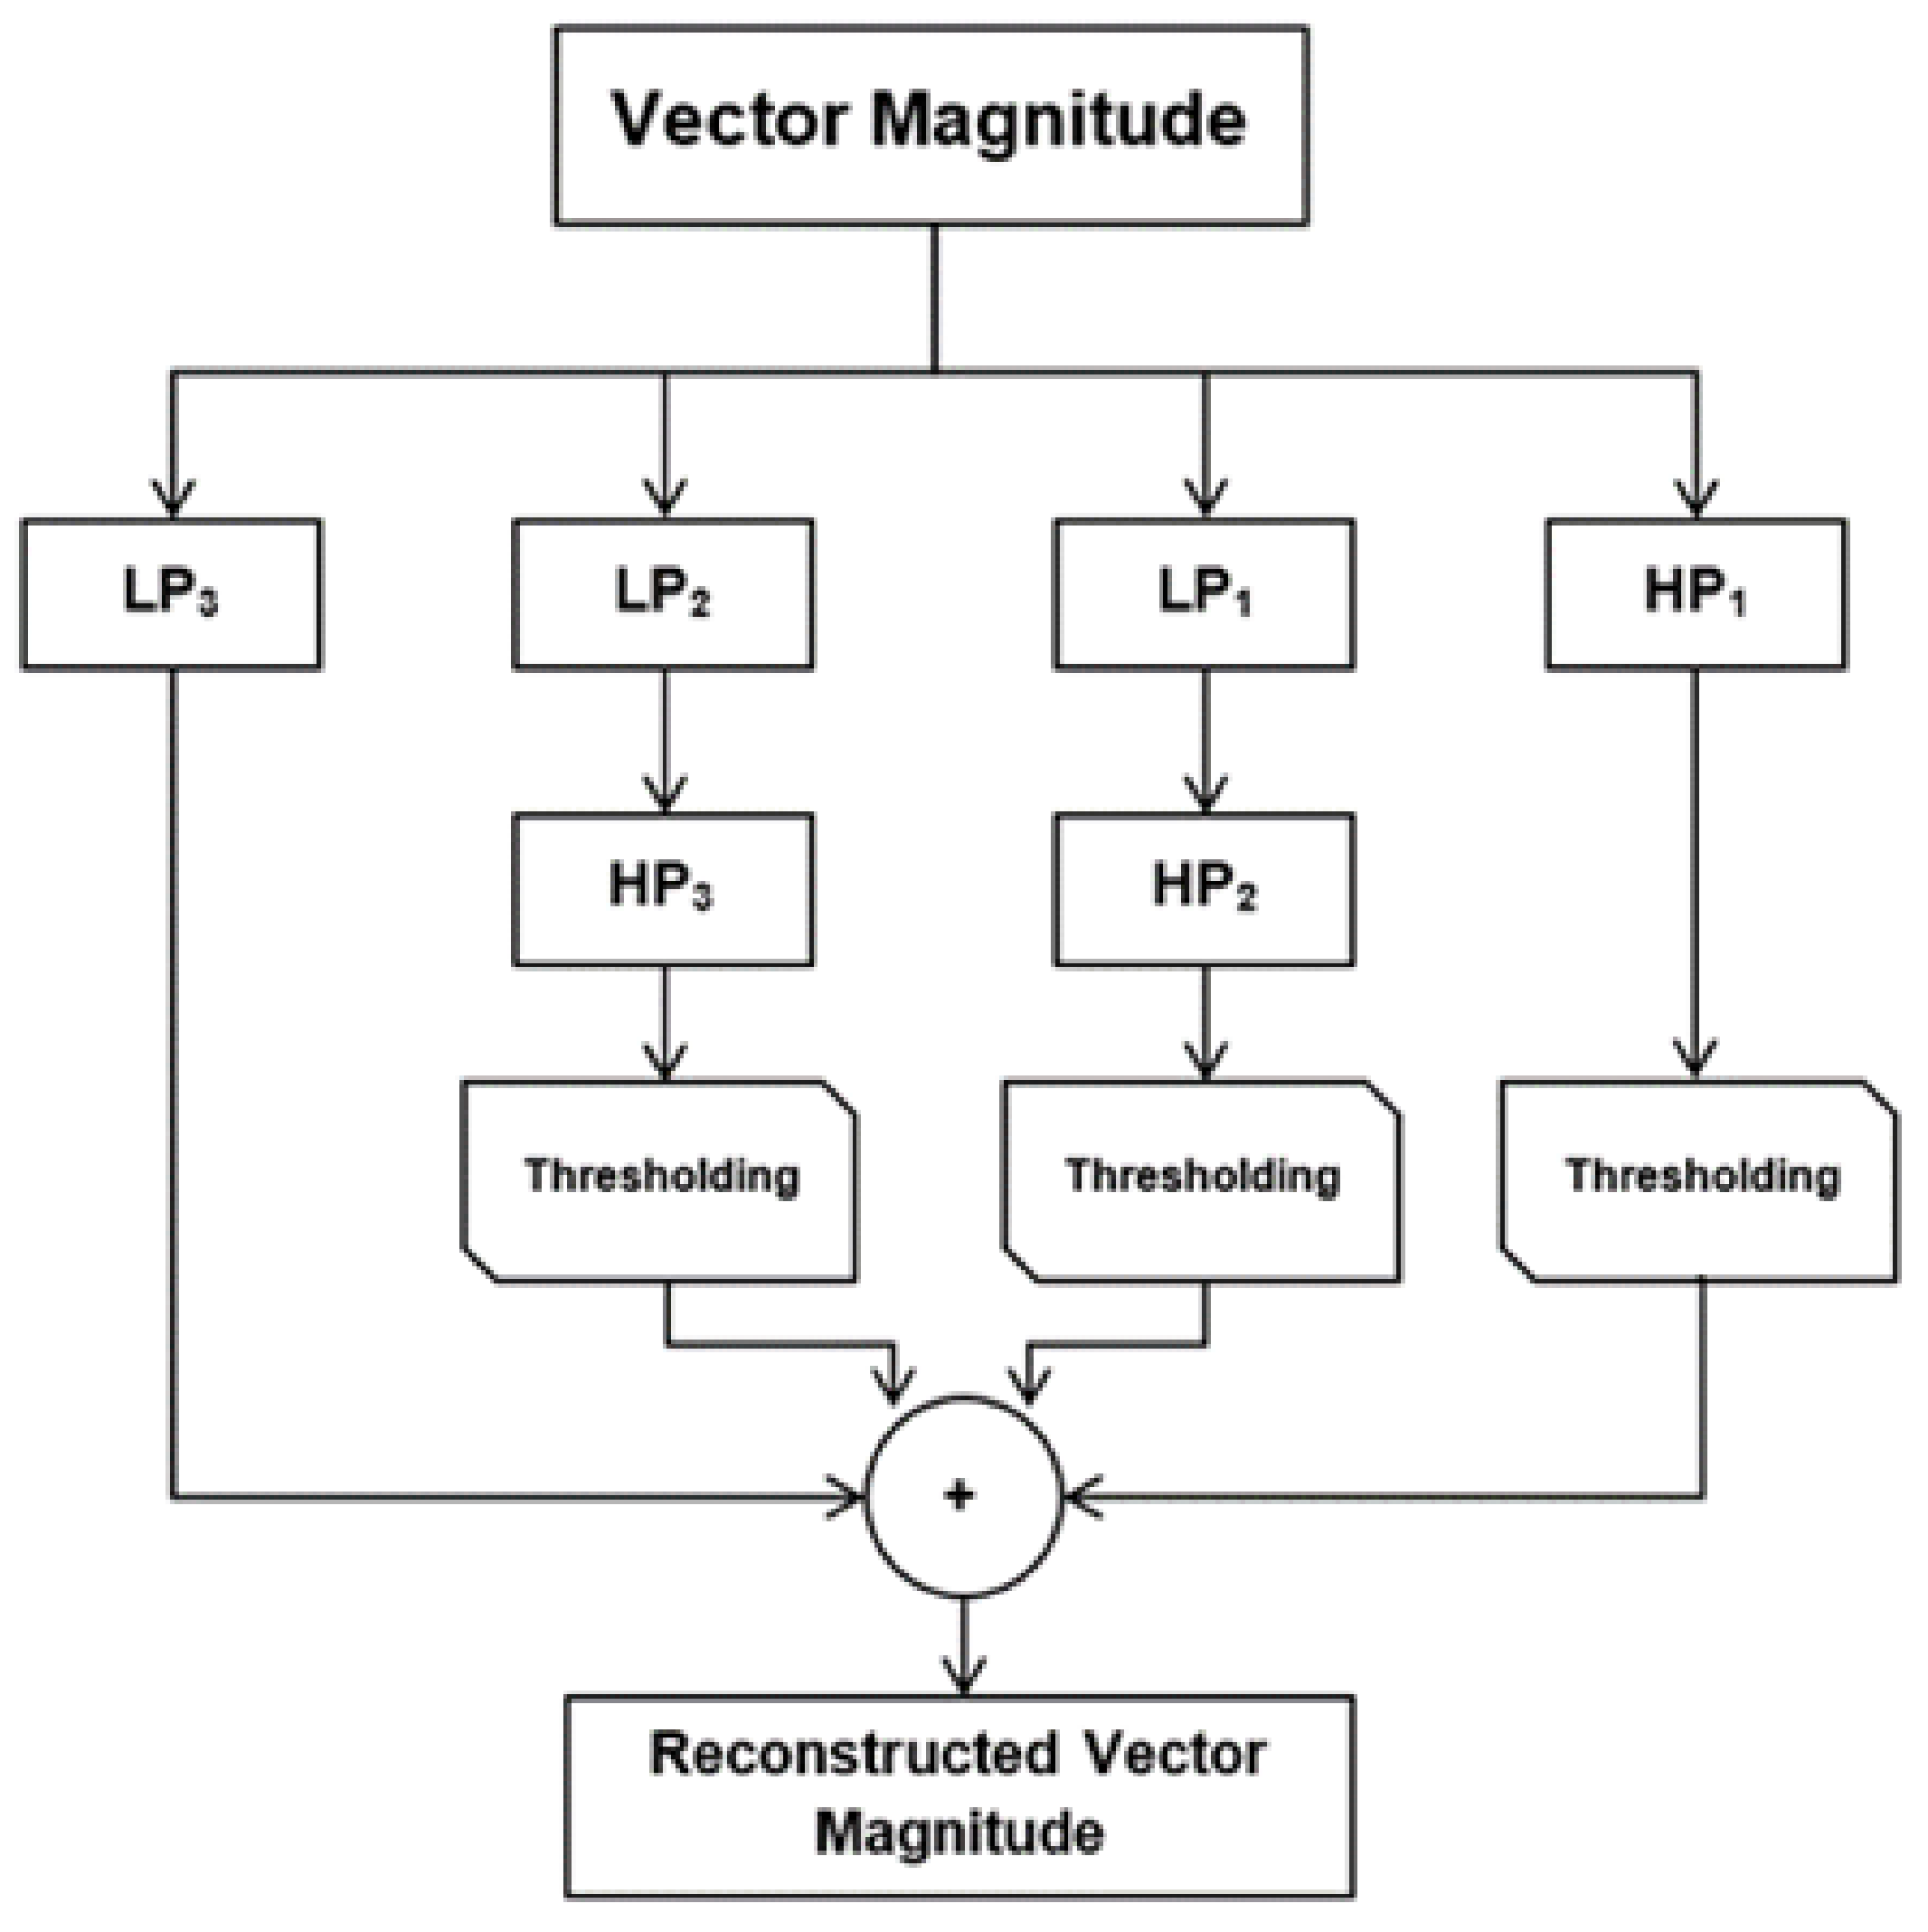
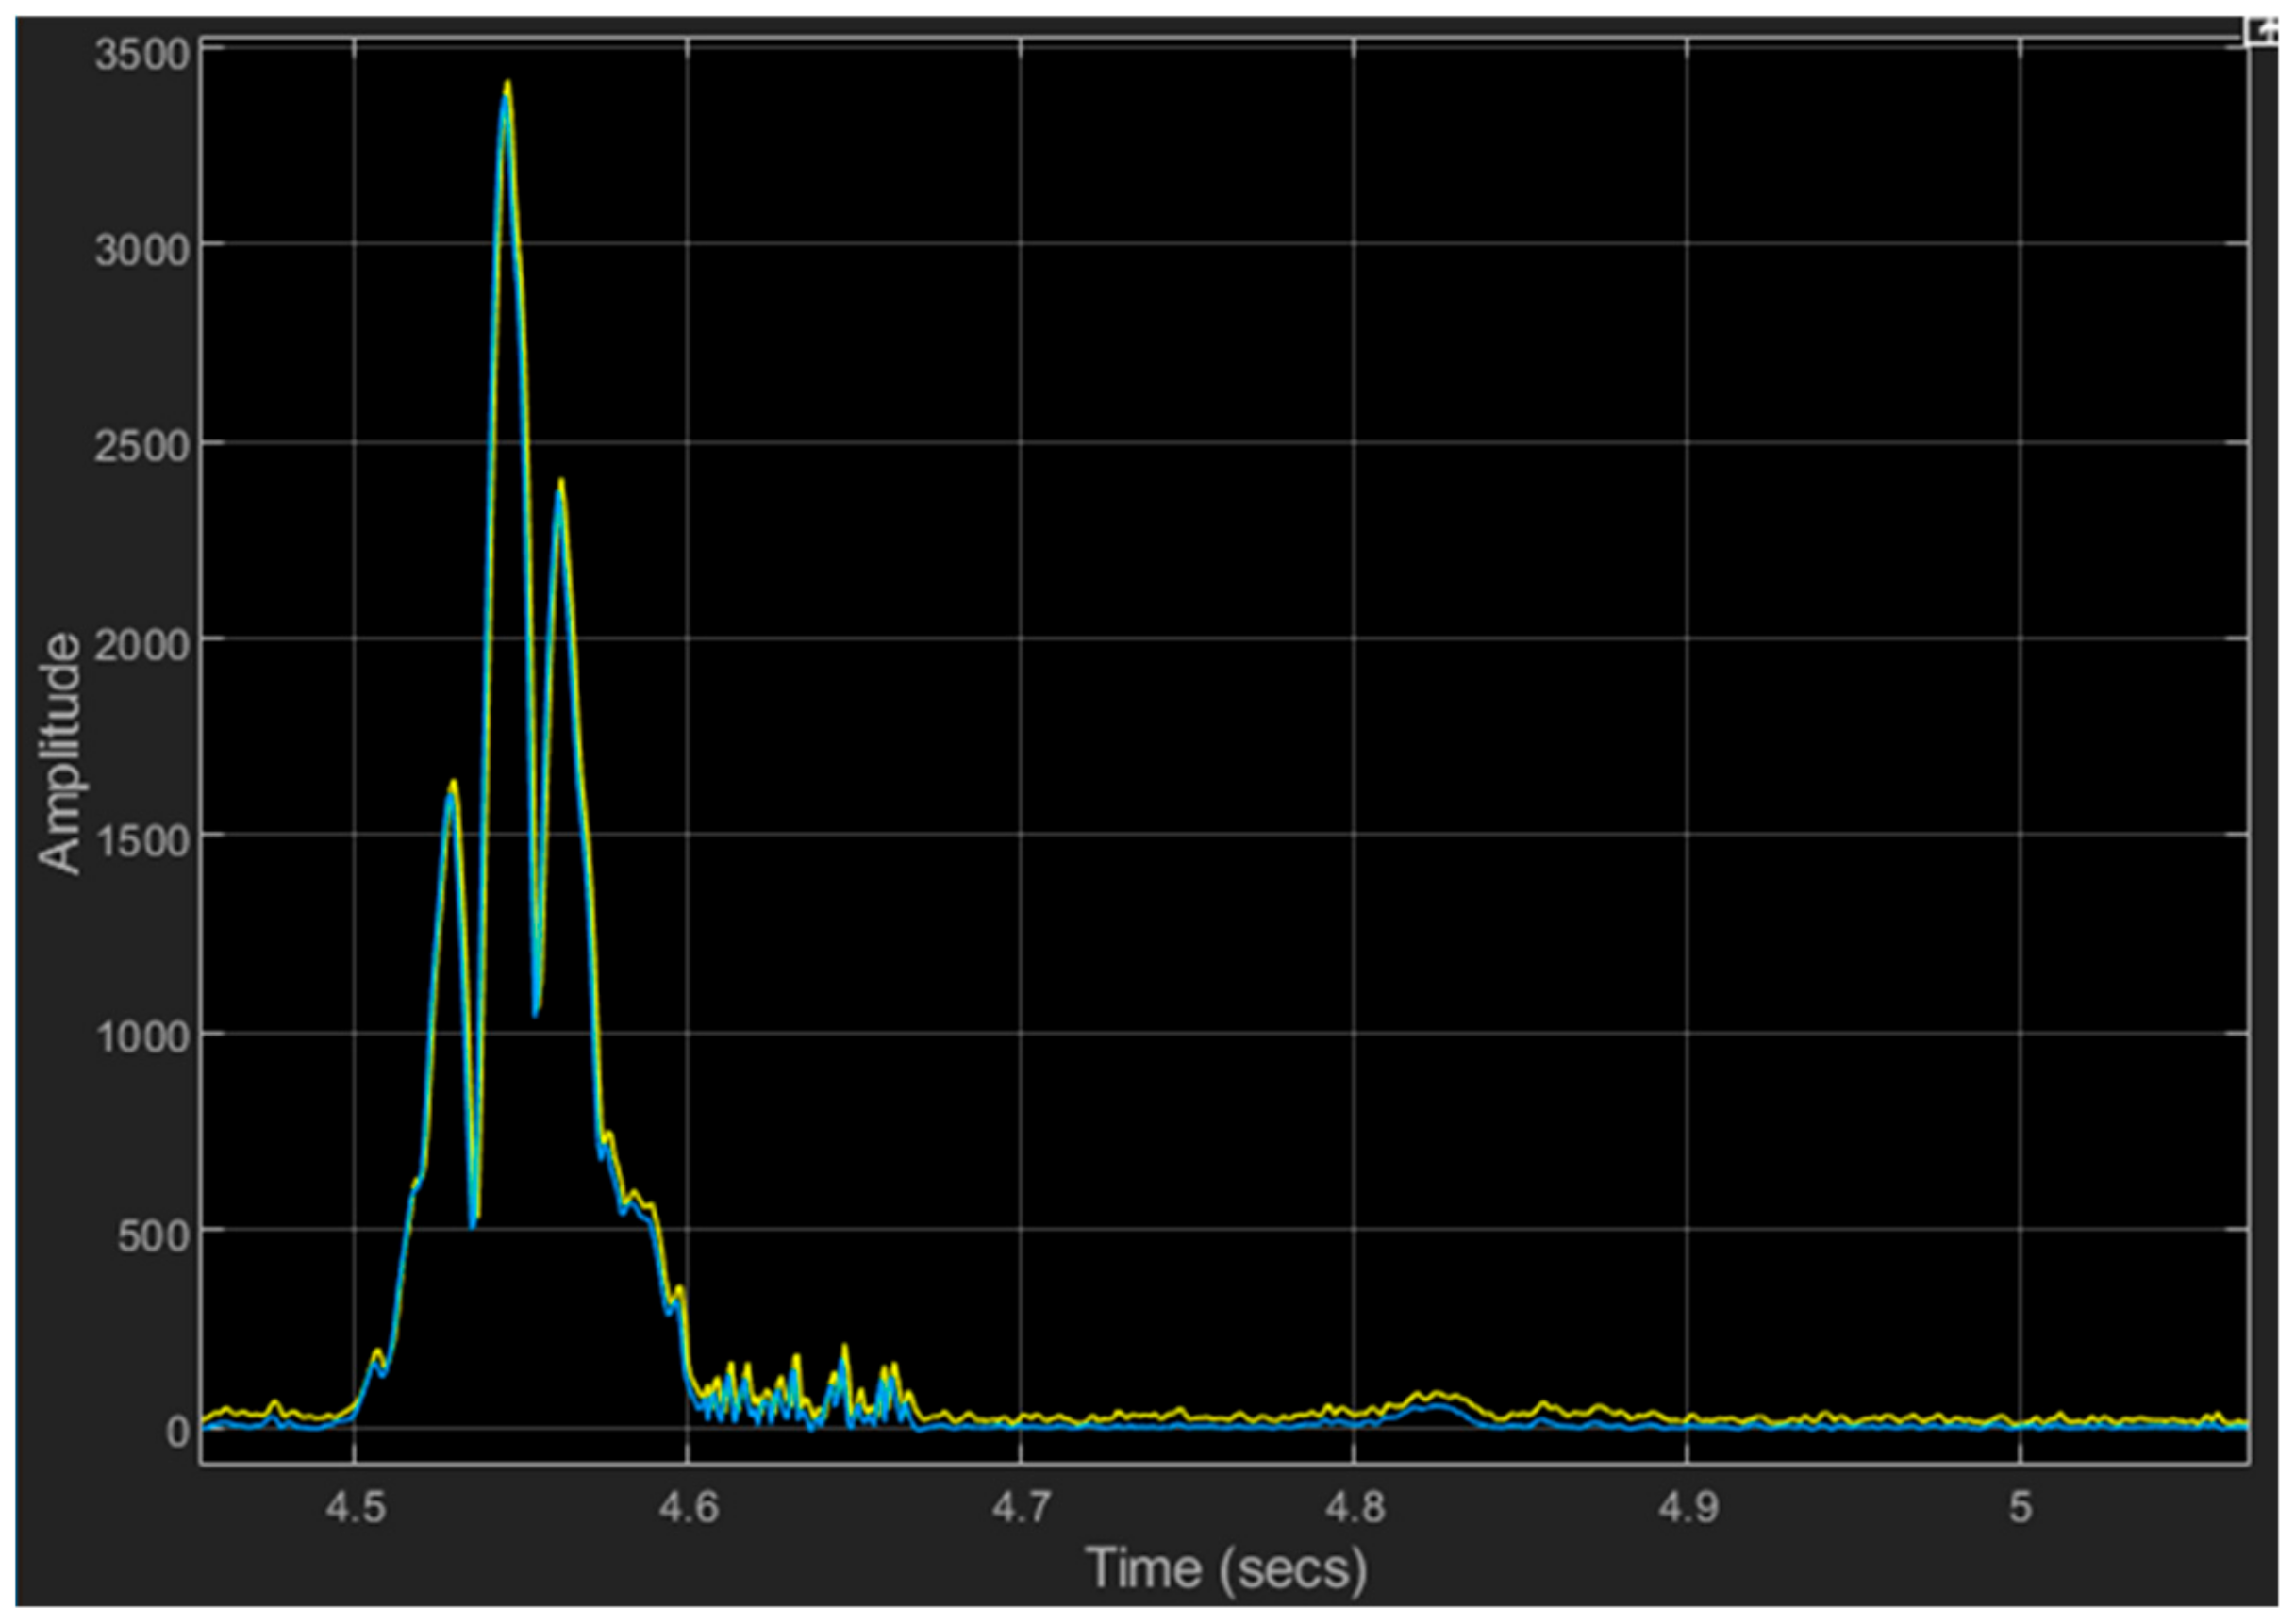
5.1.3. Wavelet Denoising

This step of the procedure is aimed at the denoising of the VM signal to reduce the probability that some VLPs may remain undetected.
Wavelet transform has been used in this phase since it has been proven to be a useful tool for nonstationary signal analysis [51]. As the performance of signal processing system is heavily dependent on the chosen wavelet family and on the wavelet filter length, accurate selection was carried out. The criterion for the wavelet family selection was the orthogonality property which allows wavelet transforms to be implemented as perfect reconstruction filter banks. Moreover, orthogonality results in efficient signal processing since it ensures the absence of redundancy of the information represented by the wavelet coefficients [52]. Coiflet5 wavelet was selected as the basic wavelet for shape matching with the VLP curve feature. Its orthogonal features allow for the decomposition of the signal into a set of independent coefficients. Three decomposition levels were taken into account, splitting the signal bandwidth into four bands [2]. The lower band contains the smoothed signal and is called the “approximation level”, while the other three bands contain the signal details and are called “detail levels”.
All subband coding filters are made by second-order infinite impulse response (IIR) Butterworth filters having the same biquad structure and differing only in their coefficient values.
For denoising purposes, hard thresholding of the three detail levels was adopted and the four levels were then added to achieve the denoised vector magnitude (DVM) [53].
Several approaches can be considered for the threshold selection. The choice is a tradeoff between two parameters; indeed, a large threshold value removes a significant amount of signal energy while a small value does not suppress a large amount of noise.
The values adopted in this study are derived from statistical analysis. In particular, two probability density functions of values assumed by VM in the presence and absence of VLP for each of the three detail levels were analyzed. Because the threshold value was calibrated for each detail level, the denoising was performed without the loss of significant information of VLPs.
The removal of linear distortions introduced in the signal analysis phase and subsequent summation to reconstruct the signal, as schematically represented in Figure 3, requires the implementation of an equalization system whose design is presented in [2,37].
For the definition of the equalizer transfer function, the impulse response of the system without thresholding has been evaluated.
The equalizer has been designed to produce a finite impulse response (FIR) filter with 101 coefficients.
The waveforms of the VM and of the related DVM signal obtained as an output of the preprocessing phase is shown in Figure 4. The signal in Figure 4 shows that the VLP occurrence is preserved after the denoising process.

5.2. Step II: Feature Extraction

In this phase, DVM signals are considered as input for the evaluation of characteristic VLP features. To achieve this aim, a procedure for locating the J point in each heartbeat composing one DVM has been developed. Therefore, a bit-to-bit analysis for each DVM is performed. The J point marks the end of the QRS complex (Figure 1b).
Five different features have been selected, three of which are in the time domain and two in the time-frequency domain for quantifying the information content to be fed into the SVM algorithm [54] (Figure 5):
  • F1: time lag between the R peak and the J point;
  • F2: root mean square voltage of the terminal 40 ms of the QRS complex;
  • F3: amount of time during which the QRS complex remains below 40 µV;
  • F4: EVLP/EQRS;
  • F5: EEND/EQRS.
where
  • EEND is the energy calculated in an area next to the QRSoff point;
  • EQRS is the energy of the QRS complex;
  • EVLP is the energy of the VLP.
In detail,
E E N D = 1 k 2 f = f min f max t = Q R S o f f Q R S o f f + 80   ms T F R 2 ( t , f )
E Q R S = 1 k 3 f = f min f max t = R w a v e Q R S o f f T F R 2 ( t , f )
E V L P = 1 k 1 f = f min f max t = t min t max T F R 2 ( t , f )
in which
  • QRSoff is the end of the QRS complex;
  • TFR is the two-dimensional matrix resulting from the Wigner Ville distribution of the signal [55];
  • ki is a normalization parameter defined as the product between the row and column numbers of the considered region in the TFR matrix;
  • tmin = J point − 55 ms;
  • tmax = J point + 25 ms;
  • fmin = 55 Hz;
  • fmax = 300 Hz;

5.3. Step III: Classification

The aim of Step III is the classification of HR-ECG records as abnormal or normal, depending on whether there is VLP occurrence or not. Therefore, DVM signals were analyzed for detecting possible VLPs.
To achieve this goal, the implemented tool considers one beat at time of the DVM signal, and verifies the presence of VLP inside by using a machine learning approach. The feature set of the DVM signal under the test represents the classifier input while the output is the class to which the signal belongs to (normal or subnormal). Two different classes are indicated: the class of DVM without VLPs (here addressed as type A signal, namely, “normal ECG”) and the class of DVM with VLPs (type B signal, namely, “abnormal ECG”).
Taking into account the five previously defined features, the SVM technique is adopted for VLP recognition and, consequently, VLP detection is regarded as a two-class pattern classification matter. With the SVM formulation, the classifier is trained using supervised learning to automatically detect VLPs in one DVM. The cubic function is adopted as kernel, and the optimization of the kernel function-associated parameter is performed adopting the holdout validation method with 25% holdout.
The SVM classifier training has been carried out by the sequential minimal optimization technique and the training phase is performed adopting 90 DVM signals, each one lasting for 2 minutes; half of these contain VLPs while the others are lacking in VLPs.
The block diagram of the implemented VLP detection system architecture is indicated in Figure 6. In so doing, the operations carried out by every single block and the functional interconnection among blocks are highlighted.

6. Performance Evaluation

6.1. Database Used as Test Bench

The proposed method was evaluated using real electrocardiographic signals provided by the PhysioNet database. In particular, cardiac records of healthy subjects from the PTB Diagnostic ECG Database were adopted for procedure testing [45]. The signals comprising the database are characterized by a sampling frequency of 1 kHz and resolution of 16 bit with 0.5 µV/LSB and total duration of about 2 min. Each HR-ECG is recorded using 15 leads: the 12 conventional and 3 orthogonal (Frank leads).
In particular, the dataset adopted as test bench is composed of two groups of signals: the first group (named group A) contains sixty 15-lead HR-ECG records lacking VLPs and extracted from the PTB Diagnostic ECG Database; the second group (named group B) consists of sixty 15-lead HR-ECG signals with VLPs.
The B-type signals were synthesized by adding on the ST segment of healthy HR-ECG signal (belonging to the PTB Diagnostic ECG Database) waveforms similar to the VLP signal. Low amplitude (1–20µV), short duration (5–50ms), and wideband spectrum (40–250Hz) are the VLP characteristics taken into account for the simulation [56,57].
Based on the aforementioned features, VLP signals were simulated as the sum of sinusoids in accordance to expression (6):
V L P ( t ) = n = 1 4 α n sin ( 2 π f n t + φ n )
where αn, φn and fn are suitable selected parameters to obtain a simulated waveform as close as possible to a classical VLP signal.
In particular, simulated VLPs were added on 50 randomly chosen beats in one healthy HR-ECG record, and their position changed randomly from beat to beat inside the ST segment.

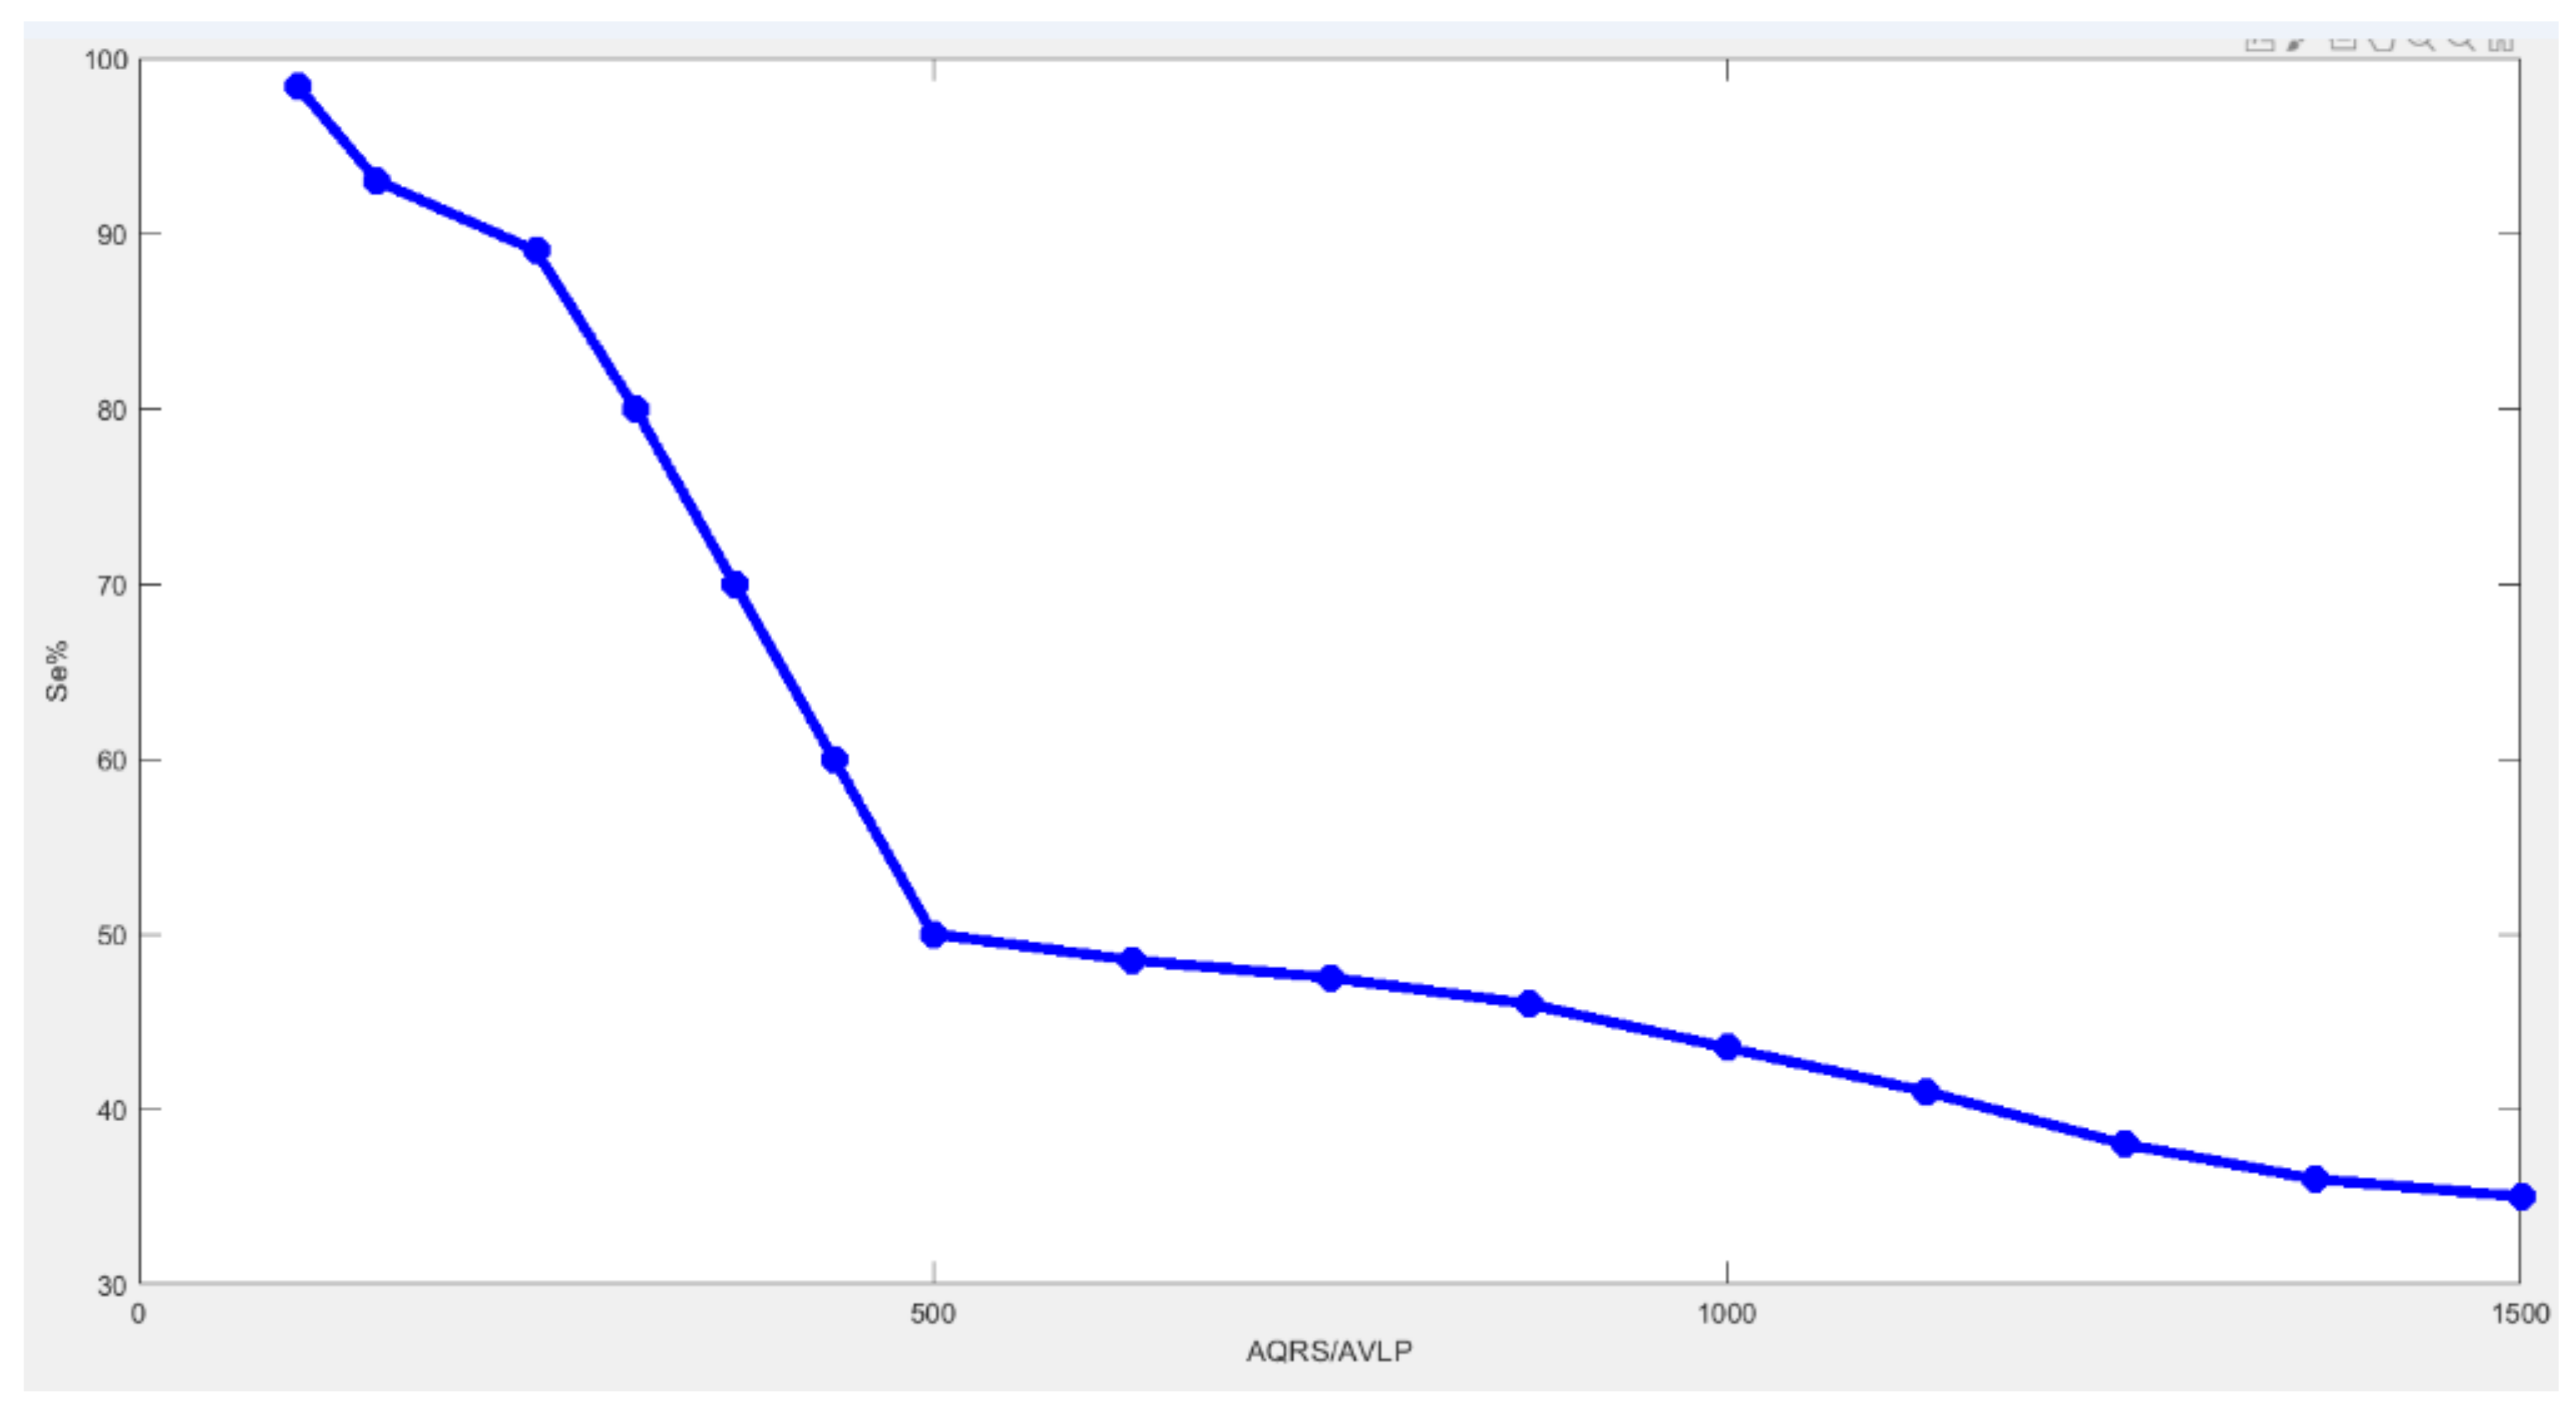
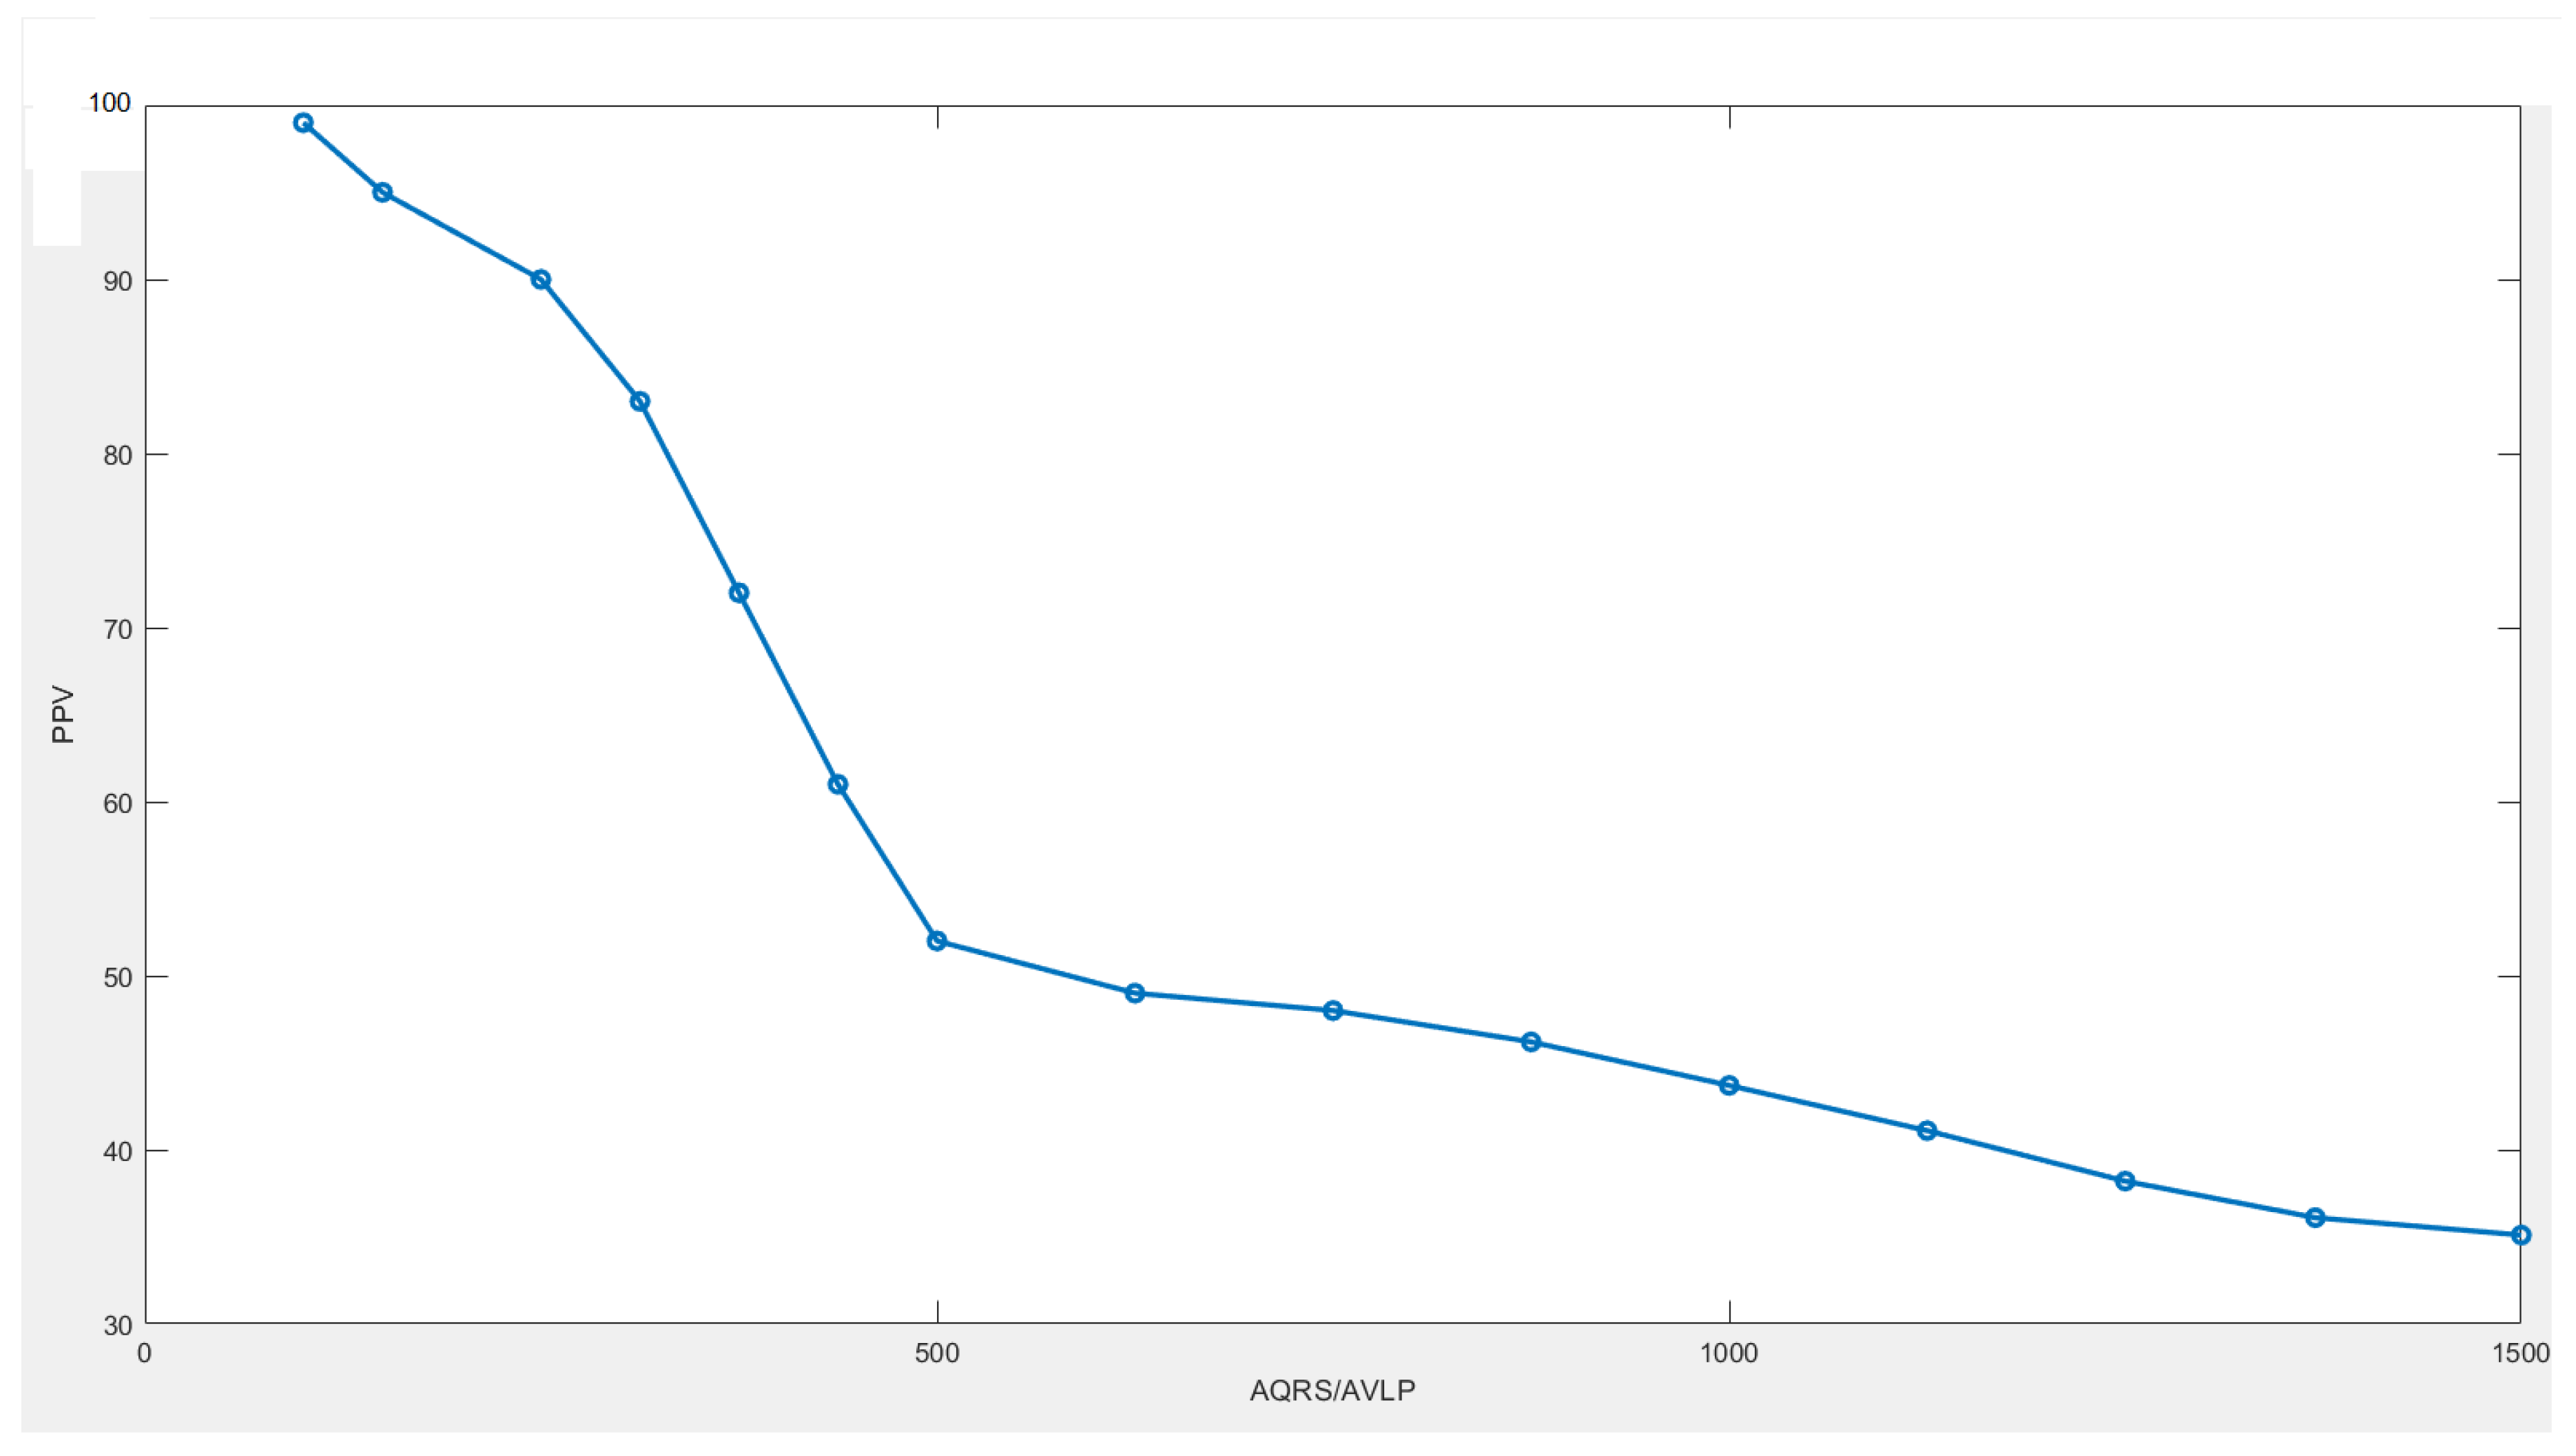
6.2. Evaluation Parameters

The performance of the implemented diagnostic system is measured evaluating sensitivity (also known as recall), specificity, precision (also called positive predictive value), and accuracy.
The sensitivity (Se) is defined as the probability of detecting a VLP when a VLP actually exists; the specificity (Sp) represents the probability of obtaining a negative HR-ECG record when no VLP exists; the positive predictive value (PPV) is the proportion of the detections the system classifies as VLPs that are actually VLPs; and the accuracy (Ac) is defined as the observed agreement between the procedure results and the physician’s opinion about the HR-ECG under test.
They are computed adopting the following expressions:
S e = T P T P + F N
S p = T N T N + F P
P P V = T P T P + F P
A c = T P + T N T P + T N + F P + F N
where
  • TP (number of true positives) is the number of correct identifications of VLPs inside the HR-ECG record under test;
  • FN (the number of false negatives) is the number of VLPs present in the HR-ECG that the algorithm is not able to detect;
  • FP (the number of false positives) is the number of VLPs detected by the algorithm but are actually not present in the HR-ECG;
  • TN (the number of true negatives) is the number of HR-ECG records that the procedure considers without VLPs that actually do not have VLPs.
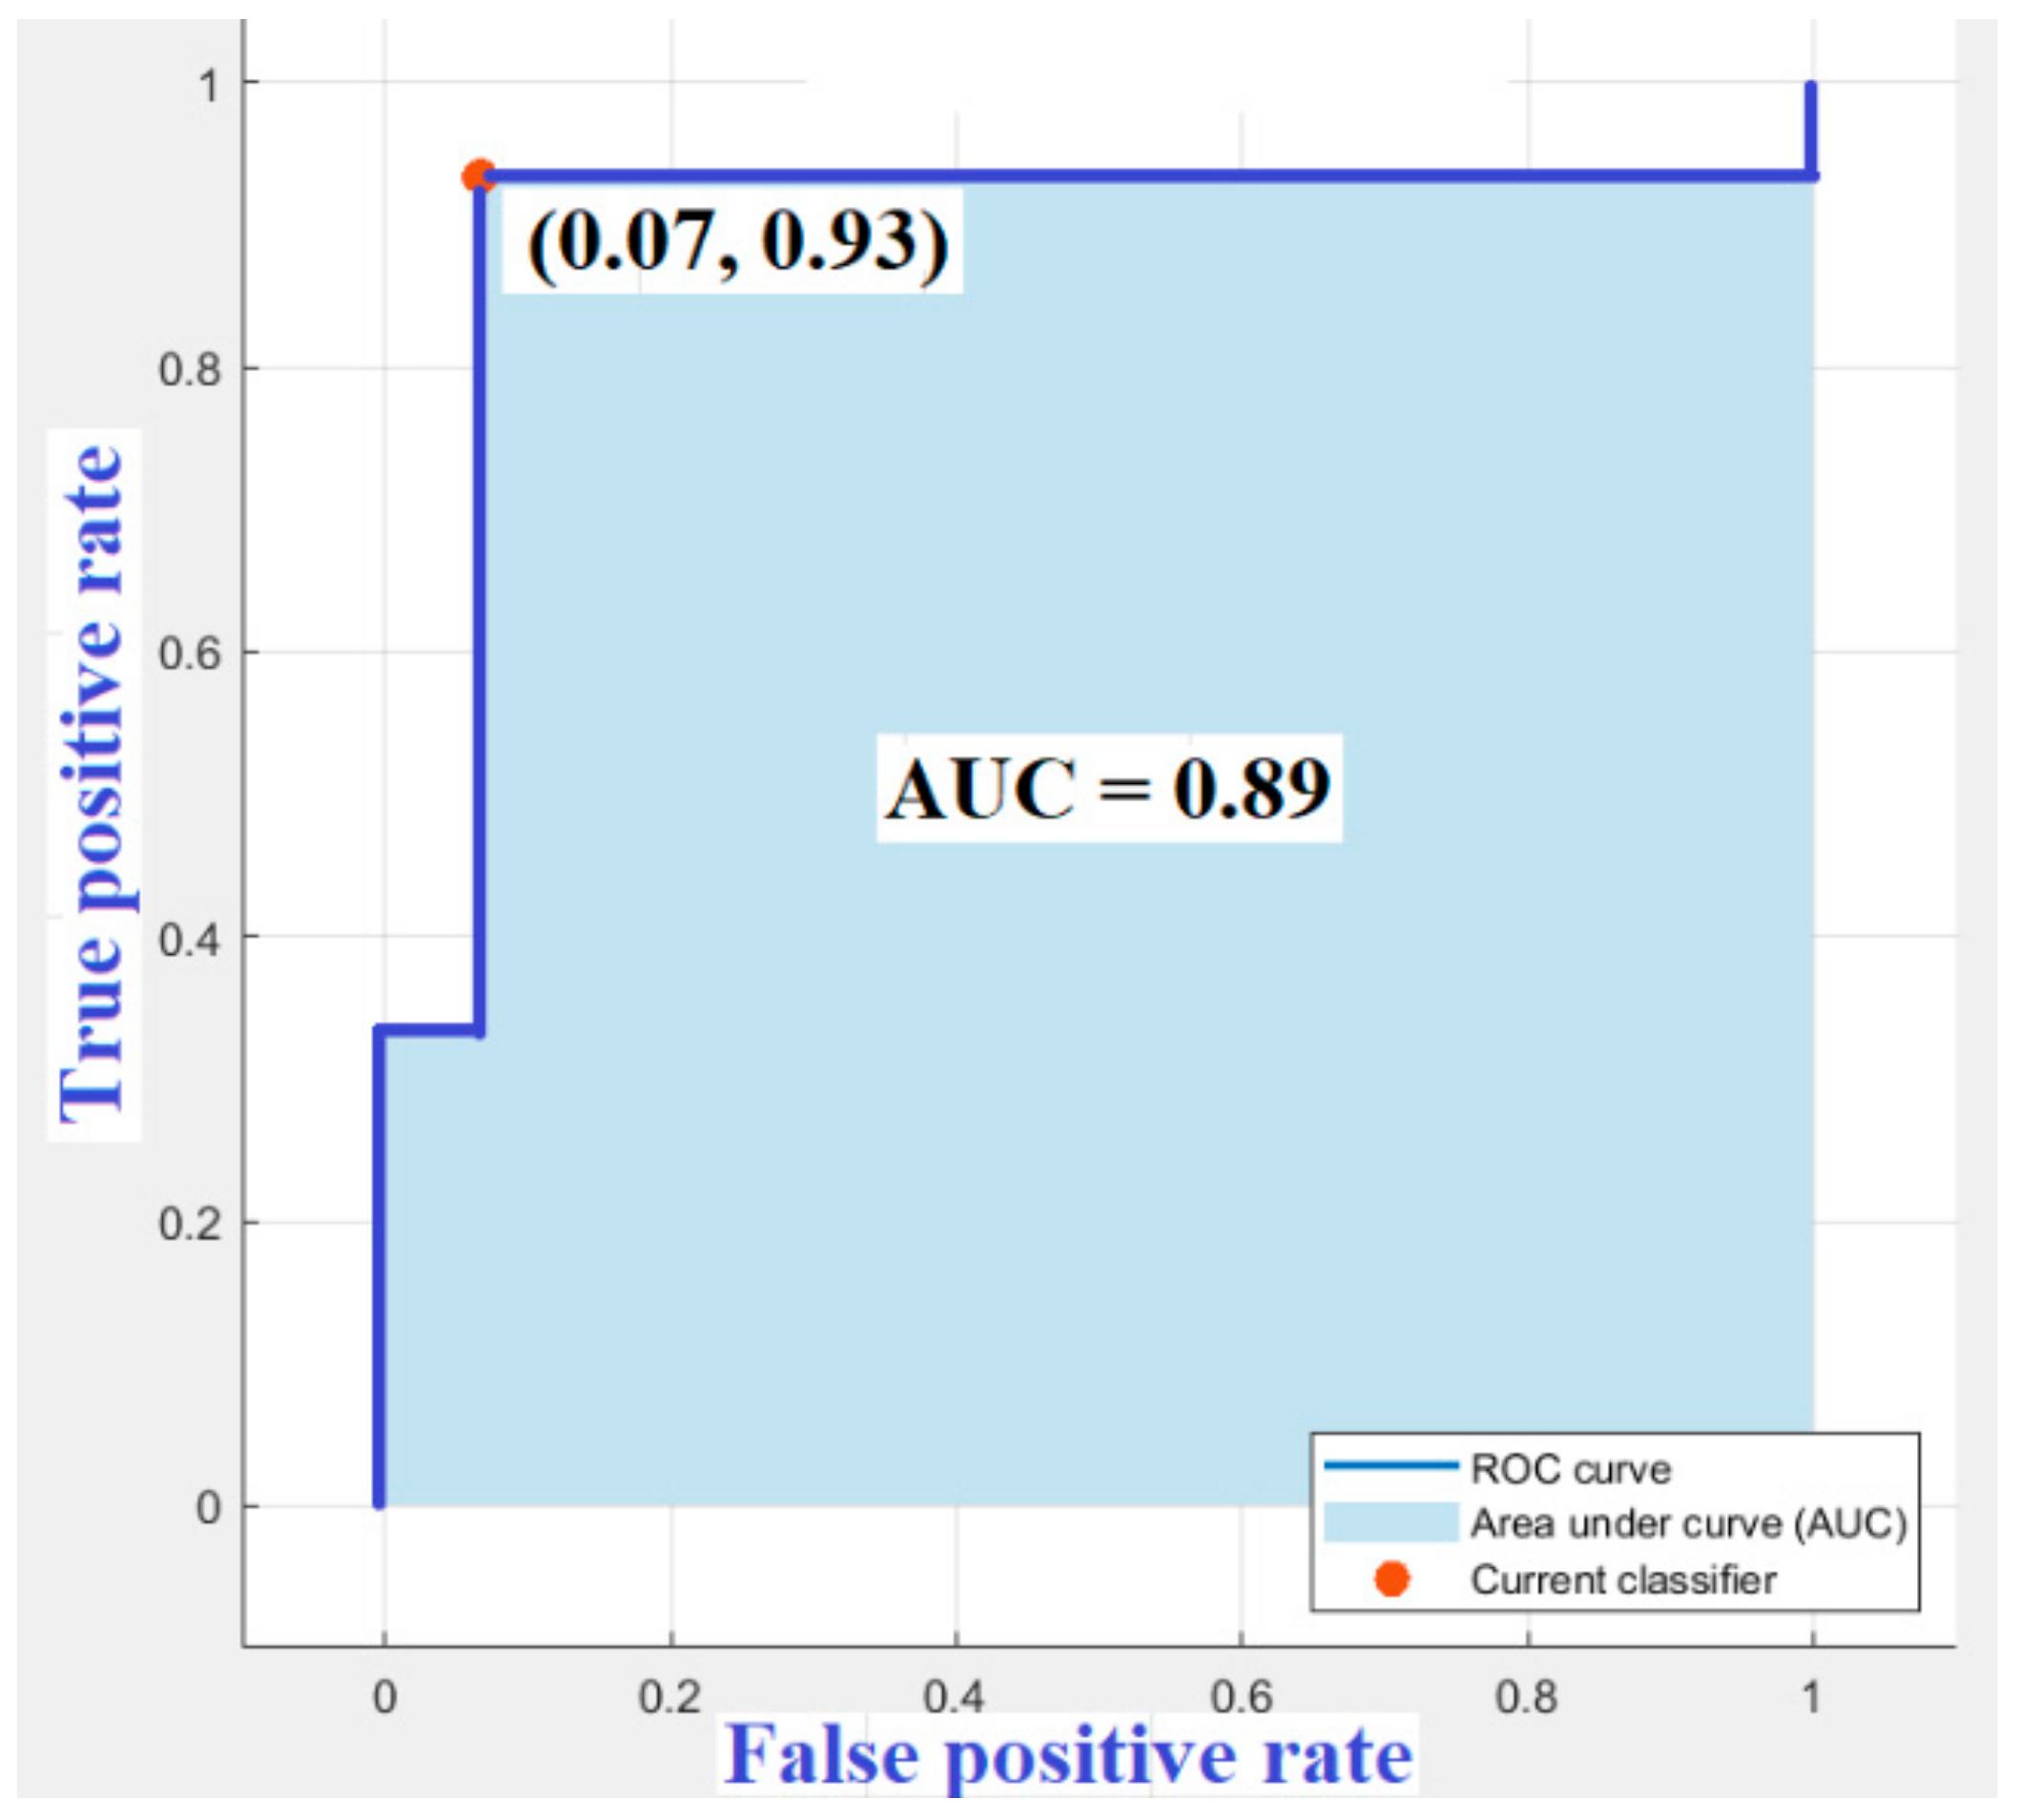
In Table 1, a fourfold table which summarizes the meaning of the parameters previously defined is reported.
In general, high values of the above parameters are desirable for CAD systems. In reality, a tradeoff between Sp and Se is necessary both on the basis of impact of FP and FN diagnoses and on the prevalence of disease in the subjects under test.
A single pair of numbers representing Se and Sp is not adequate in comparing diagnostic tests because they depend on the particular confidence threshold used by the observer or the CAD system. To overcome this problem, receiver operating characteristic (ROC) is used. The ROC curve, which indicates the tradeoff between CAD sensitivity and specificity, describes any situation in which the decision maker must make a decision as to which of the two states each test case belongs.
While the ROC is a probability curve, the area under the ROC curve (AUC) represents the degree of separability [58,59]. In fact, the AUC measures the discrimination, that is, the system ability to correctly classify HR-ECG records with or without VLPs. For this reason, the AUC is a measure of the overall performance of a diagnostic test: the closer the AUC value is to 1, the better is the system accuracy.

6.3. Results

For the performance evaluation of the implemented CAD system, the adopted HR-ECG database was divided into a training set, including 45 HR-ECG signals with and 45 without VLPs, as well as a test set consisting of 15 records without and 15 with VLPs.
Since each HR-ECG is recorded adopting 15 leads and is 2 min long, 450 cardiac tracings for a total of about 54,000 heartbeats have been tested for the system evaluation.
To make a benchmark with different CAD systems as indicated in literature, the same conditions have been adopted regarding the ratio between the R peak amplitude and the VLP amplitude of the same heartbeat (AQRS/AVLP). In particular, the R wave absolute peak value was chosen 100 times (40 dB), as much as that of the VLP waveform in each heartbeat. From the comparative assessment, it is evident that more favorable results are reached when adopting the authors’ procedure. In fact, Se, Sp, and Ac achieve values equal to 98.33%, 98.36%, and 98.35%, respectively (Figure 7) [31,44,57,60,61]. Moreover, the authors have also tested the implemented system under more critical conditions and, in fact, several AQRS/AVLP ratios have been analyzed. In particular, the conceived method attains a sensitivity, specificity, positive predictive value, and an accuracy of about 95%, 95.2%, 95%, 95.2%, respectively, at a rate of AQRS/AVLP equal to 150 (≅ 44dB). The abovementioned results are quite similar to the performance achieved in [57], which were obtained by selecting AQRS/AVLP equal to 100.
In Figure 8, the Se trend in terms of the AQRS/AVLP ratio is plotted. It is shown that an accuracy higher than 90% is achieved up to AQRS/AVLP = 200.
In Figure 9, the PPV trend in terms of the AQRS/AVLP ratio is plotted. It is shown that PPV slightly higher than Se values have been achieved with the same AQRS/AVLP ratio as a consequence of a lower increase of FP with respect to FN.
In Figure 10, the ROC curve for the VLP detection system is indicated. The CAD system achieves an AUC value equal to 0.89, which is considered an excellent discriminating value in the literature [62].

7. Discussions and Conclusions

HR-ECG signal is an important piece of diagnostic information for the monitoring of heart functional status. Unfortunately, it is often contaminated by noise and/or interference having external or internal origin, both of which could impair the reliability of diagnoses in clinical applications and practices. Moreover, the dynamic nature of biological systems causes the ECG signal to exhibit stochastic and nonstationary behavior. Therefore, the study of ECG signals by analysts needs to be carried out over several hours with a high probability of missing some vital information. To reduce this probability, computer-based analysis is crucial, and portable, low-cost and low-power systems are required.
In this paper, a computer-aided detection method able to identify the occurrence of ventricular late potential in electrocardiographic signals is presented. To preserve the variability from beat to beat and, likewise, late potentials as much as possible, a beat-to-beat approach is proposed. After a preprocessing phase based on the wavelet technique and a selection of features suitable to properly characterize the ventricular late potential signal, a machine learning approach was used for cardiac signal classification. In particular, a support vector machine classifier was adopted to analyze 15-lead HR-ECG records.
Due to the lack of data in this research field, the performance evaluation procedure is carried out adopting a dataset composed of both real HR-ECG signals from a public database as well as simulated signals. The developed procedure should be adopted for the VLP signal detection in several databases composed of real HR-ECG records with and without VLP.
The implemented method has the benefit to be an open architecture where each block/phase is an object-oriented module which can be upgraded individually to improve the computer-aided detection system.
Experimental results show the method validity and its capability to detect VLPs in HR-ECG signals independently from QRS complex morphologies. Moreover, results with minimum interference from noise and artifacts have been obtained.
A prototype system able to acquire HR-ECG signals is being developed. In the near future, its use in a medical environment will be tested both to assess the system capability under realistic conditions and to evaluate the quality of the assistant provided to physicians.

Author Contributions

Conceptualization, A.G., M.R. and C.G.; Methodology, A.G., M.R. and C.G.; Software, A.G.; Validation, A.G., M.R. and C.G.; Formal analysis, A.G., M.R. and C.G.; Data curation, A.G., M.R. and C.G.; Writing—original draft preparation, M.R. and C.G.; Writing—review and editing, M.R., C.G. and A.G.

Funding

This research received no external funding.

Conflicts of Interest

The authors declare no conflict of interest.

References

  1. Impedovo, D.; Pirlo, G. eHealth and artificial intelligence. Information 2019, 10, 117. [Google Scholar] [CrossRef]
  2. Giorgio, A.; Guaragnella, C. ECG Signal Denoising using Wavelet for the VLP effective detection on FPGA. In Proceedings of the AEIT 2018, Bari, Italy, 3–5 October 2018. [Google Scholar]
  3. Baumann, B. Polarization sensitive optical coherence tomography: A review of technology and applications. Appl. Sci. 2017, 7, 474. [Google Scholar] [CrossRef]
  4. Rizzi, M.; D’aloia, M.; Cice, G. Computer aided evaluation (CAE) of morphologic changes in pigmented skin lesions. Lect. Notes Comput. Sci. 2015, 9281, 250–257. [Google Scholar]
  5. Brem, R. Potential Benefits of Computer-Aided Detection for Cancer Identification and Treatment. JAMA Intern. Med. 2016, 176, 410. [Google Scholar] [CrossRef]
  6. D’Aloia, M.; Cortone, F.; Cice, G.; Russo, R.; Rizzi, M.; Longo, A. Improving energy efficiency in building system using a novel people localization system. In Proceedings of the 2016 IEEE Workshop on Environmental, Energy, and Structural Monitoring Systems (EESMS), Bari, Italy, 13–14 June 2016; pp. 1–6. [Google Scholar]
  7. Qin, C.; Yao, D.; Shi, Y.; Song, Z. Computer-aided detection in chest radiography based on artificial intelligence: A survey. BioMed. Eng. Online 2018, 17, 113–136. [Google Scholar] [CrossRef]
  8. Rizzi, M.; D’Aloia, M. Computer aided system for breast cancer diagnosis. Biomed. Eng. Appl. Basis Commun. 2014, 26, 3–11. [Google Scholar] [CrossRef]
  9. Rejdak, K.; Rubaj, A.; Głowniak, A.; Furmanek, K.; Kutarski, A.; Wysokiński, A.; Stelmasiak, Z. Analysis of ventricular late potentials in signal–averaged ECG of people with epilepsy. Epilepsia 2011, 52, 2118–2124. [Google Scholar] [CrossRef]
  10. Giorgio, A. Health panel: A platform useful to physicians for fast and easy managing of FPGA-based medical devices. IJMEI 2019, 11, 116–151. [Google Scholar] [CrossRef]
  11. Santangeli, P.; Infusino, F.; Sgueglia, G.A.; Sestito, A.; Lanza, G.A. Ventricular late potentials: A critical overview and current applications. J. Electrocardiol. 2008, 4, 318–324. [Google Scholar] [CrossRef]
  12. Wang, J.; Sui, X.T.; Sun, Y.X.; Li, Y.; Yang, G.; Xu, F.; Zhang, Y.L.; Zhang, X.G. Differences of Ventricular Late Potential between Acute STEMI and NSTEMI Patients. West Indian Med. J. 2013, 62, 721–723. [Google Scholar]
  13. Lutfi, M.F. Ventricular late potential in cardiac syndrome X compared to coronary artery disease. BMC Cardiovasc. Disord. 2017, 17, 35–40. [Google Scholar] [CrossRef] [PubMed]
  14. Tatsumi, H.; Takagi, M.; Nakagawa, E.; Yamashita, H.; Yoshiyama, M. Risk stratification in patients with Brugada syndrome: analysis of daily fluctuations in 12-lead electrocardiogram (ECG) and signal-averaged electrocardiogram (SAECG). J. Cardiovasc. Electrophysiol. 2006, 17, 705–711. [Google Scholar] [CrossRef] [PubMed]
  15. Ribeiro, A.L.; Cavalvanti, P.S.; Lombardi, F.; Nunes, M.C.; Barros, M.V.; Rocha, M.C. Prognostic value of signal-averaged electrocardiogram in Chagas disease. J. Cardiovasc. Electrophysiol. 2008, 19, 502–509. [Google Scholar] [CrossRef] [PubMed]
  16. Folino, A.F.; Bauce, B.; Frigo, G.; Nava, A. Long-term follow-up of the signal averaged ECG in arrhythmogenic right ventricular cardiomyopathy: Correlation with arrhythmic events and echocardiographic findings. Europace 2006, 8, 423–429. [Google Scholar] [CrossRef] [PubMed]
  17. Riaz, B.; Majeed, M.I.; Khan, M.A. Association of ventricular late potentials with left ventricular Hypertrophy in patients with systemic arterial hypertension. Pak. Armed Forces Med. J. 2016, 66, 841–844. [Google Scholar]
  18. Kowalewski, M.A.; Urban, M.; Florys, B.; Peczynska, J. Late potentials: Are they related to cardiovascular complications in children with type 1 diabetes? J. Diabetes Complicat. 2002, 16, 263–270. [Google Scholar] [CrossRef]
  19. Lalani, A.P.; Kanna, B.; John, J.; Ferrick, K.J.; Huber, M.S.; Shapiro, L.E. Abnormal signal-averaged electrocardiogram (SAECG) in obesity. Obes. Res. 2000, 8, 20–28. [Google Scholar] [CrossRef]
  20. Babaev, A.A.; Vloka, M.E.; Sadurski, R.; Steinberg, J.S. Influence of age on atrial activation as measured by the P-wave signal-averaged electrocardiogram. Am. J. Cardiol. 2000, 86, 692–695. [Google Scholar] [CrossRef]
  21. Mirza, M.; Strunets, A.; Shen, W.K.; Jahangir, A. Mechanisms of arrhythmias and conduction disorders in older adults. Clin. Geriatr. Med. 2012, 28, 555–573. [Google Scholar] [CrossRef]
  22. Couderc, J.P.; Chevalier, P.; Fayn, J.; Rube, P.; Touboul, P. Identification of post-myocardial infarction patients prone to ventricular tachycardia using time–frequency analysis of QRS and ST segments. Europace 2000, 2, 141–153. [Google Scholar] [CrossRef]
  23. Digiovanni, S.L.; Guaragnella, C.; Rizzi, M.; Falagario, M. Healthcare system: A digital green filter for smart health early cervical cancer diagnosis. In Proceedings of the IEEE 2nd International Forum on Research and Technologies for Society and Industry Leveraging a Better Tomorrow, RTSI 2016, Bologna, Italy, 7–9 September 2016. [Google Scholar]
  24. Mandala, S.; Di, T.C. ECG Parameters for Malignant Ventricular Arrhythmias: A Comprehensive Review. J. Med. Biol. Eng. 2017, 37, 441–453. [Google Scholar] [CrossRef] [PubMed] [Green Version]
  25. Guaragnella, C.; Giorgio, A.; Rizzi, M. Marginal Component Analysis of ECG Signals for Beat-to-Beat Detection of Ventricular Late Potentials. Electronics 2019, 8, 1000. [Google Scholar] [CrossRef]
  26. Goldberger, A.L.; Amaral, L.A.N.; Glass, L.; Hausdorff, J.M.; Ivanov, P.C.; Mark, R.G.; Mietus, J.E.; Moody, G.B.; Peng, C.K.; Stanley, H.E. PhysioBank, PhysioToolkit, and PhysioNet: Components of a New Research Resource for Complex Physiologic Signals. Circulation 2000, 101, e215–e220. [Google Scholar] [CrossRef] [PubMed]
  27. Simson, M.B. Use of Signals in the Terminal QRS Complex to Identify Patients with Ventricular Tachycardia after Myocardial Infarction. Circulation 1981, 64, 235–242. [Google Scholar] [CrossRef] [PubMed]
  28. Lin, C.C.; Hu, W.C. Analysis of Unpredictable Intra-QRS Potentials Based on Multi-Step Linear Prediction Modeling for Evaluating the Risk of Ventricular Arrhythmias. In Proceedings of the Computers in Cardiology, Durham, NC, USA, 30 September–3 October 2007; pp. 793–796. [Google Scholar]
  29. Speranza, G.; Bonato, P.; Antolini, R. Analyzing late ventricular potentials. IEEE Eng. Med. Biol. Mag. 1996, 15, 88–94. [Google Scholar] [CrossRef]
  30. Mitchell, R.H.; Escalona, O. Discriminating At-Risk Post-MI Patients by Fractal Dimension Analysis of the Late Potential Attractor. In Proceedings of the 20th Annual. Conference of the IEEE Engineering in Medicine Biology Society, Hong Kong, China, 1 November 1998; pp. 1573–1575. [Google Scholar]
  31. Orosco, L.L.; Laciar, E. Analysis of ventricular late potentials in high resolution ECG records by time-frequency representations. Latin Am. Appl. Res. 2009, 39, 255–260. [Google Scholar]
  32. Schels, H.F.; Haberl, R.; Jilge, G.; Steinbigler, P.; Steimbeck, G. Frequency Analysis of the Electrocardiogram Maximum Entropy Method for Identification of Patients with Sustained Ventricular. IEEE Trans. Biomed. Eng. 1991, 38, 821–826. [Google Scholar] [CrossRef]
  33. Voss, A.; Kurths, J.; Fiehring, H. Frequency Domain Analysis of Highly Amplified ECG on the Basis of Maximum Entropy Spectral Estimation. Med. Biol. Eng. Comput. 1992, 30, 277–282. [Google Scholar] [CrossRef]
  34. Bianchi, A.M.; Mainardi, L.T.; Castiglioni, D.; Dalla Vecchia, L.; Lombardi, F.; Cerutti, S. Time-Variant Autoregressive Spectral Analysis for the Detection of Ventricular Late Potentials. In Proceedings of the IEEE/15th Annual Conference Engineering Medical Biology Society, San Diego, CA, USA, 31 October 1993; pp. 719–720. [Google Scholar]
  35. Makijarvi, M.; Fetsch, T.; Reinhardt, L.; Martinez-Rubio, A.; Shenasa, M.; Borggrefe, M.; Breithardt, G. Comparison and combination of late potentials and spectral turbulence analysis to predict arrhythmic events after myocardial infarction in the Post-Infarction Late Potential (PILP) Study. Eur. Heart J. 1995, 16, 651–659. [Google Scholar] [CrossRef]
  36. Vázquez, R.; Caref, E.B.; Torres, F.; Reina, M.; Huet, J.; Guerrero, J.A.; El-Sherif, N. Comparison of the New Acceleration Spectrum Analysis with Other Time and Frequency-Domain Analyses of the Signal Averaged Electrocardiogram. Eur. Heart J. 1998, 19, 628–637. [Google Scholar] [CrossRef]
  37. Reyna-Carranza, M.A.; Bravo-Zanoguera, M.E.; Arriola, H.G.; Lópe, R. Study of the noise ventricular late potentials sensibility on the Wigner distribution time-frequency plane. In Proceedings of the 2012 Pan American Health Care Exchanges, Miami, FL, USA, 26–31 March 2012. [Google Scholar]
  38. Giorgio, A.; Guaragnella, C.; Giliberti, D.A. Improving ECG signal denoising using wavelet transform for the prediction of malignant arrhythmias. Int. J. Med. Eng. Inform. 2019, in press. [Google Scholar]
  39. Mousa, A.; Yilmaz, A. A method based on wavelet analysis for the detection of ventricular late potentials in ECG signals. In Proceedings of the 44th IEEE 2001 Midwest Symposium on Circuits and Systems, Dayton, OH, USA, 14–17 August 2001. [Google Scholar]
  40. Subramanian, A.S.; Gurusamy, G.; Selvakumarc, G. Detection of Ventricular Late Potentials Using Wavelet Transform and ANT Colony Optimization. In Proceedings of the AIP Conference 1298, 331, Oregon, Portland, 21–22 July 2010. [Google Scholar]
  41. Yang, W.Q. Adaptive enhancement of ventricular late potentials using orthogonal beat-to-beat recording. In Proceedings of the 14th Annual International Conference of the IEEE Engineering in Medicine and Biology Society, Paris, France, 29 October–1 November 1992; pp. 492–493. [Google Scholar]
  42. Mitchell, R.H. Evaluation of adaptive line enhancement for beat-to-beat detection of ventricular late Potentials. Electron. Lett. 1999, 35, 1037–1038. [Google Scholar] [CrossRef]
  43. Meste, O.; Rix, H.; Caminal, P. Ventricular late potentials characterization in time-frequency domain by means of a wavelet transform. IEEE Trans. Biomed. Eng. 1994, 41, 625–633. [Google Scholar] [CrossRef] [PubMed]
  44. Wu, S.; Qian, Y.; Gao, Z.; Lin, J. A Novel Method for Beat-to-Beat Detection of Ventricular Late Potentials. IEEE Trans. Biomed. Eng. 2001, 48, 931–935. [Google Scholar]
  45. Laciar, E.; JanÈ, R. Analysis of beat-to-beat variability of ventricular late potentials by a spectro-temporal technique in patients with Chagasí disease. In Proceedings of the 26th Annual International Conference of the IEEE EMBS, San Francesco, CA, USA, 1–5 September 2004; pp. 3605–3608. [Google Scholar]
  46. Khan, M.A.; Majeed, S.M.I.; Sarwar, M. Effect of noise on identification of ventricular late potentials. Pak. Armed Forces Med. J. 2015, 65, S5–S10. [Google Scholar]
  47. Giorgio, A. A New FPGA-based Medical Device for The Real Time Prevention of The Risk of Arrhythmias. Int. J. Appl. Eng. Res. 2016, 11, 6013–6017. [Google Scholar]
  48. D’Aloia, M.; Longo, A.; Rizzi, M. Noisy ECG Signal Analysis for Automatic Peak Detection. Information 2019, 10, 35. [Google Scholar] [CrossRef]
  49. Rizzi, M.; D’Aloia, M.; Guaragnella, C.; Castagnolo, B. Health care improvement: Comparative analysis of two CAD systems in mammographic screening. IEEE Trans. Syst. Man. Cybern.-Part A Syst. Hum. 2012, 42, 1385–1395. [Google Scholar] [CrossRef]
  50. Breithardt, G.; Cain, M.E.; El-Sherif, N.; Flowers, N.C.; Hombach, V.; Janse, M.; Simson, M.B.; Steinbeck, G. Standards for analysis of ventricular late potentials using high-resolution or signal-averaged electrocardiography: A statement by a task force committee of the European Society of Cardiology, the American Heart Association, and the American College of Cardiology. J. Am. Coll. Cardiol. 1991, 17, 999–1006. [Google Scholar] [Green Version]
  51. Aqil, M.; Jbari, A.; Bourouhou, A. ECG Signal Denoising by Discrete Wavelet Transform. Int. J. Online Eng. 2017, 13, 51–68. [Google Scholar] [CrossRef]
  52. Rizzi, M.; D’Aloia, M.; Russo, R.; Cice, G.; Stanisci, S.; Montingelli, A.; Longo, A. Lightweight Signal Analysis for R-Peak Detection. Available online: https://pdfs.semanticscholar.org/4c83/08905c139b66dc85ea90aae0c873103582b6.pdf (accessed on 15 October 2019).
  53. Giorgio, A. A Model for the Real Time Detection of Ventricular Late Potentials Oriented to Embedded Systems Implementation. Int. J. Adv. Eng. Res. Appl. 2016, 1, 500–511. [Google Scholar]
  54. Gadaleta, M.; Giorgio, A. A Method for Ventricular Late Potentials Detection Using Time-Frequency Representation and Wavelet Denoising. ISRN Cardiol. 2012, 2012, 9. [Google Scholar] [CrossRef] [PubMed]
  55. Rahati, S.; Bajestani, G.S.; Falsoleiman, H.; Heidari-Bokavi, A. Wavelet transform application in time frequency enhancement for ventricular late potential better detection. In Proceedings of the BioMedical Engineering and Informatics: New Development and the Future-1st International Conference on BioMedical Engineering and Informatics (BMEI’08), Sanya, China, 27–30 May 2008; pp. 295–300. [Google Scholar]
  56. Crispi, A.T. Improving ventricular late potentials detection effectiveness. Ph.D. Thesis, The University of New Brunswick, Fredericton and Sanit John, NB, Canada, 2002. [Google Scholar]
  57. Zandi, A.S.; Moradi, M.H. Quantitative evaluation of a wavelet-based method in ventricular late potential detection. Pattern Recognit. 2006, 39, 1369–1379. [Google Scholar] [CrossRef]
  58. D’Aloia, M.; Rizzi, M.; Russo, R.; Notarnicola, M.; Pellicani, L. A marker-based image processing method for detecting available parking slots from UAVs. Lect. Notes Comput. Sci. 2015, 9281, 275–281. [Google Scholar]
  59. Hajian-Tilaki, K. Receiver Operating Characteristic (ROC) Curve Analysis for Medical Diagnostic Test Evaluation. Caspian J. Intern. Med. 2013, 4, 627–635. [Google Scholar] [PubMed]
  60. Bunluechokchai, S. Detection of Wavelet Transform-Processed Ventricular Late Potentials and Approximate Entropy. Comput. Cardiol. 2003, 30, 549–552. [Google Scholar]
  61. Zandi, A.S.; Moradi, M.H. Detection of ventricular late potentials in high-resolution ECG signals by a method based on the continuous wavelet transform and artificial neural networks. WSEAS Trans. Electron. 2004, 1, 471–475. [Google Scholar]
  62. Mandrekar, J.N. Receiver Operating Characteristic Curve in Diagnostic Test Assessment. J. Thorac. Oncol. 2010, 5, 1315–1316. [Google Scholar] [CrossRef] [Green Version]
Figure 1. (a) Characteristic shape of an electrocardiogram (ECG) heartbeat; (b) ventricular late potential (VLP) onset representation.
Information 10 00328 g001
Figure 2. Shape of the obtained vector magnitude corresponding to record 10 of the Physikalisch-Technische Bundesanstalt (PTB) Diagnostic ECG Database.
Information 10 00328 g002
Figure 3. Algorithm scheme: Level 3 subband coding with hard thresholding.
Information 10 00328 g003
Figure 4. An example of a vector magnitude signal before (yellow track) and after (blue track) wavelet denoising.
Information 10 00328 g004
Figure 5. A typical vector magnitude (VM) waveform and the definition of the features in the time domain. showing the features: (a) F1, (b) F2, (c) F3.
Information 10 00328 g005
Figure 6. VLP detection system block diagram.
Information 10 00328 g006
Figure 7. Performance comparison of different computer-aided detection (CAD) systems.
Information 10 00328 g007
Figure 8. The Se curve for the implemented CAD system.
Information 10 00328 g008
Figure 9. The positive predictive value (PPV) curve for the implemented CAD system.
Information 10 00328 g009
Figure 10. Support vector machine (SVM) classifier receiver operating characteristic (ROC) curve.
Information 10 00328 g010
Table 1. The fourfold table emphasizing the parameters adopted for the performance evaluation. TP: true positive; FN: false negative; FP: false positive; TN: true negative.
VLP Present in the HR-ECGVLP Not Present in the HR-ECGTotal
VLP detected by the tool in the HR-ECGTPFPTP + FP
VLP undetected by the tool in the HR-ECGFNTN
TotalTP + FNFP + TN

