1. Introduction
Modeling garment data is a theme that has achieved considerable attention during recent years because of the developments in deep-learning methods. There is now an assortment of research on various tasks in garment modeling and redrawing in 2D or 3D environments [
1], recognizing the garment [
2], parsing the semantic parts of the garment in the image [
3], retrieving the garment based on specified attributes [
4], and making garment recommendations based on previous choices [
5]. An expanding number of papers are concentrating on garment data retrieval [
6,
7,
8], which is a fundamental task relevant for the customers of the web-based fashion businesses.
To enable sorting, standardizing and searching fashion products on e-commerce retail platforms, garments must be supplied with relevant product attributes, such as product category and type, gender information, etc. However, this index data is often incomplete as the merchants may fail to provide all relevant information together with the product. Considering many fashion products offered on e-commerce platforms, adding the missing attributes manually is not feasible. As a result, merchants can lose potential sales because due to missing attributes, some relevant fashion items may not be returned in response to a potential customer’s search query. Thus, systems that can infer the missing attributes of garment products are of practical importance.
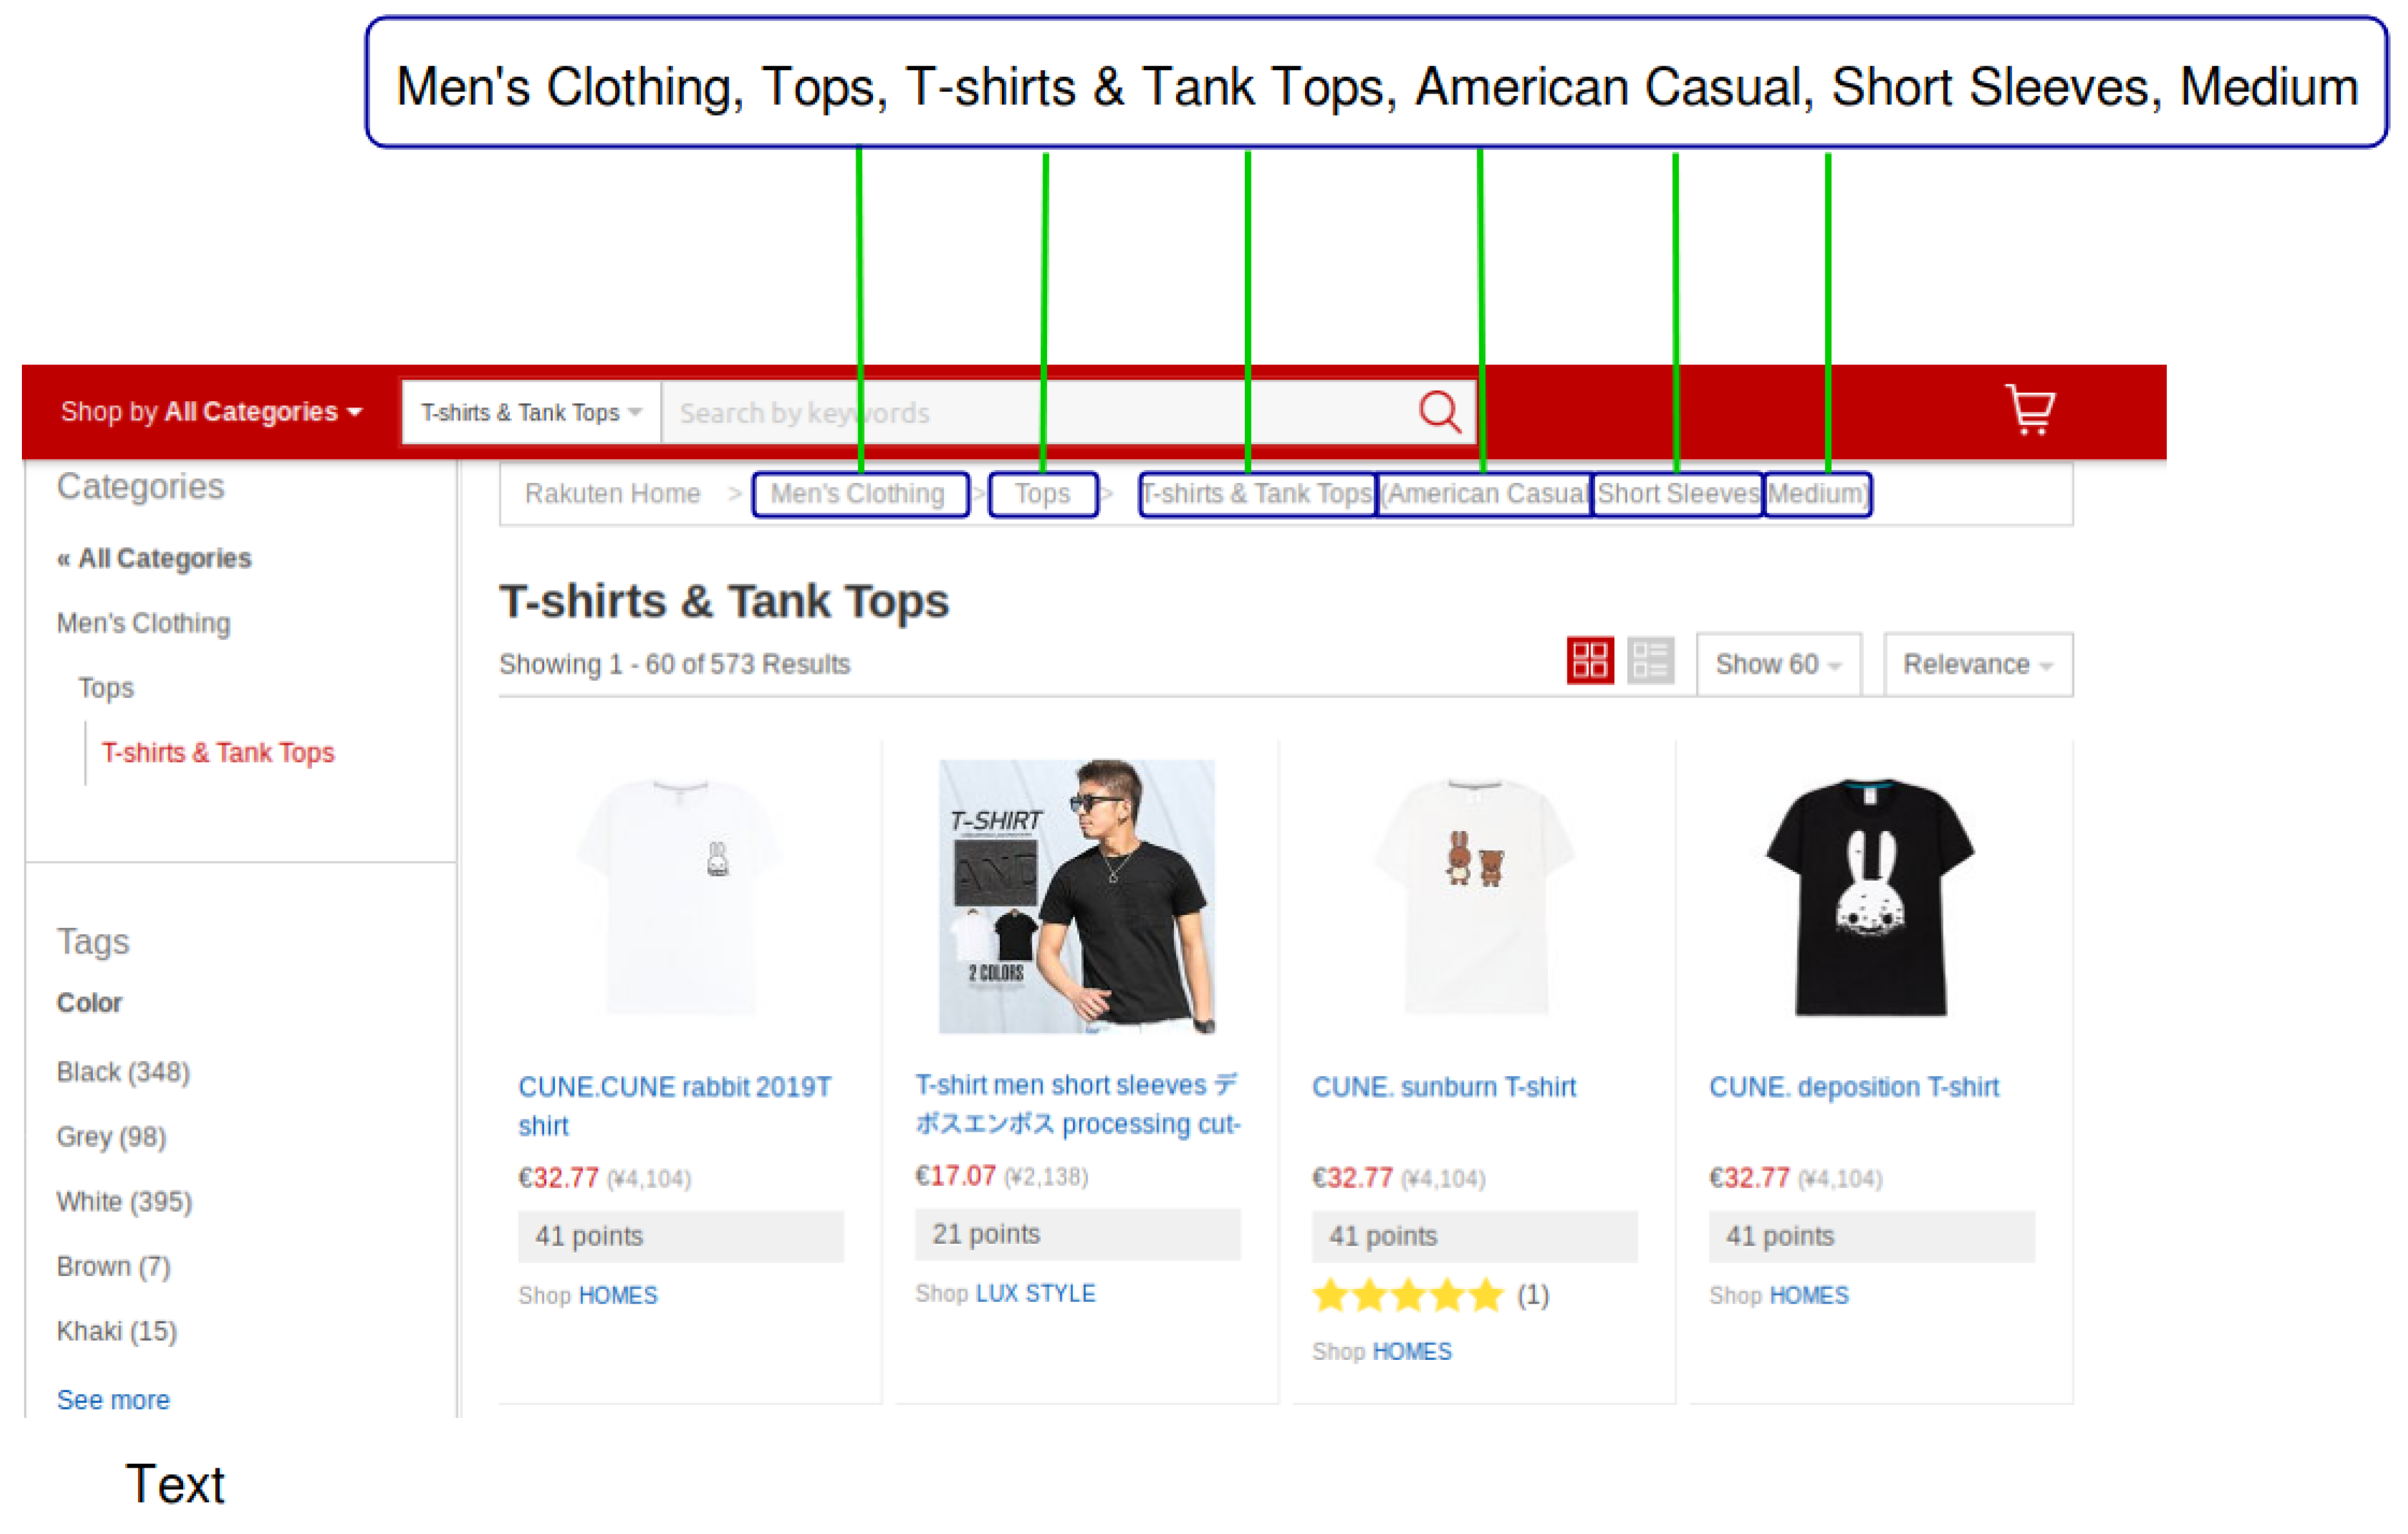
Several pieces of information, such as images and textual descriptions, are typically available for fashion items sold on e-commerce platforms and this data can be used to extract missing attribute information. Consider an example in
Figure 1 that shows a preview of an item search form of T-shirts and Tank Tops on Rakuten.com, a Japanese e-commerce company similar to Amazon.com. For each product the page shows an image and a title that potentially contain information about the item’s missing attributes. For instance, the values of the attributes highlighted in the upper right part of
Figure 1, such as
American Casual (Fashion Taste),
Short Sleeves (Sleeve Length), and
Medium (Clothing Length) can be inferred from such multimodal data.
Extracting missing attributes from the textual and image data of fashion products is challenging in several respects. Product images contain visual features of several attributes (for instance, the Sleeve Length is short and the Fashion Taste is American Casual) and the system must learn to distinguish between visual features characterizing these different attributes. The textual data comprises unstructured image titles or product descriptions that may or may not contain relevant attribute information. The system must be able to analyze unstructured textual data and make proper inferences based on it.
Most previous approaches have addressed the attribute extraction as a multitask classification problem where the values of different attributes are predicted independently of each other [
9,
10,
11]. While such an independence assumption is justified for certain attribute categories, it provides the system too many degrees of freedom in other cases. For instance, the value of the attribute of the product type constrains the set of possible values for the product sub-type attribute: if the product type attribute value is
Top, then
T-shirt would be a legal value for the sub-type attribute while
Skirt would be not as skirts do not belong to the type of
Top garment.
This observation suggests that if the available attributes are organized in a tree-like structure, where the value of each previous node constrains the possible values in the next branch of the tree, attribute prediction can be formulated as a sequential prediction problem where the value of each next attribute is dependent on the values of the previously predicted attributes. While previous work has explored sequential product attribute prediction based on textual data [
12,
13], we are not aware of such work on multimodal input. Also, neither of these previous works compared the sequential prediction with the multitask formulation.
In this paper, we propose to formulate the multimodal product attribute prediction as a sequential prediction problem to enable the model to learn to capture the dependencies between different attribute values. We compare our model to three different non-sequential task formulations. The following list summarizes all models:
- (1)
MultiClass Prediction: This is a simple baseline where the values of all attributes of an item are concatenated and predicted as a single united label. This formulation is suitable when the number of different attribute value combinations is not too large; however, it does not allow prediction of value combinations that were not seen during training.
- (2)
MultiLabel Prediction: Here the problem is formalized as a multilabel classification task where the value of each attribute is considered to be a different label and thus, each input instance is assigned multiple labels. We experiment with several multilabel models, starting with a simple binary model and including several multiclass multilabel models similar to the multitask models used in previous work [
9,
10,
11].
- (a)
Binary MultiLabel Prediction: This is the most basic multilabel baseline where the model predicts the presence or absence of each attribute value.
- (b)
MultiTask Prediction: This is the multiclass multilabel model that adopts a multiclass classifier for predicting one value for each attribute.
- (c)
Attentive MultiTask Prediction: This is the multitask model with an attention component between the image, text and each label.
- (d)
Self-Attentive MultiTask Prediction: This is the attentive multitask model with an additional self-attention component between the multiclass attribute classifiers.
- (3)
Sequential Prediction: This formulation predicts each attribute value in sequence and each next prediction is conditioned on the previously predicted attribute values. We hypothesize that this formulation is the best in cases where the attribute categories are organized into a tree-like structure. According to our knowledge, while the sequential prediction approach is not novel in the attribute prediction domain [
12,
13], the multimodal sequential prediction has not been explored before.
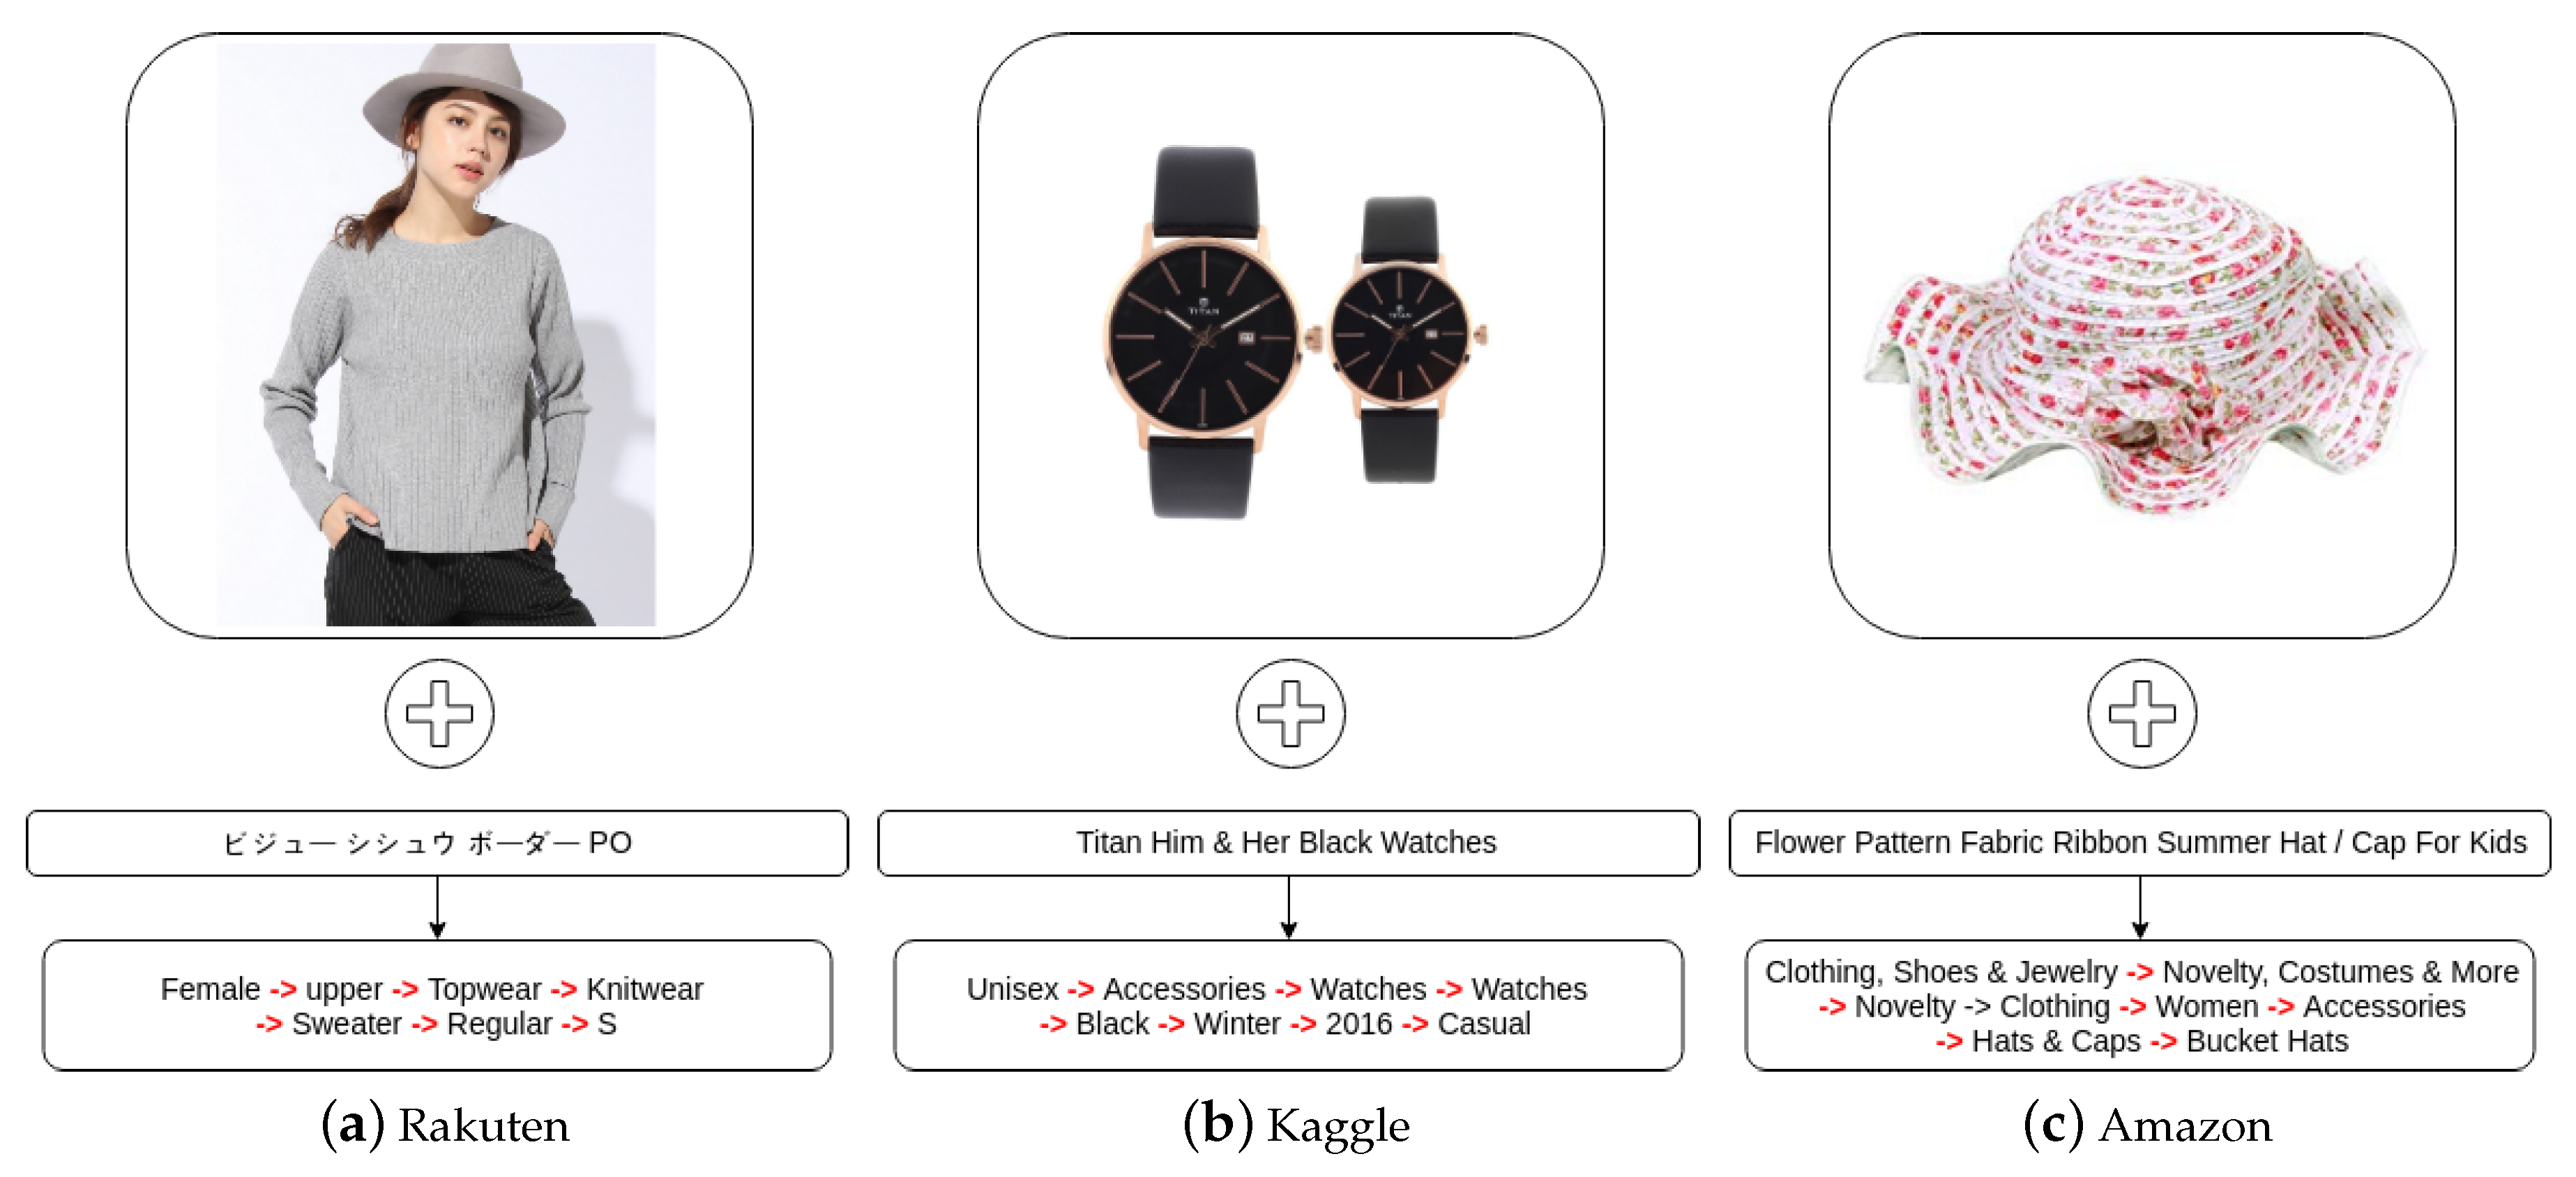
We tested our models on three multimodal datasets, containing both image and text:
Rakuten dataset, which is an in-house proprietary dataset obtained from
Rakuten.com,
Kaggle Fashion-Product-Images Dataset, where each product item is supplied with the image, title, and several attribute values of the product, and
Amazon Product Dataset, which includes Amazon product metadata, such as titles, descriptions, category information, price, brand, image URLs and image features belonging to product data profiles.
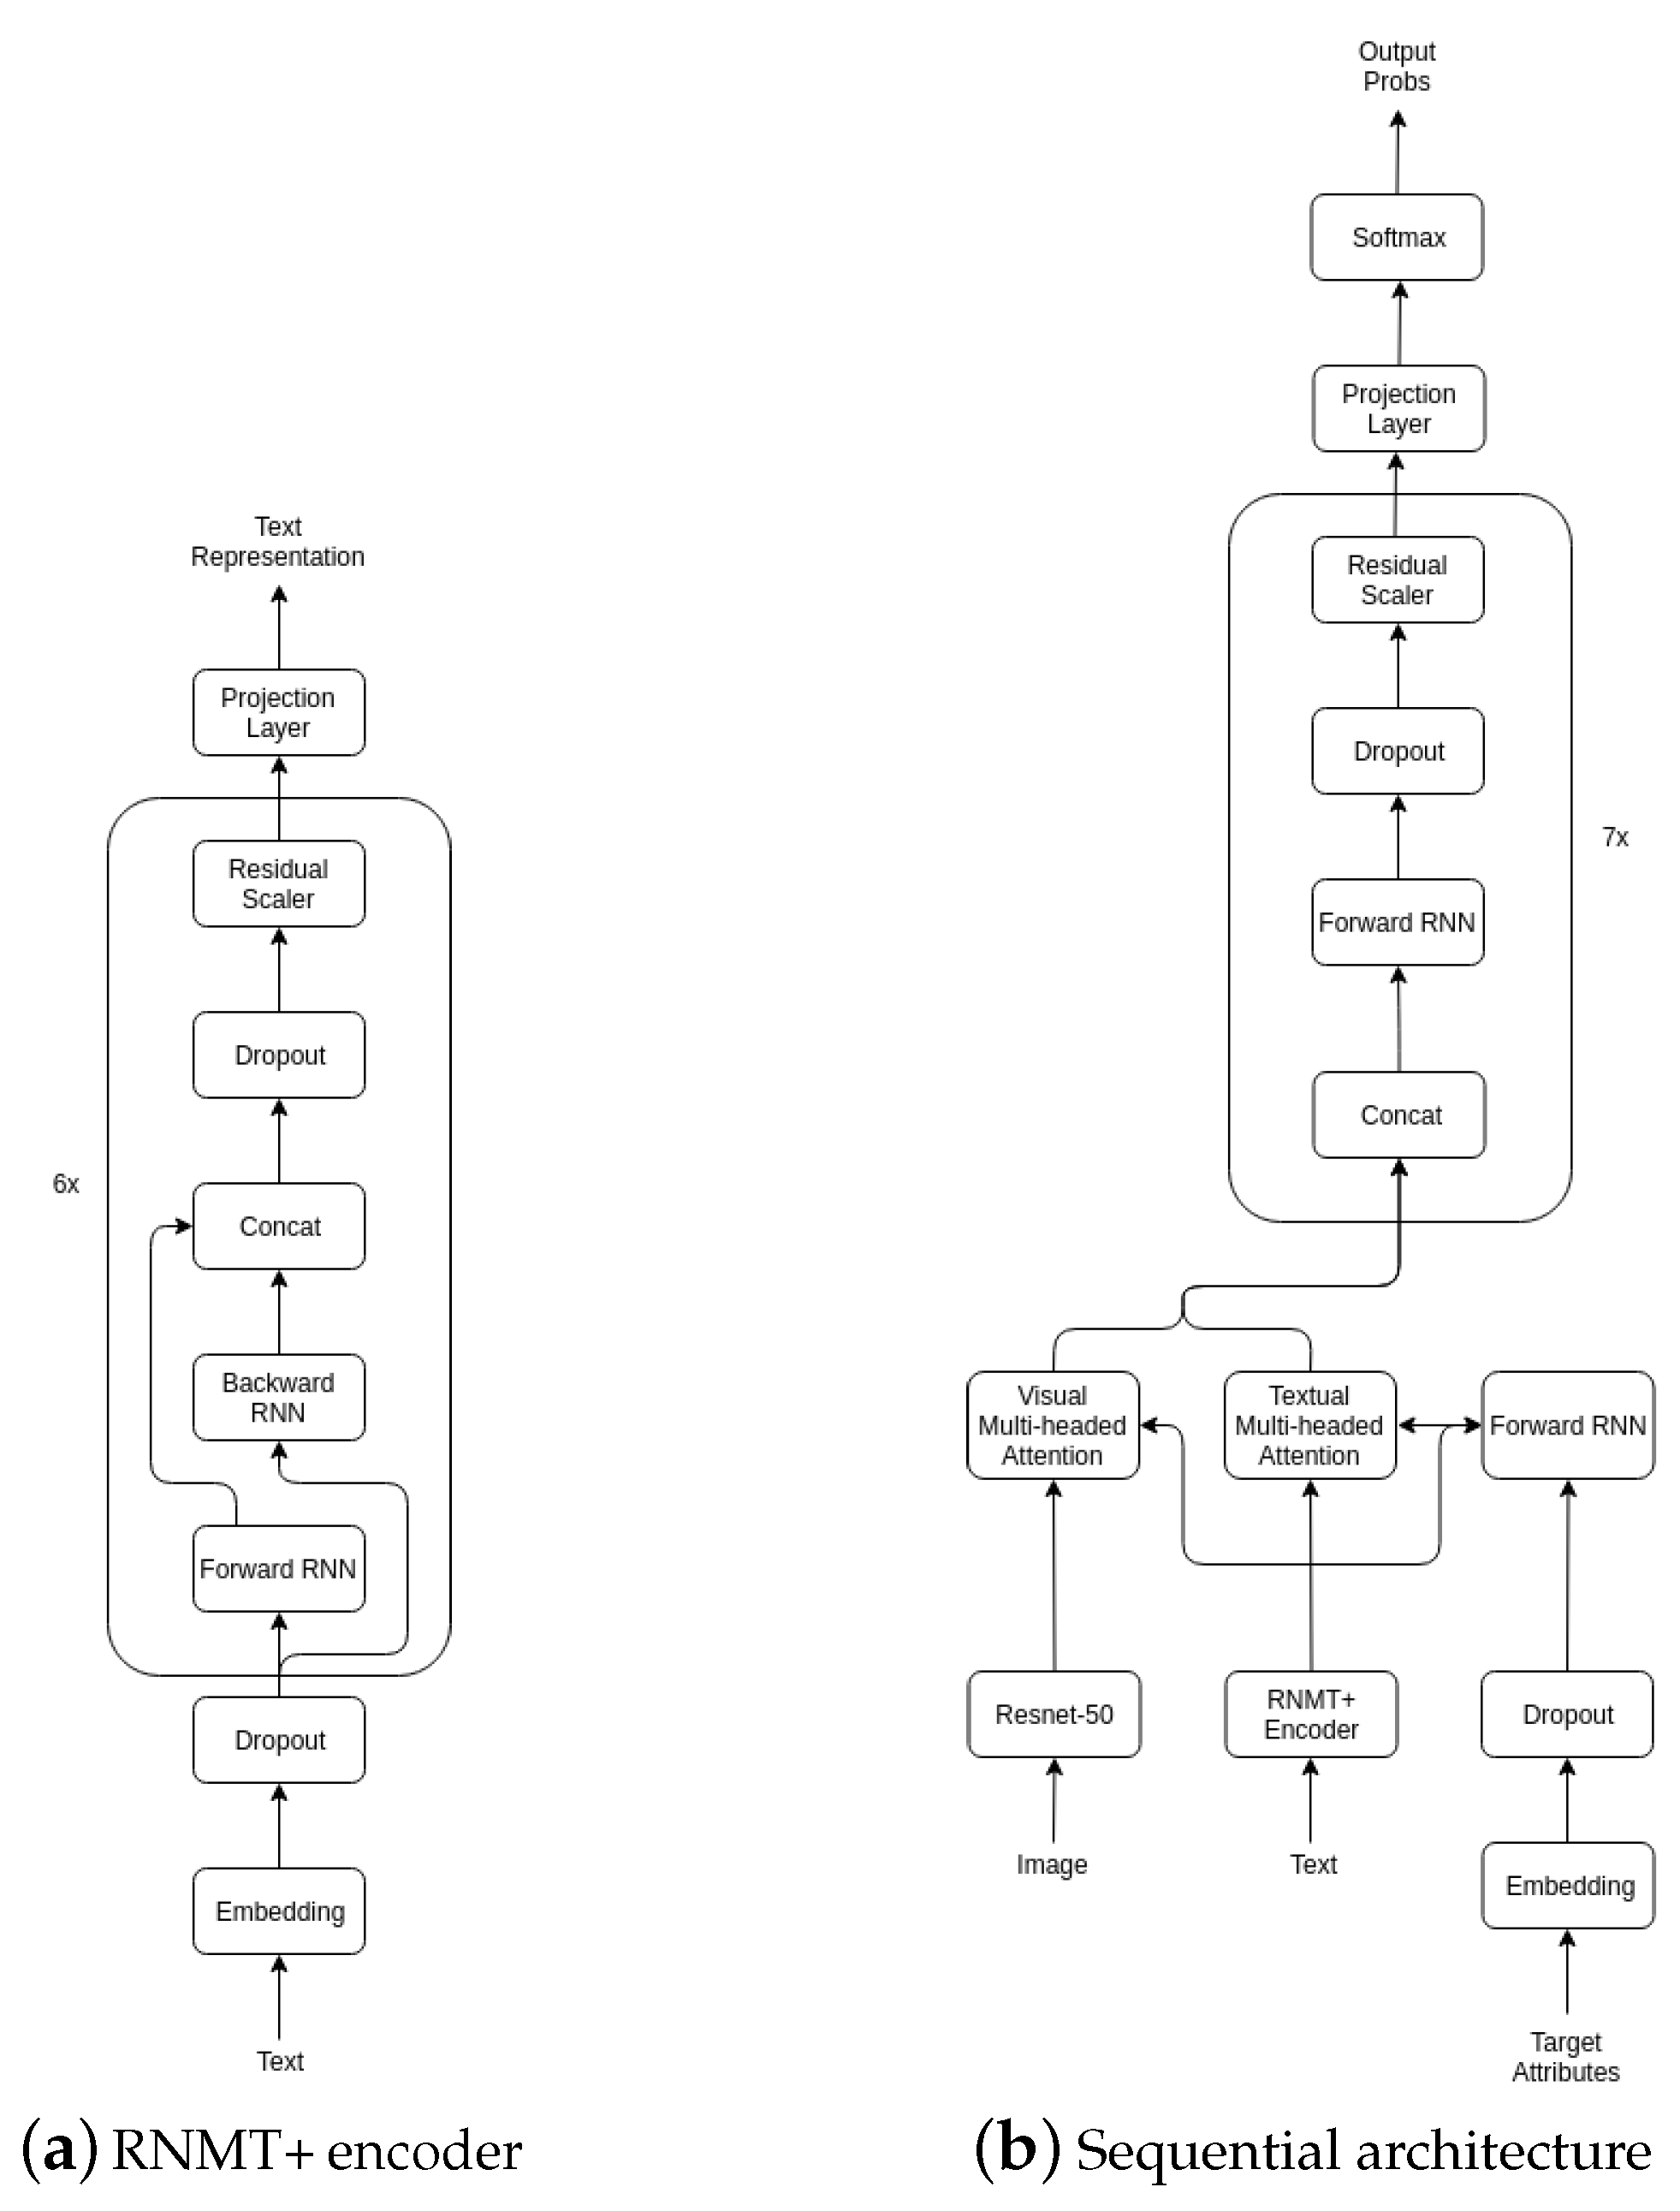
For encoding the data, we use the CNN-based Resnet-50 [
14] architecture for product images, and RNN-based RNMT+ model [
15] for textual data. We use this encoder in combination with all output prediction approaches on our experimental datasets. In Rakuten and Kaggle datasets, the attributes are organized in a chain-like structure and thus we expect the sequential modeling to perform best on those two datasets. For the Amazon dataset, we do not know the category structure of the attribute chains and thus on that dataset, we can only apply the MultiClass and the Sequential prediction approaches. On all datasets, we expect Sequential and MultiLabel approaches to outperform the MultiClass model.
Our contributions in this paper are:
- (1)
We propose the sequential modeling approach for multimodal fashion attribute prediction and show that it outperforms other methods on datasets where the product attributes are organized in a tree-like structure. You can find the source code for reproducing our experiments at
https://github.com/saitarslanboun/MultimodalSequential- (2)
Besides multimodal models, we also experiment with text-only and image-only models and show that while text-only models always outperform image-only predictions, only the sequential model always benefits from multimodal input.
- (3)
We perform extensive experiments in real-life datasets to demonstrate the sequential model’s efficacy and show that it is also better than the multilabel models in predicting novel attribute chains.
5. Results and Discussion
Table 2 presents the full-chain accuracy for all models on each dataset on both validation and test set. An attribute chain is counted as correct if all attribute values in the chain are predicted correctly. On Rakuten and Kaggle dataset, the sequential model performs the best as predicted, although on the Rakuten dataset, the difference with the MultiClass model is not large. Within multilabel models, the Binary MultiLabel model performance is the worst on the Rakuten Dataset and the basic MultiTask model is the worst on the Kaggle dataset. On both datasets, the multilabel models using attention are the best. However, we can see that the MultiTask model does not benefit from self-attention, as the Self-Attentive MultiTask model performs worse than the Attentive MultiTask model on both datasets.
On the Amazon dataset, we could not train the multilabel models as we do not know the category structure. Also, on the Amazon dataset, the MultiClass model performs better on both validation and test sets than the sequential model. There are about 4K unique attribute chains in the Amazon dataset. Because the Amazon training set is very large containing around 4M items, it might be easier for the model to learn to classify items into 4K classes, rather than learn to generate the exact combinations of attributes. Overall, the differences between the validation and test set results are very small, suggesting that all our models generalize well.
Table 3 and
Table 4 show the prediction accuracies on the attribute level for the Rakuten and Kaggle test sets, respectively. We could not perform the same analysis for the Amazon dataset as we do not know the category structure of that dataset.
On the Rakuten dataset (in
Table 3), the Attentional MultiTask model has the highest accuracy on three attributes out of seven, while both the Self-Attentional and the Sequential model achieve the highest accuracy on two attribute categories. Although based on average accuracy, the Attentional MultiTask model has the best performance, the difference with Self-Attentional MultiTask model and the Sequential Model is not large. We also note that the Sequential model obtains the highest accuracy on the attribute categories (
Cut and
Fit) that in general have the lowest accuracy, suggesting that these are the attributes that are hardest to predict.
On the Kaggle dataset, the Sequential model performs the best on seven attribute categories, and it also achieves competitive accuracy on the remaining Gender attribute. One can observe the largest differences between the Sequential and the other models on those attributes that have more values and that are thus more difficult to predict. For example, the Base Color attribute category has 47 different color attribute values. Many color attribute values are very similar to each other, like for instance Blue and Navy Blue, or Pink, Rose and Red, or Grey and Grey Melange. If the text specifically does not mention the name of the color, it is non-trivial to extract the exact tone and intensity of the main color from product images which might involve several color combinations. The MultiClass model achieves the lowest accuracy on average on the Kaggle dataset. While all multilabel models achieve the average accuracy in similar range, the Attentive MultiTask is again the best.
When looking at the average attribute accuracy of the four different multilabel models in
Table 3 and
Table 4, we see that the Attentive MultiTask model performs the best. This is the same pattern as observed in
Table 2 for the full-chain accuracy. Therefore, we choose the Attentive MultiTask model as the best baseline multilabel model and omit the other multilabel models in the following analyses.
Author Contributions
Methodology, H.S.A., K.S., M.F. and G.A.; Supervision, K.S., M.F. and G.A.; Validation, H.S.A.; Writing—original draft, H.S.A.; Writing—review&editing, K.S., M.F. and G.A.
Funding
This work has been partially supported by an R&D Contract between University of Tartu and Rakuten Fits.Me (LLTTI18221), the Estonian Centre of Excellence in IT (EXCITE) funded by the European Regional Development Fund and the Scientific and Technological Research Council of Turkey (TÜBITAK) (116E097).
Acknowledgments
We gratefully acknowledge the support of NVIDIA Corporation with the donation of the Titan V GPU used for this research and University of Tartu High Performance Computing Center (HPC). We also thank the anonymous reviewers for their helpful comments.
Conflicts of Interest
The authors declare no conflict of interest.
References
- Reed, W.B.; Ritchie, C.C.; Akleman, E. Garment Modeling Simulation System and Process. U.S. Patent 10311508, 4 June 2019. [Google Scholar]
- Saxena, K.; Shibata, T. Garment Recognition and Grasping Point Detection for Clothing Assistance Task using Deep Learning. In Proceedings of the 2019 IEEE/SICE International Symposium on System Integration, Paris, France, 14–16 January 2019; pp. 632–637. [Google Scholar] [CrossRef]
- Yang, S.; Pan, Z.; Amert, T.; Wang, K.; Yu, L.; Berg, T.; Lin, M.C. Physics-inspired garment recovery from a single-view image. ACM Trans. Graphics 2018, 37, 170. [Google Scholar] [CrossRef]
- Wen, J.J.; Wong, W.K. Fundamentals of common computer vision techniques for fashion textile modeling, recognition, and retrieval. In Applications of Computer Vision in Fashion and Textiles; Woodhead Publishing: Duxford, UK, 2017; pp. 17–44. [Google Scholar] [CrossRef]
- Hao, L.; Hao, M. Design of intelligent clothing selection system based on neural network. In Proceedings of the 2019 IEEE 3rd Information Technology, Networking, Electronic and Automation Control Conference, ITNEC, Chengdu, China, 15–17 March 2019; pp. 1789–1792. [Google Scholar] [CrossRef]
- Takatera, M.; Yoshida, R.; Peiffer, J.; Yamazaki, M.; Yashima, K.; Kim, K.O.; Miyatake, K. Fabric retrieval system for apparel e-commerce considering Kansei information. Int. J. Cloth. Sci. Technol. 2019. [Google Scholar] [CrossRef]
- Xiang, J.; Zhang, N.; Pan, R.; Gao, W. Fabric Image Retrieval System Using Hierarchical Search Based on Deep Convolutional Neural Network. IEEE Access 2019, 7, 35405–35417. [Google Scholar] [CrossRef]
- Corbiere, C.; Ben-Younes, H.; Rame, A.; Ollion, C. Leveraging Weakly Annotated Data for Fashion Image Retrieval and Label Prediction. In Proceedings of the 2017 IEEE International Conference on Computer Vision Workshops, ICCVW 2017, Venice, Italy, 22–29 October 2017; pp. 2268–2274. [Google Scholar] [CrossRef]
- Cardoso, A.; Daolio, F.; Vargas, S. Product characterisation towards personalisation: Learning attributes from unstructured data to recommend fashion products. In Proceedings of the ACM SIGKDD International Conference on Knowledge Discovery and Data Mining, London, UK, 19–23 August 2018; pp. 80–89. [Google Scholar] [CrossRef]
- Logan, R.L.; Humeau, S.; Singh, S. Multimodal Attribute Extraction. arXiv 2017, arXiv:1711.11118. [Google Scholar]
- Li, P.; Li, Y.; Jiang, X.; Zhen, X. Two-Stream Multi-Task Network for Fashion Recognition. arXiv 2019, arXiv:1901.10172. [Google Scholar]
- Hiramatsu, M.; Wakabayashi, K. Encoder-Decoder neural networks for taxonomy classification. In CEUR Workshop Proceedings; CEUR Workshop Proceedings: Ann Arbor, MI, USA, 2018; Volume 2319. [Google Scholar]
- Li, Y.M.; Tan, L.; Kok, S.; Szymanska, E. Unconstrained Production Categorization with Sequence-to-Sequence Models; eCOM@ SIGIR: Ann Arbor, MI, USA, 2018. [Google Scholar]
- He, K.; Zhang, X.; Ren, S.; Sun, J. Deep residual learning for image recognition. In Proceedings of the IEEE Computer Society Conference on Computer Vision and Pattern Recognition, Las Vegas, NV, USA, 27–30 June 2016; pp. 770–778. [Google Scholar] [CrossRef]
- Chen, M.X.; Firat, O.; Bapna, A.; Johnson, M.; Macherey, W.; Foster, G.; Jones, L.; Parmar, N.; Shazeer, N.; Vaswani, A.; et al. The best of both worlds: Combining recent advances in neural machine translation. In Proceedings of the ACL 2018—56th Annual Meeting of the Association for Computational Linguistics, Melbourne, Australia, 15–20 July 2018; Volume 1, pp. 76–86. [Google Scholar]
- Barrault, L.; Bougares, F.; Specia, L.; Lala, C.; Elliott, D.; Frank, S. Findings of the Third Shared Task on Multimodal Machine Translation; Shared Task Papers: Belgium, Brussels, 2019; pp. 304–323. [Google Scholar] [CrossRef]
- Druzhkov, P.N.; Kustikova, V.D. A survey of deep learning methods and software tools for image classification and object detection. Pattern Recognit. Image Anal. 2016, 26, 9–15. [Google Scholar] [CrossRef]
- Liu, W.; Wang, Z.; Liu, X.; Zeng, N.; Liu, Y.; Alsaadi, F.E. A survey of deep neural network architectures and their applications. Neurocomputing 2017, 234, 11–26. [Google Scholar] [CrossRef]
- Altınel, B.; Ganiz, M.C. Semantic text classification: A survey of past and recent advances. Inf. Process. Manag. 2018, 54, 1129–1153. [Google Scholar] [CrossRef]
- Zahavy, T.; Krishnan, A.; Magnani, A.; Mannor, S. Is a picture worth a thousand words? A deep multi-modal architecture for product classification in e-commerce. In Proceedings of the 32nd AAAI Conference on Artificial Intelligence, AAAI, New Orleans, LA, USA, 2–7 February 2018; pp. 7873–7880. [Google Scholar]
- Chen, Z.; Ai, S.; Jia, C. Structure-aware deep learning for product image classification. ACM Trans. Multimed. Comput. Commun. Appl. 2019, 15, 4. [Google Scholar] [CrossRef]
- Schindler, A.; Lidy, T.; Karner, S.; Hecker, M. Fashion and apparel classification using convolutional neural networks. CEUR Worksh. Proc. 2017, 2009, 24–27. [Google Scholar]
- Jia, D.; Wei, D.; Socher, R.; Li-Jia, L.; Kai, L.; Li, F.-F. ImageNet: A large-scale hierarchical image database. In Proceedings of the 2009 IEEE conference on computer vision and pattern recognition, Miami, FL, USA, 20–25 June 2009; pp. 248–255. [Google Scholar] [CrossRef]
- Liu, Z.; Luo, P.; Qiu, S.; Wang, X.; Tang, X. DeepFashion: Powering Robust Clothes Recognition and Retrieval with Rich Annotations. In Proceedings of the IEEE Computer Society Conference on Computer Vision and Pattern Recognition, Las Vegas, NV, USA, 27–30 June 2016; pp. 1096–1104. [Google Scholar] [CrossRef]
- Li, R.; Lu, W.; Liang, H.; Mao, Y.; Wang, X. Multiple features with extreme learning machines for clothing image recognition. IEEE Access 2018, 6, 36283–36294. [Google Scholar] [CrossRef]
- Dalal, N.; Triggs, B. Histograms of oriented gradients for human detection. In Proceedings of the 2005 IEEE Computer Society Conference on Computer Vision and Pattern Recognition, San Diego, CA, USA, 20–25 June 2005; pp. 886–893. [Google Scholar] [CrossRef]
- Lin, Y.C.; Das, P.; Datta, A. Overview of the SIGIR 2018 eCom Rakuten Data Challenge; CEUR Workshop Proceedings: Ann Arbor, MI, USA, 2018; Volume 2319. [Google Scholar]
- Krishnan, A.; Amarthaluri, A. Large Scale Product Categorization using Structured and Unstructured Attributes. arXiv 2019, arXiv:1903.04254. [Google Scholar]
- Zheng, G.; Mukherjee, S.; Dong, X.L.; Li, F. OpenTag: Open aribute value extraction from product profiles. In Proceedings of the ACM SIGKDD International Conference on Knowledge Discovery and Data Mining, London, UK, 19–23 August 2018; pp. 1049–1058. [Google Scholar] [CrossRef]
- Hsieh, Y.H.; Wu, S.H.; Chen, L.P.; Yang, P.C. Constructing hierarchical product categories for E-commerce by word embedding and clustering. In Proceedings of the 2017 IEEE International Conference on Information Reuse and Integration, San Diego, CA, USA, 4–6 August 2017; pp. 397–402. [Google Scholar] [CrossRef]
- Inoue, N.; Simo-Serra, E.; Yamasaki, T.; Ishikawa, H. Multi-label Fashion Image Classification with Minimal Human Supervision. In Proceedings of the 2017 IEEE International Conference on Computer Vision Workshops, Venice, Italy, 22–29 October 2017; pp. 2261–2267. [Google Scholar] [CrossRef]
- Dong, Q.; Gong, S.; Zhu, X. Multi-Task curriculum transfer deep learning of clothing attributes. In Proceedings of the 2017 IEEE Winter Conference on Applications of Computer Vision, WACV 2017, Santa Rosa, CA, USA, 27–29 March 2017; pp. 520–529. [Google Scholar] [CrossRef]
- Chen, Q.; Huang, J.; Feris, R.; Brown, L.M.; Dong, J.; Yan, S. Deep domain adaptation for describing people based on fine-grained clothing attributes. In Proceedings of the IEEE Computer Society Conference on Computer Vision and Pattern Recognition, Boston, MA, USA, 7–12 June 2015; pp. 5315–5324. [Google Scholar] [CrossRef]
- Ba, J.L.; Kiros, J.R.; Hinton, G.E. Layer Normalization. arXiv 2016, arXiv:1607.06450. [Google Scholar]
- Chung, J.; Gulcehre, C.; Cho, K.; Bengio, Y. Empirical Evaluation of Gated Recurrent Neural Networks on Sequence Modeling. arXiv 2014, arXiv:1412.3555. [Google Scholar]
- Vaswani, A.; Shazeer, N.; Parmar, N.; Uszkoreit, J.; Jones, L.; Gomez, A.N.; Kaiser, Ł.; Polosukhin, I. Attention is all you need. In Advances in Neural Information Processing Systems; Neural Information Processing Systems Foundation, Inc.: Long Beach, CA, USA, 2017; pp. 5999–6009. [Google Scholar]
- He, R.; McAuley, J. Ups and downs: Modeling the visual evolution of fashion trends with one-class collaborative filtering. In Proceedings of the 25th International World Wide Web Conferences Steering Committee, Montreal, QC, Canada, 11–15 April 2016; pp. 507–517. [Google Scholar] [CrossRef]
- McAuley, J.; Targett, C.; Shi, Q.; Van Den Hengel, A. Image-based recommendations on styles and substitutes. In Proceedings of the 38th International ACM SIGIR Conference on Research and Development in Information Retrieval, Santiago, Chile, 9–13 August 2015; pp. 43–52. [Google Scholar] [CrossRef]
- Kudo, T.; Richardson, J. SentencePiece: A simple and language independent subword tokenizer and detokenizer for Neural Text Processing. arXiv 2019, arXiv:1808.06226, 66–71. [Google Scholar] [CrossRef]
- Barbieri, F.; Espinosa-Anke, L.; Camacho-Collados, J.; Schockaert, S.; Saggion, H. Interpretable Emoji Prediction via Label-Wise Attention LSTMs. In Proceedings of the 2018 Conference on Empirical Methods in Natural Language Processing, Association for Computational Linguistics, Brussels, Belgium, 31 October–4 November 2018; pp. 4766–4771. [Google Scholar] [CrossRef]
- Kingma, D.P.; Ba, J. Adam: A Method for Stochastic Optimization. arXiv 2014, arXiv:1412.6980. [Google Scholar]
- Zhang, H.; Goodfellow, I.; Metaxas, D.; Odena, A. Self-Attention Generative Adversarial Networks. arXiv 2018, arXiv:1805.08318. [Google Scholar]
- Vaswani, A.; Bengio, S.; Brevdo, E.; Chollet, F.; Gomez, A.N.; Gouws, S.; Jones, L.; Kaiser, Ł.; Kalchbrenner, N.; Parmar, N.; et al. Tensor2Tensor for Neural Machine Translation. arXiv 2018, arXiv:1803.07416. [Google Scholar]
Figure 1.
Snapshot of a T-shirt search page taken from
Rakuten.com.
Figure 2.
RNMT+ encoder and the sequential architecture.
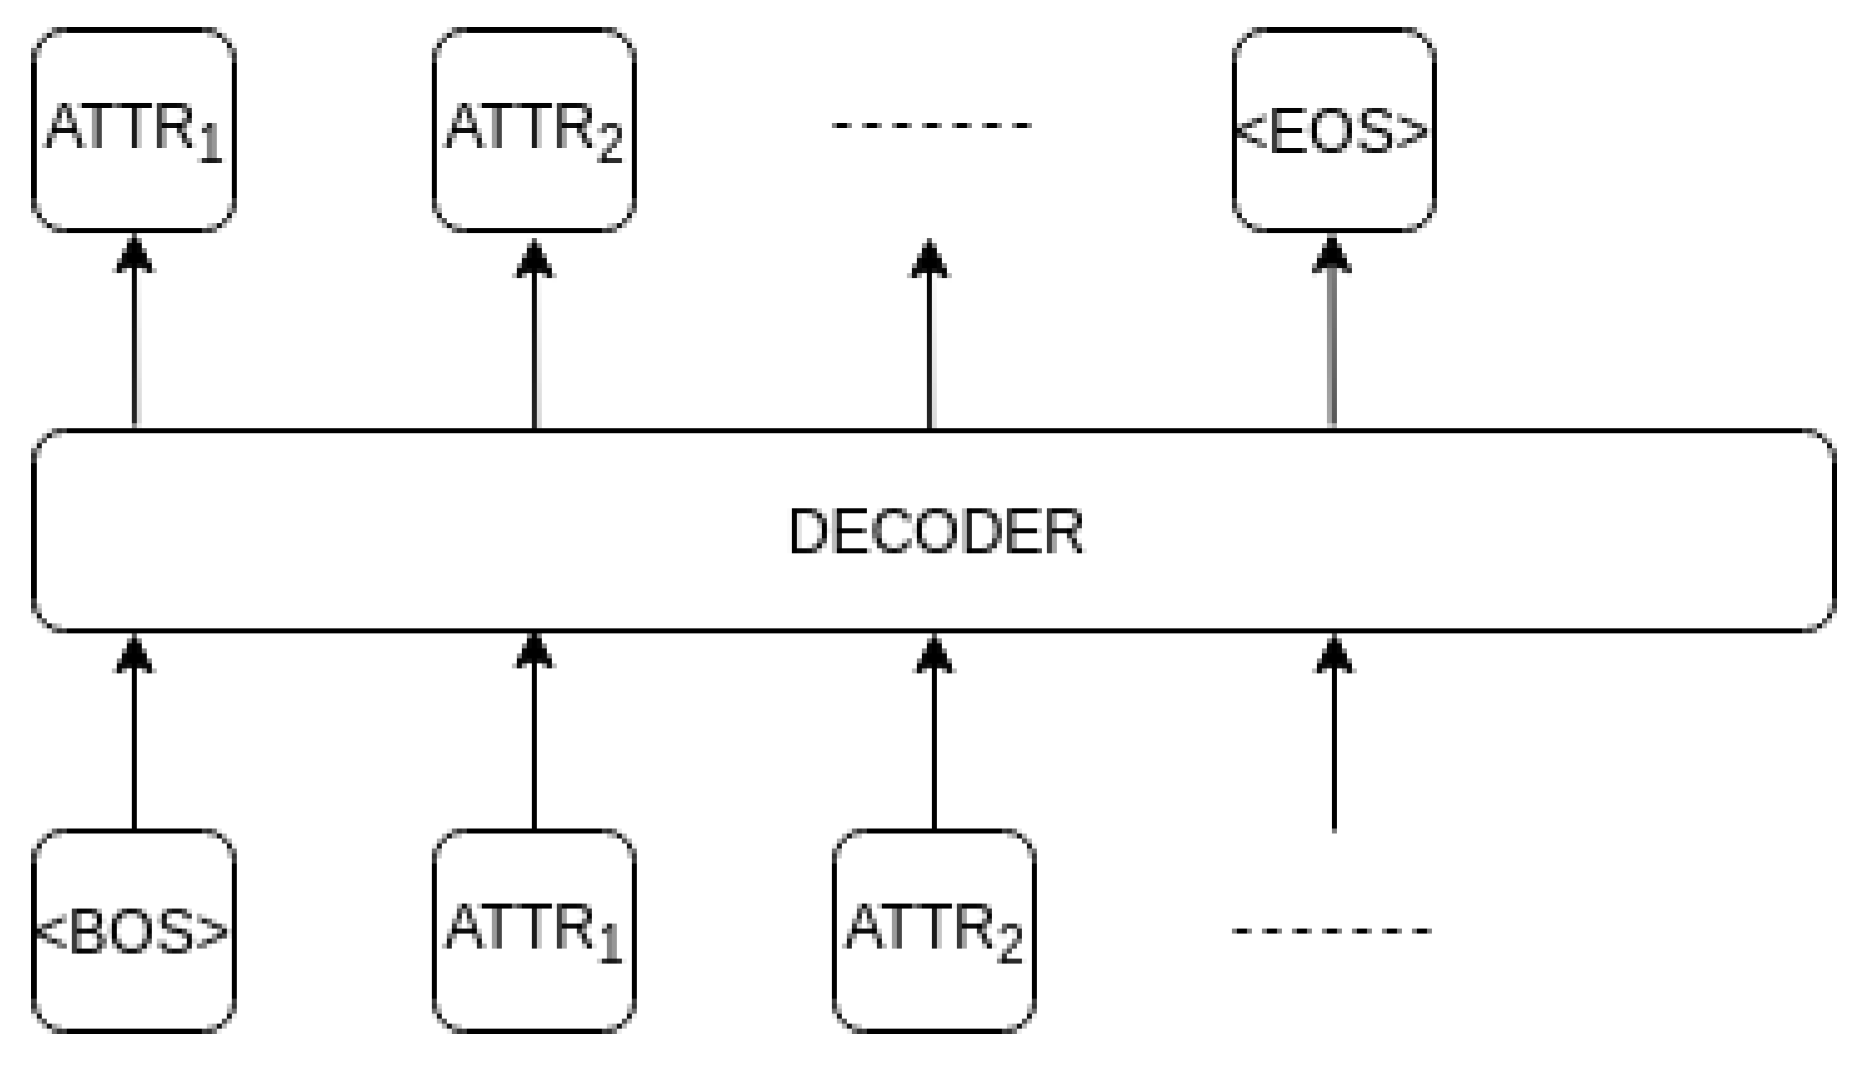
Figure 3.
Input format of the sequential decoder.
Figure 4.
The examples of fashion product items for each of the three datasets.
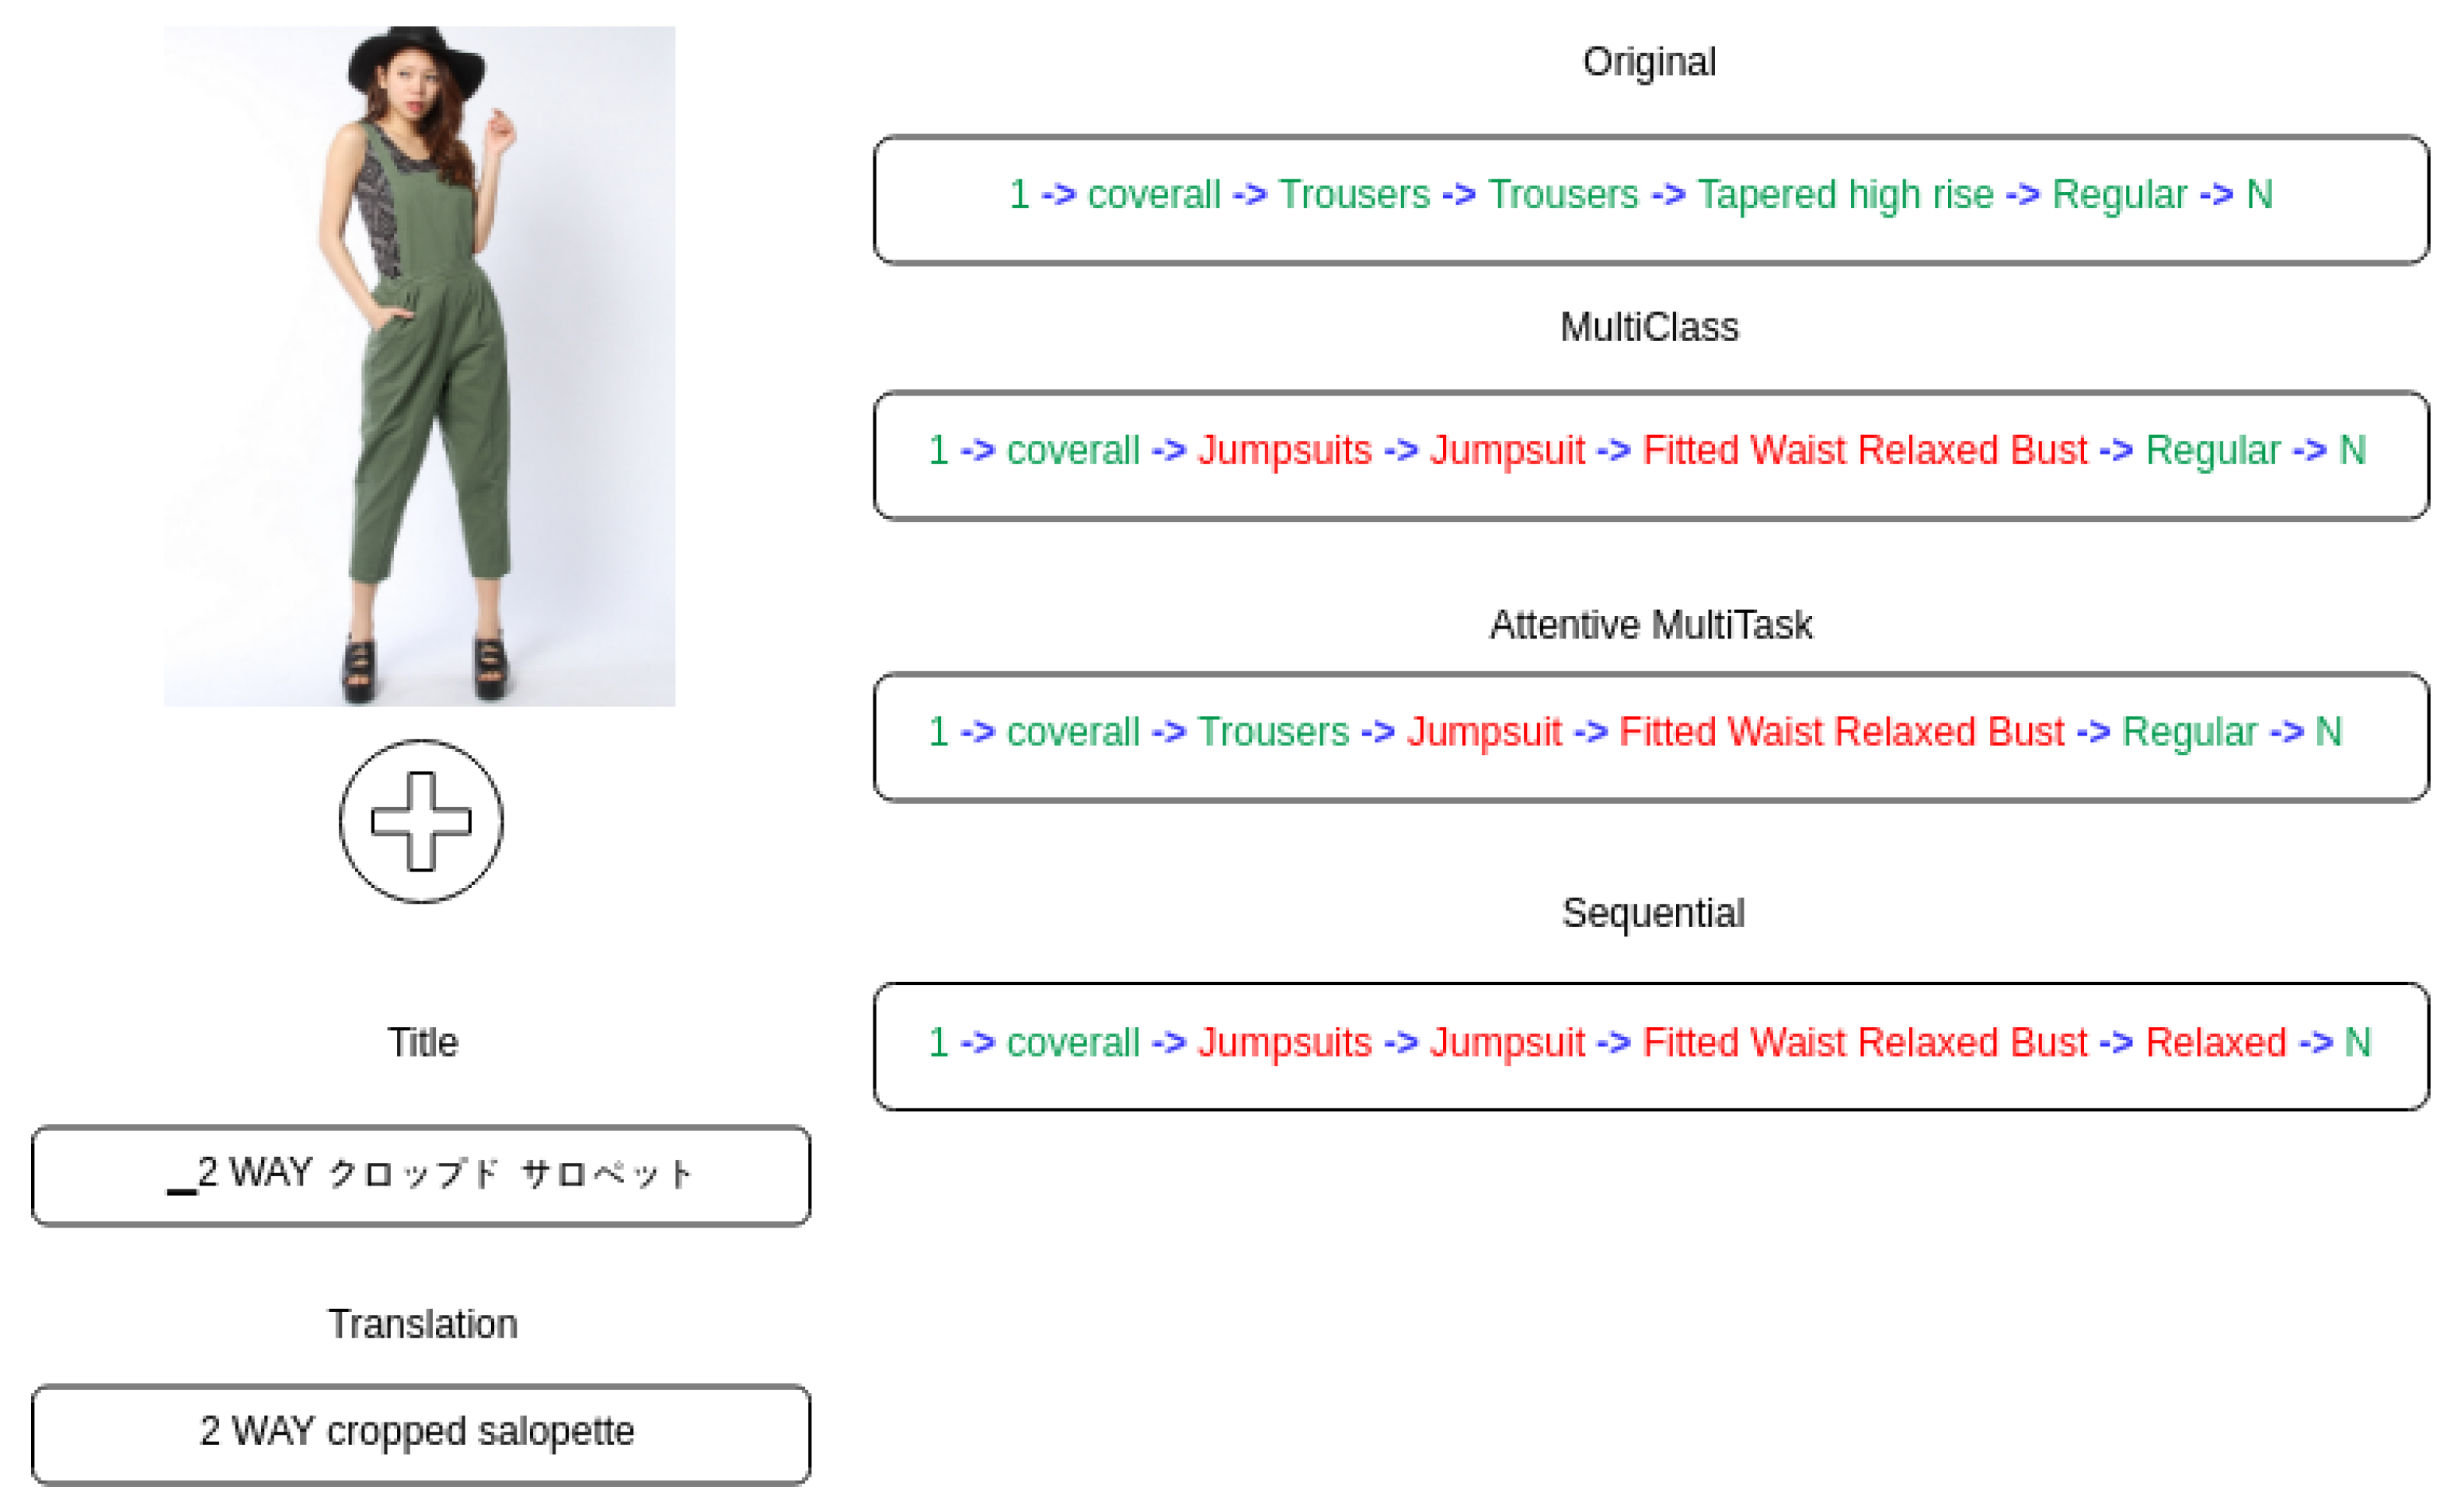
Figure 5.
A sample item from the Rakuten test set with predicted attribute chains. Correctly predicted attributes are in green, the wrongly predicted attributes are in red.
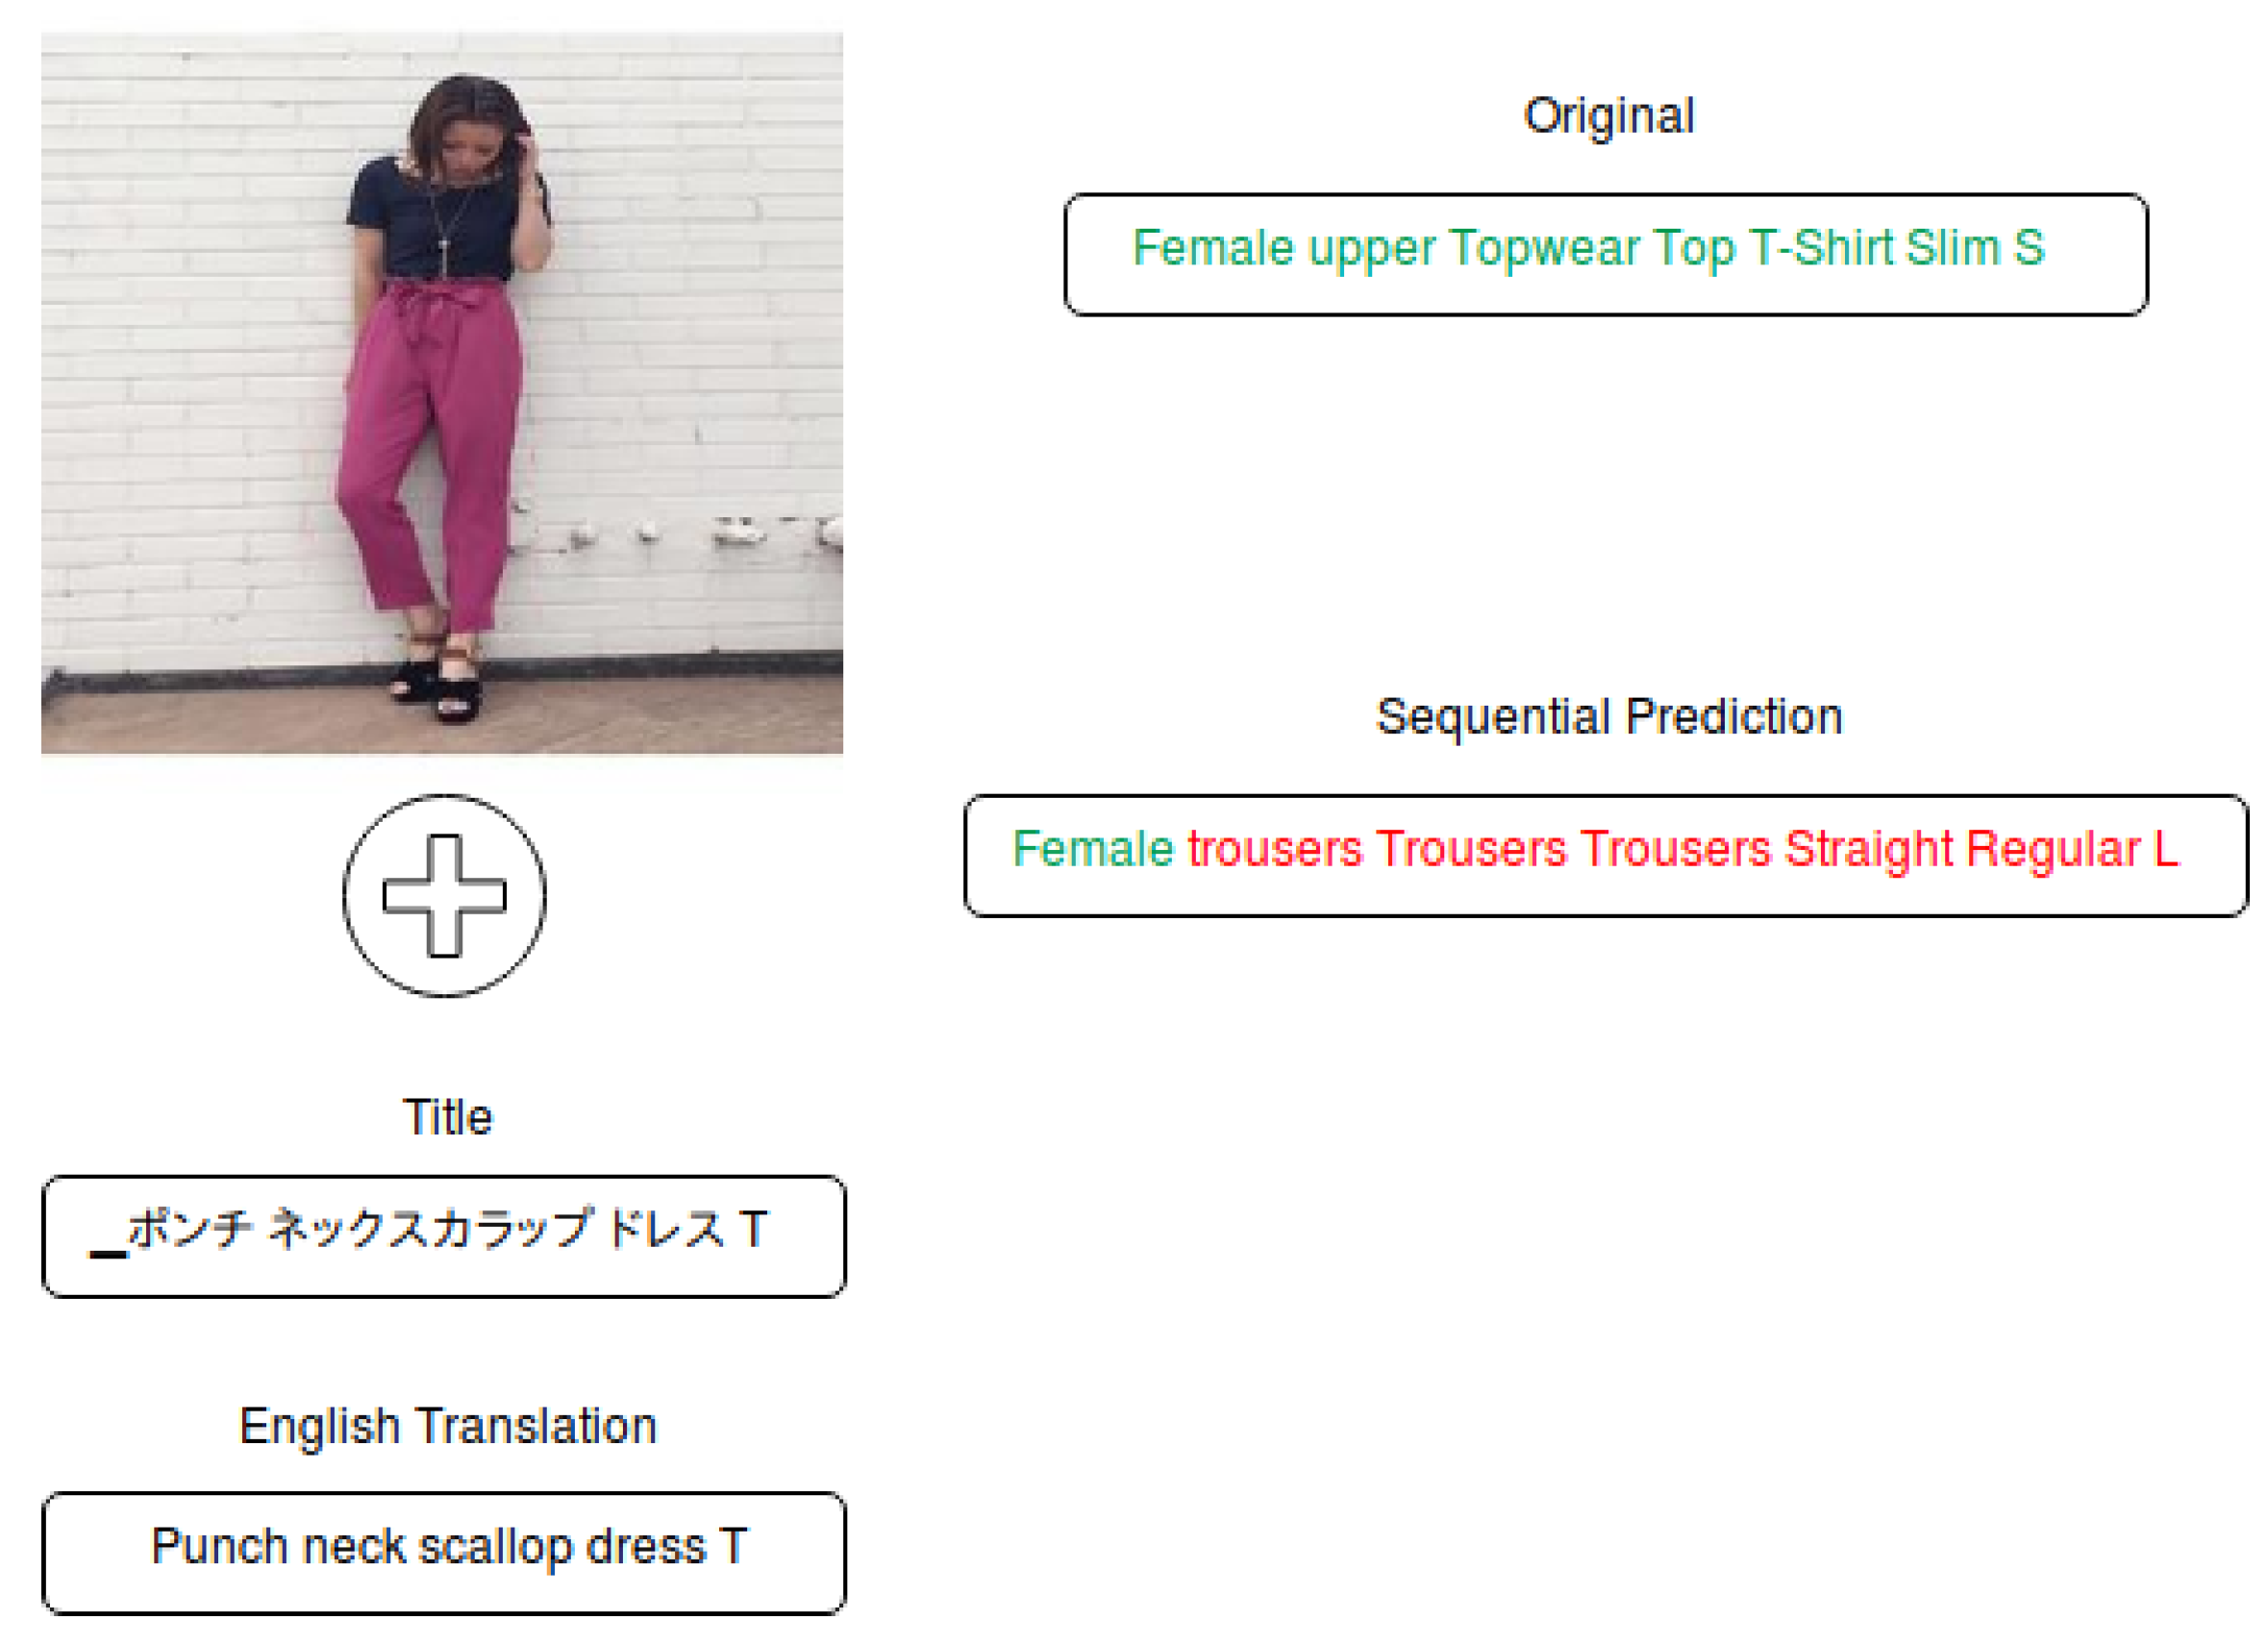
Figure 6.
A sample item from the Rakuten test set, where the original attribute chain is annotated for top dress, but the model focuses on bottom dress attributes. Correctly predicted attributes are in green, the wrongly predicted attributes are in red.
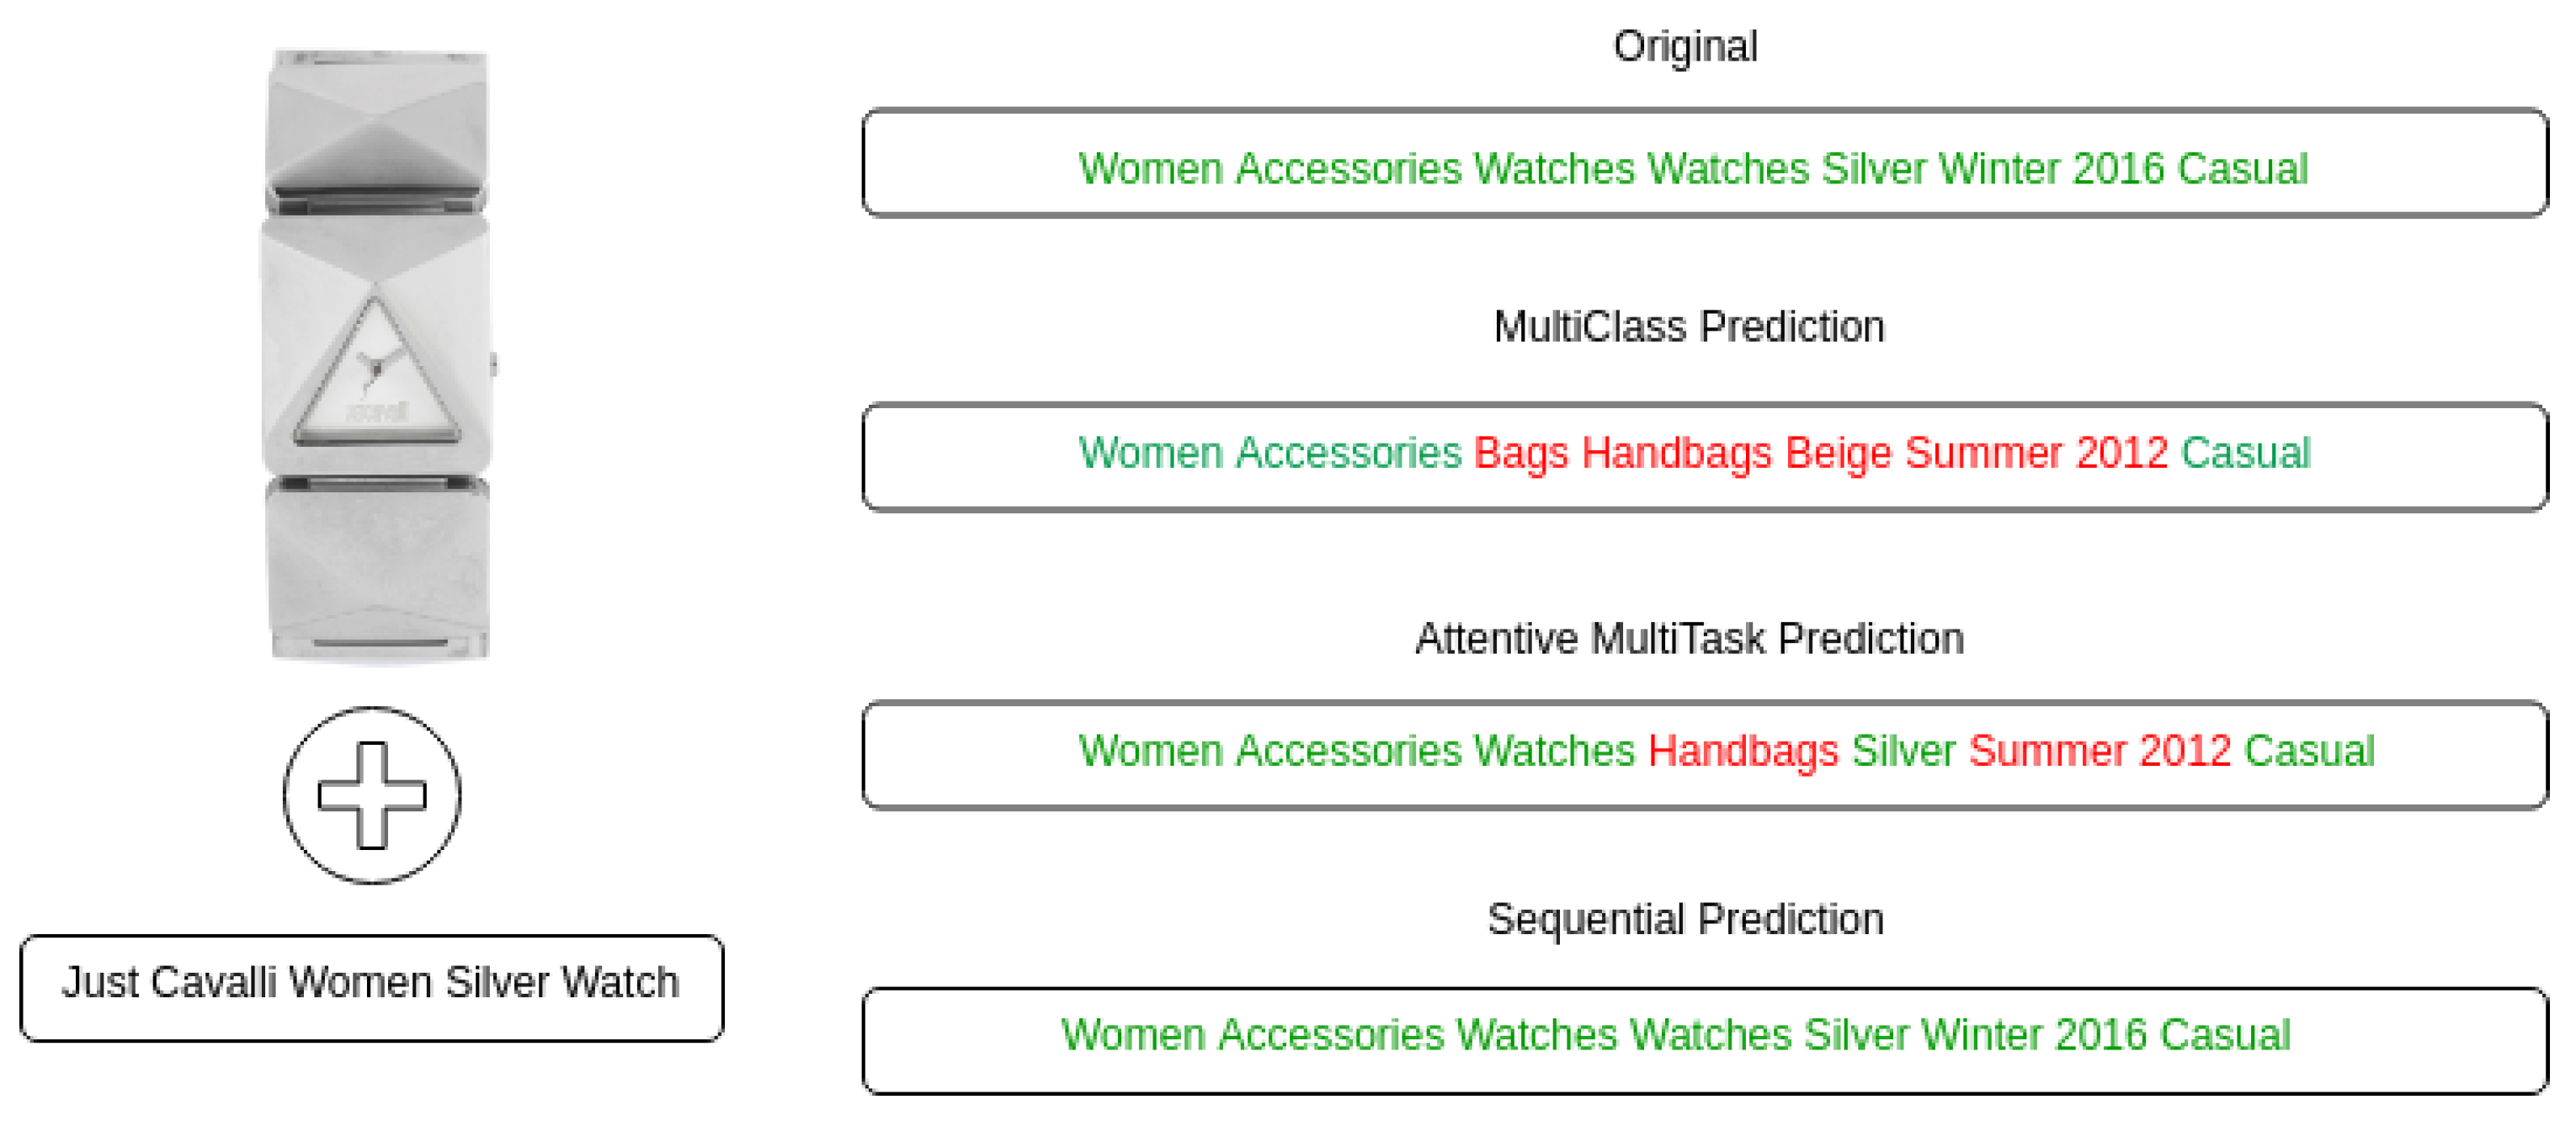
Figure 7.
A sample item from the Kaggle test set with predicted attribute chains. Correctly predicted attributes are in green, the wrongly predicted attributes are in red.
Table 1.
Statistics of the experimental datasets.
| | Train | Dev | Test |
|---|
| Rakuten | 206,104 | 5000 | 5000 |
| Kaggle | 34,446 | 5000 | 5000 |
| Amazon | 1,492,475 | 5000 | 5000 |
Table 2.
Full-chain accuracy of all models on all datasets.
| | Rakuten | Kaggle | Amazon |
|---|
| | Dev | Test | Dev | Test | Dev | Test |
|---|
| MultiClass | 26.82 | 25.98 | 52.08 | 51.54 | 82.82 | 82.98 |
| Binary MultiLabel | 19.98 | 20.84 | 55.00 | 54.70 | - | - |
| MultiTask | 22.34 | 22.66 | 53.58 | 52.40 | - | - |
| Attentive MultiTask | 26.28 | 26.36 | 56.10 | 54.70 | - | - |
| Self-Attentive MultiTask | 25.06 | 25.14 | 55.42 | 54.60 | - | - |
| Sequence | 27.34 | 27.62 | 68.86 | 67.70 | 80.36 | 80.32 |
Table 3.
Attribute level accuracies on the Rakuten test set for all models. Binary ML stands for Binary MultiLabel model, Attn. MT stands for Attentive MultiTask model, Self-Attn. MT denotes the Self-Attentive MultiTask model.
| Attribute | # Values | MultiClass | Binary ML | MultiTask | Attn. MT | Self-Attn. MT | Sequence |
|---|
| Gender | 2 | 94.40 | 94.08 | 94.46 | 96.86 | 96.70 | 96.26 |
| Category | 3 | 98.58 | 98.76 | 98.90 | 99.20 | 98.66 | 98.24 |
| Type | 6 | 94.20 | 94.52 | 94.30 | 94.96 | 94.92 | 93.74 |
| Sub-Type | 16 | 87.68 | 88.20 | 87.62 | 89.36 | 89.42 | 88.02 |
| Cut | 78 | 60.62 | 57.90 | 58.10 | 62.06 | 61.94 | 62.58 |
| Fit | 7 | 49.72 | 48.06 | 49.90 | 51.94 | 51.80 | 52.50 |
| Stretch-Factor | 4 | 79.38 | 78.60 | 77.20 | 79.64 | 80.12 | 78.80 |
| Average | - | 80.65 | 80.02 | 80.07 | 82.00 | 81.94 | 81.45 |
Table 4.
Attribute level accuracies on the Kaggle test set for all models. Binary ML stands for Binary MultiLabel model, Attn. MT stands for Attentive MultiTask model, Self-Attn. MT denotes the Self-Attentive MultiTask model.
| Attribute | # Values | MultiClass | Binary ML | MultiTask | Attn. MT | Self-Attn. MT | Sequence |
|---|
| Gender | 5 | 96.56 | 99.12 | 99.12 | 98.94 | 99.26 | 99.18 |
| Master Category | 7 | 95.96 | 97.84 | 97.24 | 98.76 | 98.36 | 99.48 |
| Sub-Category | 45 | 91.64 | 94.60 | 94.00 | 96.10 | 96.30 | 98.70 |
| Article Type | 141 | 84.62 | 88.72 | 87.80 | 91.26 | 90.96 | 96.50 |
| Base Color | 47 | 79.10 | 83.76 | 82.76 | 85.86 | 85.02 | 90.80 |
| Season | 5 | 79.92 | 82.44 | 81.00 | 81.42 | 80.84 | 85.06 |
| Year | 14 | 81.32 | 83.60 | 83.18 | 83.54 | 84.22 | 86.64 |
| Usage | 10 | 92.10 | 93.18 | 92.50 | 92.90 | 92.82 | 94.06 |
| Average | - | 87.65 | 90.41 | 89.70 | 91.10 | 90.97 | 93.80 |
Table 5.
The accuracy of the different models on the Kaggle test set comparing the performance of seen and unseen attribute chains.
| Model | Seen | Unseen | Total |
|---|
| MultiClass | 56.67 | 0.00 | 51.54 |
| Attentive MultiTask | 58.04 | 21.19 | 54.70 |
| Sequential | 71.04 | 34.22 | 67.70 |
Table 6.
Full-chain attribute accuracy on the test sets of all datasets comparing only text, image-only and multimodal models.
| | Rakuten | Kaggle | Amazon |
|---|
| | Text | Image | Both | Text | Image | Both | Text | Image | Both |
|---|
| MultiClass | 23.62 | 13.72 | 25.98 | 61.24 | 20.62 | 51.54 | 83.10 | 45.08 | 82.98 |
| Attentive MultiTask | 21.94 | 19.04 | 26.36 | 63.00 | 29.97 | 54.70 | - | - | - |
| Sequential | 23.24 | 19.52 | 27.62 | 67.48 | 35.20 | 67.70 | 80.02 | 47.20 | 80.32 |
Table 7.
Attribute accuracies on the Kaggle dataset for all models using both text and multimodal inputs. The Diff column shows the difference between the multimodal and text-only model.
| | MultiClass | Attentive MultiTask | Sequential |
|---|
| Text | Multi-Modal | Diff | Text | Multi-Modal | Diff | Text | Multi-Modal | Diff |
|---|
| Gender | 98.22 | 96.56 | −1.66 | 99.44 | 98.94 | −0.5 | 99.50 | 99.18 | −0.32 |
| Master Category | 98.14 | 95.96 | −2.18 | 99.66 | 98.76 | −0.9 | 99.46 | 99.48 | +0.02 |
| Sub-Category | 96.94 | 91.64 | −5.30 | 98.78 | 96.10 | −2.68 | 98.78 | 98.70 | −0.08 |
| Article Type | 94.38 | 84.62 | −9.76 | 96.64 | 91.26 | −5.38 | 97.14 | 96.50 | −0.64 |
| Base Color | 87.10 | 79.10 | −8.00 | 88.92 | 85.86 | −3.06 | 90.40 | 90.80 | +0.40 |
| Season | 81.58 | 79.92 | −1.66 | 84.06 | 81.42 | −2.64 | 84.98 | 85.06 | +0.08 |
| Year | 83.10 | 81.32 | −1.78 | 85.92 | 83.54 | −2.38 | 86.58 | 86.64 | +0.06 |
| Usage | 93.18 | 92.10 | −1.08 | 94.46 | 92.90 | −1.56 | 95.00 | 94.96 | −0.04 |
| Average | 91.58 | 87.65 | −3.93 | 93.48 | 91.10 | −2.38 | 93.98 | 93.91 | −0.07 |
© 2019 by the authors. Licensee MDPI, Basel, Switzerland. This article is an open access article distributed under the terms and conditions of the Creative Commons Attribution (CC BY) license (http://creativecommons.org/licenses/by/4.0/).


