Identifying a Medical Department Based on Unstructured Data: A Big Data Application in Healthcare

Abstract
1. Introduction
2. Related Work
3. The Proposed System
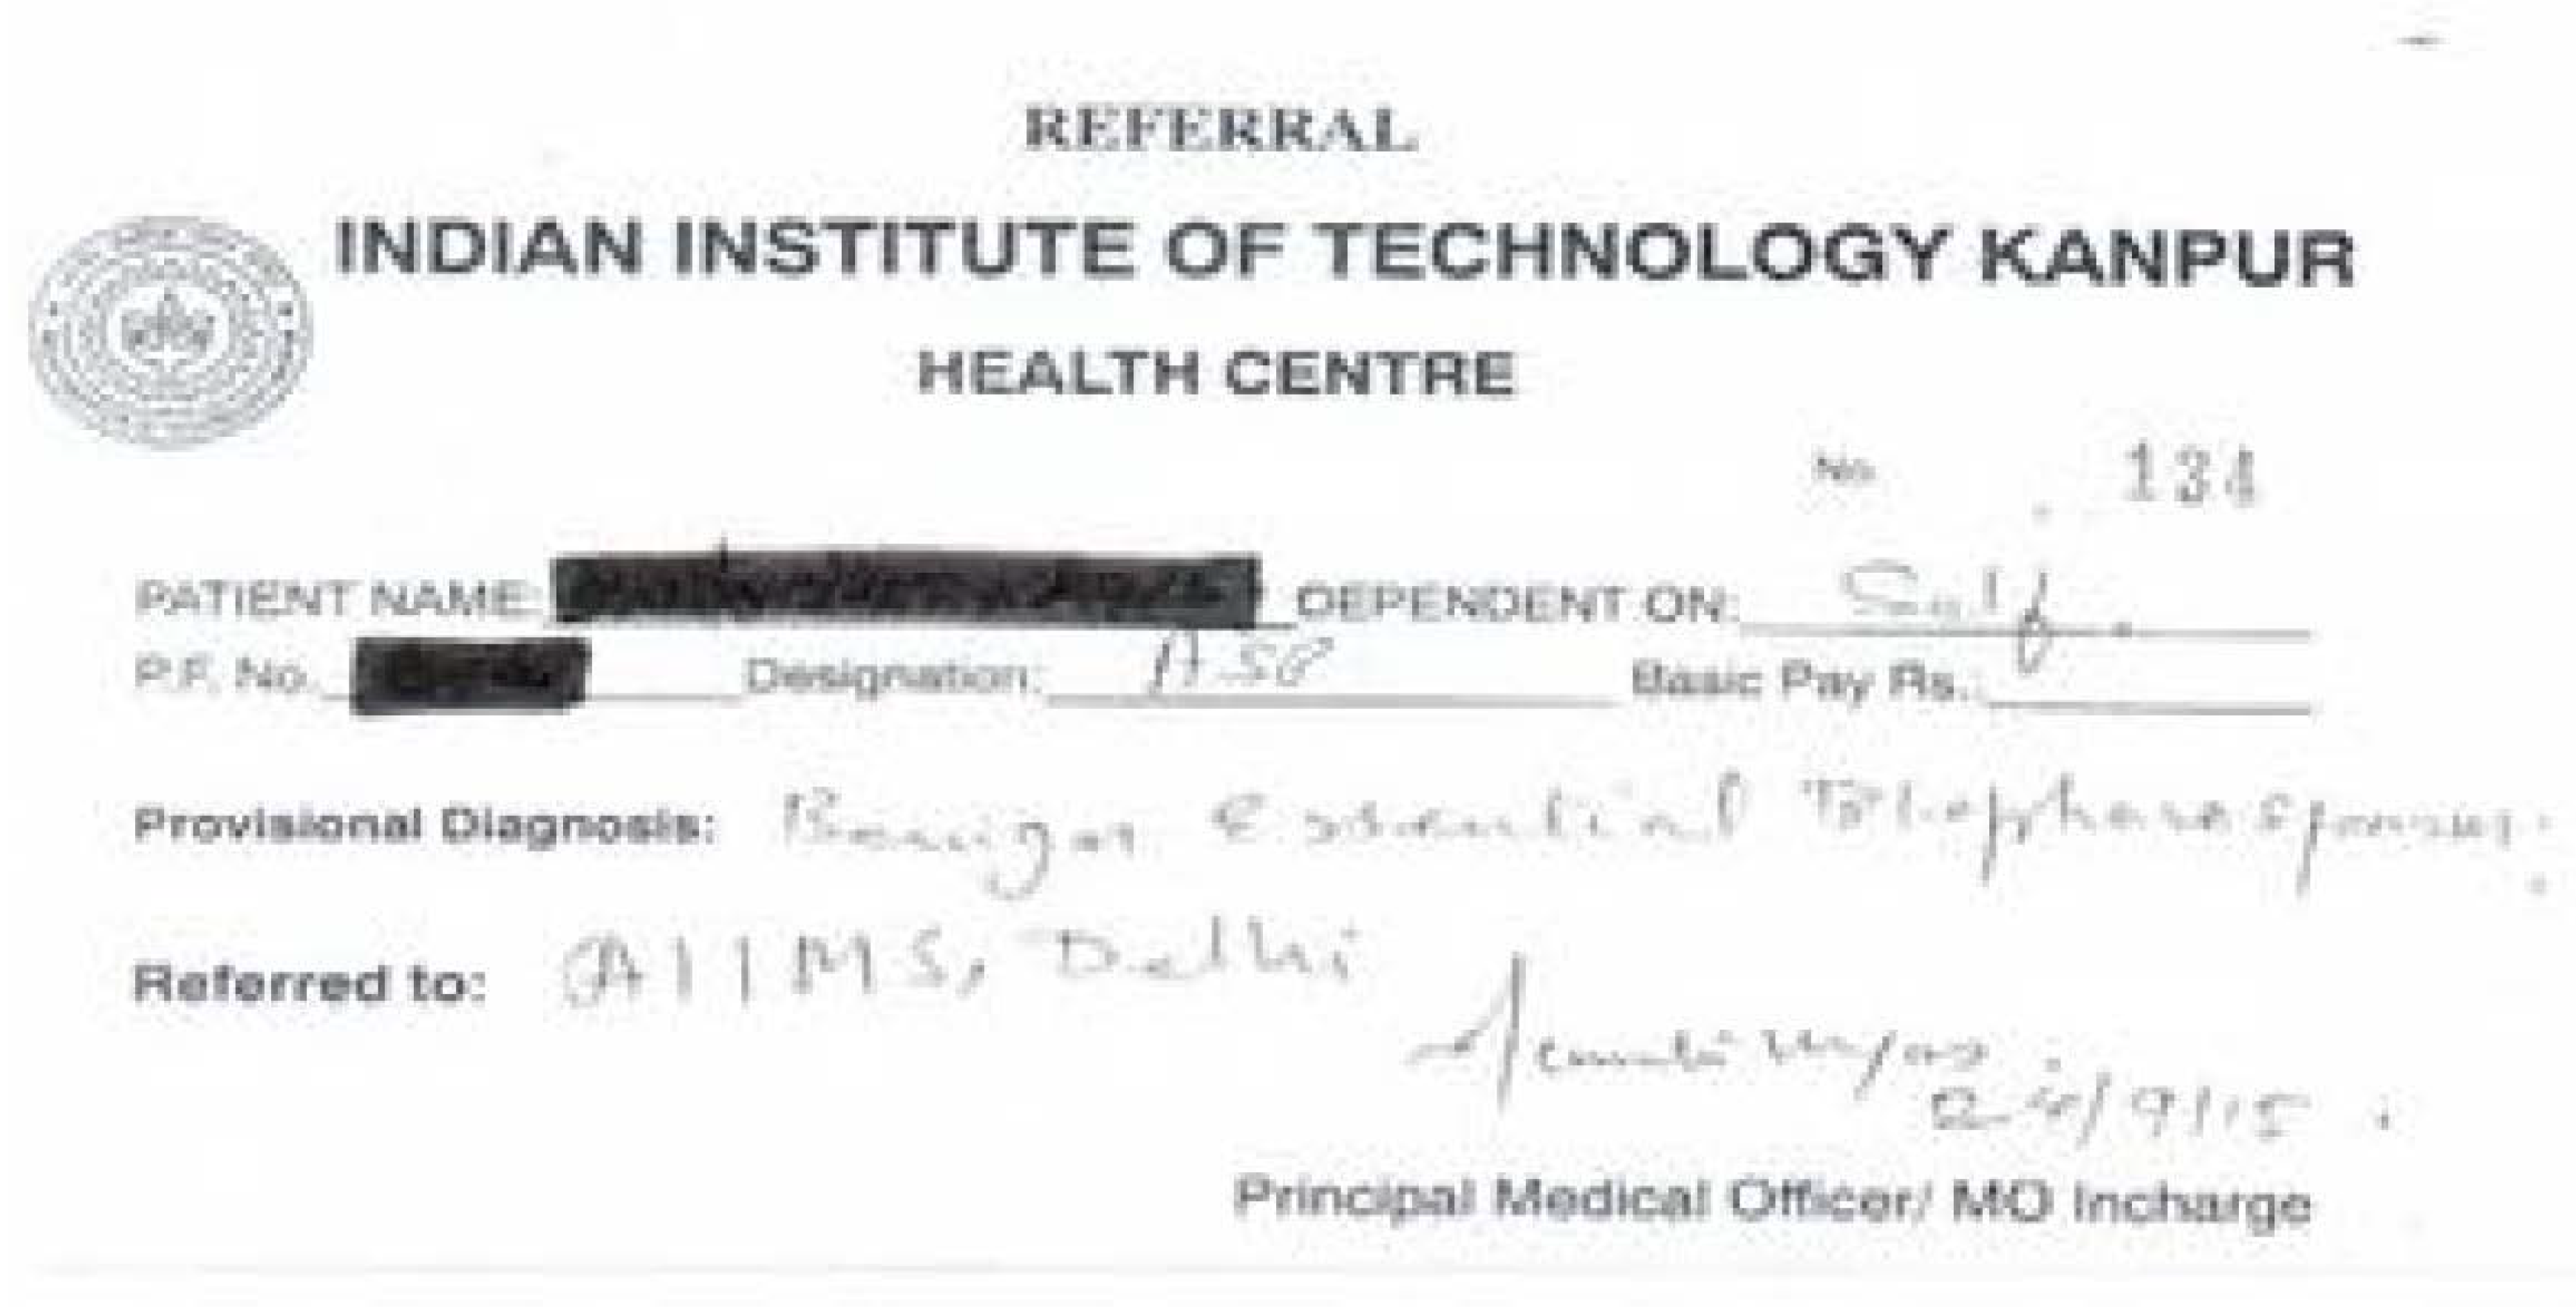
- previous prescriptions from doctors
- drug-store bills of medicines purchased
- diagnostic reports
- medical images
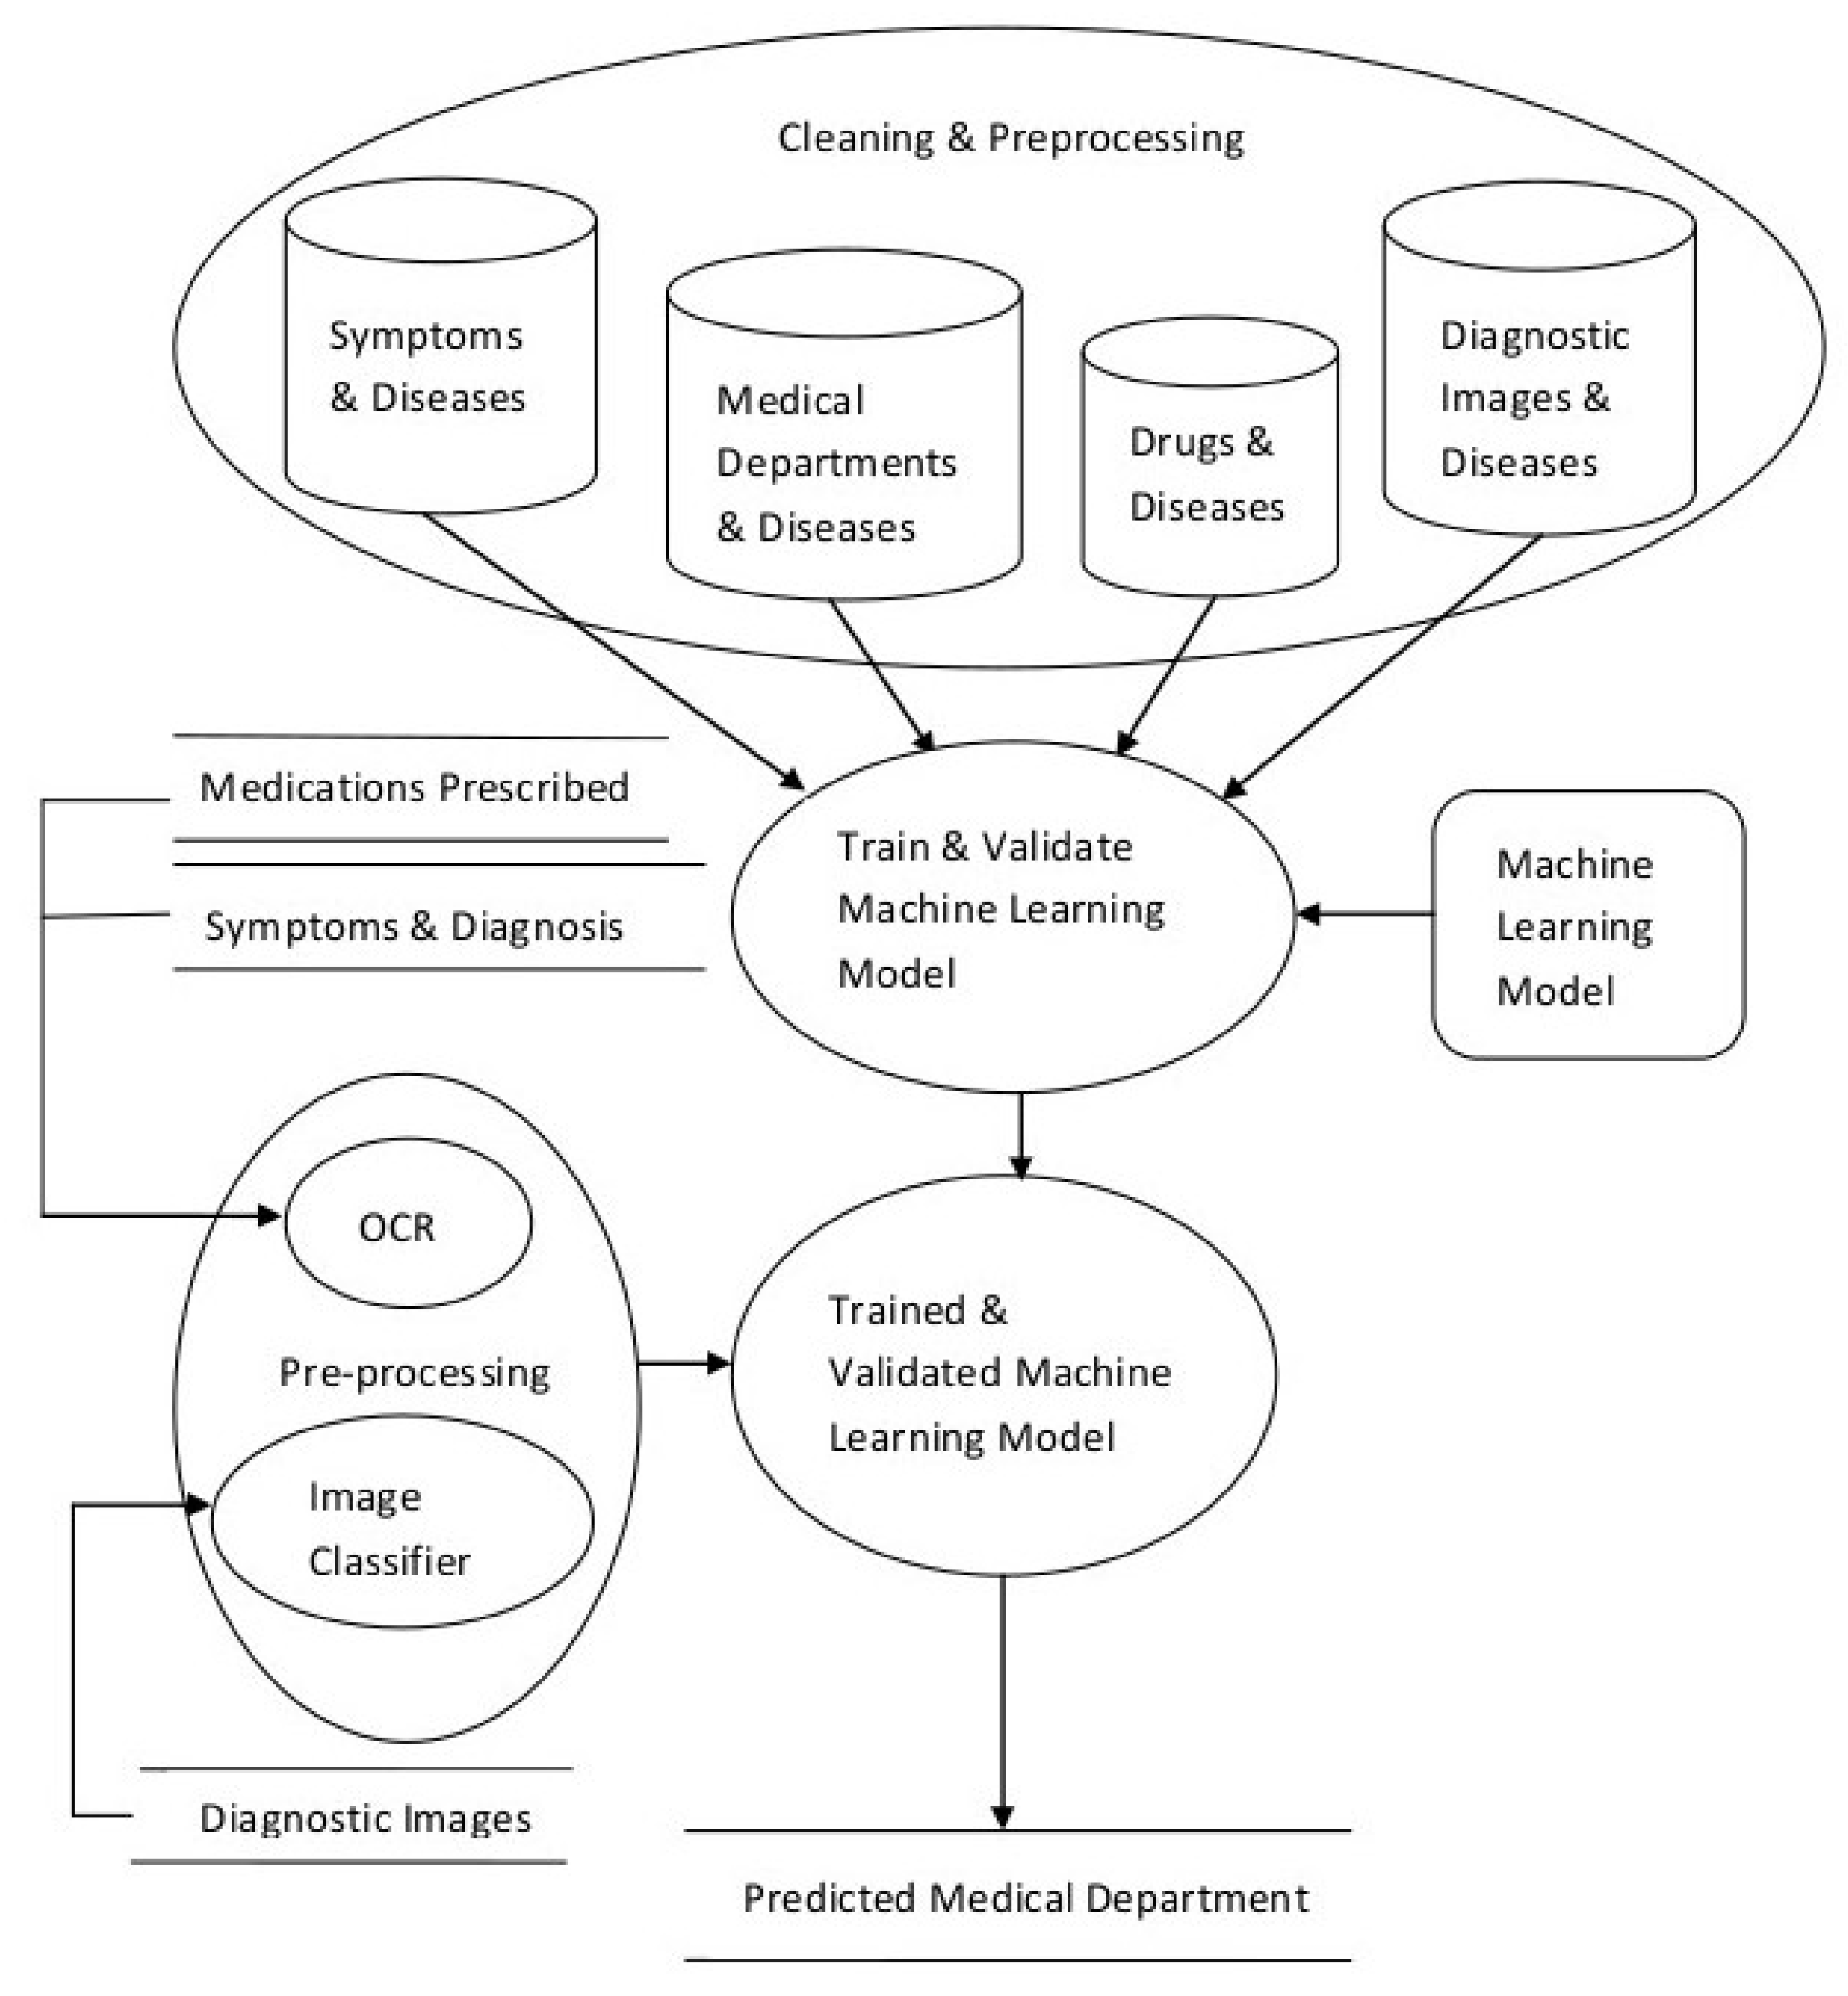
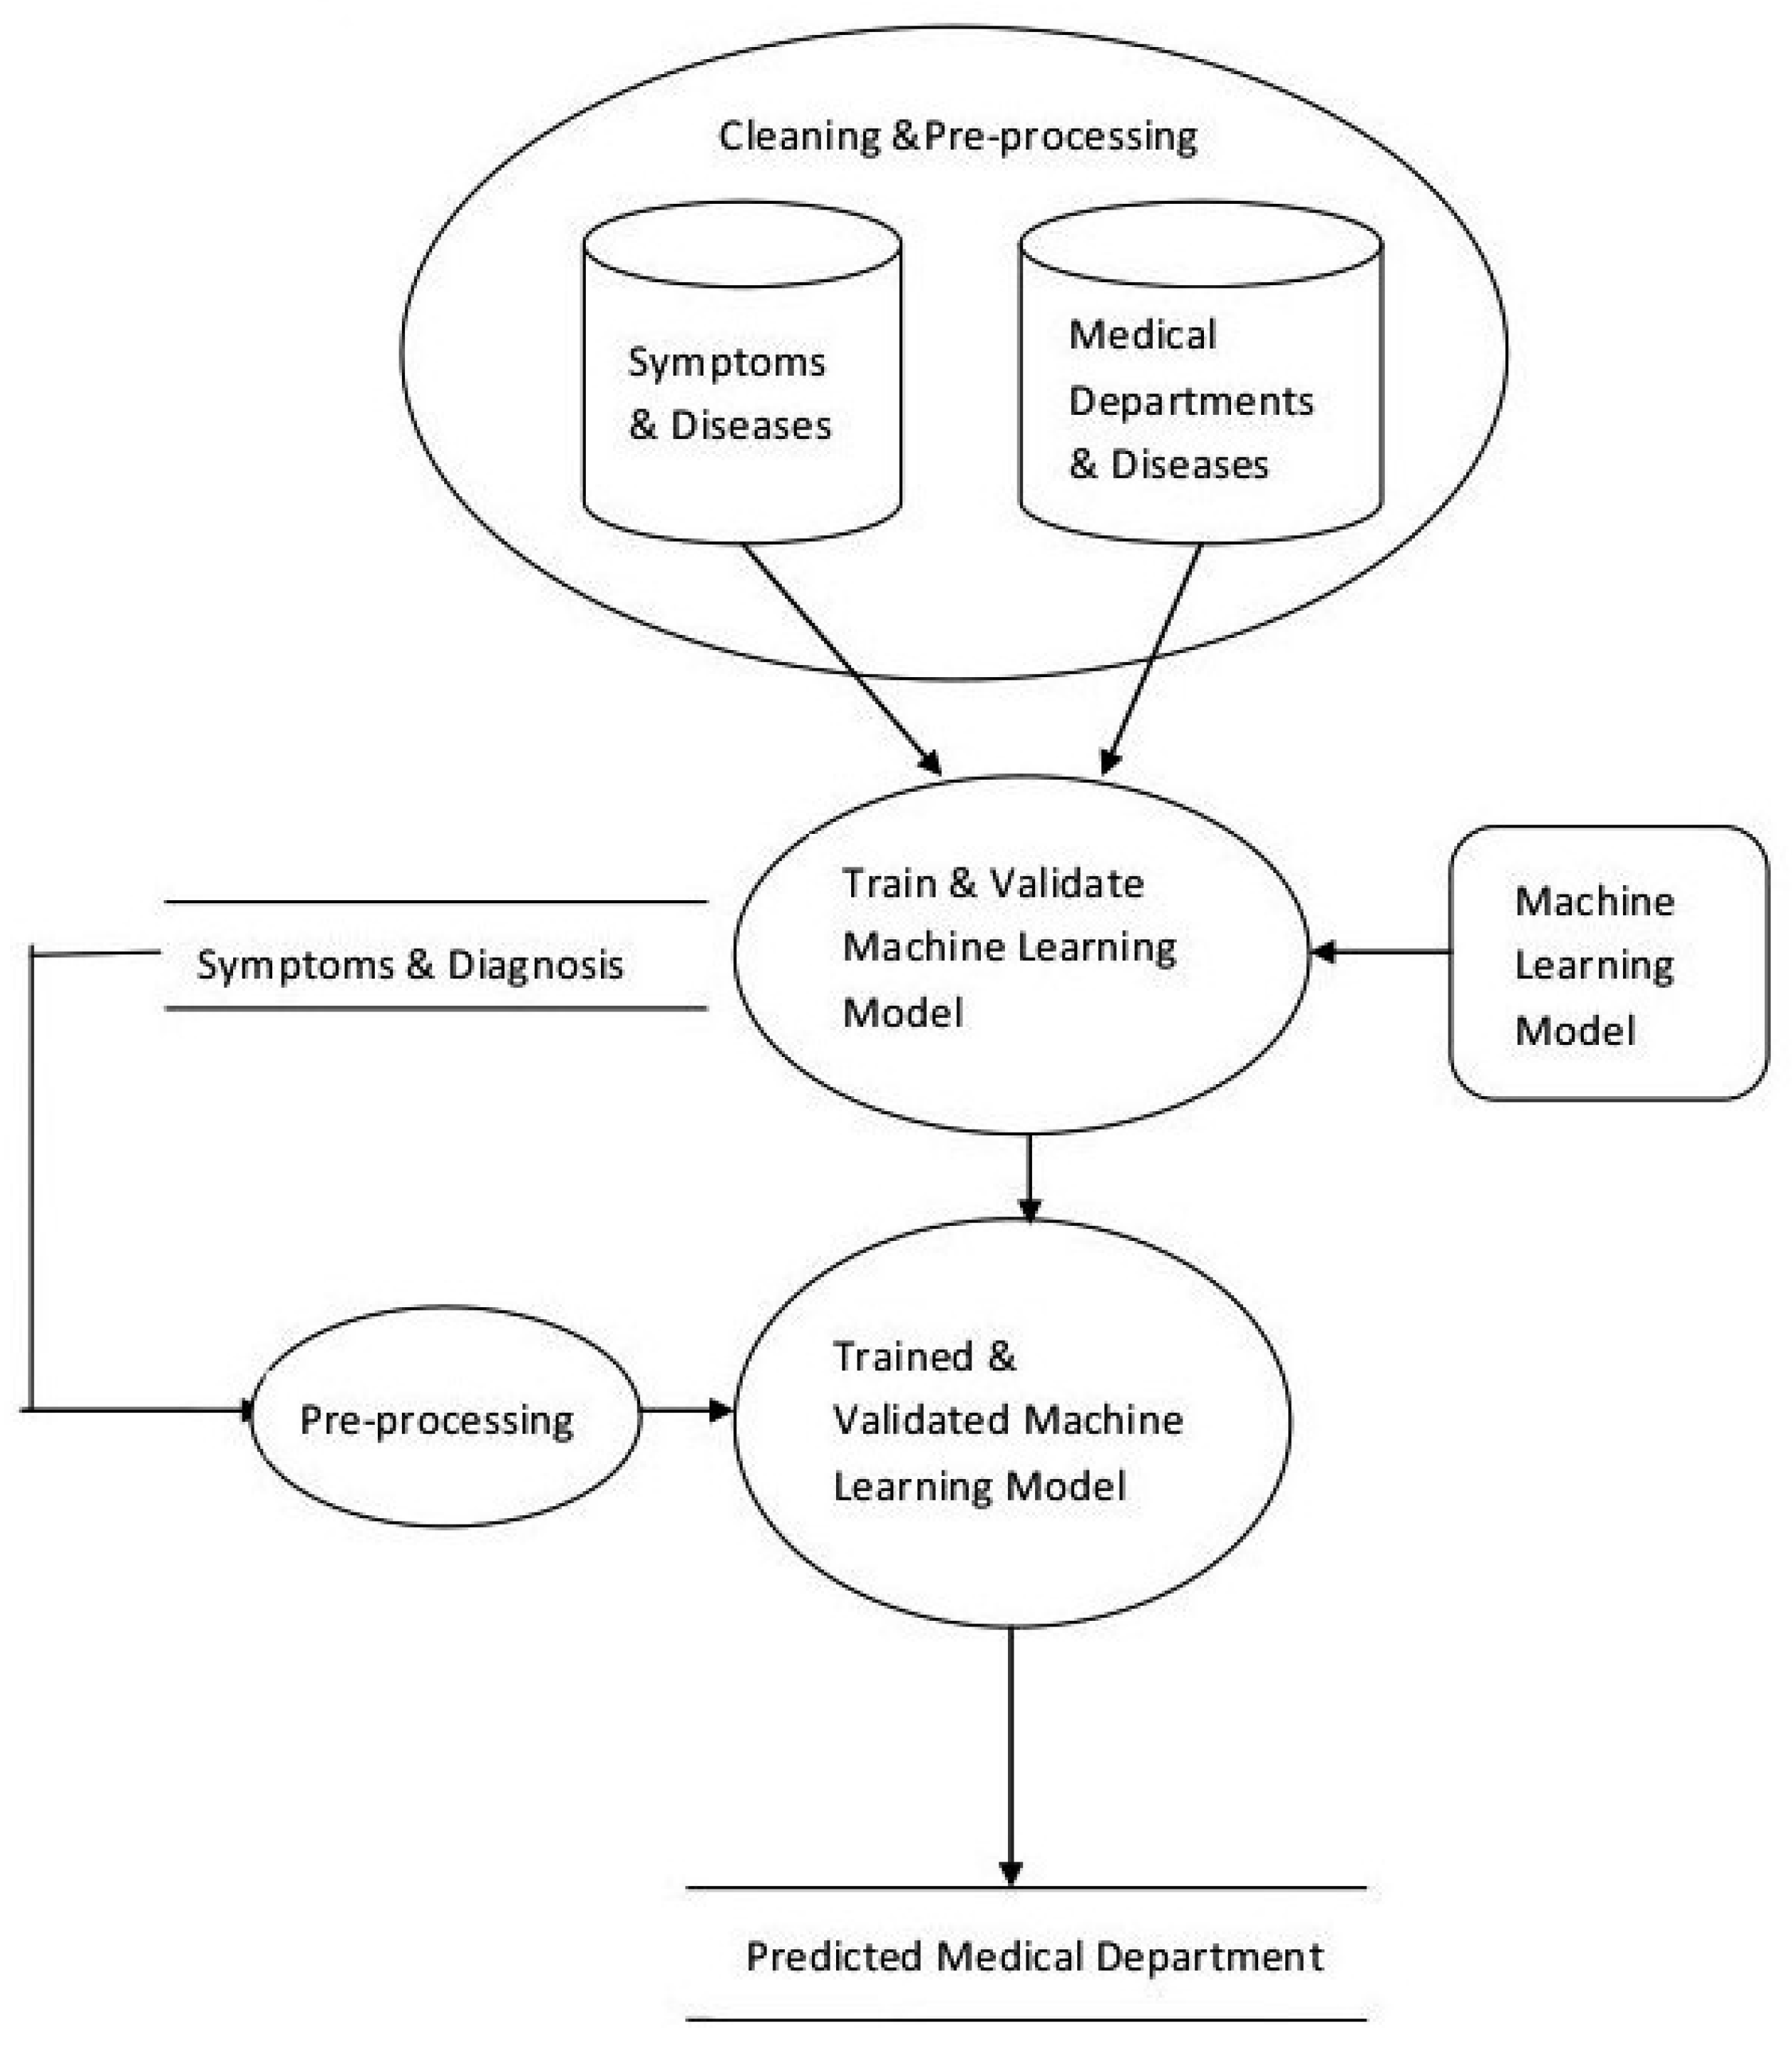
- Data Cleaning and Preprocessing
- Scalable Model Building
- Model Validation and Selection
- Preprocessing and integration for updates
3.1. Data Cleaning and Preprocessing
3.2. Scalable Model Building
3.3. Model Validation and Selection
3.4. Processing and Integration for Updation
4. System Implementation
- Symptoms (features) and name of the Disease (label) Data: Disease_Description,
- Diseases treated by a department (features) and name of the Departmental (label): Functional_Description,
- Name of medicines (features) and Disease (label),
- Diagnostic Images (features) and Diseases (label).
- Create a dataset that has disease information (possibly including their names, associated symptoms, types, synonyms etc.) and name of the concerned medical department.
- Converting the above dataset into vectors.
- Identify suitable machine learning models and train them.
- Test the models and select the best performing model.
5. Results
6. Discussion
Author Contributions
Funding
Conflicts of Interest
References
- Murray, C. Measuring the health-related Sustainable Development Goals in 188 countries: A baseline analysis from the Global Burden of Disease Study 2015. Lancet 2016, 388, 1813–1850. [Google Scholar]
- World Bank Report. Available online: http://data.worldbank.org/indicator/SH.XPD.TOTL.ZS (accessed on 12 April 2016).
- Naser, S.A.; Al-Dahdooh, R.; Mushtaha, A.; El-Naffar, M. Knowledge Management in ESMDA: Expert System for Medical Diagnostic Assistance. ICGST-AIML J. 2010, 10, 31–40. [Google Scholar]
- Tenório, J.M.; Hummel, A.D.; Cohrs, F.M.; Sdepanian, V.L. Artificial intelligence techniques applied to the development of a decision—Support system for diagnosing celiac disease. Int. J. Med. Inf. 2011, 80, 793–802. [Google Scholar] [CrossRef] [PubMed]
- Rahaman, S.; Hossain, M.S. A belief rule based clinical decision support system to assess suspicion of heart failure from signs, symptoms and risk factors. In Proceedings of the International Conference on Informatics, Electronics and Vision (ICIEV), Dhaka, Bangladesh, 17–18 May 2013. [Google Scholar]
- Ibrahim, N.; Belal, N.; Badawy, O. Data Mining Model to Predict Fosamax Adverse Events. Int. J. Comput. Inf. Technol. 2014, 3, 934–941. [Google Scholar]
- Northwestern University, Centre for Genetic Medicine; University of Maryland School of Medicine Institute for Genome Sciences. Doid-Non-Classified.obo, Format-Version: 1.2; Data-Version: Released/2017-04-13; Available online: http://www.disease-ontology.org/ (accessed on 15 May 2017).
- Ephzibah, E.P.; Sundarapandian, V. A Neuro Fuzzy Expert System for Heart Disease Diagnosis. Comput. Sci. Eng. 2012, 2, 17. [Google Scholar] [CrossRef]
- Jain, V.; Raheja, S. Improving the Prediction Rate of Diabetes using Fuzzy Expert System. J. Inf. Technol. Comput. Sci. 2015, 7, 84–91. [Google Scholar] [CrossRef]
- Caballero-Ruiz, E.; García-Sáez, G.; Rigla, M.; Villaplana, M.; Pons, B.; Hernando, M.E. A web-based clinical decision support system for gestational diabetes: Automatic diet prescription and detection of insulin needs. Int. J. Med. Inform. 2017, 102, 35–49. [Google Scholar] [CrossRef]
- Goethe, J.W.; Bronzino, J.D. An expert system for monitoring psychiatric treatment. IEEE Eng. Med. Biol. 1995, 15, 776–780. [Google Scholar] [CrossRef]
- Araújo, F.H.; Santana, A.M.; Neto, P.D.A.S. Using machine learning to support healthcare professionals in making preauthorisation decisions. Int. J. Med. Inform. 2016, 94, 1–7. [Google Scholar] [CrossRef]
- Delias, P.; Doumpos, M.; Grigoroudis, E.; Manolitzas, P.; Matsatsinis, N. Supporting healthcare management decisions via robust clustering of event logs. Knowl.-Based Syst. 2015, 84, 203–213. [Google Scholar] [CrossRef]
- Alonso-Amo, F.; Perez, A.G.; Gomez, G.L.; Montens, C. An Expert System for Homeopathic Glaucoma Treatment (SEHO). Expert Syst. Appl. 1995, 8, 89–99. [Google Scholar] [CrossRef]
- McAndrew, P.D.; Potash, D.L.; Higgins, B.; Wayand, J.; Held, J. Expert System for Providing Interactive Assistance in Solving Problems Such as Health Care Management. U.S. Patent 5,517,405, 14 May 1996. [Google Scholar]
- Davenport, T.H. Big Data at Work: Dispelling the Myths, Uncovering the Opportunities; Harvard Business Review Press: Cambridge, MA, USA, 2014. [Google Scholar]
- Aruna Sri, P.S.G.; Anusha, M. Big Data Survey. Indones. J. Electr. Eng. Inform. IJEEI 2016, 74–80. [Google Scholar] [CrossRef]
- Schultz, T. Turning healthcare challenges into big data opportunities: A use-case review across the pharmaceutical development lifecycle. Bull. Assoc. Inf. Sci. Technol. 2013. [Google Scholar] [CrossRef]
- Jokonya, O. Towards a Big Data Framework for the Prevention and Control of HIV/AIDS, TB and Silicosis in the Mining Industry. Procedia Technol. 2014, 16, 1533–1541. [Google Scholar] [CrossRef]
- Kumar, N.M.S.; Eswari, T.; Sampath, P.; Lavanya, S. Predictive Methodology for Diabetic Data Analysis in Big Data. Procedia Comput. Sci. 2015, 50, 203–208. [Google Scholar] [CrossRef]
- McMullan, M. Patients using the Internet to obtain health information: How this affects the patient-health professional relationship. Patient Educ. Couns. 2006, 63, 24–28. [Google Scholar] [CrossRef] [PubMed]
- Gallagher, M.; Pearson, P.; Drinkwater, C.; Guy, J. Managing patient demand: A qualitative study of appointment making in general practice. Br. J. Gen. Pract. 2001, 51, 280–285. [Google Scholar]
- Busemann, S.; Schmeier, S.; Arens, R.G. Message classification in the call center. In Proceedings of the Sixth Conference on Applied Natural Language Processing, Seattle, WA, USA, 29 April–4 May 2000; pp. 158–165. [Google Scholar]
- Salton, G.; Buckley, C. Term Weighting Approaches in Automatic Text Retrieval. Inf. Process. Manag. 1988, 24, 513–523. [Google Scholar] [CrossRef]
- Sebastiani, F. Machine Learning in Automated Text Categorization. Comput. Surv. 2002, 34, 1–47. [Google Scholar] [CrossRef]
- Jing, L.; Huang, H.; Shi, H. Improved feature selection approach TFIDF in text mining. In Proceedings of the International Conference on Machine Learning and Cybernetics, Beijing, China, 4–5 November 2002; Volume 2, pp. 944–946. [Google Scholar]
- Debole, F. Sebastiani, Supervised Term Weighting for Automated Text Categorization. In Text Mining and Its Applications. Studies in Fuzziness and Soft Computing; Sirmakessis, S., Ed.; Springer: Berlin/Heidelberg, Germany, 2004; Volume 138, pp. 81–97. [Google Scholar]
- Safavian, S.R.; Landgrebe, D. A survey of decision tree classifier methodology. IEEE Trans. Syst. Man Cybern. 1991, 21, 660–674. [Google Scholar] [CrossRef]
- Hopfield, J.J. Artificial neural networks. IEEE Circuits Devices Mag. 1988, 4, 3–10. [Google Scholar] [CrossRef]
- Friedman, J.H. Greedy function approximation: A gradient boosting machine. Ann. Stat. 2001, 29, 1189–1232. [Google Scholar] [CrossRef]
- Breiman, L. Random forests. Mach. Learn. 2001, 45, 5–32. [Google Scholar] [CrossRef]
- Gopal, M. Applied Machine Learning; Mc Graw Hill: New York, NY, USA, 2018; pp. 61–62. [Google Scholar]
- Filipovych, R.; Davatzikos, C. Semi-supervised pattern classification of medical images: Application to mild cognitive impairment (MCI). NeuroImage 2001, 55, 1109–1119. [Google Scholar] [CrossRef] [PubMed]
- Kucheryavski, S. Using hard and soft models for classification of medical images. Chemom. Intell. Lab. Syst. 2007, 88, 100–106. [Google Scholar] [CrossRef]
- Antonie, L.; Zaiane, O.R.; Alexadru, C. Application of Data Mining Techniques for Medical Image Classification. In Proceedings of the Second International Conference on Multimedia Data Mining in Conjunction with ACM SIGIKDD Conference, San Francisco, CA, USA, 26 August 2001; pp. 94–101. [Google Scholar]
- Bansal, V.; Sinha, R.M.K. Integrating knowledge sources in Devanagari text recognition system. IEEE Trans. Syst. Man Cybern.-Part A Syst. Hum. 2000, 30, 500–505. [Google Scholar] [CrossRef]
- Ciregan, D.; Meier, U.; Schmidhuber, J. Multi-column deep neural networks for image classification. In Proceedings of the 25th IEEE Conference on Computer Vision and Pattern Recognition (CVPR), Washington, DC, USA, 16–21 June 2012; pp. 3642–3649. [Google Scholar]
- Patel, D.K.; Som, T.; Yadav, S.K.; Singh, M.K. Handwritten Character Recognition Using Multiresolution Technique and Euclidean Distance Metric. J. Signal Inf. Process. 2012, 3, 208–214. [Google Scholar]
- Ullman, J.; Rajaraman, A. Mining of Massive Datasets. 2014. Available online: http://infolab.stanford.edu/~ullman/mmds/book.pdf (accessed on 11 January 2019).
- Lovins, J.B. Development of a Stemming Algorithm, Mechanical Translation and Computational Linguistics; 11(1 and 2); Defense Technical Information Center: Belvoir, VA, USA, 1968. [Google Scholar]
- Guyon, I.; Elisseeff, A. An Introduction to Feature Extraction. J. Mach. Learn. Res. 2003, 3, 1157–1182. [Google Scholar]
- Ripley, B.D. Pattern Recognition and Neural Networks; Cambridge University Press: Cambridge, UK, 1996. [Google Scholar]
- Aly, M. Survey on 0 Classification Methods. Neutral Netw. 2005, 19, 1–9. [Google Scholar]
- Click, C.; Malohlava, M.; Candel, A.; Roark, H.; Parmar, V. Gradient Boosting Machine with H2O; H2O.ai, Inc.: Mountain View, CA, USA, 2015; Available online: https://h2o-release.s3.amazonaws.com/h2o/master/3157/docs-website/h2o-docs/booklets/GBM_Vignette.pdf (accessed on 11 January 2019).
- Candel, A.; Parmar, V.; Ledell, E.; Arora, A. Deep Learning with H2O. March 2015. Available online: http://h2o.ai/resources (accessed on 10 January 2019).
- H2O, (10 January 2016). Available online: http://docs.h2o.ai/h2o/latest-stable/h2o-docs/data-science/drf.html (accessed on 11 January 2019).
- Collier, A.B. Making Sense of Logarithmic Loss. 2015. Available online: https://datawookie.netlify.com/blog/2015/12/making-sense-of-logarithmic-loss/ (accessed on 11 January 2019).
- Henderson, R. Available online: http://www.netdoctor.co.uk/health-services/nhs/a4502/a-to-z-of-hospital-departments/ (accessed on 11 January 2019).
- Mayoclinic. Available online: http://www.mayoclinic.org/departments-centers/index (accessed on 10 January 2016).
- Kalman, B.L.; Kwasny, S.C. Why tanh: Choosing a sigmoidal function. In Proceedings of the International Joint Conference on Neural Networks, Baltimore, MD, USA, 7–11 June 1992; Volume 4, pp. 578–581. [Google Scholar]
- Hahnloser, R.; Sarpeshkar, R.; Mahowald, M.A.; Douglas, R.J.; Seung, H.S. Digital Selection and analogue amplification coexist in a cortex-inspired silicon circuit. Nature 2000, 405, 947–951. [Google Scholar] [CrossRef]
- Goodfellow, I.J.; Warde-Farley, D.; Mirza, M.; Courtville, A.; Bengio, Y. Maxout networks. In Proceedings of the 30th International Conference on Machine Learning, Atlanta, GA, USA, 16–21 June 2013; pp. 1319–1327. [Google Scholar]
- Srivastava, N.; Hinton, G.; Krizhevsky, A.; Sutskever, I.; Salakhutdinov, R. Dropout: A Simple Way to Prevent Neural Networks from Overfitting. J. Mach. Learn. Res. 2014, 15, 1929–1958. [Google Scholar]
- Collins, G.S.; Reitsma, J.B.; Altmana, D.G.; Moons, K.G.M. TRIPOD: A New Reporting Baseline for Developing and Interpreting Prediction Models. Art. Ann. Internal Med. 2015, 162, 73–74. [Google Scholar]
- Pal, M. Random forest classifier for remote sensing classification. Int. J. Remote Sens. 2005, 26, 217–222. [Google Scholar] [CrossRef]


| Serial No. | Department Name |
|---|---|
| 1 | Anesthetics |
| 2 | Breast Screening |
| 3 | Cardiology |
| 4 | Ear, nose and throat (ENT) |
| 5 | Elderly services department |
| 6 | Gastroenterology |
| 7 | General Surgery |
| 8 | Gynecology |
| 9 | Hematology |
| 10 | Neonatal Unit |
| 11 | Neurology |
| 12 | Nutrition and dietetics |
| 13 | Obstetrics and gynecology units |
| 14 | Oncology |
| 15 | Ophthalmology |
| 16 | Orthopedics |
| 17 | Physiotherapy |
| 18 | Renal Unit |
| 19 | Sexual Health |
| 20 | Urology |
| Variable | relative_importance | scaled_importance | Percentage |
|---|---|---|---|
| prostate | 11,215.2275 | 1.0 | 0.0486 |
| female | 9913.1689 | 0.8839 | 0.0429 |
| dysfunction | 9881.0342 | 0.8810 | 0.0428 |
| cyst | 8901.1807 | 0.7937 | 0.0386 |
| metabolism | 2098.9890 | 0.1872 | 0.0091 |
| sexual | 2009.0562 | 0.1791 | 0.0087 |
| mitochondrial | 1720.9409 | 0.1534 | 0.0075 |
| mutation | 1659.1718 | 0.1479 | 0.0072 |
| gene | 1541.5609 | 0.1375 | 0.0067 |
| variation | 1524.2786 | 0.1359 | 0.0066 |
| cataract1 | 1416.9362 | 0.1263 | 0.0061 |
| peripheral | 1387.7133 | 0.1237 | 0.0060 |
| autosomal | 1293.4233 | 0.1153 | 0.0056 |
| depletion | 1286.6816 | 0.1147 | 0.0056 |
| cataract | 1286.4379 | 0.1147 | 0.0056 |
| chromosome | 1245.4380 | 0.1110 | 0.0054 |
| arthropathy | 1202.5996 | 0.1072 | 0.0052 |
| pressure | 1081.8126 | 0.0965 | 0.0047 |
| characterized | 1059.2102 | 0.0944 | 0.0046 |
| autosomal1 | 1023.6373 | 0.0913 | 0.0044 |
| cancer | 993.5568 | 0.0886 | 0.0043 |
| recessive | 979.1630 | 0.0873 | 0.0042 |
| region | 959.4741 | 0.0856 | 0.0042 |
| compound | 939.4285 | 0.0838 | 0.0041 |
| deafness | 922.4604 | 0.0823 | 0.004 |
| Parameter Setting | GBM (Training) | GBM (Validation) | DL (Training) | DL (Validation) | DRF (Training) | DRF (Validation) |
|---|---|---|---|---|---|---|
| 1 | 21.94 | 39.03 | 34.80 | 35.55 | 15.38 | 34.14 |
| 2 | 51.34 | 55.04 | 33.42 | 34.52 | 15.02 | 32.91 |
| 3 | 30.40 | 43.74 | 32.90 | 33.96 | 12.14 | 33.57 |
| 4 | 17.72 | 31.95 | 32.43 | 33.78 | 10.99 | 35.96 |
| 5 | 13.82 | 39.35 | 33.3 | 33.47 | 10.18 | 39.81 |
| Parameter Setting | Number of Trees | Max Depth of Tree | DRF (Training) | DRT (Validation) |
|---|---|---|---|---|
| 1 | 128 | 5 | 5.23 | 8.4 |
| 2 | 128 | 8 | 6.12 | 7.3 |
| 3 | 128 | 10 | 8.32 | 7.6 |
| 4 | 500 | 10 | 6.91 | 7.9 |
| 5 | 1000 | 10 | 9.54 | 8.6 |
© 2019 by the authors. Licensee MDPI, Basel, Switzerland. This article is an open access article distributed under the terms and conditions of the Creative Commons Attribution (CC BY) license (http://creativecommons.org/licenses/by/4.0/).
Share and Cite
Bansal, V.; Poddar, A.; Ghosh-Roy, R. Identifying a Medical Department Based on Unstructured Data: A Big Data Application in Healthcare. Information 2019, 10, 25. https://doi.org/10.3390/info10010025
Bansal V, Poddar A, Ghosh-Roy R. Identifying a Medical Department Based on Unstructured Data: A Big Data Application in Healthcare. Information. 2019; 10(1):25. https://doi.org/10.3390/info10010025
Chicago/Turabian StyleBansal, Veena, Abhishek Poddar, and R. Ghosh-Roy. 2019. "Identifying a Medical Department Based on Unstructured Data: A Big Data Application in Healthcare" Information 10, no. 1: 25. https://doi.org/10.3390/info10010025
APA StyleBansal, V., Poddar, A., & Ghosh-Roy, R. (2019). Identifying a Medical Department Based on Unstructured Data: A Big Data Application in Healthcare. Information, 10(1), 25. https://doi.org/10.3390/info10010025