Challenges in Improving Energy Efficiency in a University Campus Through the Application of Persuasive Technology and Smart Sensors


Abstract
:1. Introduction

2. Related Work

| Author/Yr | Pilot/Target Group | Methodology | Outcome | Problem Analysis |
|---|---|---|---|---|
| Marcell K. et al. 2004 | Cooling the campus experiences from a pilot study to reduce electricity use at Tufts University, USA, using social marketing methods. | Social marketing campaign; no real-time | Residents of the controlled dormitory were exposed to an educational program | Lack of information, sample size, issues, sustainability and high cost of implementation. |
| USA [11] | ||||
| Dormitory residents were exposed to an educational program only, while residents of the experimental dorm were exposed to the same educational program as well as a social marketing campaign, which has a greater impact in changing the students’ behavior | ||||
| feedback data. | ||||
| Target Group: Students | ||||
| Petersen J.E. et al. 2007 | Dormitory residents reduce electricity consumption when exposed to real-time visual feedback and incentives. | Using an automated monitoring system to provide real-time web-based feedback on energy and water, using education and conservation incentives. | Dormitories that received high resolution feedback were more effective at conservation, reducing their electricity consumption by 55 per cent compared to 31 per cent for low resolution dormitories | Hawthorns effect |
| Manually reading issues | ||||
| USA [7] | ||||
| Non sustainability and continuity. | ||||
| Target Group: Students | ||||
| Readings provided manually to low resolution dormitories and | ||||
| real-time for high resolution dormitories. | ||||
| Brewer R.S. et al. 2011 | A Dorm Energy Competition Focused on Sustainable Behaviour Change and Energy Literacy | They used a personalized homepage where students can complete tasks designed to increase energy literacy that can be verified by competition administrators. The technology and approach was evaluated in a dorm energy competition to take place in the spring of 2011, with hundreds of university freshmen. The data is provided in near real-time | No clear outcome as it was proposed that energy use of each pair of dormitory floors would be metered in near-real-time, and the energy literacy of students would be assessed before and after the competition. | Competition motivated |
| Sustainability and continuity issues | ||||
| USA [8] | ||||
| Target Group: Students | ||||
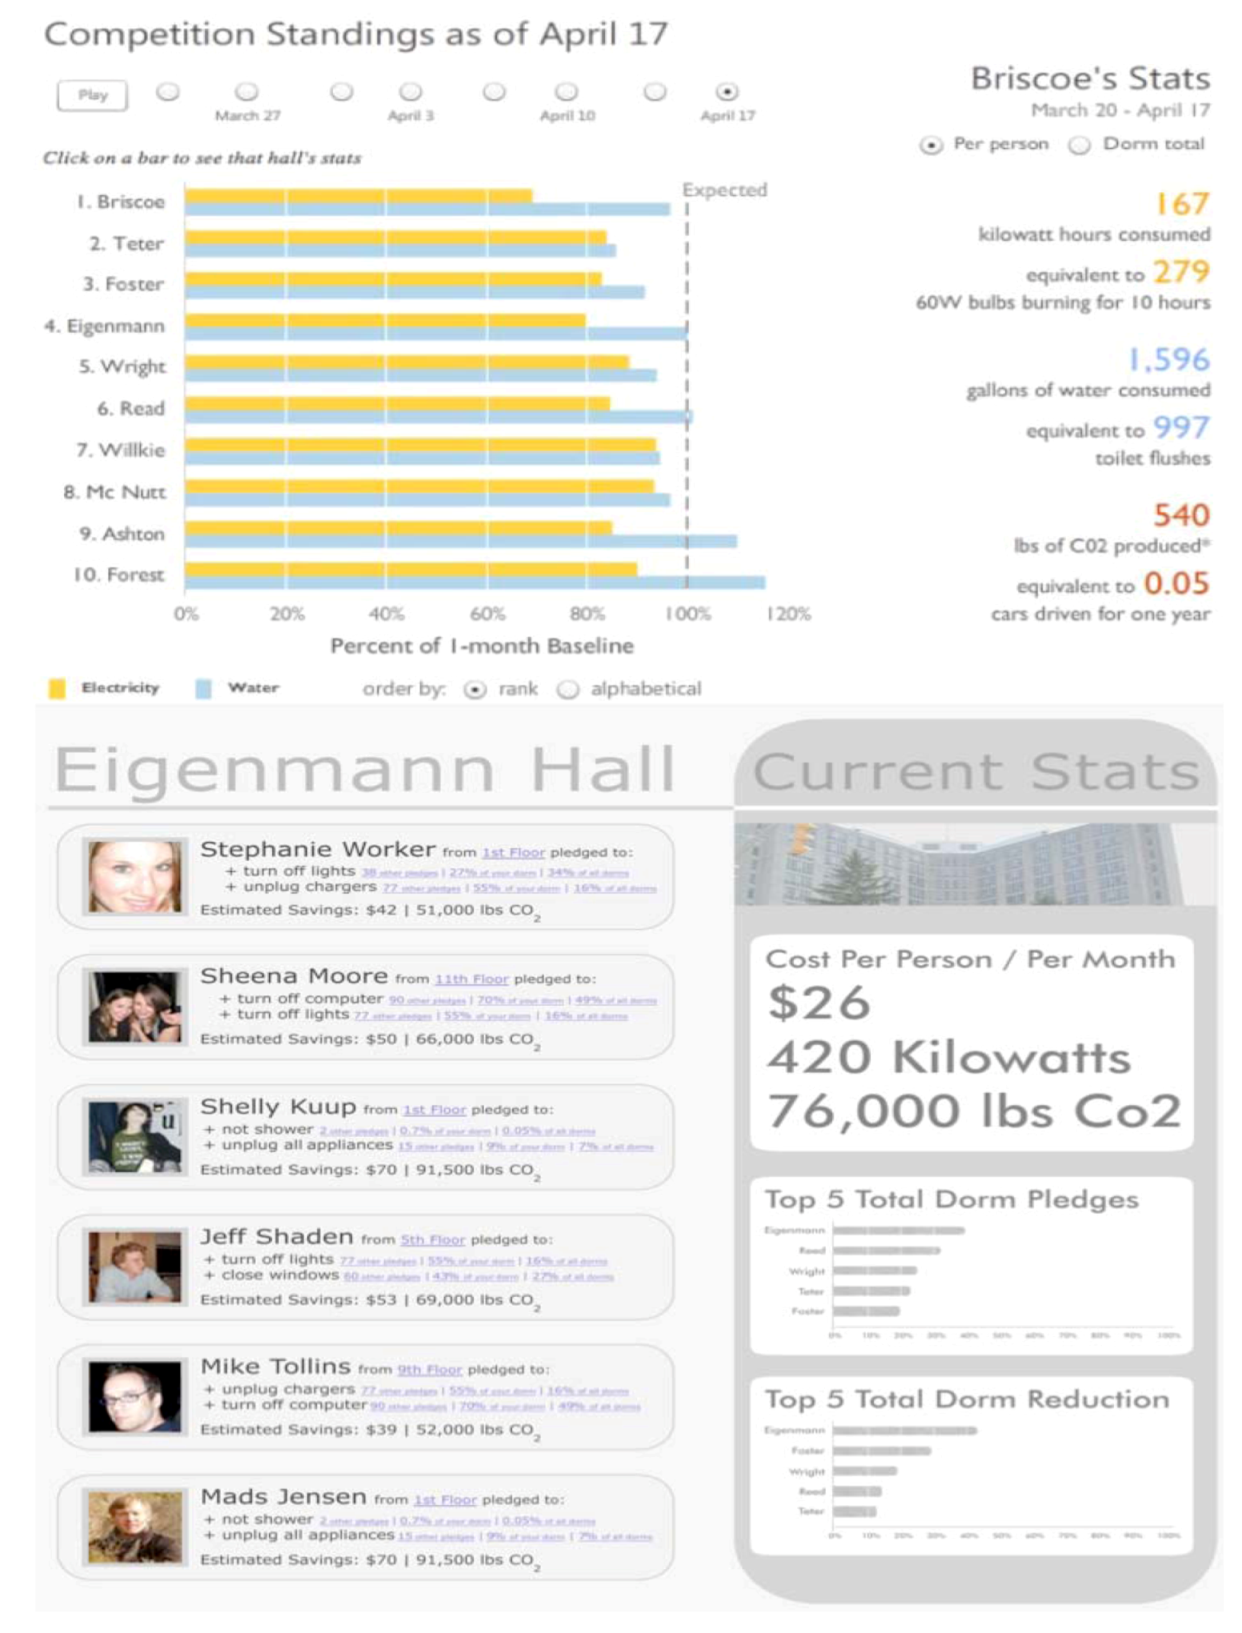
| Odom W. et al. 2008 | Social Incentive and Eco-Visualisation Displays: Toward Persuading Greater Change in Dormitory Communities | Students in 10 dormitories received feedback primarily through the Energy Challenge website (which visualized data from a utilities information database), Additionally, updates were sent to students via a Facebook group and email. | The competition resulted in an estimated combined avoidance of 33,008 kilowatt hours (KWh) of electricity and 724,322 gallons of water compared to baseline consumption of the previous three years. | Cash prize motivated. |
| Australia [9] | Students subject to experimental condition. | |||
| Facebook update may distract attention. | ||||
| Target Group: Students | ||||
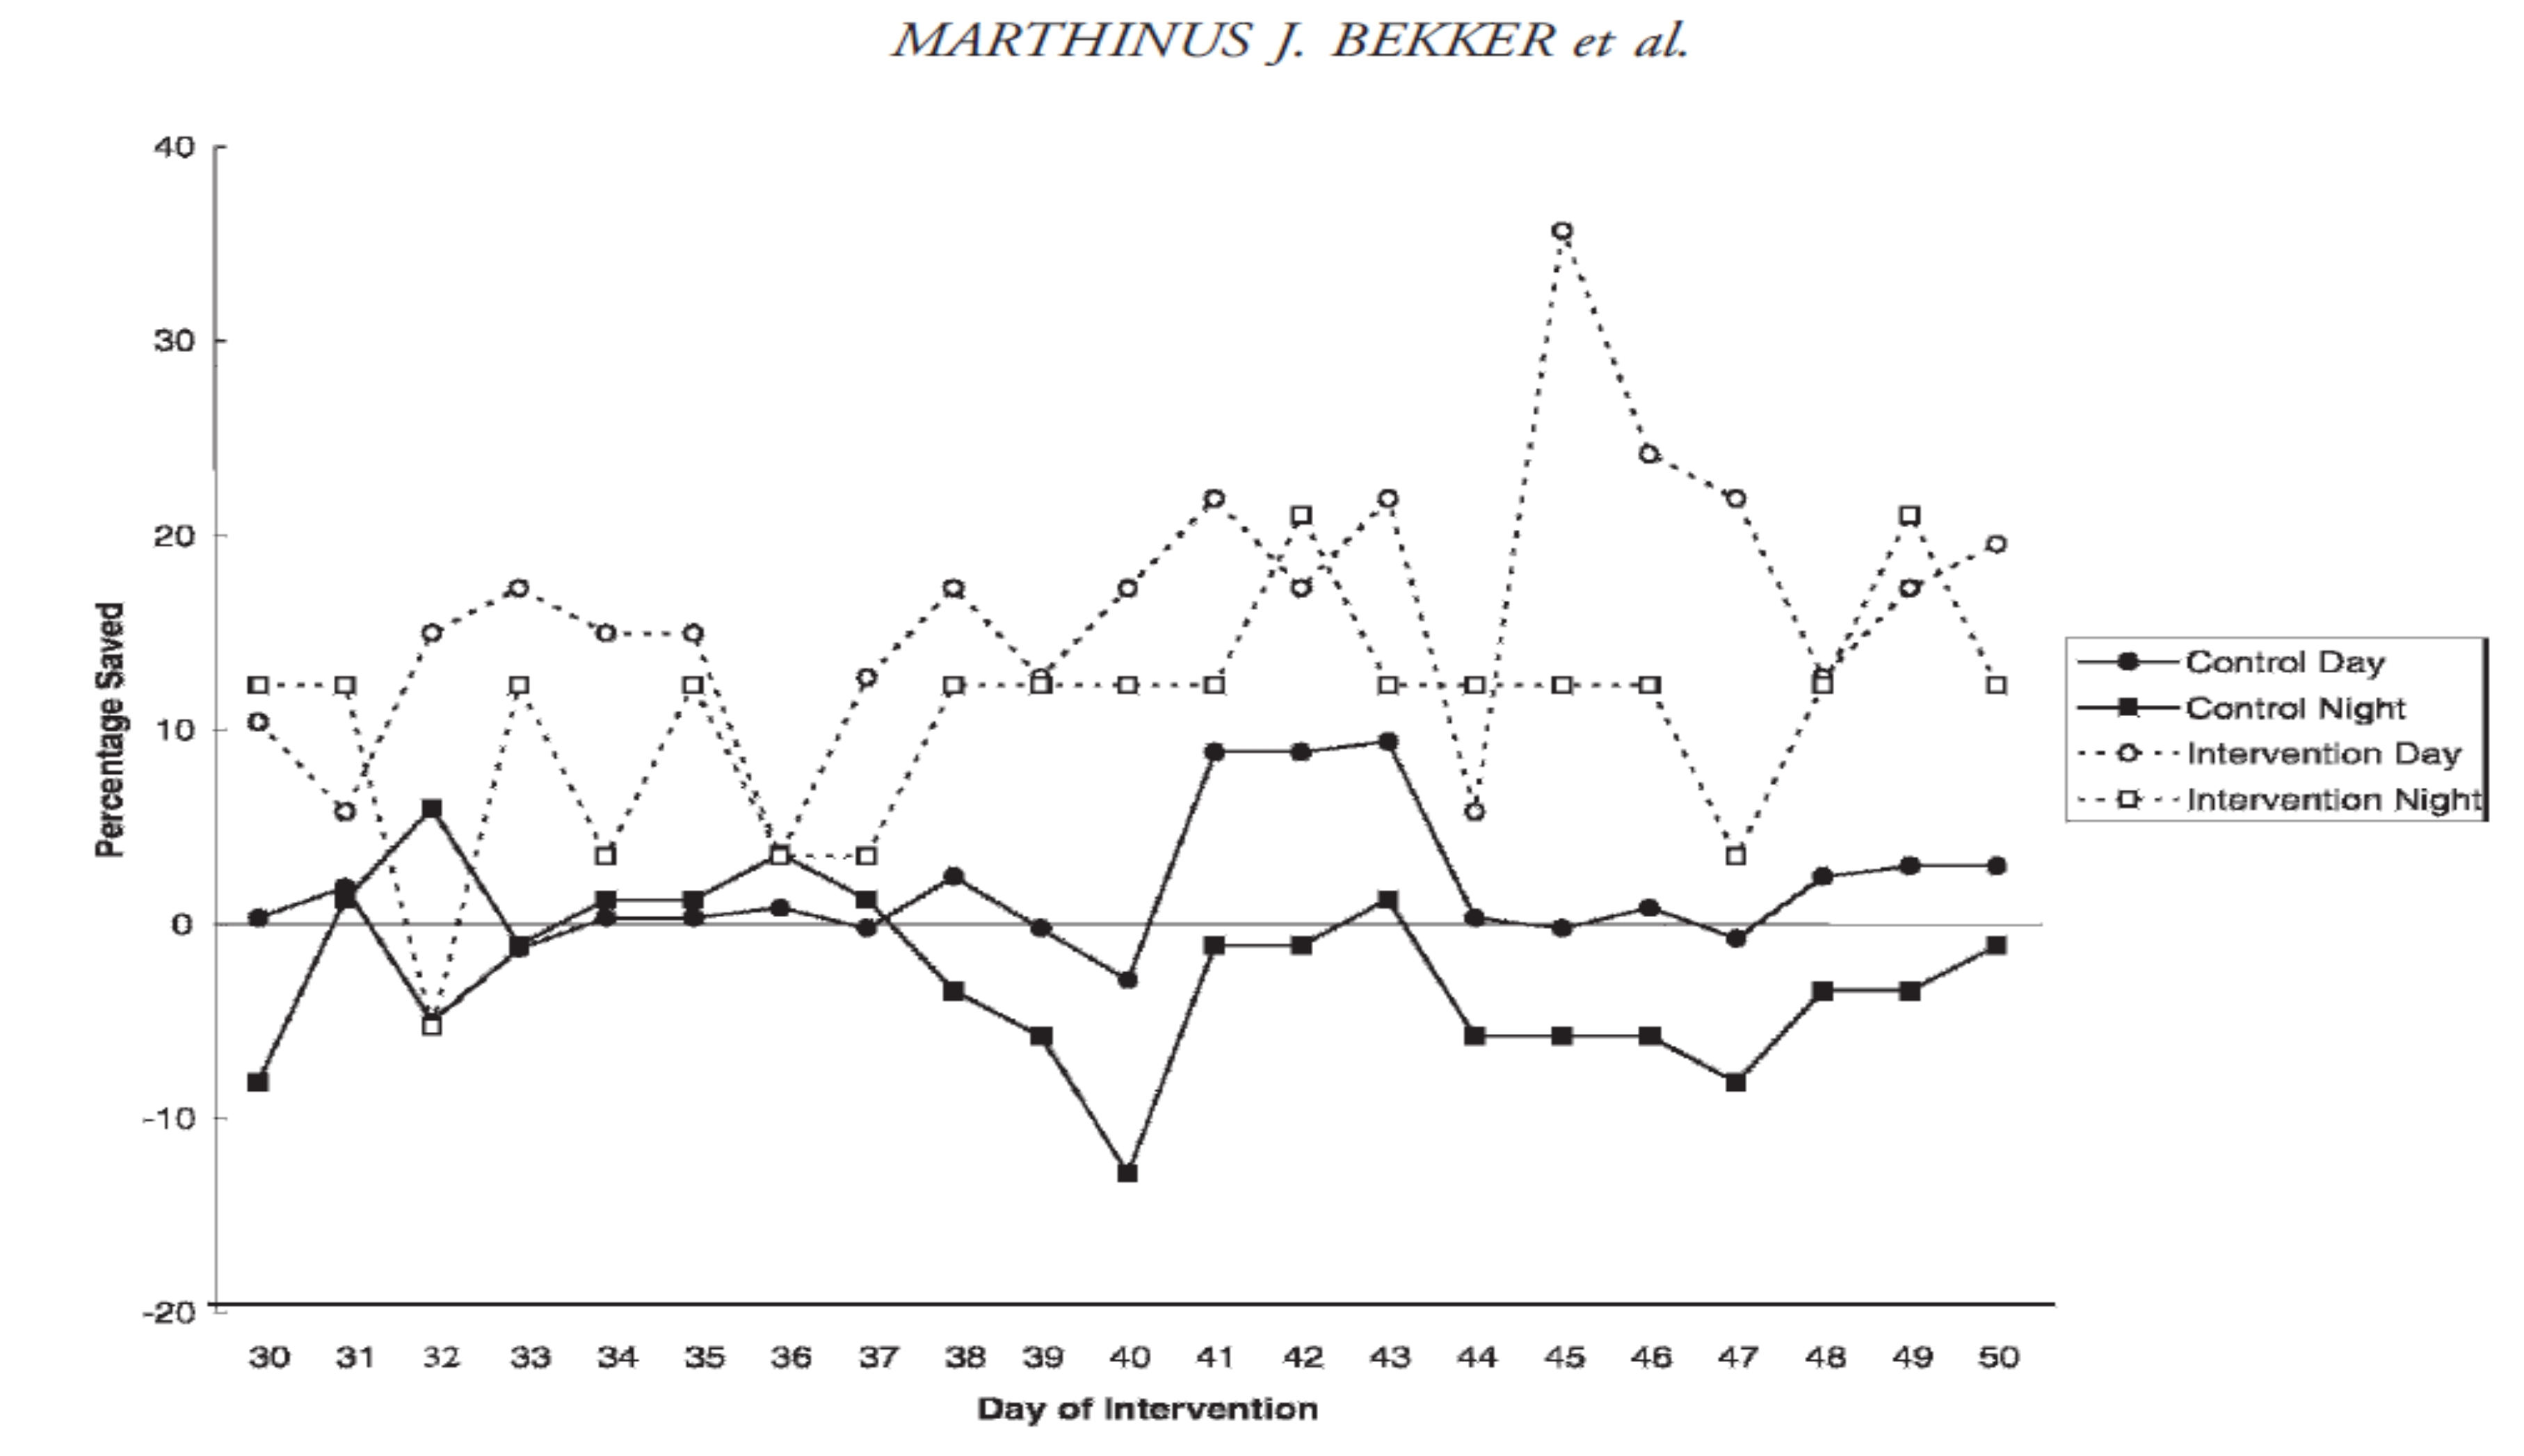
| Bekker M.J. et al. 2010 | Encouraging Electricity Savings in a University Residential Hall Through a Combination of Feedback, Visual Prompts, and Incentives | This experiment investigated the combined use of visual prompts, daily feedback, and rewards to reduce electricity consumption in a university residential hall. After a 17-day baseline period, | Energy usage decreased in the intervention hall, but energy usage did not change appreciably in the control hall. The resulting daytime and nighttime energy usage decreased in the intervention hall, but energy usage did not change appreciably in the control hall. The resulting, daytime and nighttime savings were 16.2% and 10%, respectively compared to savings of 3.8 % ( day) and 6.5% (night) in the control hall. | Incentive motivated |
| Manual meter readings an issue with accuracy. | ||||
| New Zealand [10] | ||||
| Lack of continuity and sustainability. | ||||
| Target Group: Students | ||||
| The experimental intervention was introduced in the intervention hall, and no change was made in the control halls | ||||
| Marans R.W. et al. 2009 | The human dimension of energy conservation and sustainability A case study of the University of Michigan’s energy conservation program | A multi-method approach is used in five diverse pilot buildings including focus groups, behavioral observations, environmental measures, and web surveys. The analyses consider differences between buildings and between the three population groups. | Among the findings, University of Michigan (UM) staff is most concerned about conserving energy in UM buildings while students are the least concerned. A significant proportion of survey respondents are not aware of past university efforts to conserve energy; among those who are aware, many feel that university efforts are inadequate. | Non real-time feedback. |
| USA [12] | Multiple focuses. | |||
| Target Group: Staff and Students |
2.1. Analyzing the Common Lessons Learnt from the above Past Studies

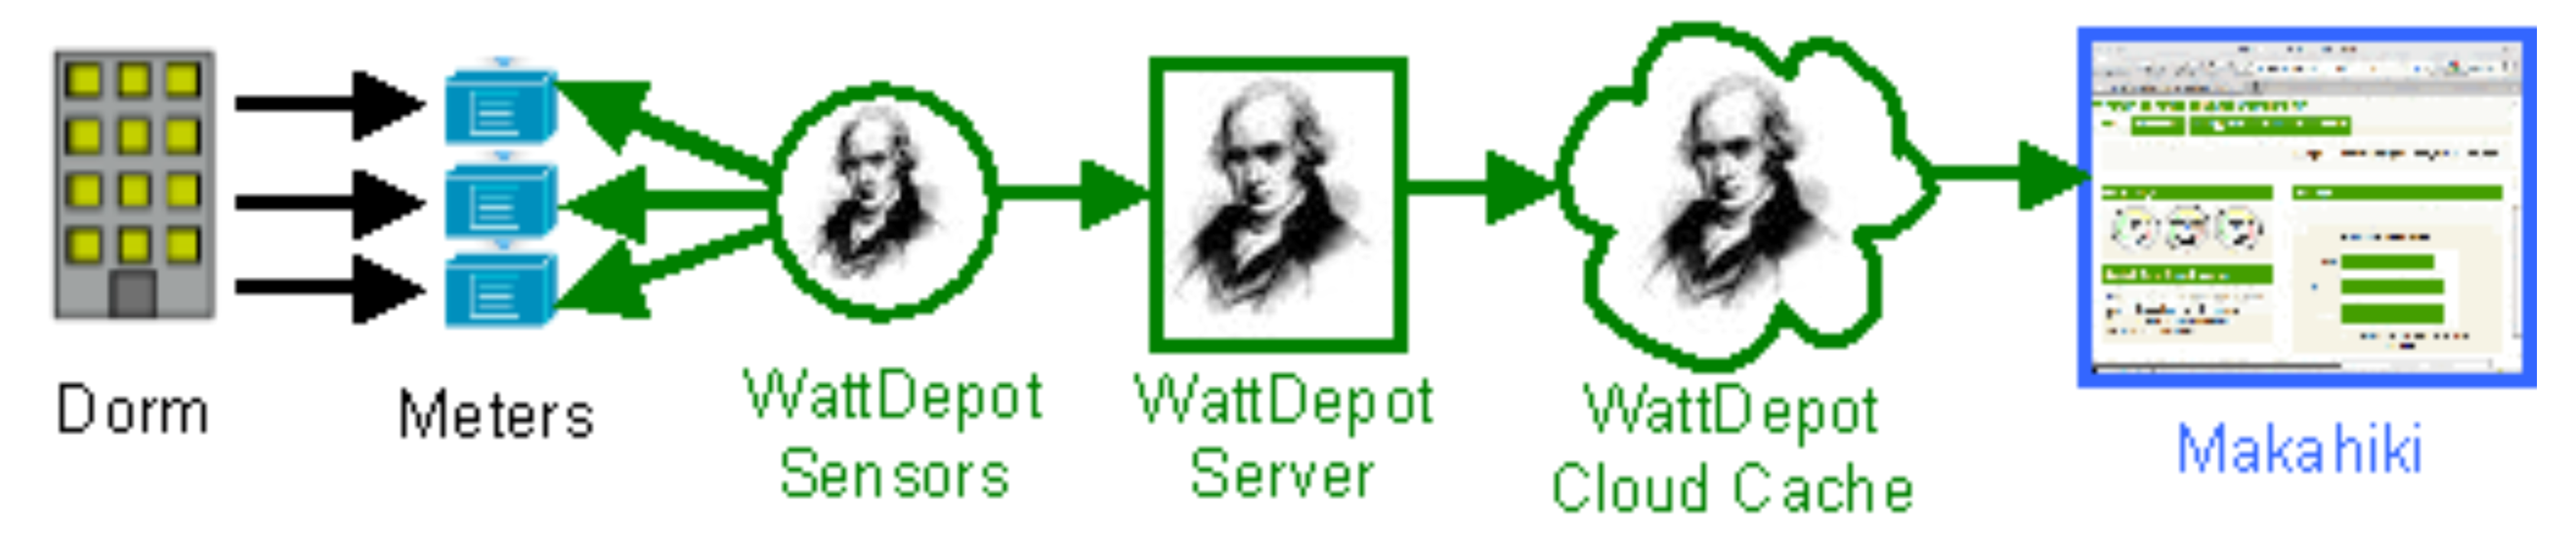

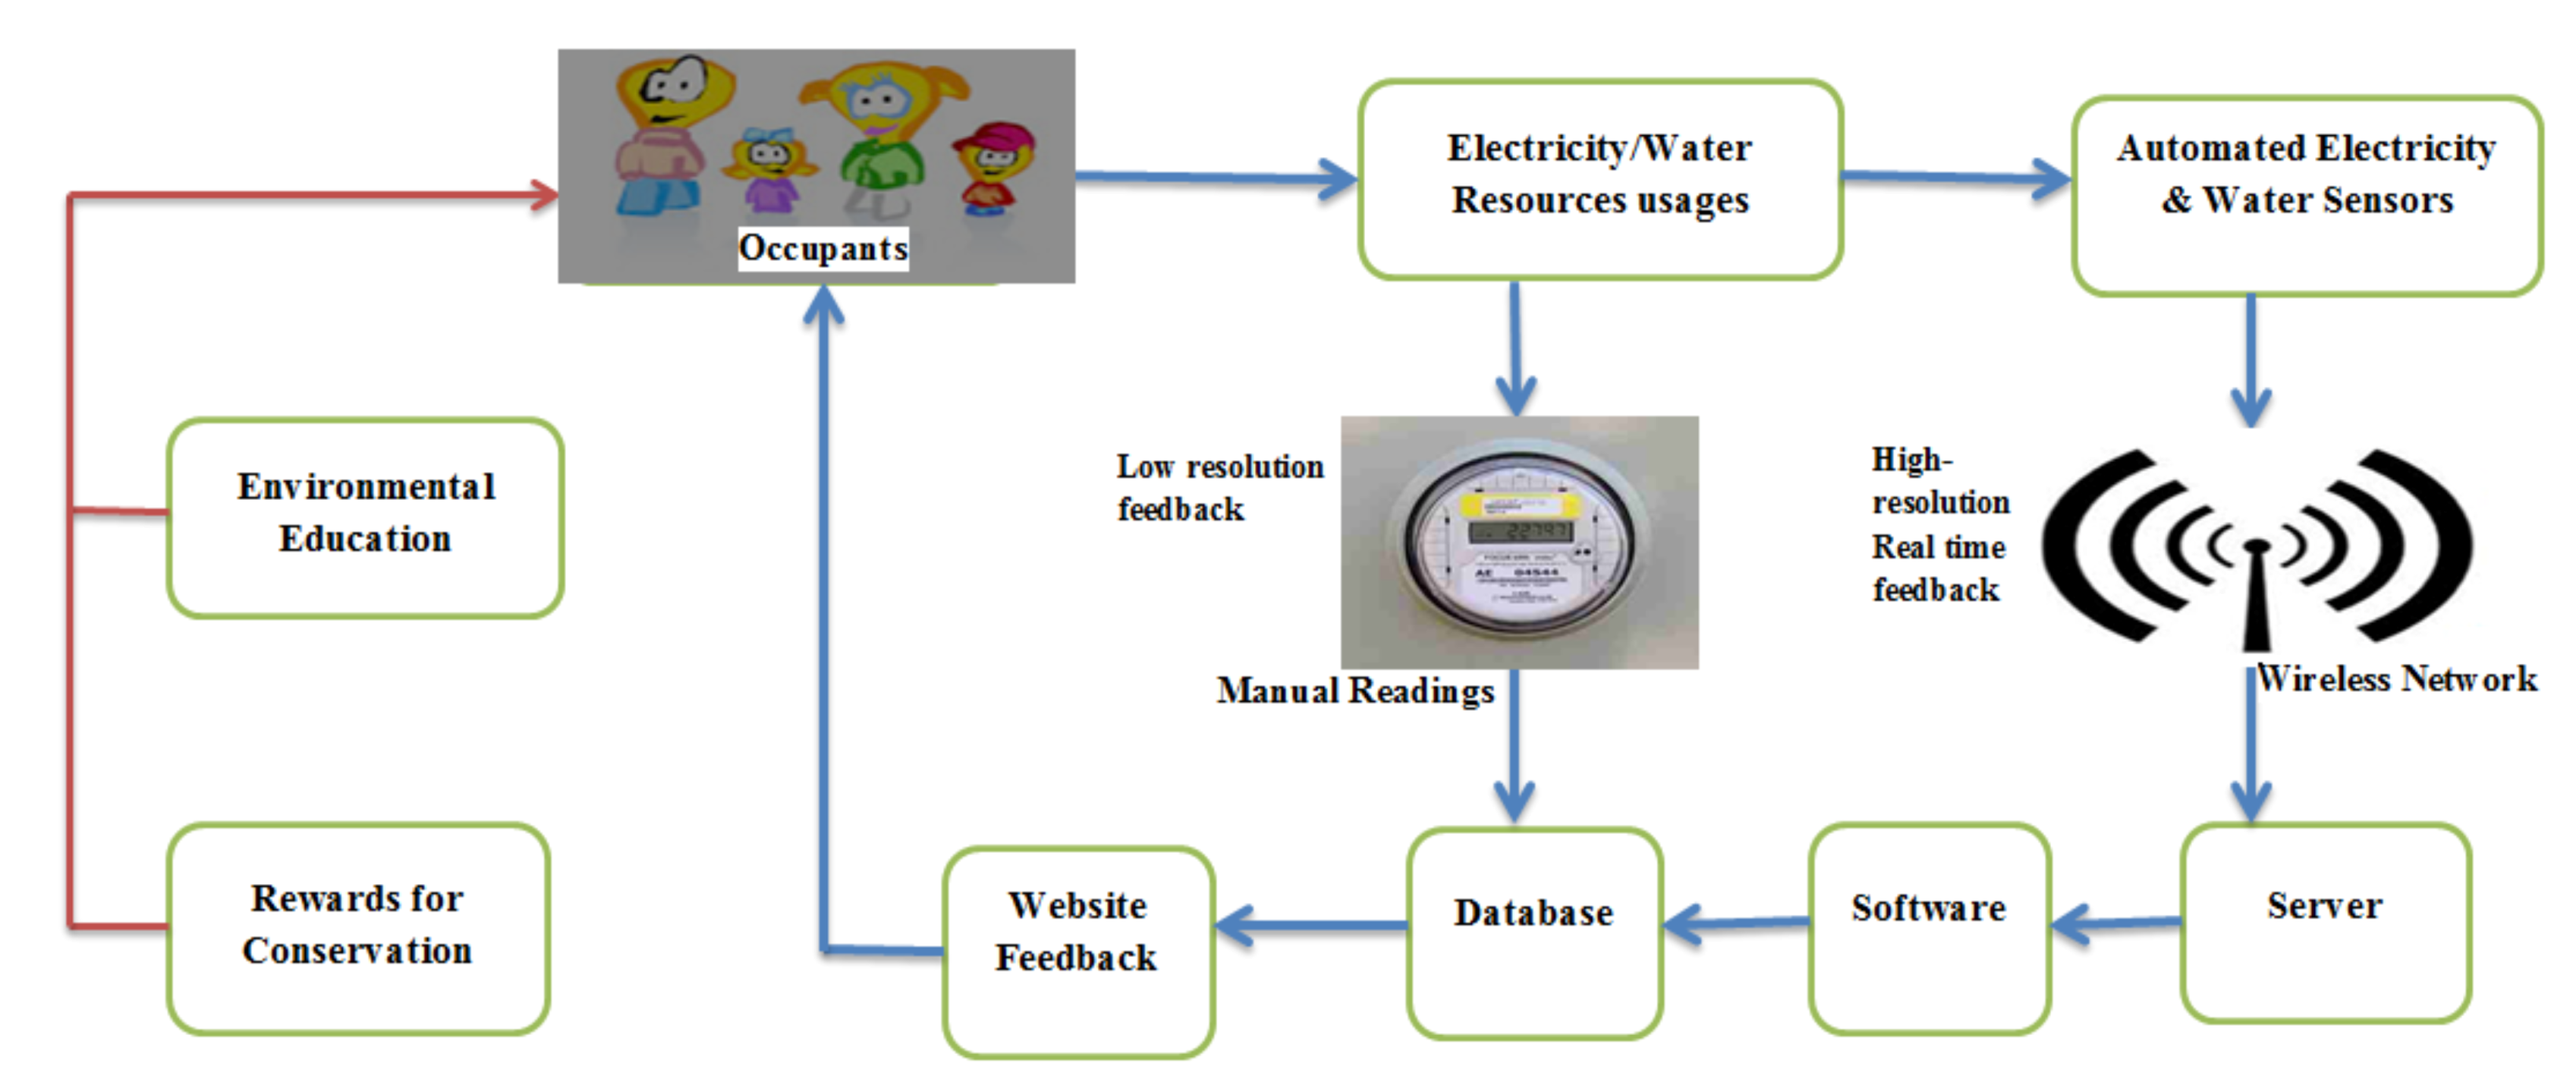
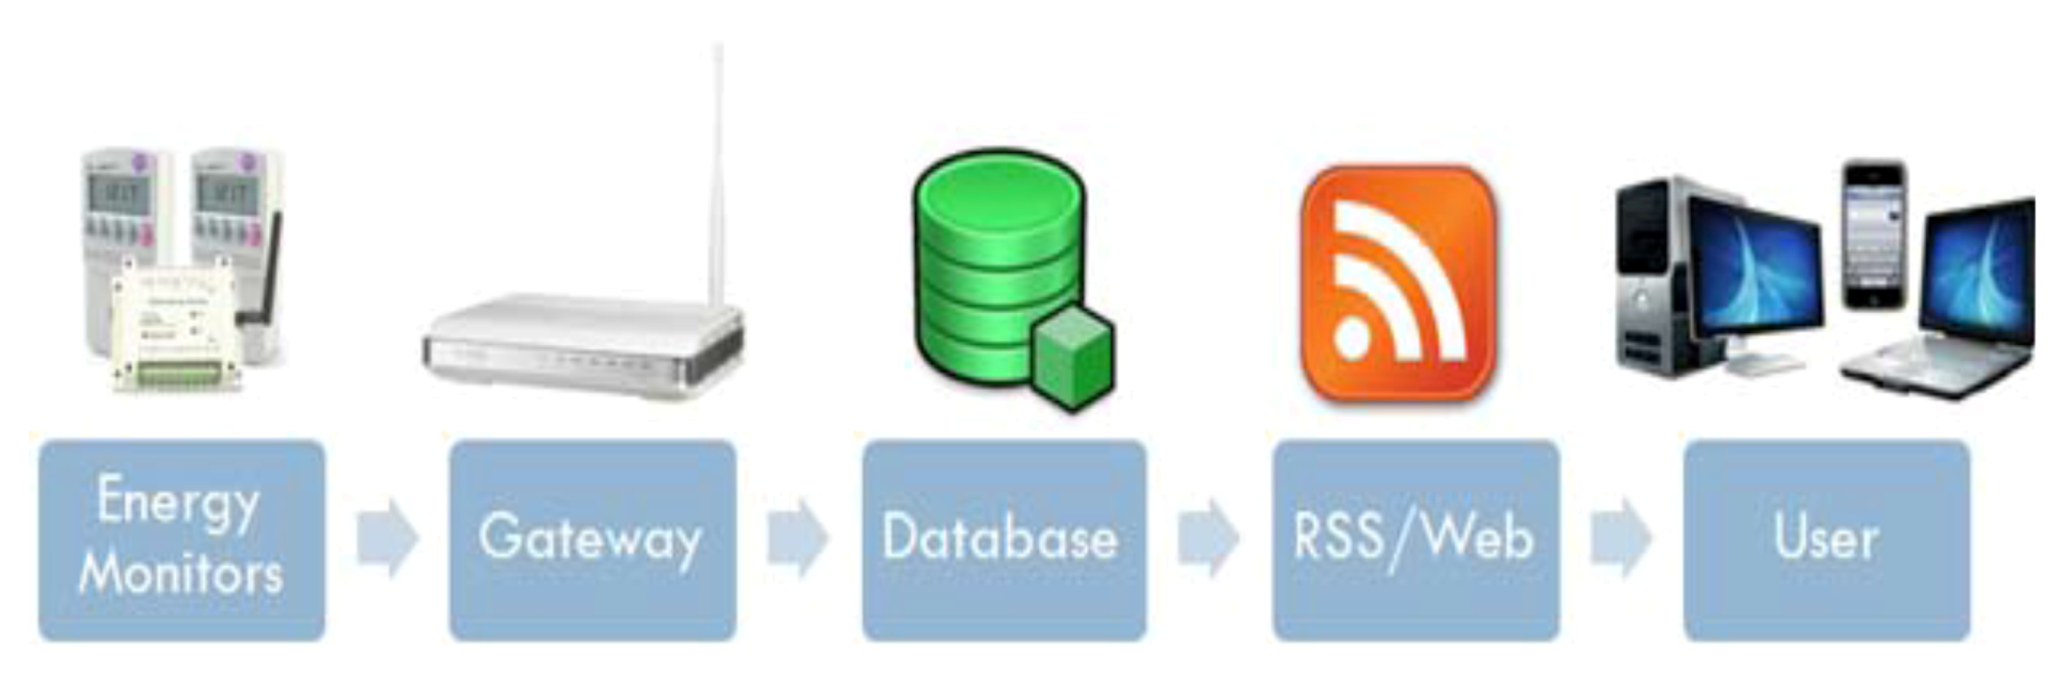
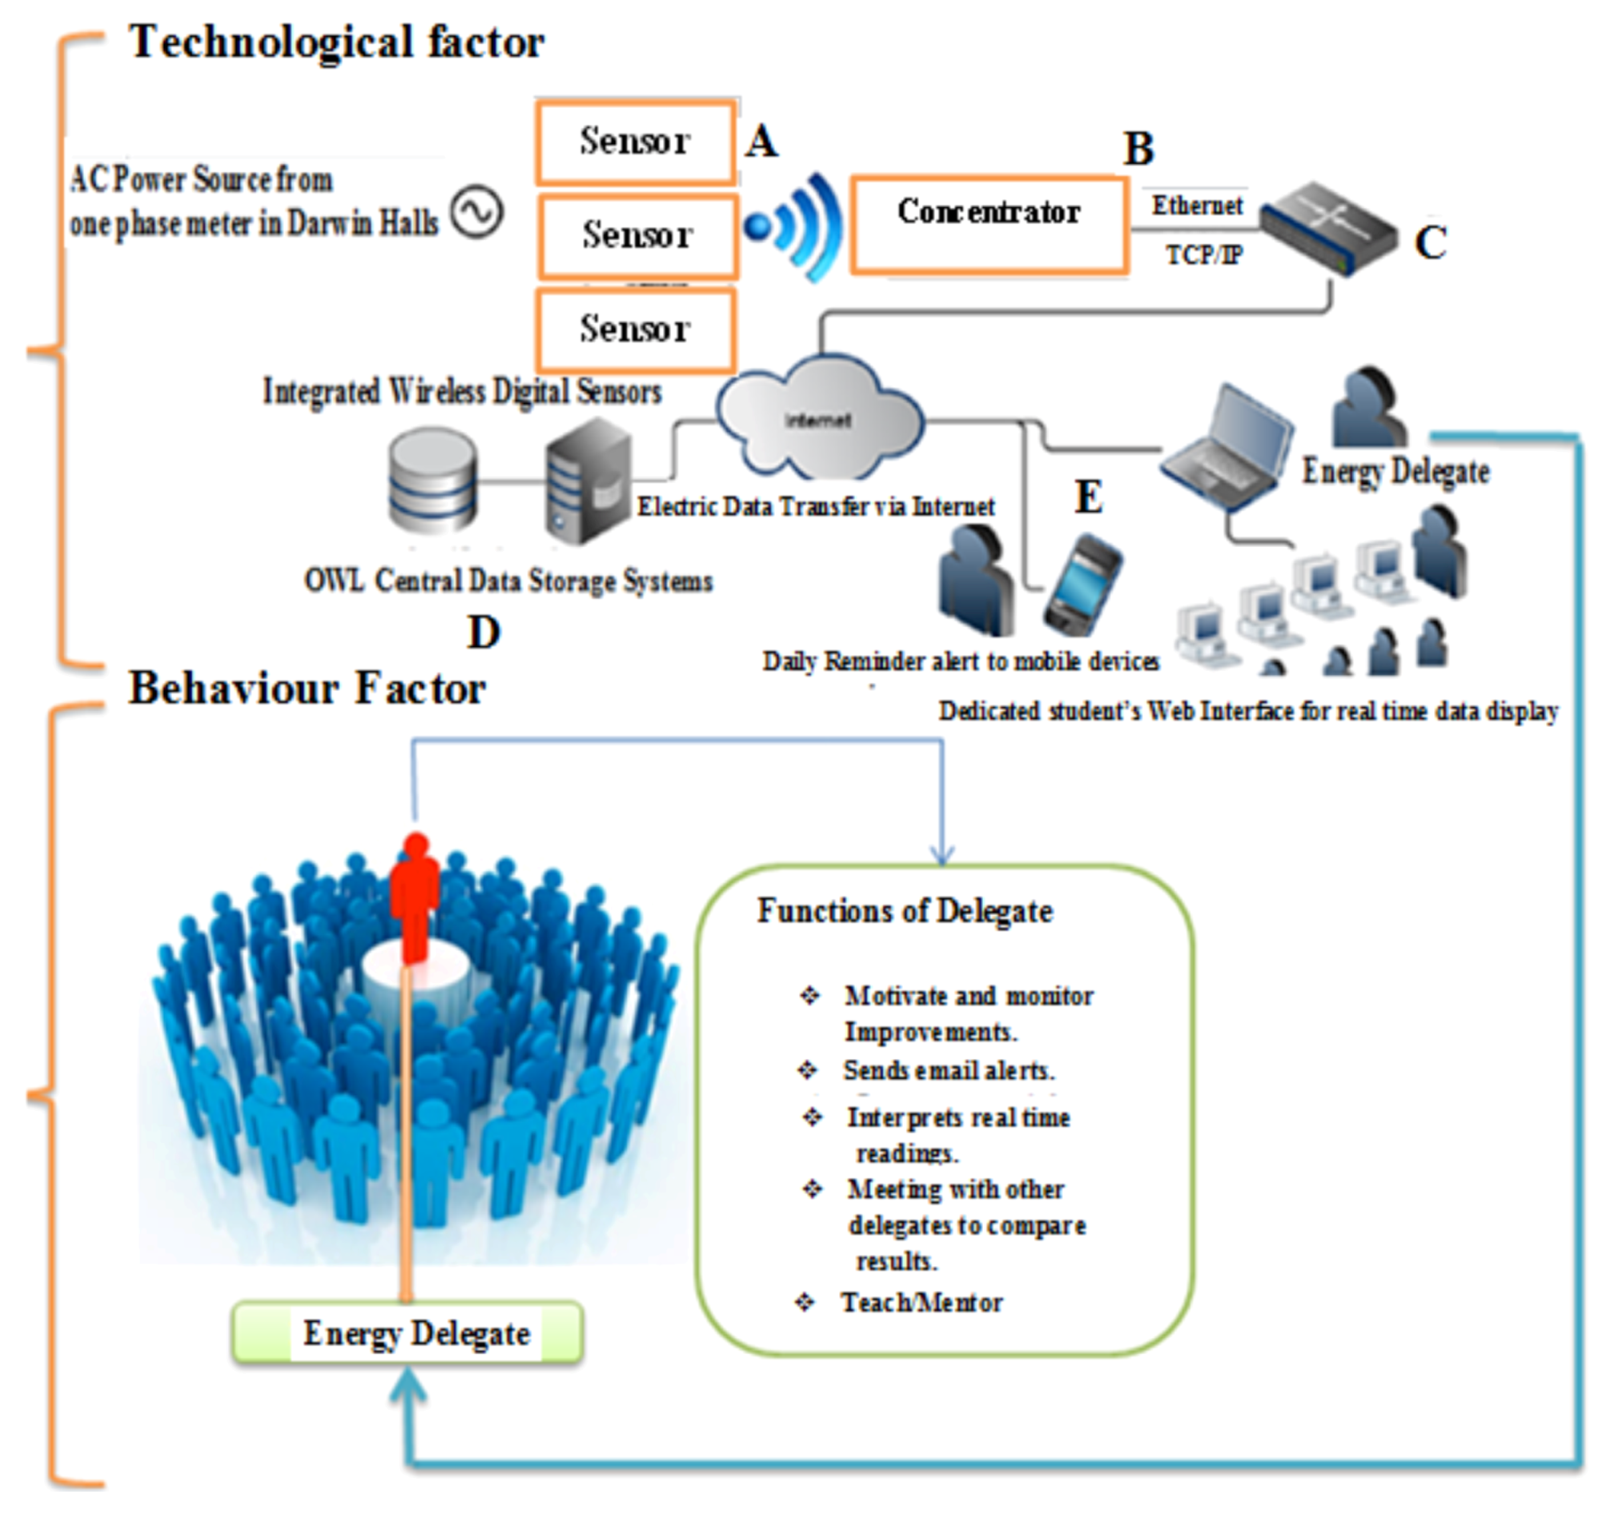
3. Proposed System Architecture

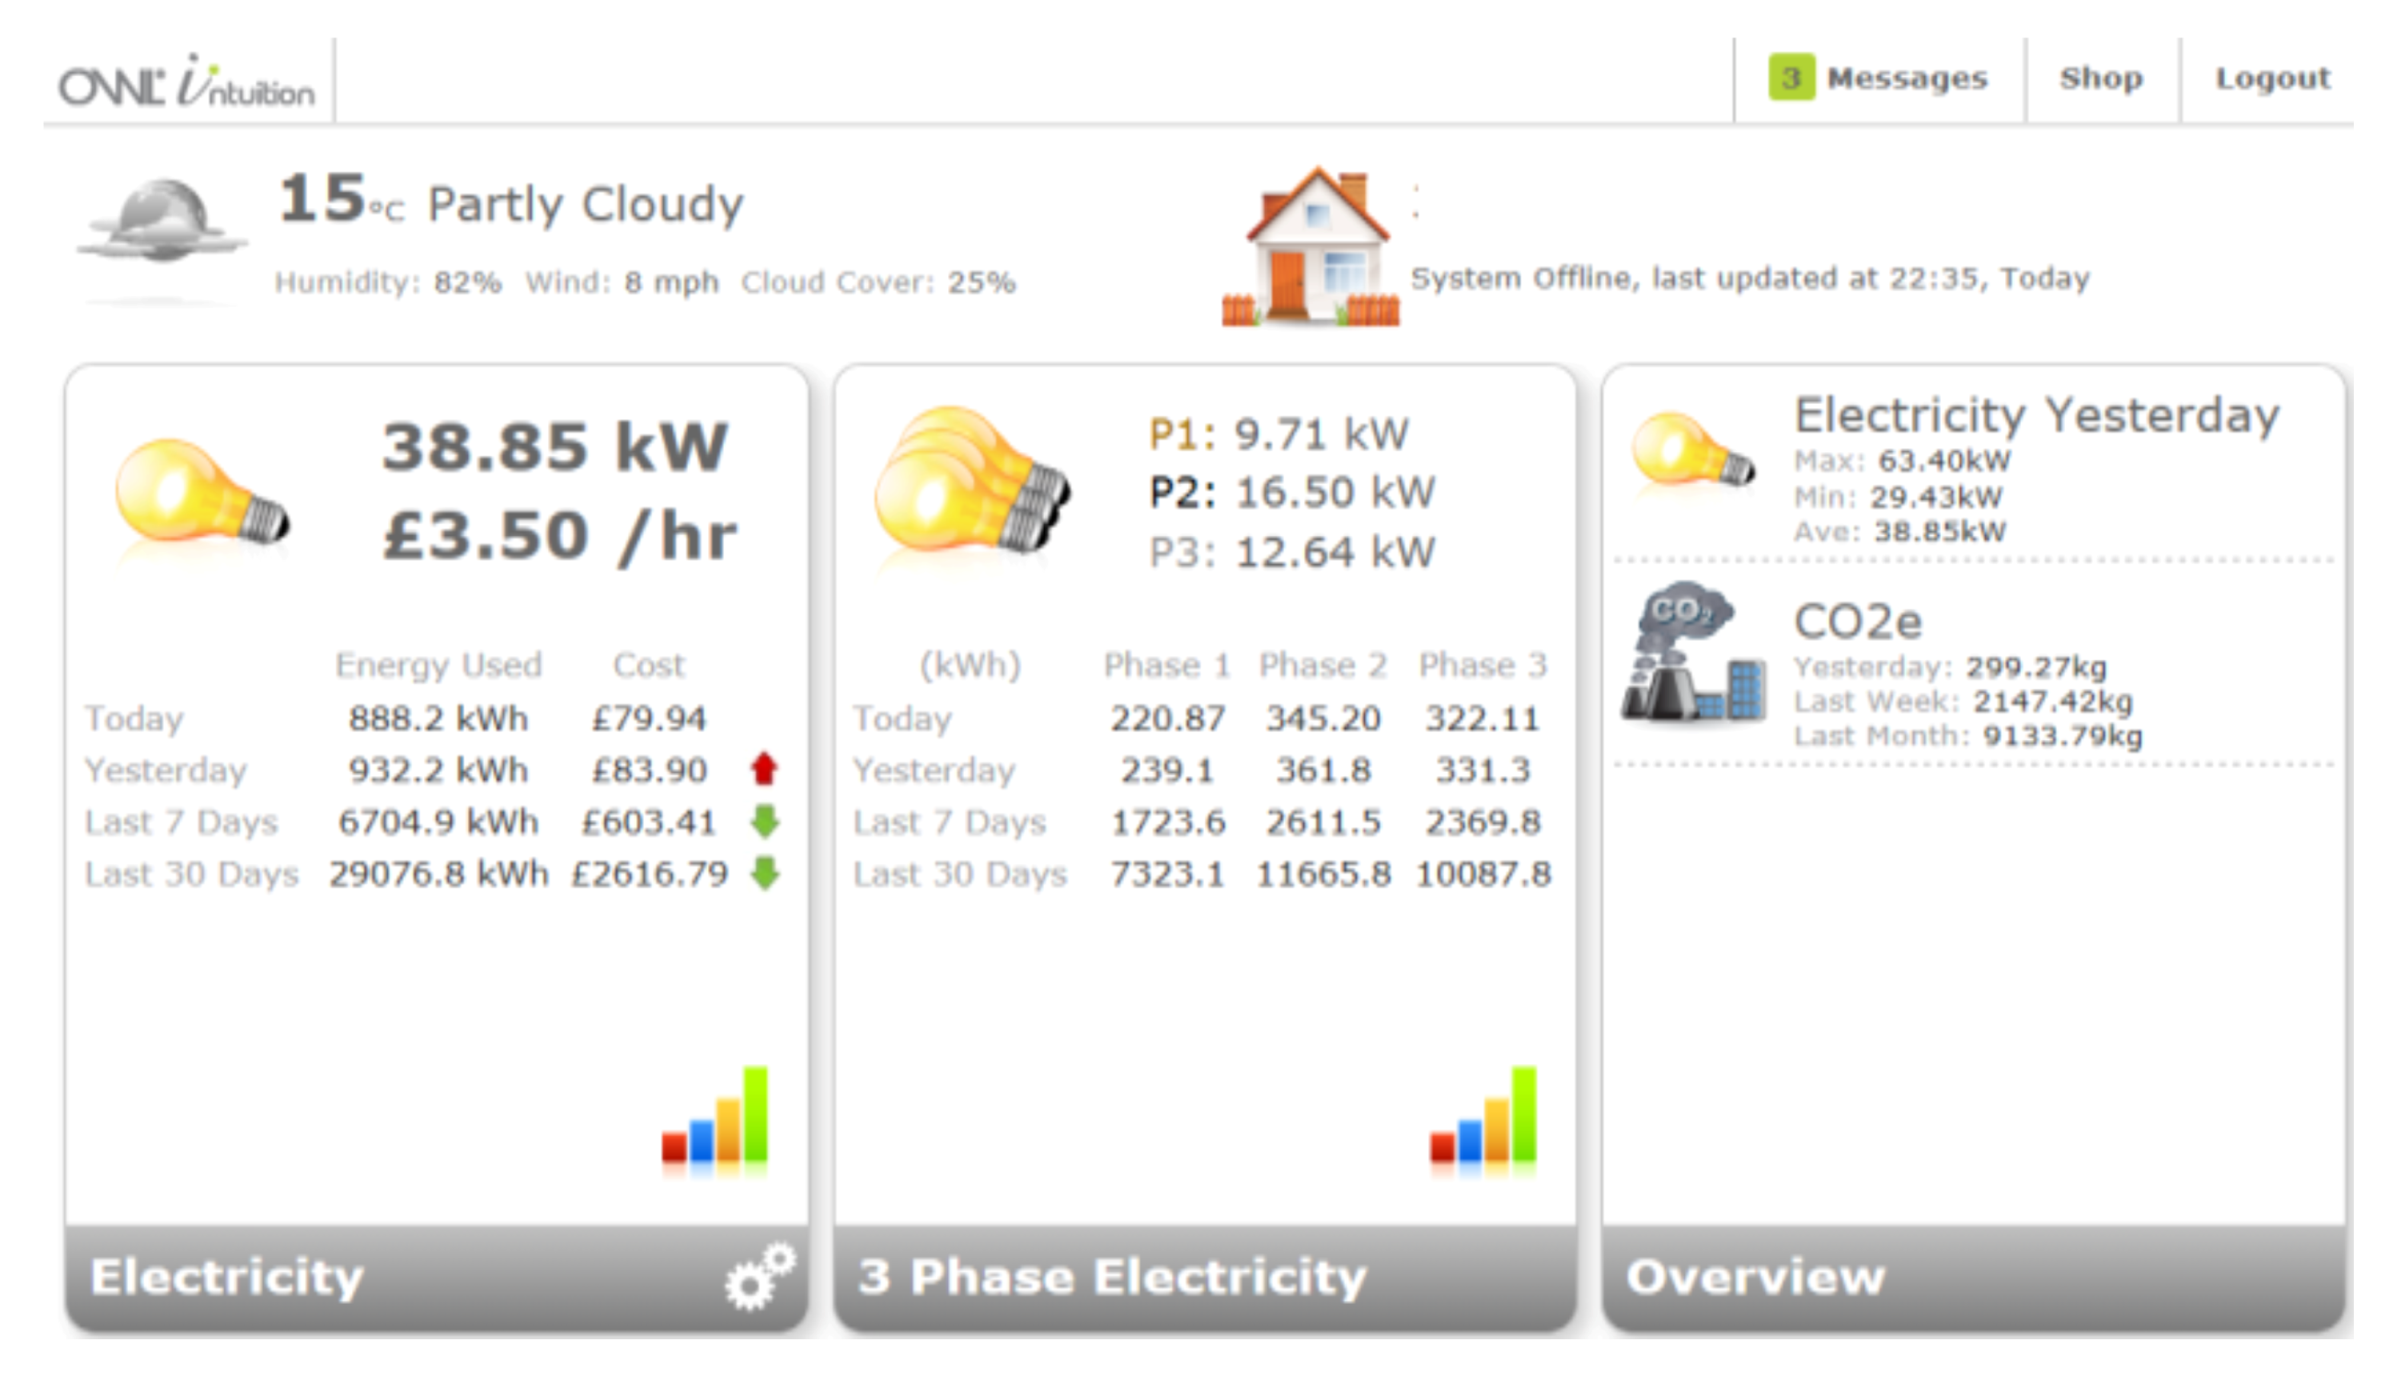
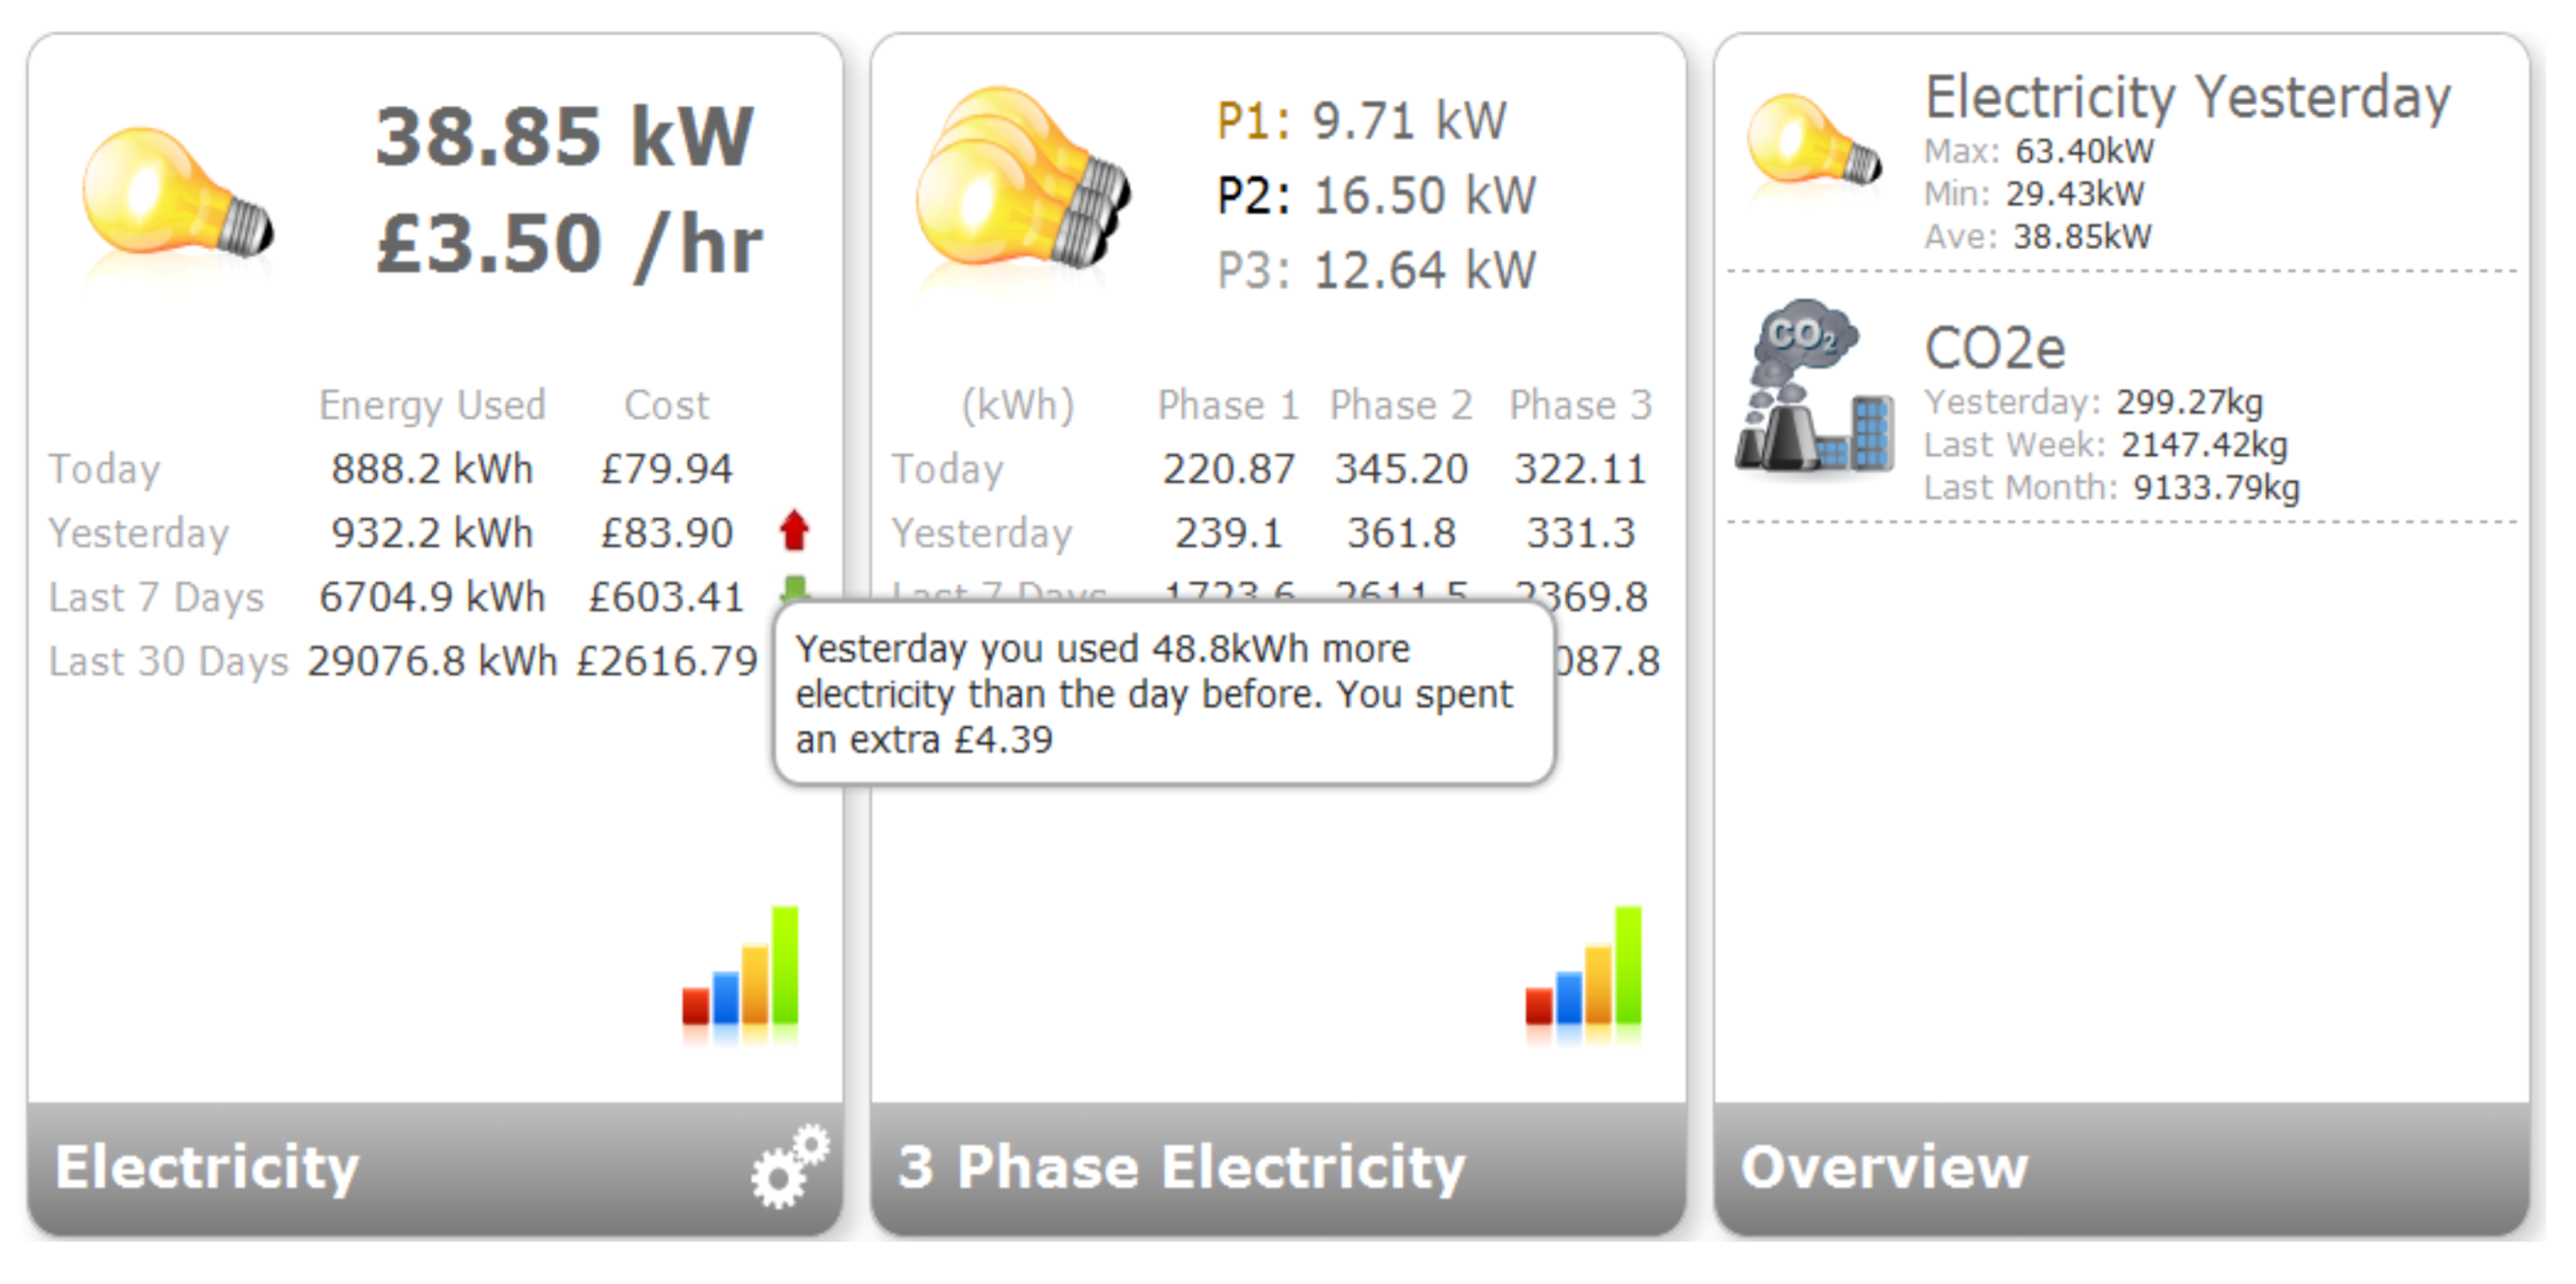
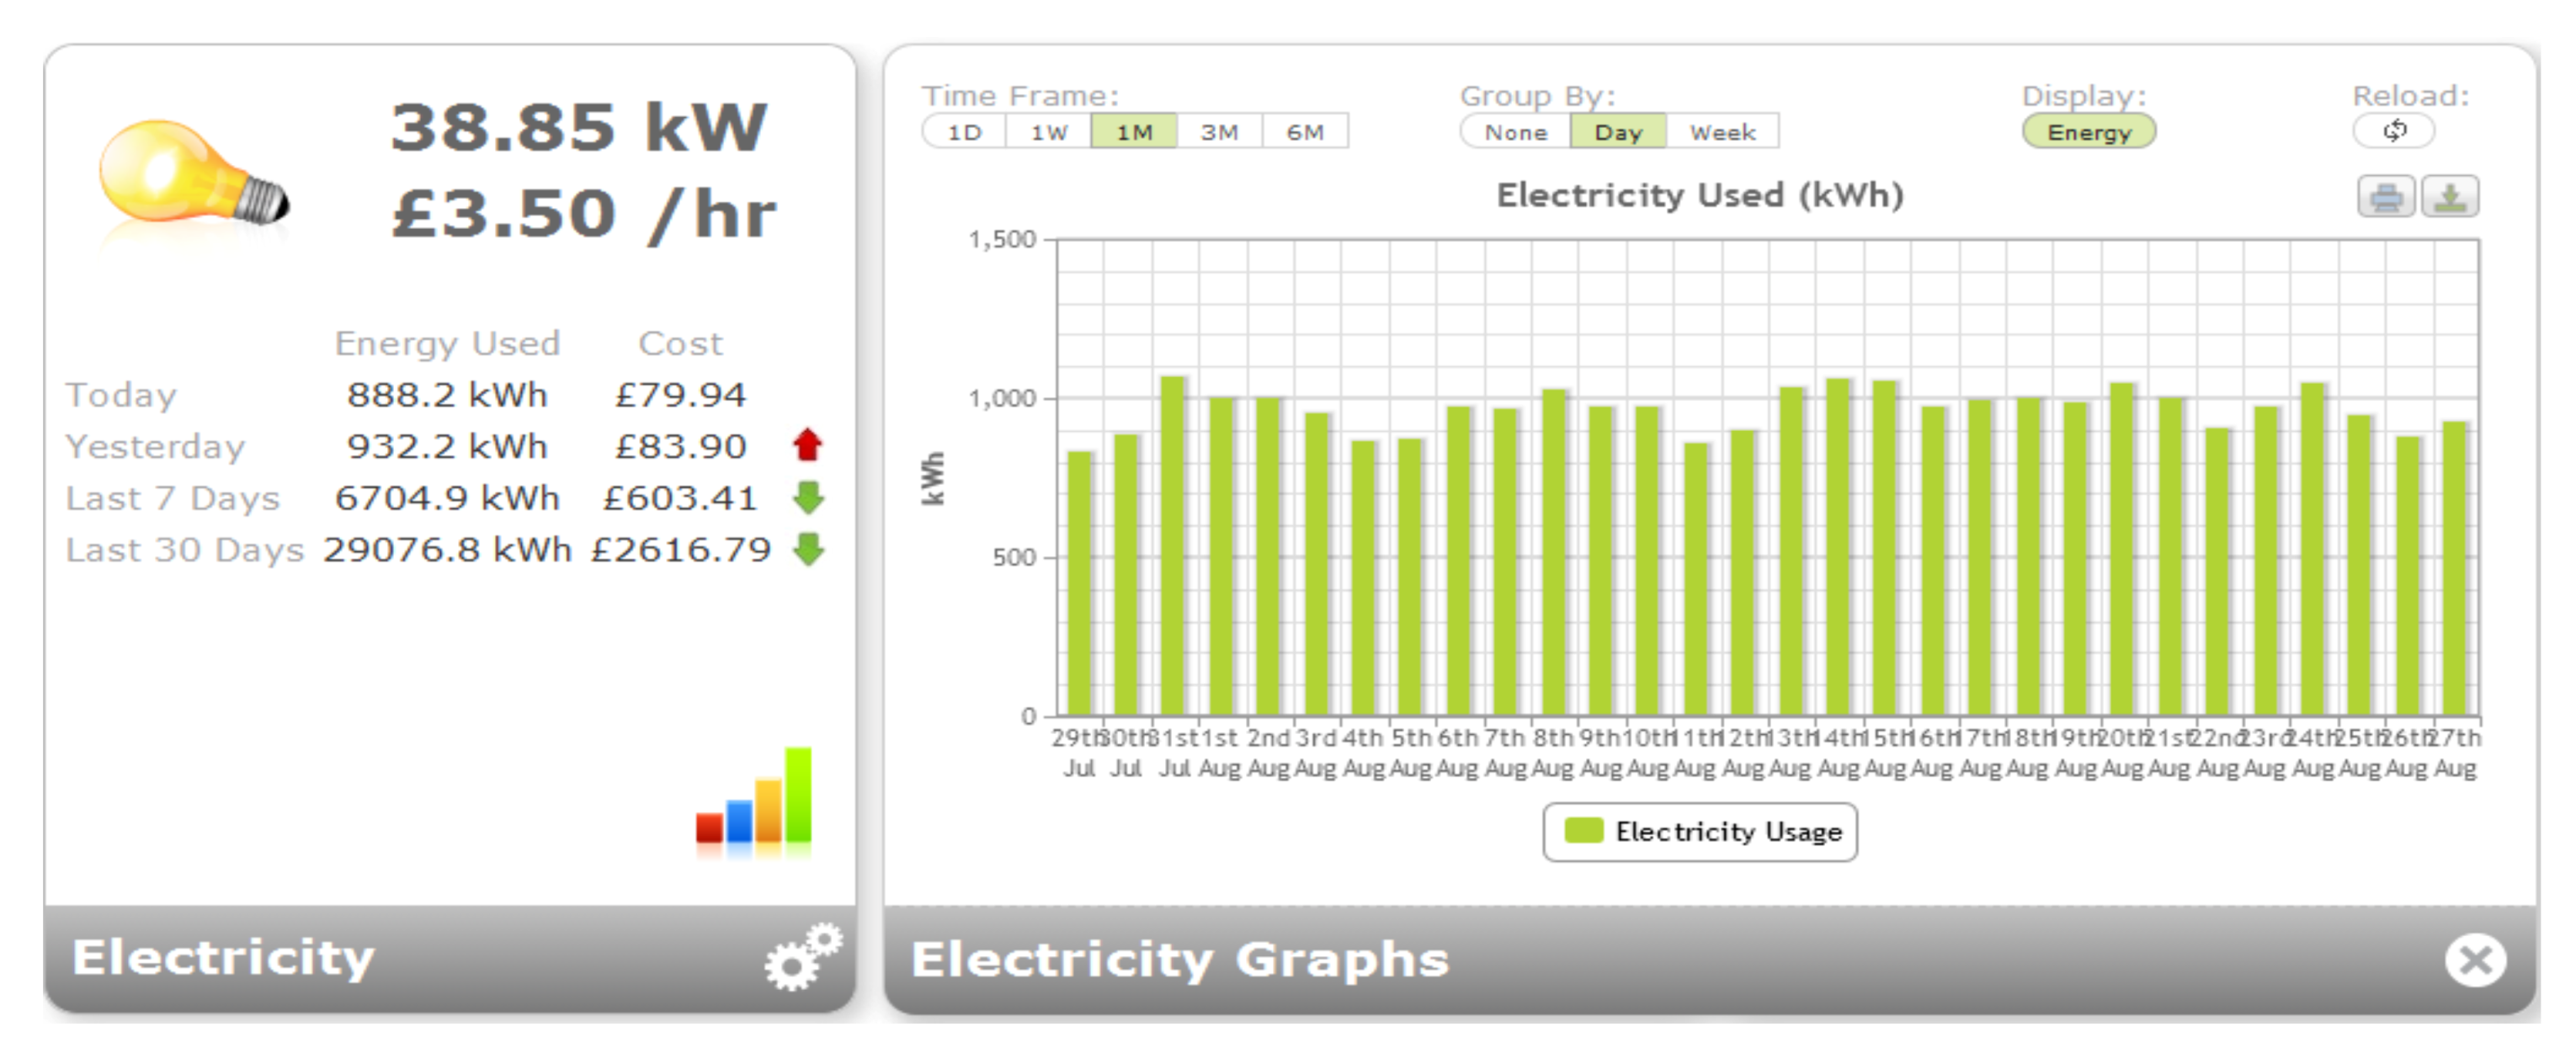
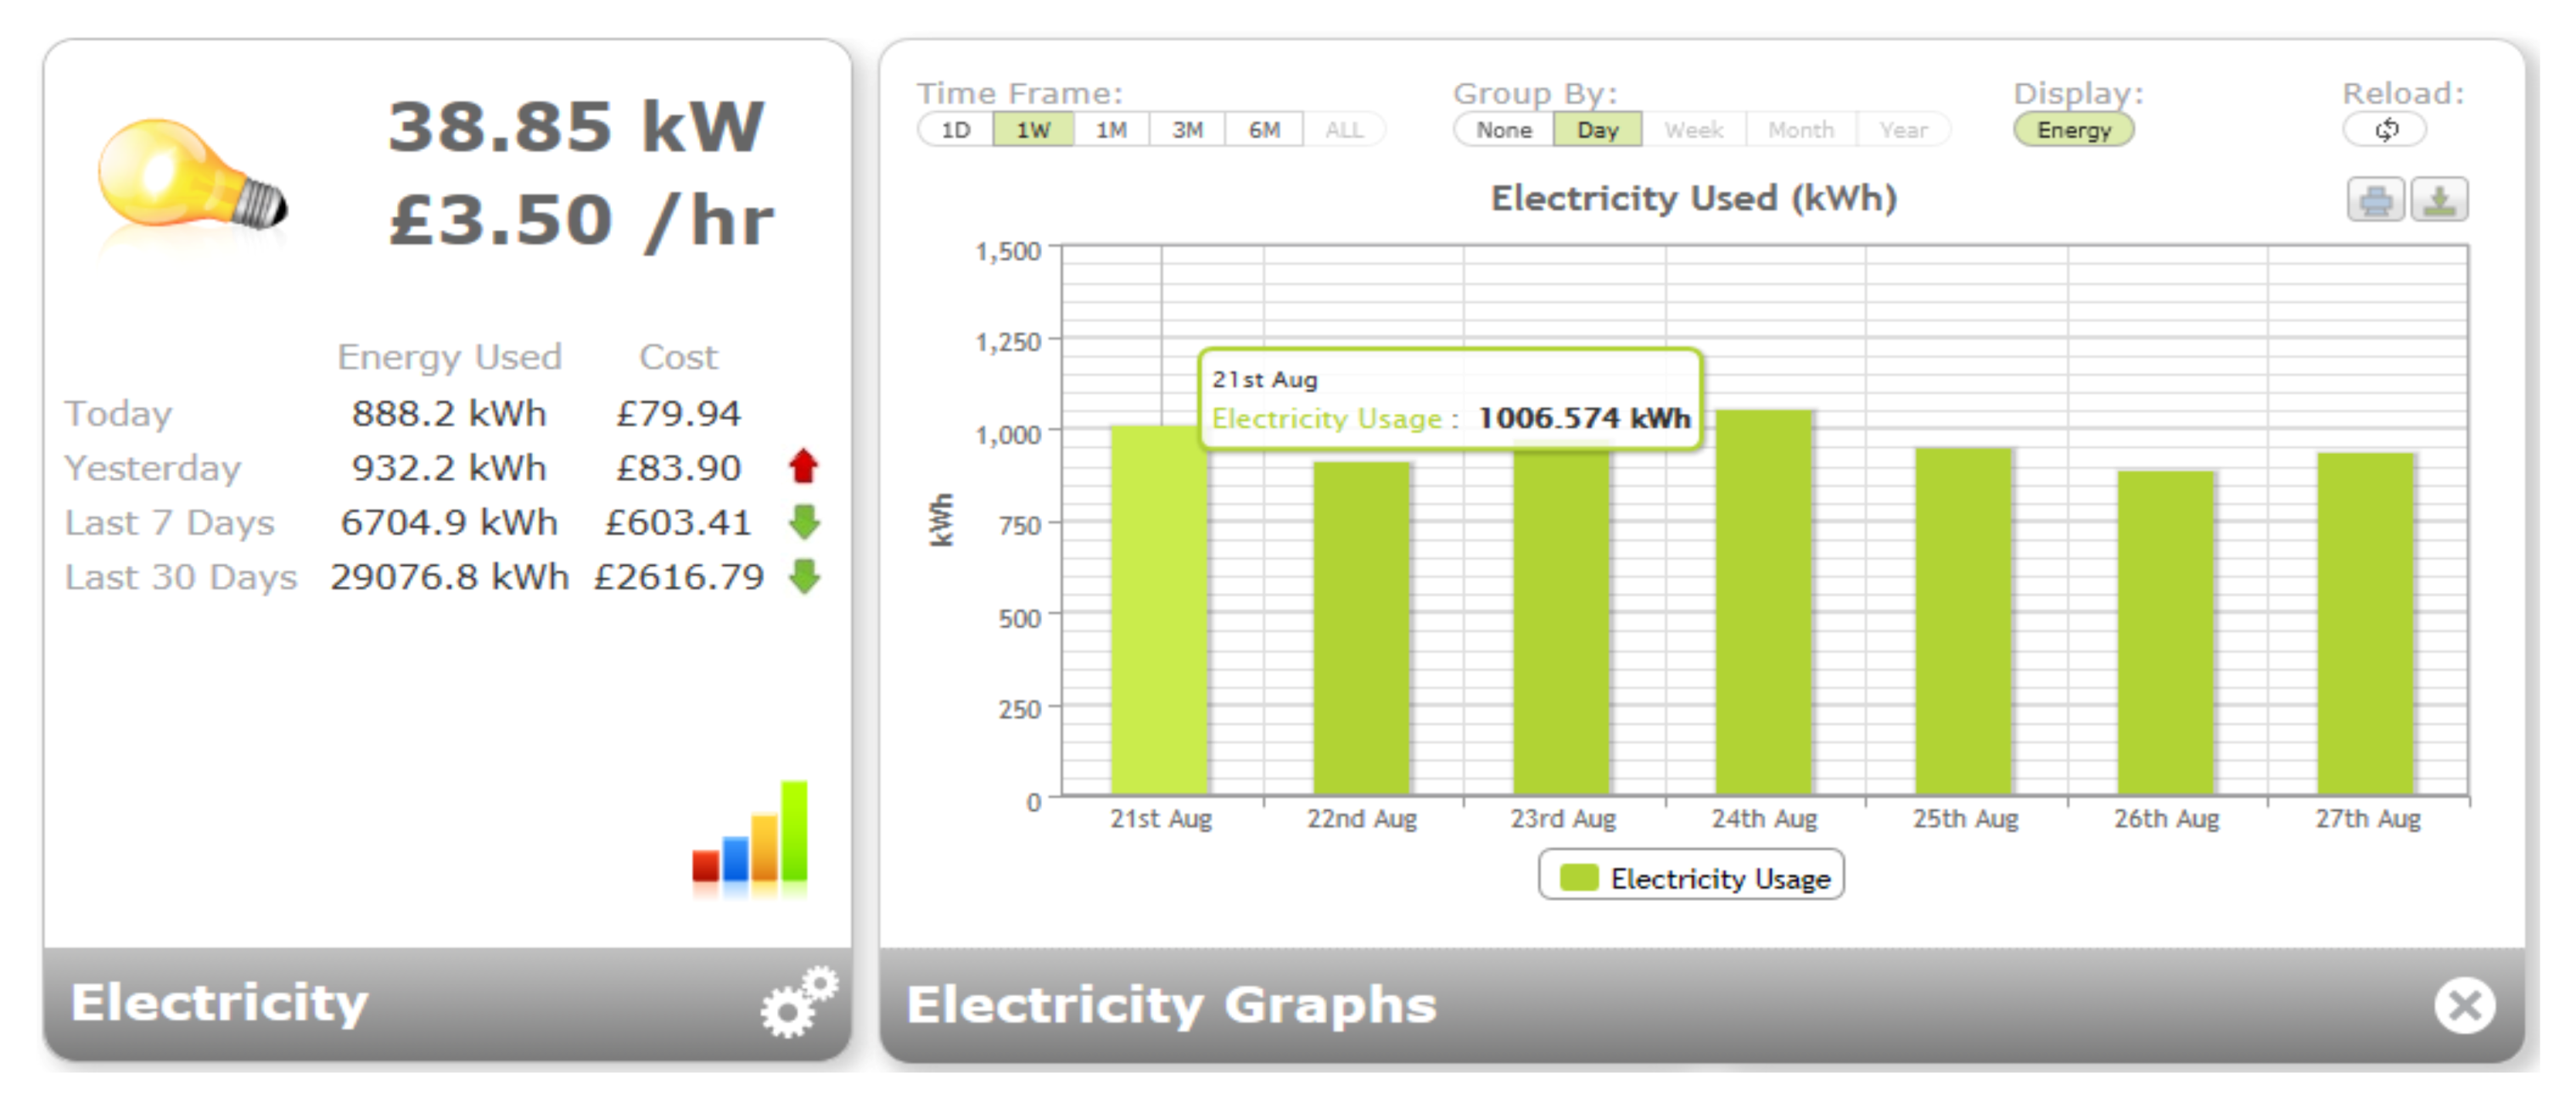
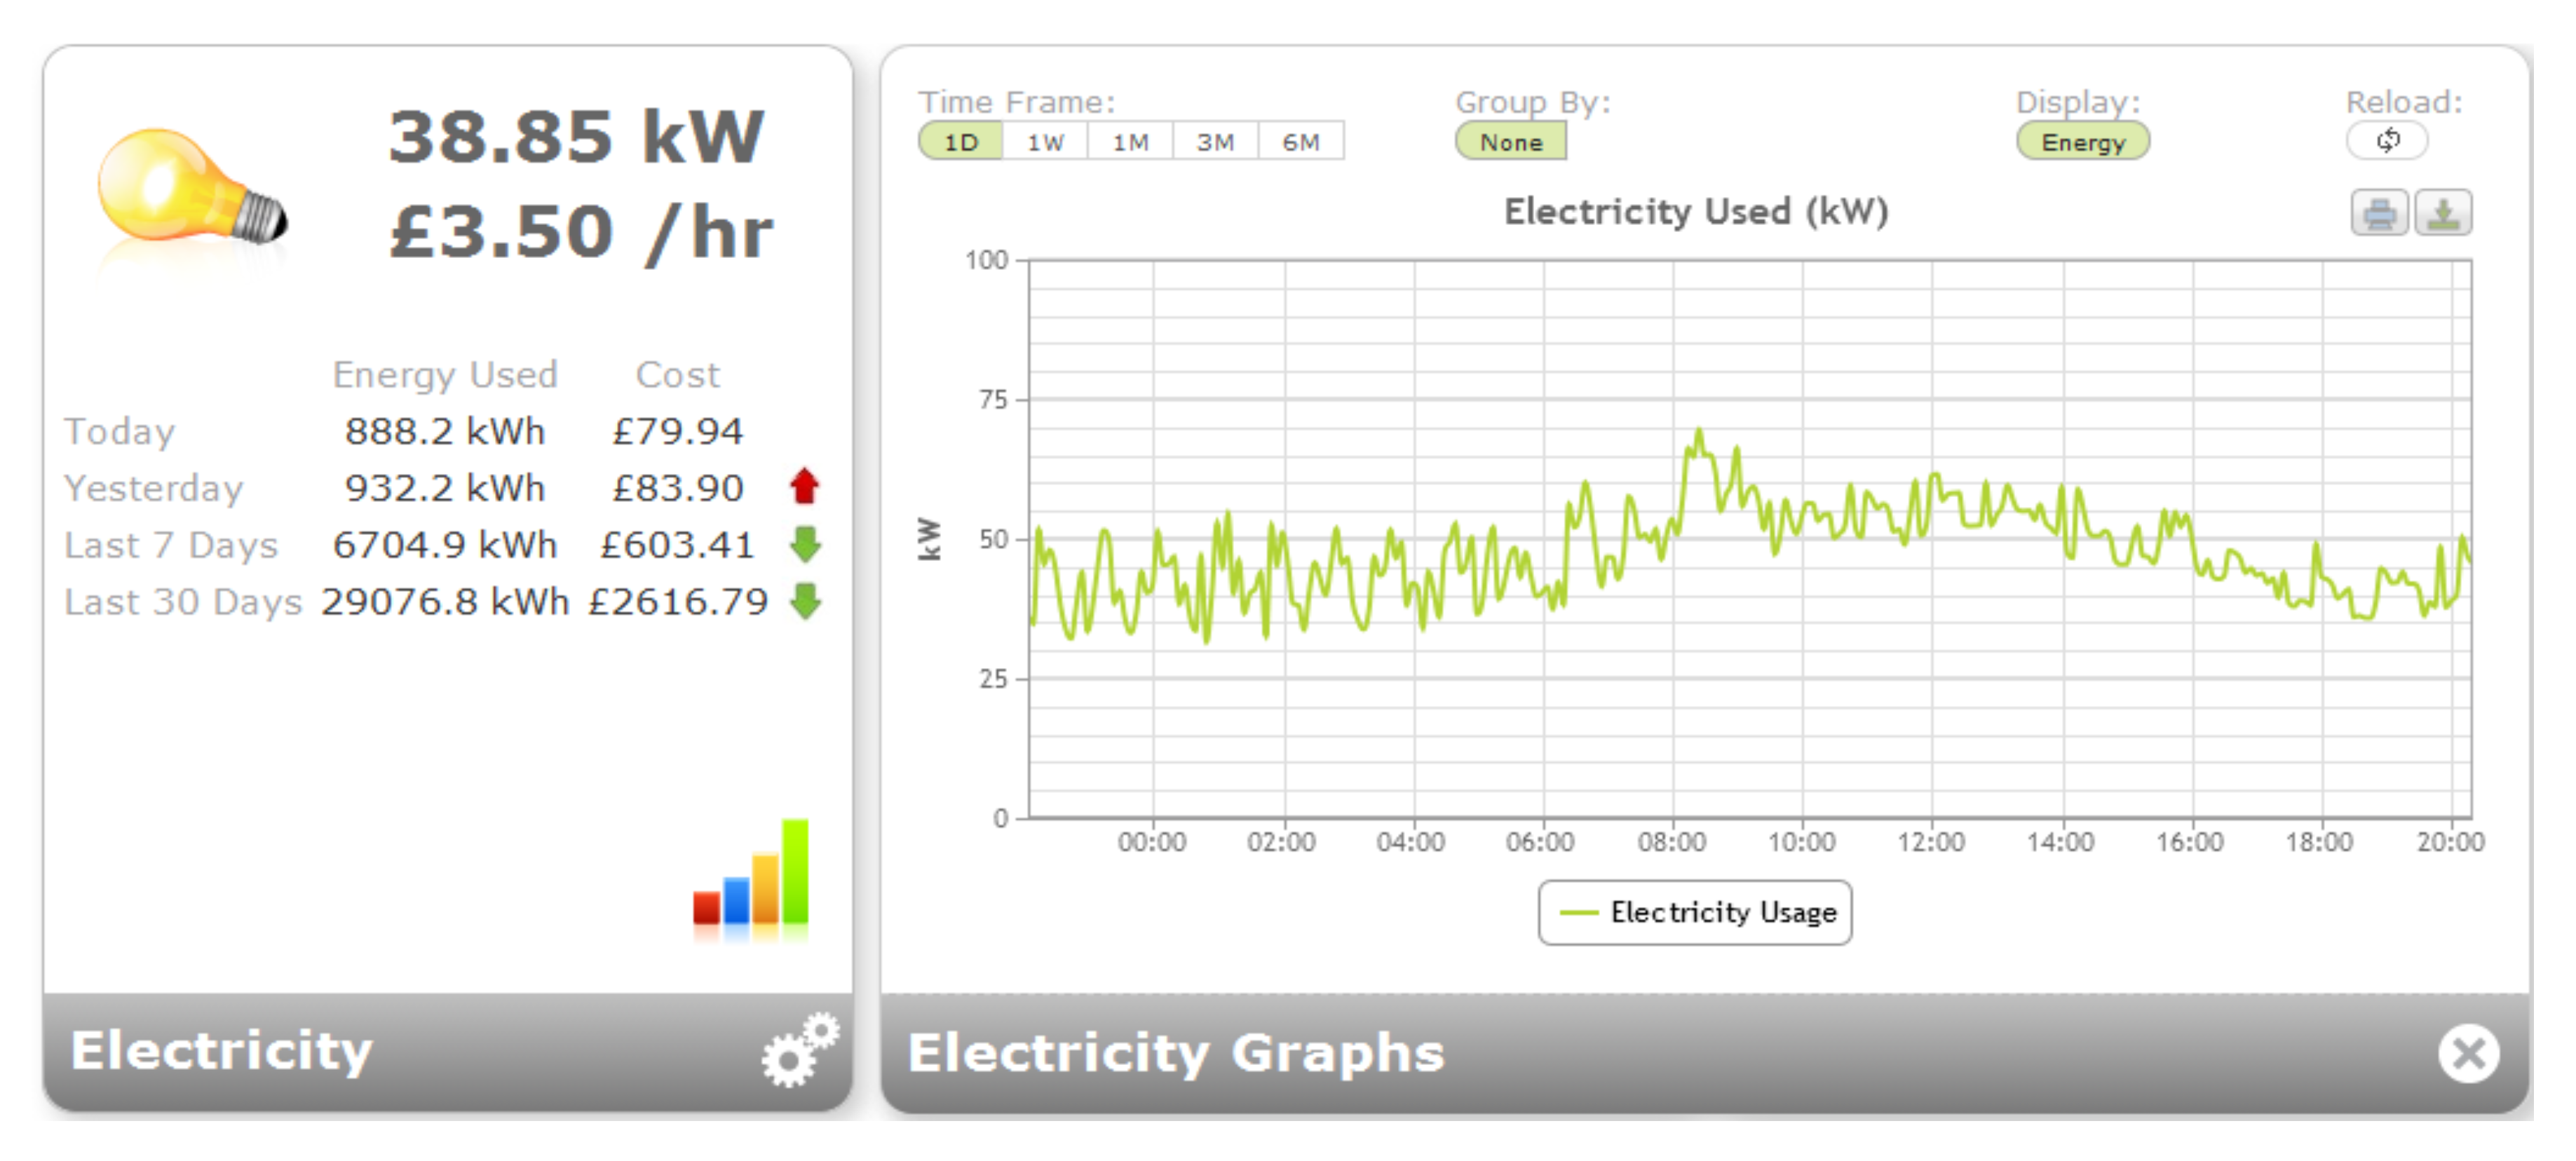
3.1. How the Proposed System Presents a Secured Real Time Electricity Feedback to Students


3.2. Comparing the Proposed System with Previous Systems and Past Studies
3.3. Effectiveness of Energy Feedback
4. Methodology
5. Initial Results
5.1. The Initial Electricity Usage Calculations and Carbon Emission in the University of Kent Halls of Residence
| Electrical appliances | Total energy in KWh/Yr | Average used/student/KWh/yr | Cost in pounds/Yr | Carbon emission in tons/yr | Carbon offset cost/yr |
|---|---|---|---|---|---|
| TV | 1216.18 | 24.32 | 160.29 | 0.77 | 5.39 |
| Stereo | 1459.00 | 29.18 | 192.29 | 0.92 | 6.64 |
| Refrigerators | 48,180.00 | 963.60 | 6,350.12 | 30.48 | 213.36 |
| Incandescent bulbs | 17,972.00 | 359.44 | 2,368.71 | 11.36 | 79.52 |
| CFL Bulbs | 3,507.68 | 70.15 | 462.31 | 2.22 | 15.54 |
| Heater | 184,928.00 | 3,698.56 | 24,373.25 | 116.99 | 898.23 |
| Fan | 350.40 | 7.01 | 46.13 | 0.22 | 2.33 |
| Toaster | 7,884.00 | 156.68 | 1,039.11 | 4.99 | 34.93 |
| Iron | 114.00 | 2.88 | 15.02 | 0.07 | 2.33 |
| Microwave | 1,095.00 | 21.90 | 144.32 | 0.69 | 4.88 |
| Desktop | 11,826.00 | 236.53 | 1,558.67 | 7.48 | 52.36 |
| Laptop | 15,815.04 | 316.30 | 2,084.22 | 10.00 | 70.00 |
| Wash Machine | 860.00 | 17.20 | 113.35 | 0.54 | 3.78 |
| Others | 6,246.00 | 124.92 | 823.22 | 3.95 | 27.65 |
| Totals | 301,453.30 | 6,028.67 | 39,731.01 | 190.68 | 1416.94 |
5.2. Energy Wastage Identified from the Survey
6. Challenges Affecting Students’ Behavioral Change
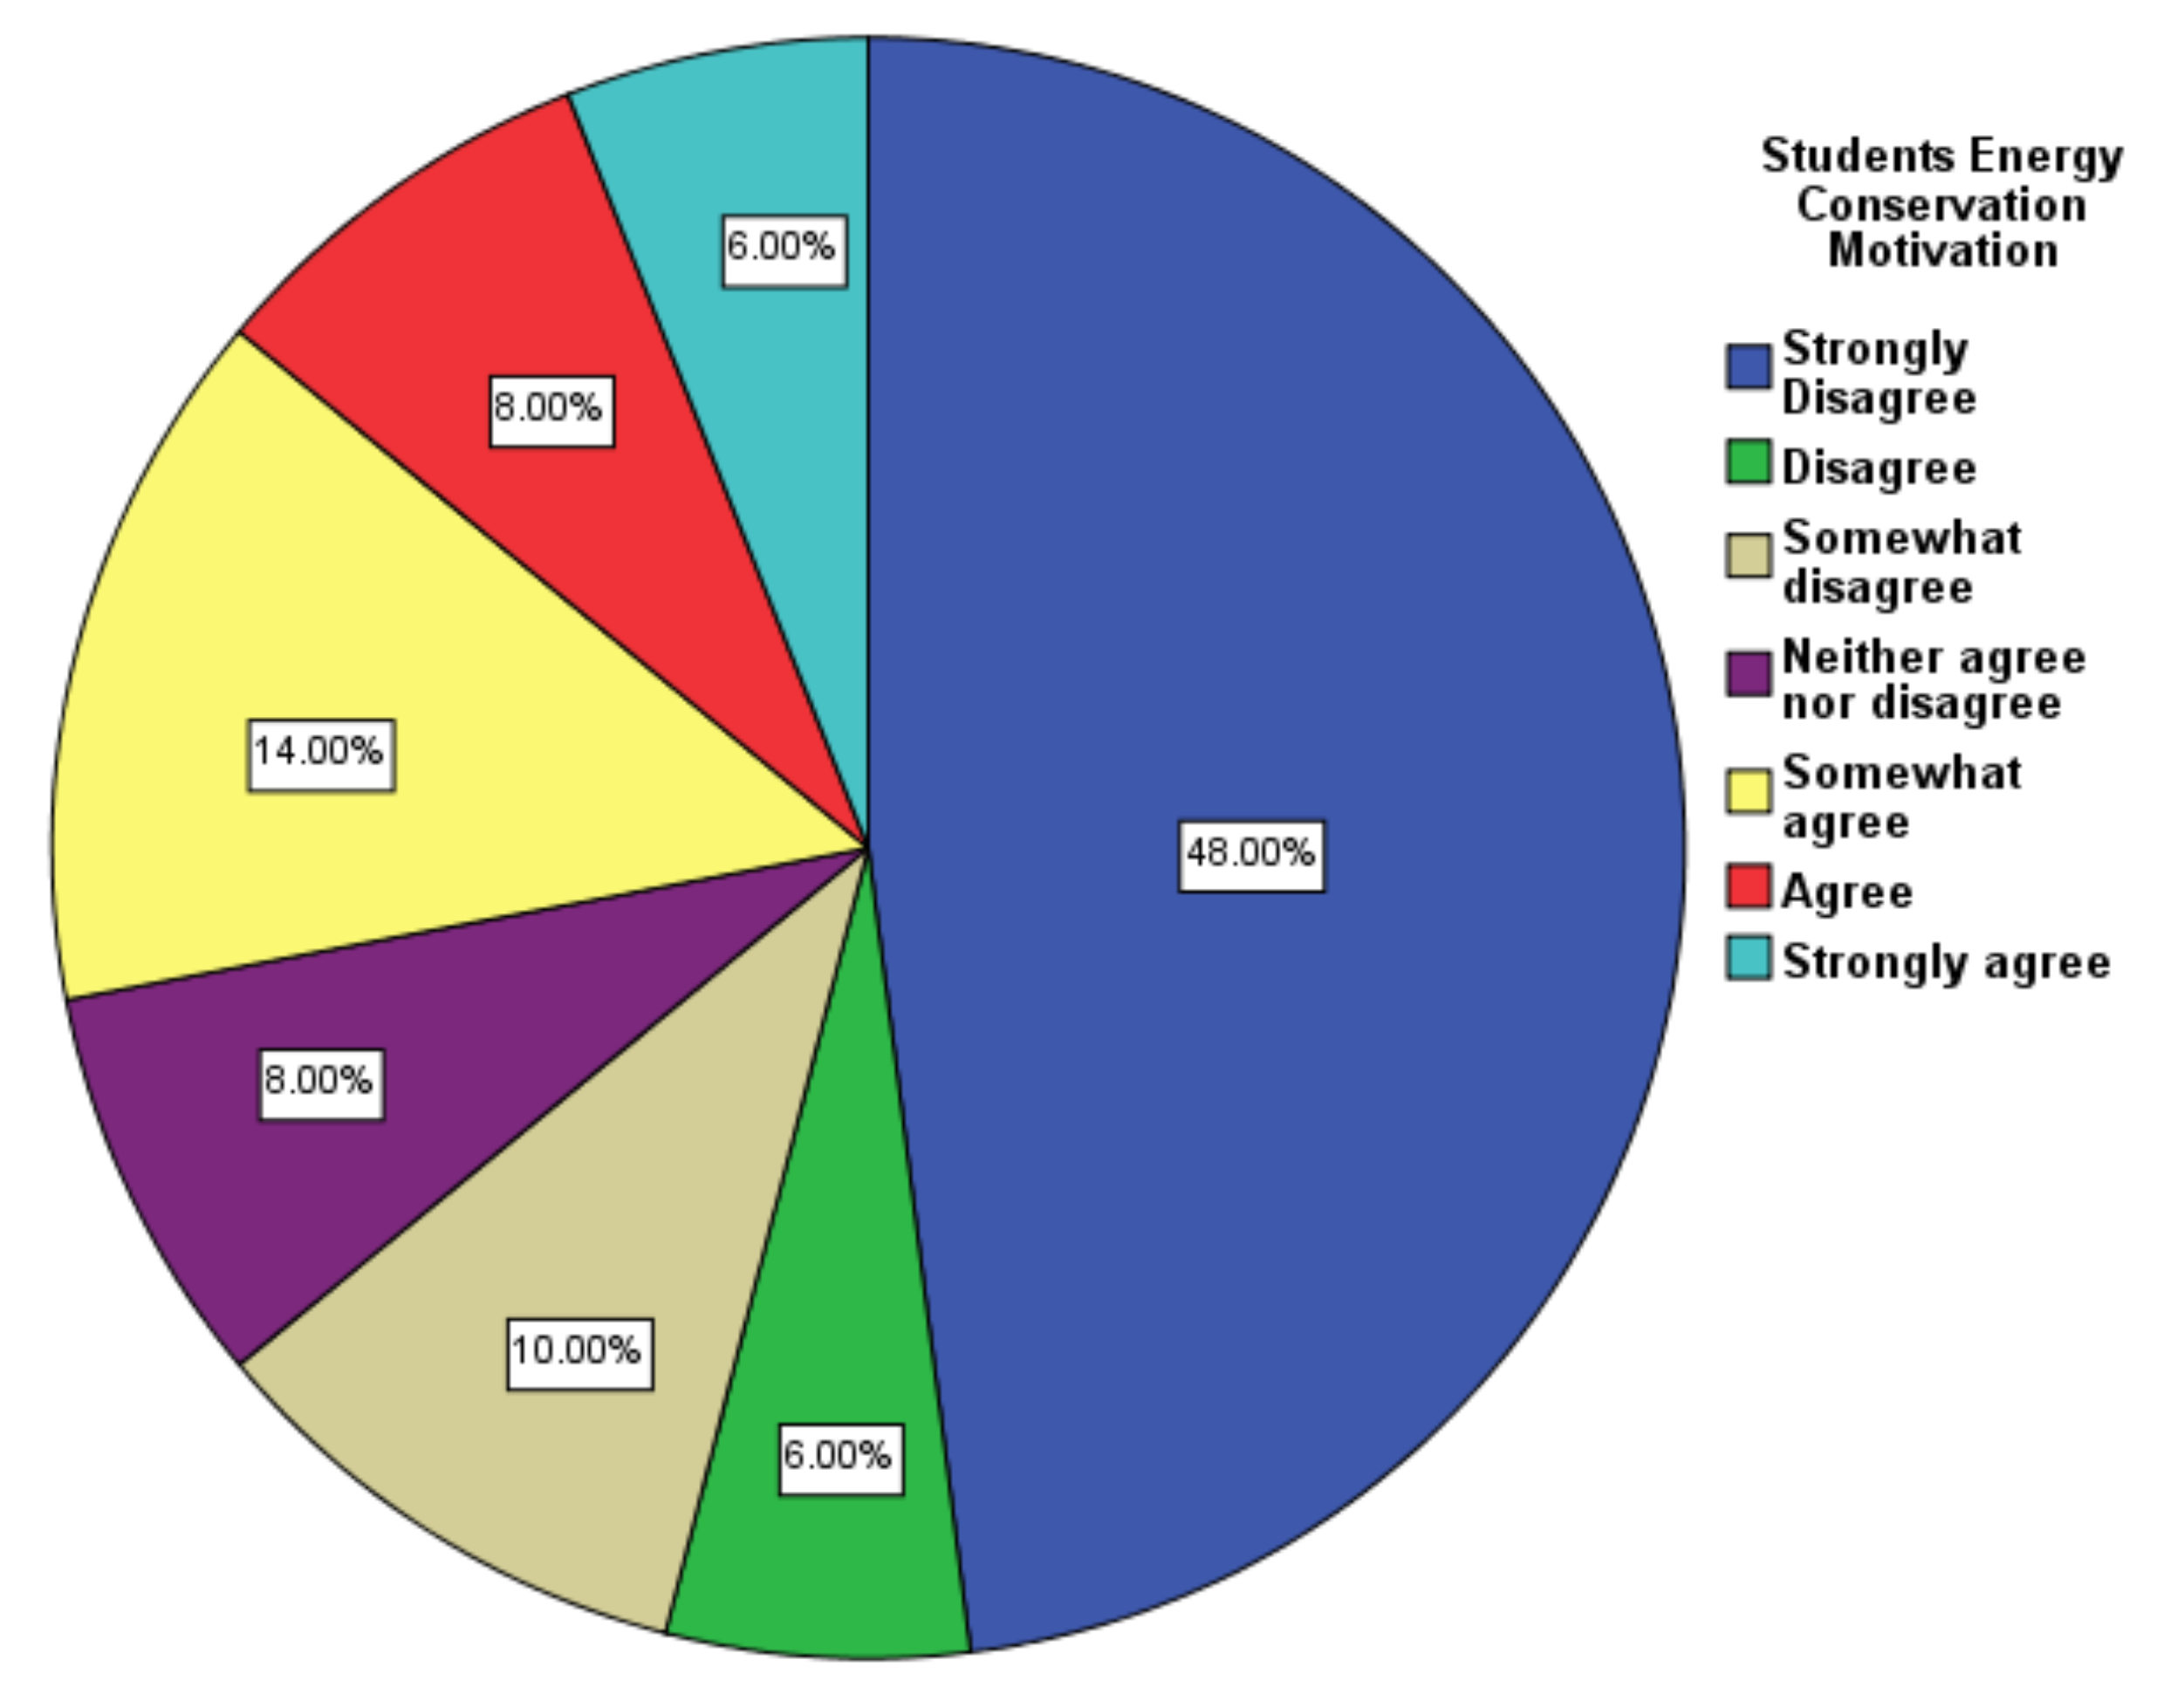
6.1. Factors That Motivate the Students
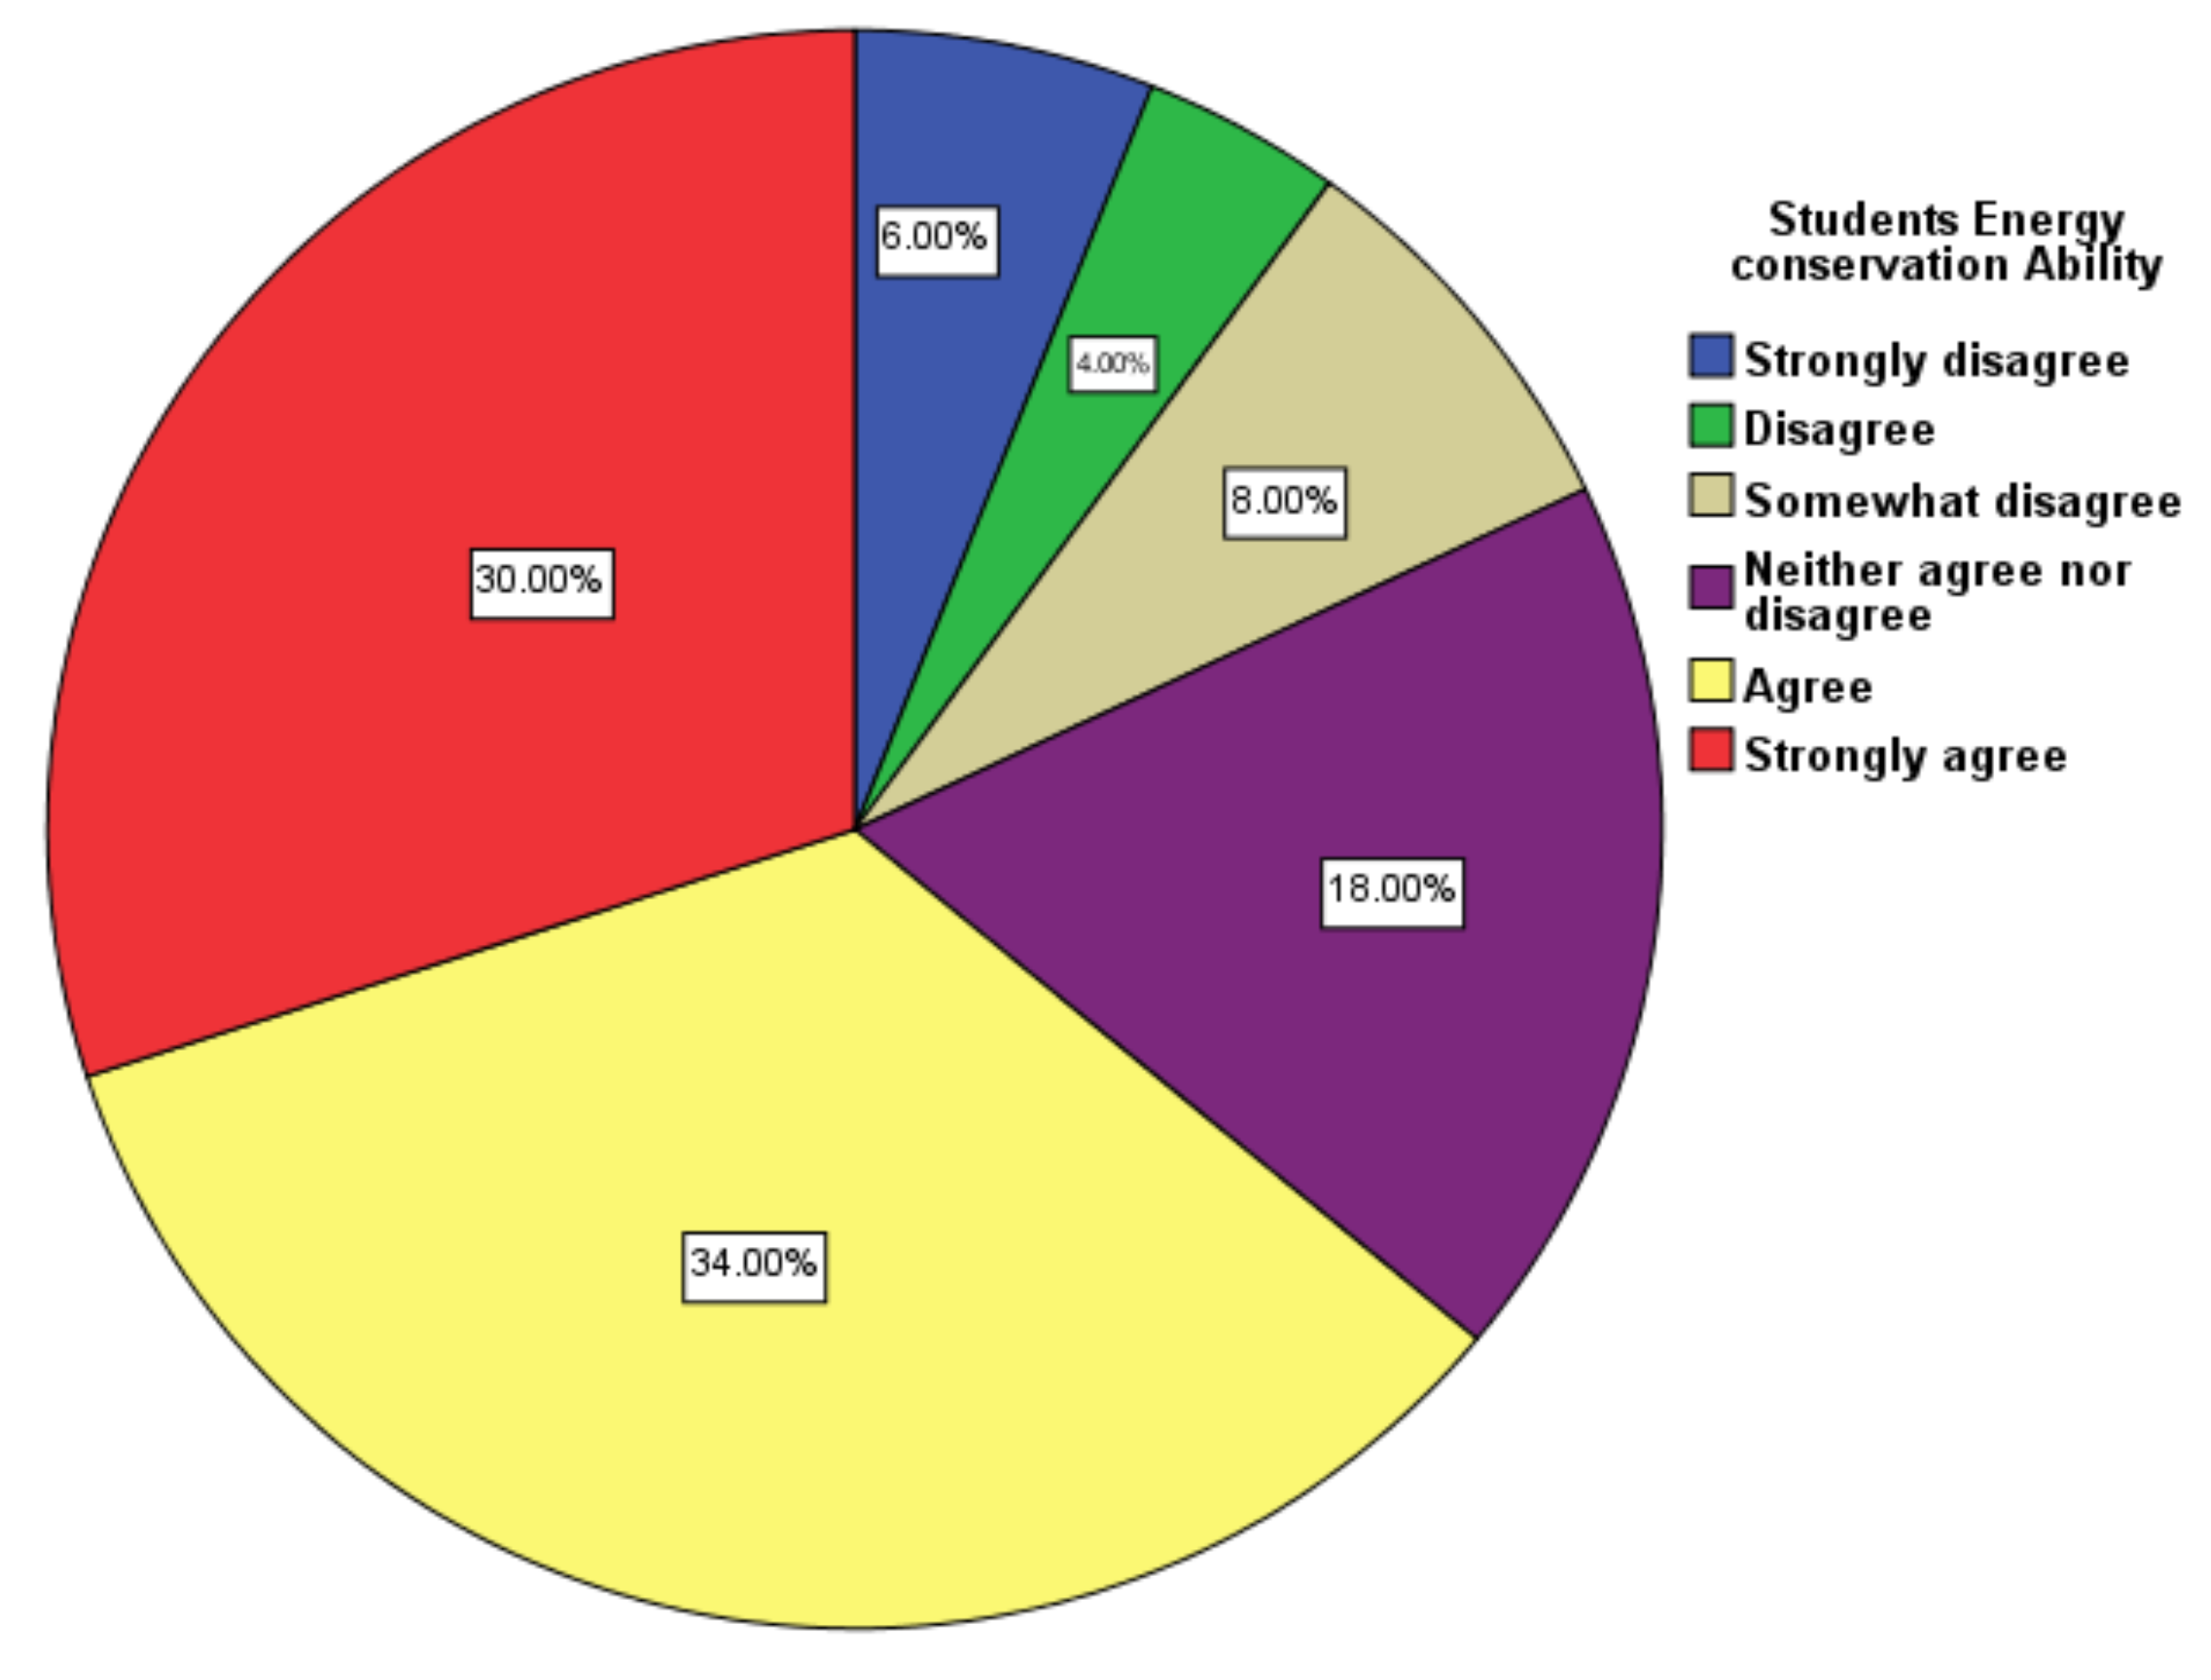
6.2. Students’ Ability and Enabling Factors
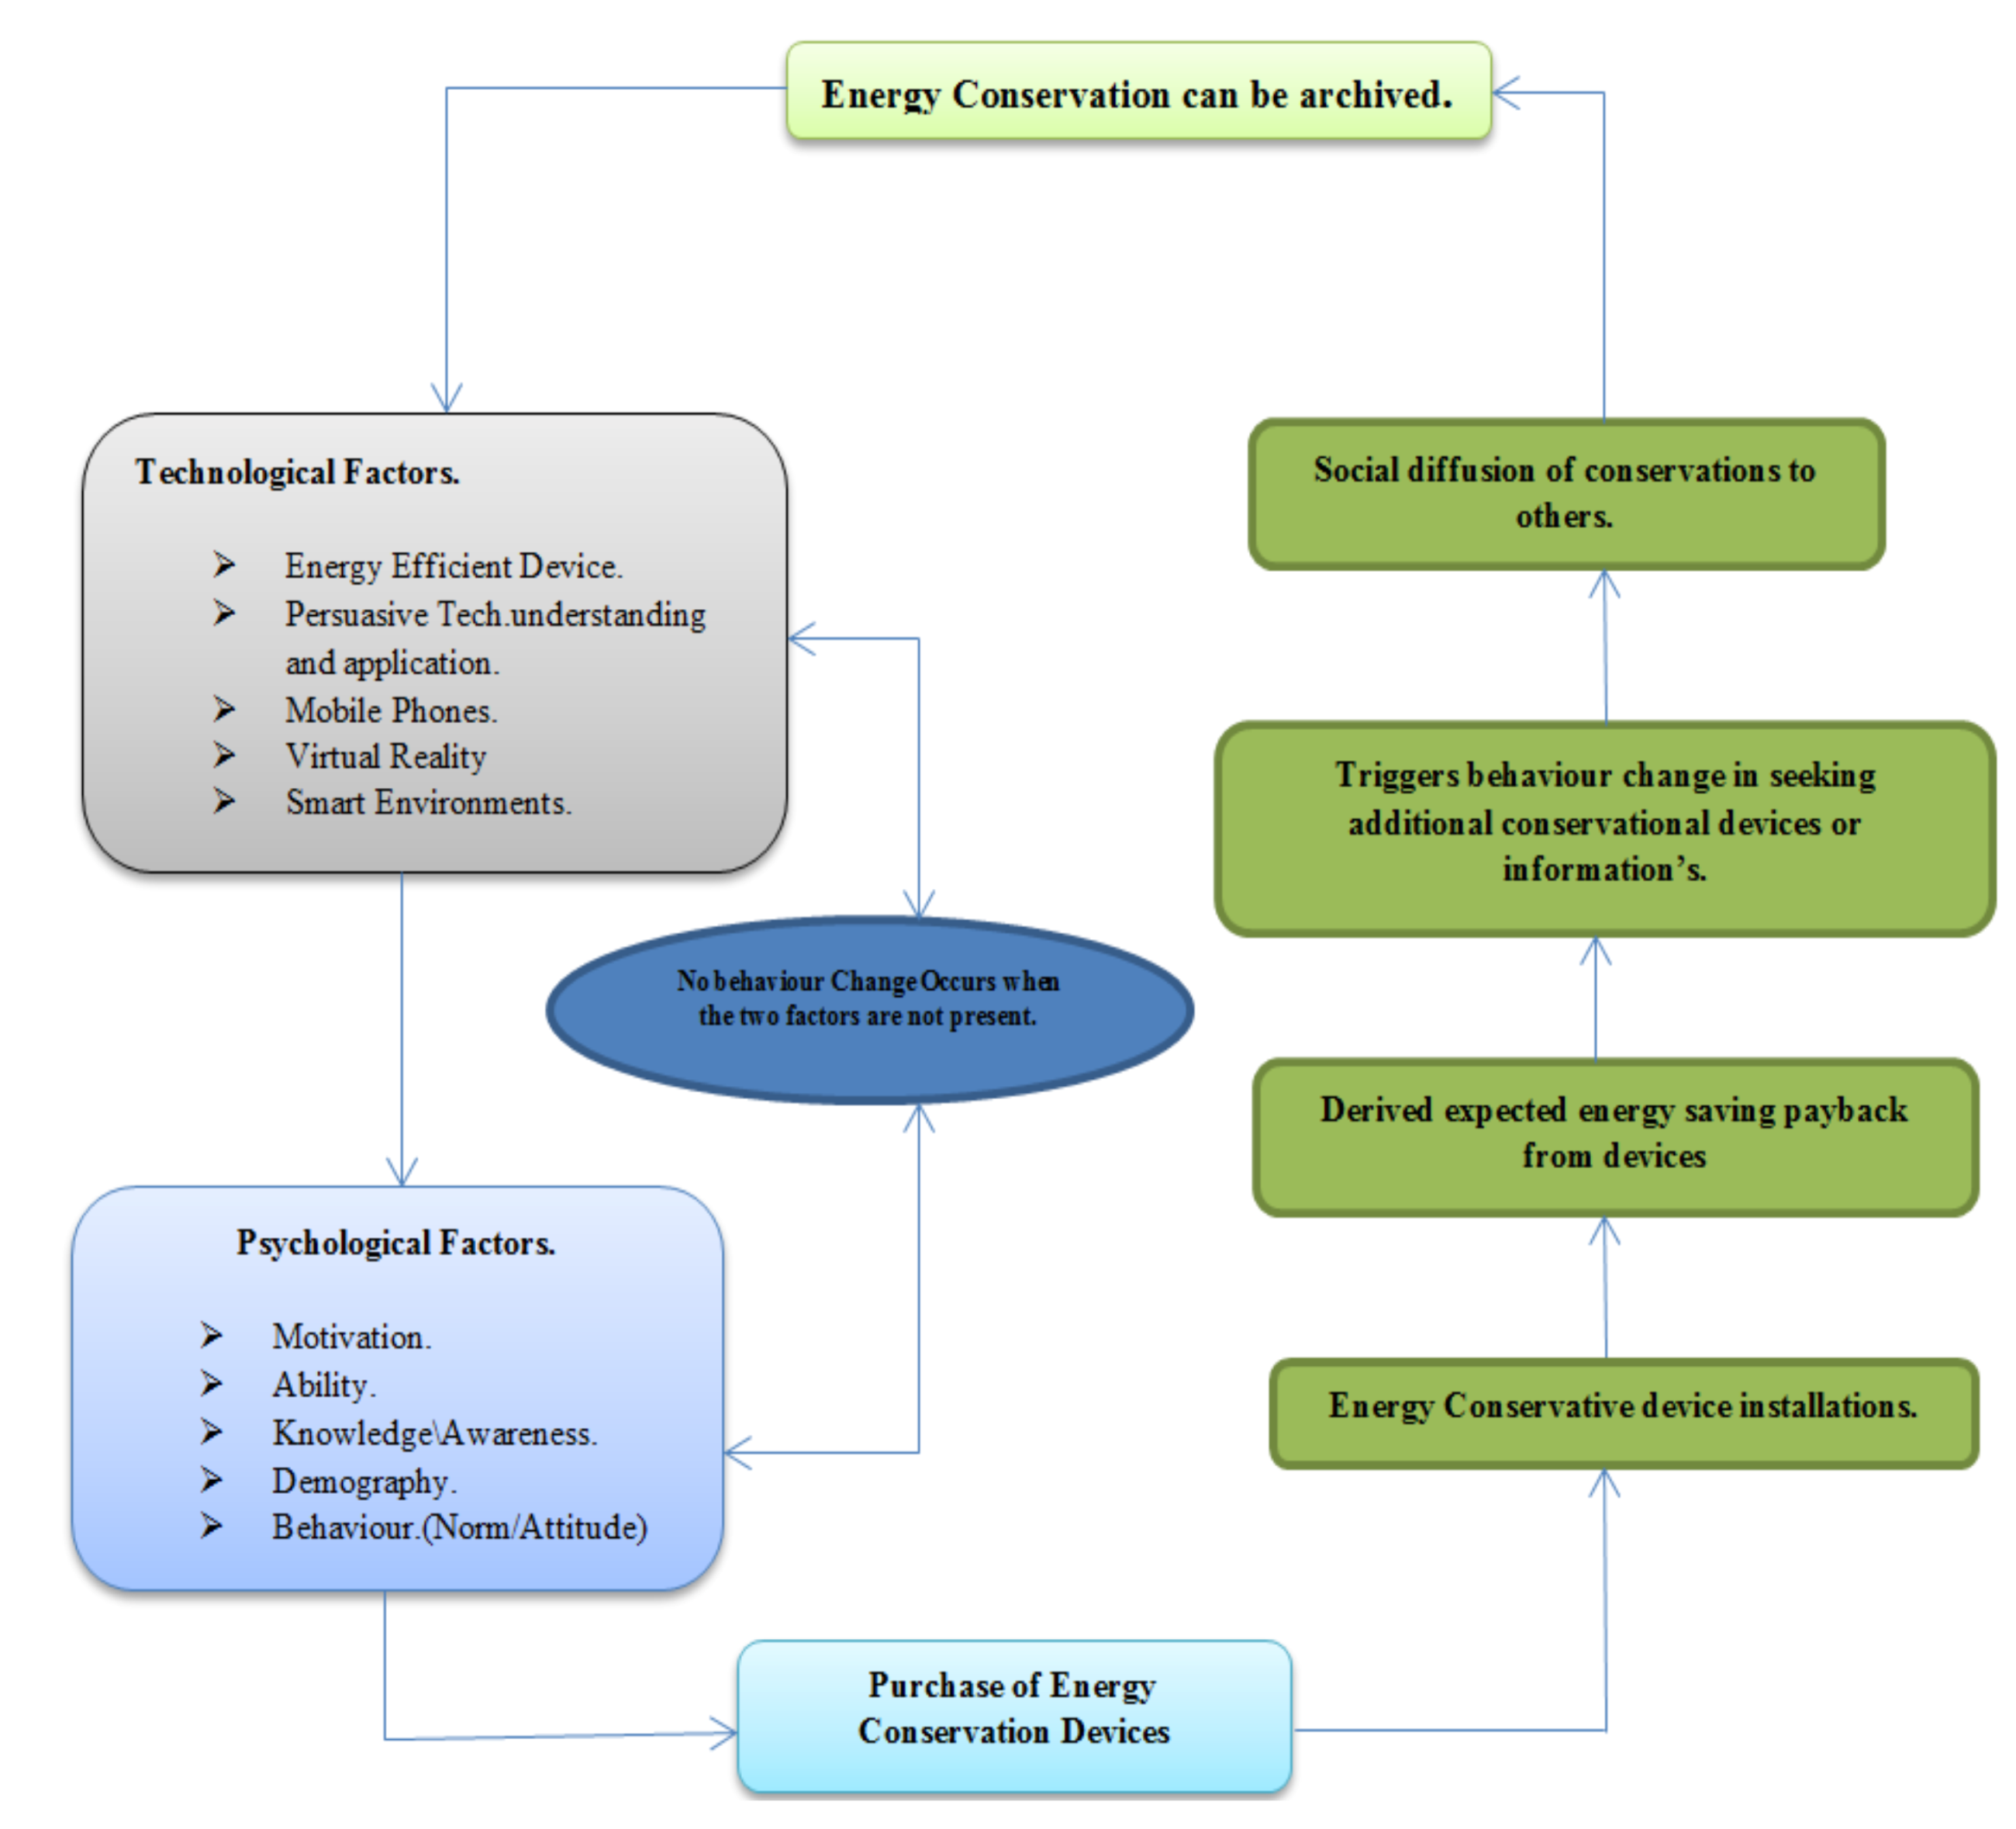
6.3. Energy Behavior Based on Technological and Psychological Factors

6.4. Energy Behavior Analysis
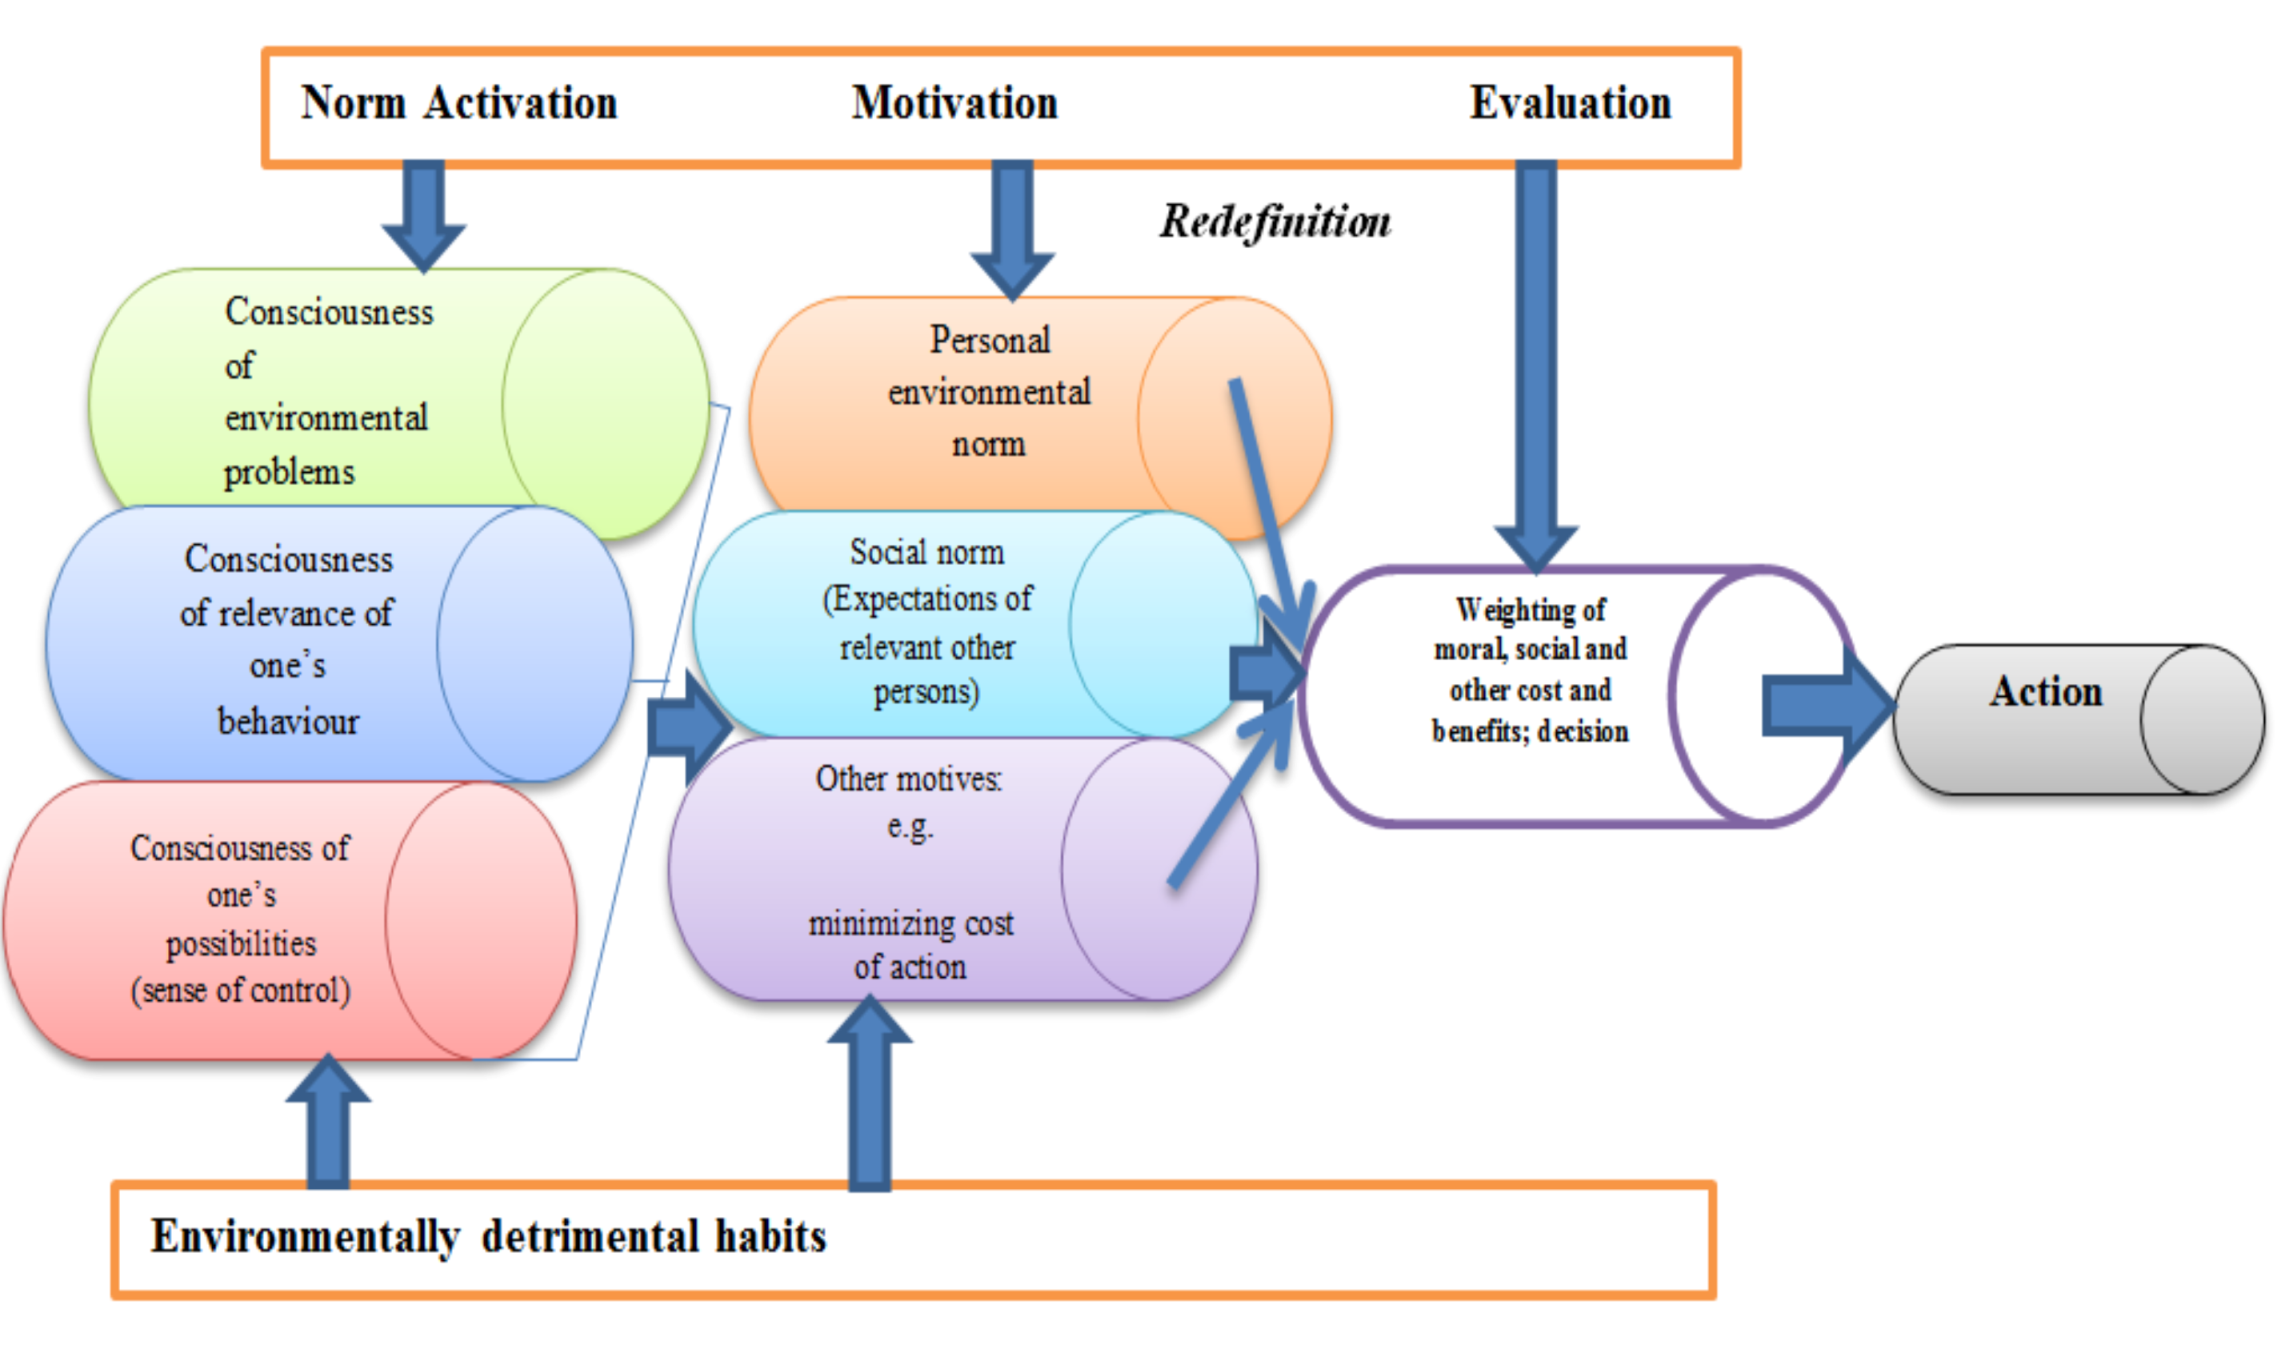
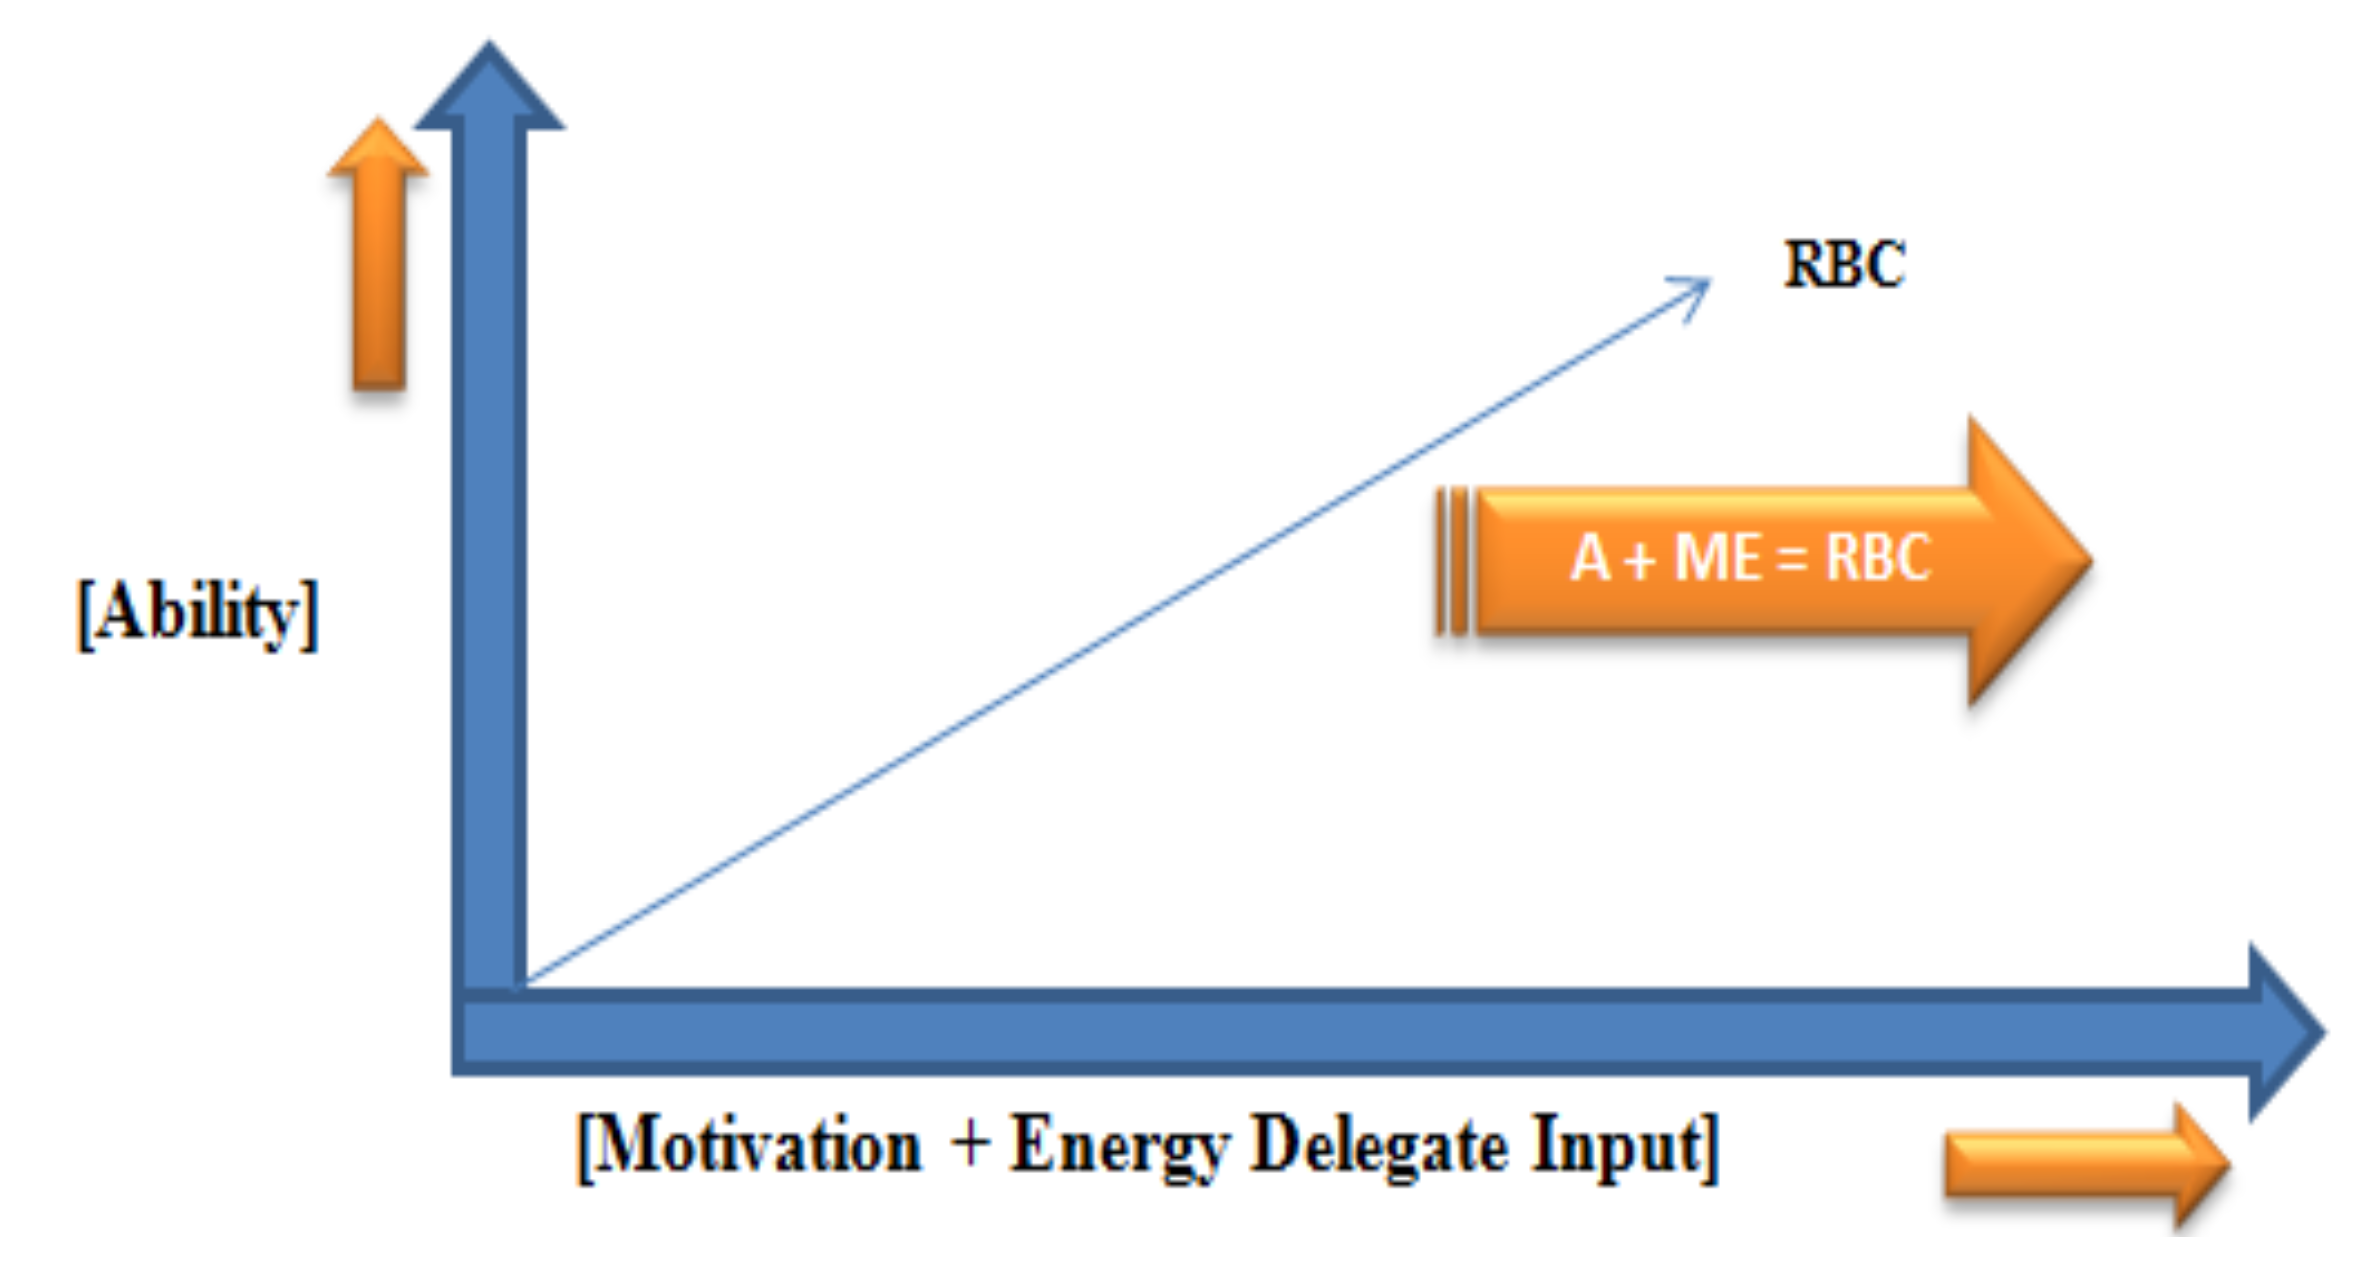
6.5. A Model to be Proven after the Intervention
7. Conclusion
References
- Fischer, C. Feedback on household electricity consumption: A tool for saving energy? Energy Effic. 2008, 1, 79–104. [Google Scholar] [CrossRef]
- EDF Energy Homepage. Available online: http://www.edfenergy.com (accessed on 16 October 2011).
- Peschiera, G.; Taylor, J.E.; Siegel, J.A. Response-relapse patterns of building occupant electricity consumption following exposure to personal, contextualized and occupant peer network utilization data. Energy Build. 2010, 42, 1329–1336. [Google Scholar] [CrossRef]
- International Energy Agency. World Energy Outlook; Paris, France, 2005, 6th ed. Available online: http://www.worldenergyoutlook.org/media/weowebsite/2008-1994/WEO2005.pdf (accessed on 16 June 2012).
- Scottish Power Raises Gas and Electricity Prices. Available online: http://www.guardian.co.uk/money/2012/oct/15/scottish-power-raises-gas-electricity-prices (accessed on 16 October 2011).
- Fogg, B.J. Persuasive Technology: Using Computers to Change What We Think and Do; Morgan Kaufmann: San Francisco, CA, USA, 2003; pp. 31–65. [Google Scholar]
- Petersen, J.E.; Shunturov, V.; Janda, K.; Platt, G.; Weinberger, K. Dormitory residents reduce electricity consumption when exposed to real-time visual feedback and incentives. Int. J. Sustain. High. Educ. 2007, 8, 16–33. [Google Scholar] [CrossRef]
- Brewer, R.S.; Lee, G.E.; Johnson, P.M. The Kukui Cup: A dorm energy competition focused on sustainable behaviour change and energy literacy. In Proceedings of the 44th Hawaii International Conference on System Sciences, Koloa, Kauai, HI, USA, January 2011.
- Odom, W.; Pierce, J.; Roedl, D. Social incentive & eco-visualization displays: Toward persuading greater change in dormitory communities. Int. J. Sustain. High. Educ. 2008, 1, 16–33. [Google Scholar]
- Bekker, M.J.; Cumming, T.; Osborne, N.K.P.; Bruining, A.M.; Mclean, J.I.; Leland, L.S. Encouraging electricity savings in a university. J. Appl. Behav. Anal. 2010, 1, 327–331. [Google Scholar]
- Marcell, K.; Agyeman, J.; Rappaport, A. Cooling the campus: Experiences from a pilot study to reduce electricity use at Tufts University, USA, using social marketing methods. Int. J. Sustain. High. Educ. 2004, 5, 169–189. [Google Scholar] [CrossRef]
- Marans, R.; Edelstein, J. The human dimension of energy conservation and sustainability: A case study of the University of Michigan’s energy conservation program. Int. J. Sustain. High. Educ. 2010, 11, 6–18. [Google Scholar] [CrossRef]
- Darby, S. The Effectiveness of Feedback on Energy Consumption; A Review for DEFRA of the Literature in Metering; Metering, Billing, and Direct Displays: Oxford, UK, April 2006. [Google Scholar]
- Darby, S. Making it obvious: Designing feedback into energy consumption. In Proceedings of the 2nd International Conference on Energy Efficiency in Household Appliances and Lighting, Naples, Italy, January 2001; pp. 685–696.
- Costanzo, M.; Archer, D.; Aronson, E; Pettigrew, T. Energy conservation behaviour: The difficult path from information to action. Am. Psychol. 1986, 41, 521–528. [Google Scholar] [CrossRef]
- Oleckno, W. Guidelines for improving risk communication in environmental health. J. Environ. Health 1995, 58, 20–24. [Google Scholar]
- Townsend, S.; Dev, S.; Kev, U. Green Futures 2001, 34–35.
- Wright, M.; Hooper, S. Break it down, open it up. Green Futures 2001, 21–24. [Google Scholar]
- Delmas, M. Behavioural Responses toReal-Time Individual Energy Usage Information; Technical Proposal; State of California Air Resources Board Research Division: Sacramento, CA, USA, October 2010. [Google Scholar]
- Shen, D.; Laffey, J.; Lin, Y.; Huan, X. Social influence of perceived usefulness and ease-of-use of course delivery systems. J. Int. Online Learn. 2006, 5, 270–282. [Google Scholar]
- Google’s Energy Ideas Might Emerge Under Open Source License or Not. Available online: http://green.blogs.nytimes.com/2008/10/28/googles-energy-ideas-might-emerge-under-open-source-licenses-or-not/ (accessed on 7 July 2012).
- Faruqui, A.; Sergici, S.; Sharif, A. The impact of informational feedback on energy consumption —A survey of the experimental evidence. Energy 2010, 35, 1598–1608. [Google Scholar] [CrossRef]
- White, D. Reduction in Carbon Dioxide Emissions: Estimating the Potential Contribution from Wind-Power, 2004. The Renewable Energy Foundation Web Site. Available online: http://www.ref.org.uk/publications/171-reduction-in-carbon-dioxide-emissions-estimating-the-potential-contribution-from-wind-power (accessed on 20 July 2012).
- The Carbon Foodprint and Carbon Offset Option. Available online: http://www.carbonfootprint.com/offset.aspx?o=190.71&r=ShopOffset (accessed on 28 June 2012).
- Linden, A.L.; Kanyama, A.C.; Eriksson, B. Efficient and inefficient aspects of residential energy behaviour: What are the policy instruments for change? Energy Policy 2006, 34, 1918–1927. [Google Scholar] [CrossRef]
- Fischer, C. Influencing Electricity Consumption via Consumer Feedback: A Review of Experience. In Proceedings of eceee 2007 Summer Study: Saving Energy-Just Do It! La Colle sur Loup, France, June 2007; pp. 1873–1884.
© 2012 by the authors; licensee MDPI, Basel, Switzerland. This article is an open-access article distributed under the terms and conditions of the Creative Commons Attribution license (http://creativecommons.org/licenses/by/3.0/).
Share and Cite
Emeakaroha, A.; Ang, C.S.; Yan, Y. Challenges in Improving Energy Efficiency in a University Campus Through the Application of Persuasive Technology and Smart Sensors. Challenges 2012, 3, 290-318. https://doi.org/10.3390/challe3020290
Emeakaroha A, Ang CS, Yan Y. Challenges in Improving Energy Efficiency in a University Campus Through the Application of Persuasive Technology and Smart Sensors. Challenges. 2012; 3(2):290-318. https://doi.org/10.3390/challe3020290
Chicago/Turabian StyleEmeakaroha, Anthony, Chee Siang Ang, and Yong Yan. 2012. "Challenges in Improving Energy Efficiency in a University Campus Through the Application of Persuasive Technology and Smart Sensors" Challenges 3, no. 2: 290-318. https://doi.org/10.3390/challe3020290
APA StyleEmeakaroha, A., Ang, C. S., & Yan, Y. (2012). Challenges in Improving Energy Efficiency in a University Campus Through the Application of Persuasive Technology and Smart Sensors. Challenges, 3(2), 290-318. https://doi.org/10.3390/challe3020290