Abstract
Rural counties face unique challenges with regard to disaster vulnerability and resilience. We compared the quality of hazard mitigation plans (HMPs) completed in accordance with provisions of the Disaster Mitigation Act of 2000 from 21 urban and 36 rural counties in three southeastern states. HMPs were content analyzed to calculate a score for six principles of plan quality. Generalized linear models were used to assess how the mean number of items within each of the six principles was related to urban status, adjusting for total county population and state-level differences. Adjusted mean ratios were higher in urban areas for goals, fact base, policies and participation. Rural areas performed better than urban counterparts in both implementation and monitoring and inter-organizational coordination. Our results suggest that there are important differences in hazard mitigation plan quality between urban and rural counties. Future research should explore characteristics of urban and rural counties that explain the observed differences, and whether such differences can help explain the inequalities in response and recovery to disasters between urban and rural counties.
1. Introduction
Rural counties—defined by the U.S. Census as “territory, population, and housing units located outside of urbanized areas and urban clusters - face unique challenges with regard to disaster vulnerability and resilience [1]. Relative to their urban counterparts, rural counties have higher poverty rates [2], an aging population base [3], higher rates of age-adjusted mortality, disability, and chronic disease [4], are more geographically and socially isolated [5], and typically have fewer resources available at their disposal [6]. As such, rural communities may be at a particular disadvantage when it comes to planning and preparing for disasters [5,7,8,9,10,11,12,13,14,15].
Although there are many dimensions of disaster planning and preparedness [16], local hazard mitigation plans play a pivotal role in guiding how a community accounts for the vulnerability of human communities and their built and natural environments [17,18]. In this way, the plan can be seen as a statement of intent in dealing with the vulnerabilities of rural communities. Hazard mitigation plans can provide several benefits for rural populations. A local hazard mitigation plan should establish a fact base that educates residents, stakeholders, and officials about the vulnerability of rural populations, opportunities for change, and rationales for policies and actions. A high quality plan combines the best available scientific knowledge with informal knowledge of residents and officials familiar with the needs and assets of their particular situation, as well as coordinating mitigation policies with other community programs aimed at economic, environmental, housing, and infrastructure policies to leverage limited resources in support of mitigation.
There are several reasons why hazard mitigation plans are important, particularly in rural areas. A high quality hazard mitigation plan can be used by a community to proactively assess risk and direct future development away from hazardous areas. Plans may also raise awareness and build consensus in a community. Additionally, hazard mitigation plans are required by the Disaster Mitigation Act (DMA) in order for communities to be eligible to receive certain types of mitigation and recovery funding from the Federal Emergency Management Agency (FEMA) and other government agencies.
Given the consistently limited resources of rural local governments, we hypothesize that the quality of rural hazard mitigation plans may be lower in rural counties than in urban areas. This study focuses on six key principles of plan quality, divided into two conceptual groups [19]. Direction setting principles include: (1) goals, which express future desired conditions grounded in community values; (2) a fact base, which provides the factual foundation about the hazards identified and the existing capabilities to reduce risks from those hazards; and (3) policies that guide actions to achieve goals. Action-oriented principles include: (1) implementation and monitoring, which provides information about how the community will carry out the proposed policies; (2) inter-organizational coordination, which identifies how organizations coordinate across levels of government and the across the public and private sectors; and (3) participation, which recognizes involvement of formal and informal actors engaged in the planning process [20,21,22].
In this study, we compare the quality of hazard mitigation plans completed in accordance with provisions of the DMA of 2000 in 21 urban and 36 rural counties from three states in the southeastern US (Florida, Georgia, North Carolina) (Figure 1). These 3 states share similar hazard exposures that predominantly include flooding, hurricanes and tornadoes. Establishing that consistent differences exist between rural and urban plans across these plan quality principles could play an important role in mitigating inequalities in disaster preparedness and response observed between rural and urban communities.
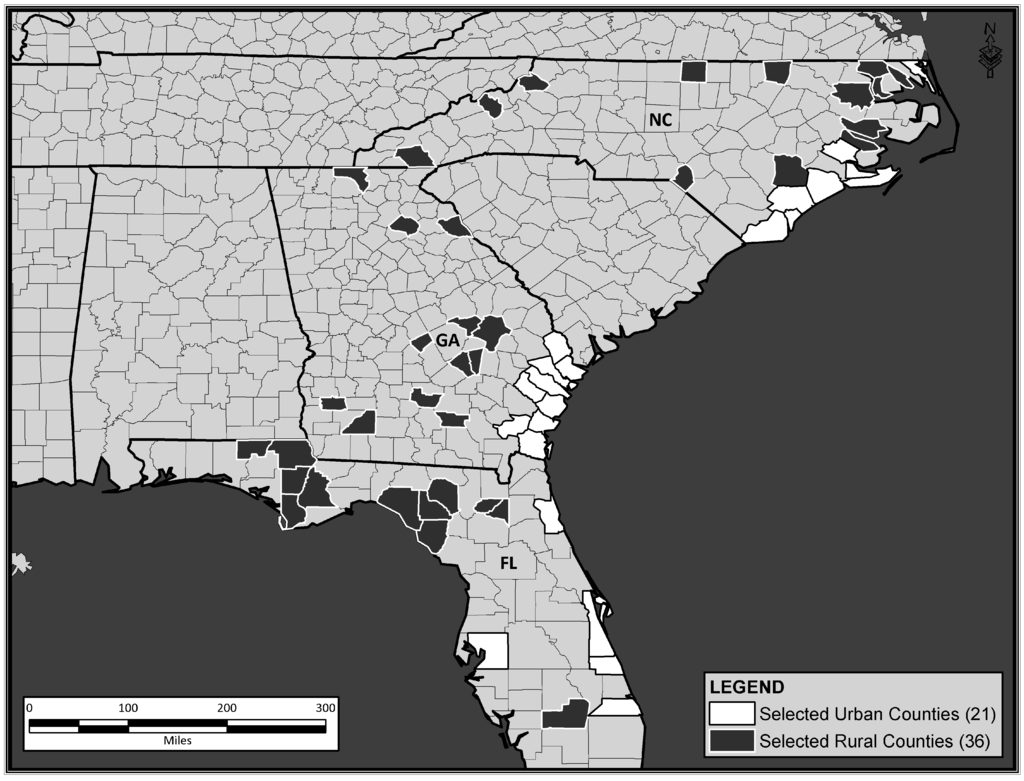
Figure 1.
Location of 21 urban and 36 rural counties included in study sample.
2. Methods
2.1. Data Sources and Collection
The sample for this study consisted of two groups of hazard mitigation plans adopted between 2004 and 2009 that represent rural and urban communities. A stratified random sample of 36 rural counties with USDA continuum codes 6 through 9 were selected from 3 states in the southeastern US (Florida, Georgia, North Carolina). The USDA defines rural along a continuum that includes nine different codes that distinguish metro counties by size and non-metro counties by their degree of urbanization or proximity to metro areas [23]. Categories 6 through 9 are defined as: (6) urban population of 2,500 to 19,999, adjacent to a metro area; (7) urban population of 2,500 to 19,999, not adjacent to a metro area; (8) completely rural or less than 2,500 urban population, adjacent to a metro area; (9) completely rural or less than 2,500 urban population, not adjacent to a metro area [24]. Twenty-one non-rural counties from the same three states were used as a comparison group.
Each group of plans—rural and urban—was coded using the same coding instrument. The coded plans for urban communities were collected and coded for other similar studies [20,25], and the plans from rural communities were collected and coded as part of this study.
Data on the six principles were extracted from the hazard mitigation plan for the selected counties. A coding instrument was utilized with items selected to assess how well each of the six plan quality principles was accounted for in the 36 rural county’s hazard mitigation plans and 21 urban county plans. Each of the six principles consists of discrete items, which vary from principle to principle according to theory. As a result, the number of items per principle varies. Items under each principle were designed to assess the extent to which the observed plan content corresponds to the principles [19,26]. All plans evaluated as part of this project were assessed for a total of 554 items in the six principles. Table 1 provides a description of each principle, examples of their corresponding content, and a count of the number of items assessed in each principle.

Table 1.
Plan quality principles and items assessed.
| Plan Quality Principles | Examples of Items Assessed | Items assessed in each principle |
|---|---|---|
| Direction Setting Principles | ||
| Goals | Public safety; Equitable hazard loss; Environmental protection | 14 |
| Fact Base | Natural hazards identified (e.g., climate change, hurricanes, coastal storms, tornados, extreme cold and heat); Vulnerability Assessment; Risk assessment | 60 |
| Policies | Property acquisition and elevation; Assessment tools; Updated data; Educational awareness; Technical assistance; Develop incentives; Develop regulations; Financial assistance | 108 |
| Action-Oriented Principles | ||
| Implementation and Monitoring | Assigning organizational responsibility; Timeline for action; Projecting costs; Monitoring plan performance | 175 |
| Inter-Organizational Coordination | Stakeholders (Federal, State, County, Municipalities, Community-Based) Organizations; Non-Profit) | 184 |
| Participation | Public engagement techniques (e.g. citizen advisory committee, public notice and targeted outreach) | 13 |
| Total number of items assessed | 554 |
The item measures were replicated from previous research on hazard mitigation plan quality [18,19,22,27,28]. We used a nominal measure (1 = present, 0 = not present) as an indicator of whether a given item for a given principle was mentioned in the plan or not. We then summed these nominal measures within principles, giving us a count variable for the number of items included in the hazard mitigation plan for a given principle. Consistent with previous plan quality studies, we define a high quality plan as one that has a higher score for each principle, meaning that more items are included in the plan.
To increase reliability in evaluation scores, two trained coders independently coded the plans. Rules were developed by the coding team to ensure that each coder interpreted the items as consistently as possible. One out of every 6 rural plans was double-coded and all urban plans were double coded. Inter-coder reliability scores were calculated for each set of plans. Pre-reconciliation percent agreement for the rural plans was 90%. For the urban comparison group, pre-reconciliation percent agreement was 88%, both of which are above the 80% generally considered acceptable [29]. After reconciliation, plan coding data were merged with total county population data derived from the 2000 US Census using State and county Federal Information Processing Standards codes.
2.2. Data Analysis
We used unadjusted regression analyses to assess whether the mean number of items within each principle differed between urban and rural counties. To explore such differences, we assumed that the score for a given principle from each county was an independent and identically distributed Poisson random variable with a mean μ = E[Y] We defined an unadjusted generalized linear model as

where log(⋅) is the natural log function, E[⋅] is the expectation operator defining the mean of a Poisson random variable, and urb was an indicator variable (urban=1; rural=0). Using this model allowed us to compare the predicted mean number of items in urban counties E[Y| urb = 1] to the predicted mean number of items in rural counties E[Y| urb = 0] as a ratio:

where exp(⋅) is the inverse of the natural log function. Thus, exp(β1) represented the ratio of the mean score in urban counties to that in rural counties. A mean ratio larger than 1 meant that the urban county plans evaluated scored higher overall in that principle that the rural county plans; a mean ratio smaller than 1 meant that the rural county plans scored higher overall in that principle that the urban county plans.
Although the magnitude and direction (i.e., greater or less than 1) of the unadjusted mean ratio provides some information on the relationship between the mean score in urban versus rural counties, the unadjusted ratio may also be due to state specific differences, or to differences in county population size. For example, scores from counties in the same state were likely to be correlated (i.e., non-independent) due to unmeasured within-state characteristics. To account for these issues, we adjusted our generalized linear model for total county population to control for potential confounding, and used fixed effects regression to account for unobserved within-state heterogeneity [30,31]. We defined an adjusted model as

As with the unadjusted model, this model allowed us to compare the mean number of items in urban and rural counties as a ratio, while holding the contribution of total county population and within-state characteristics constant.

All statistical analyses were conducted in SAS version 9.2 (SAS Institute, Cary, NC).
3. Results
Results for each principle are presented in Table 2, including the mean score in rural and urban counties, the beta coefficient and standard error associated with urban status, and the unadjusted mean ratios and 95% confidence intervals (CI). The mean scores for rural counties in the six plan quality principles were 5.9 in goals, 30.6 in fact base, 17.9 in policies, 30.9 in implementation and monitoring, 19.8 in inter-organizational coordination and 4.9 in participation. Corresponding mean scores for urban counties were higher in goals (7.0), fact base (33.3), policies (22.0), and participation (5.3). Mean score for urban counties were lower in implementation and monitoring (29.9) and inter-organizational coordination (14.5). Exponentiation of model coefficients provided an unadjusted ratio of mean scores in urban versus rural counties. As stated earlier, the predicted mean was generally higher (mean ratio > 1) for direction setting principles including goals (mean ratio = 1.19 (95% CI: 1.01, 1.38), fact base (mean ratio = 1.09 (95% CI: 0.93, 1.27) and policies (mean ratio = 1.23 (95% CI: 1.03, 1.47) and for participation (mean ratio = 1.09 (95% CI: 0.95, 1.26) in urban counties relative to their rural counterparts. However, these mean ratios did not account for potential differences that may be due to state-level characteristics, or to differences due to total county population.
To account for potential confounding due to total county population and state-level differences, adjusted mean ratios were Adjusted mean ratios showed some evidence of confounding of the association between urban status and average plan quality score by county population size and state. For example, the magnitude of the association for fact base increased from an unadjusted mean ratio of 1.09 (95% CI: 0.93, 1.27) to an adjusted mean ratio of 1.25 (95% CI: 1.03, 1.50). Similarly, the magnitude of the association for implementation and monitoring decreased from an unadjusted mean ratio of 0.97 (95% CI: 0.70, 1.35) to an adjusted mean ratio of 0.83 (95% CI: 0.51, 1.36). Although the adjusted results suggest there may be differences in the average plan quality score between urban and rural counties that are not attributable to total county population or state-level characteristics, caution is warranted. Confidence intervals for the adjusted estimates overlapped those from the unadjusted estimates, suggesting that our small sample was unable to detect definitive differences between unadjusted and adjusted estimates.
Table 2.
Mean score, beta coefficients, standard errors and unadjusted and adjusted mean ratios (95% confidence intervals) for indicators of plan quality in urban versus rural counties from 57 Counties in the southeastern US.
| Mean Score * | Prob
 > ChiSq > ChiSq | Mean Ratio (95% CI) | ||||
|---|---|---|---|---|---|---|
| Plan Quality Principles | Rural | Urban | (SE) † | Unadjusted | Adjusted ‡ | |
| * Predicted mean score obtained from the unadjusted model | ||||||
| †
and SEs from the unadjusted model | ||||||
| ‡ Adjusted for State using fixed effects, and total county population in the year 2000 using restricted quadratic splines. | ||||||
| Direction Setting Principles | ||||||
| Goals | 5.9 | 7.0 | 0.17 (0.08) | 0.03 | 1.19 (1.01, 1.38) | 1.07 (0.88, 1.30) |
| Fact Base | 30.6 | 33.3 | 0.09 (0.08) | 0.26 | 1.09 (0.93, 1.27) | 1.25 (1.03, 1.50) |
| Policies | 17.9 | 22.0 | 0.21 (0.09) | 0.02 | 1.23 (1.03, 1.47) | 1.23 (1.00, 1.53) |
| Action-Oriented Principles | ||||||
| Implementation and Monitoring | 30.9 | 29.9 | –0.03 (0.17) | 0.86 | 0.97 (0.70, 1.35) | 0.83 (0.51, 1.36) |
| Inter-Organizational Coordination | 19.8 | 14.5 | –0.31 (0.08) | 0.00 | 0.73 (0.63, 0.86) | 0.70 (0.56, 0.87) |
| Participation | 4.9 | 5.3 | 0.09 (0.07) | 0.20 | 1.09 (0.95, 1.26) | 1.14 (0.95, 1.36) |
4. Discussion and Conclusions
We found important differences in hazard mitigation plan quality between urban and rural counties in the southeastern US that may help to address the vulnerability of rural areas to the impacts of natural disasters. Overall, urban counties included 19% more items related to goals and 23% more items related to policies than their rural counterparts in three southeastern states. Fact base and participation were also greater for urban counties, but this difference was not statistically significant. Alternatively, urban plans scored lower in two of three action oriented principles, with rural plans have 27% more items for inter-organizational coordination and 3% more items in implementation and monitoring, although the later was not statistically significant.
Higher scores on the goals, fact base, policy and participation principles in urban areas could be attributed to the fact that urban areas typically have a greater existing capacity to plan overall, such as more full-time equivalent staff or more certified planners that can be leveraged into hazard mitigation. Urban areas may be able to invest more in both staff and technology used in assembling elements of the fact base, such as hazard maps developed by Geographic Information Systems-based mapping systems. Urban areas may also do more to support participation opportunities for stakeholders, such as holding more public meetings that provide a better understanding of the local situation based in more informal knowledge or having more extensive information available online.
The higher implementation and monitoring scores of rural communities may mean that plans that have fewer goals and policies and less inter-organizational coordination are actually more likely to be effectively implemented. This could be due to the fact that rural plans in general include a less diverse array of proposed actions than urban plans and that the specific actions being proposed in rural plans are project based. Projects such as retrofitting a building or buying a generator can be easier to identify as implementation and monitoring during the plan coding process than information related to more complex actions such as changing policy or starting a new program.
Implementation in urban areas may be more complex in that it requires a broader set of local government and non-governmental actors to work in coordination. Similarly, the significantly stronger inter-organizational coordination seen in rural plans may reflect a greater homogeneity of the groups participating in the planning process. Many individuals in rural areas may work for multiple agencies or “wear many hats” as is common in rural areas that lack the personnel and resources to fill all positions. Organizations in rural communities are also likely to share a small staff with a long history of working together, particularly around disaster preparedness and response, which can contribute effective inter-organizational coordination and to a shared vision for future planning.
This study has several limitations. Our urban data were derived from hazard mitigation plans coded as part of two other projects [25,32], which limited the sample size of our study and our power to detect differences in some principles. A general concern in retrospective studies that include long periods of follow up is that exposure status may change over time, leading to misclassification. However, based on US Census data for 1990, 2000 and 2010, the rural counties in our sample have experienced only minor changes in population, so it is unlikely that many of the rural counties we included in our study would have grown to such an extent as to be classified as urban. In addition, in the adjusted model, we controlled for a very limited set of covariates (total county population and state) and it is likely that the differences we observed between urban and rural counties may be explained by factors that we were unable to measure. Furthermore, we explored associations between urban and rural counties from three states in the southeastern US, limiting the generalizability of our results. Finally, as with most statistical analyses [33], our study design precludes the assessment of causal relationships between urban/rural status and hazard mitigation plan content.
Despite limitations, we have provided quantitative evidence that suggests there are important differences in hazard mitigation plan quality between urban and rural counties and that these differences may affect the quality of disaster mitigation, preparedness, response, and recovery in rural areas in ways that are amenable to intervention through policy change. Future research should continue to explore characteristics of urban and rural counties that explain the observed differences, and whether such differences can explain the documented inequalities in preparedness, response and recovery to disaster between urban and rural counties [14,15]. While some of these differences may increase the vulnerability of rural communities overall (e.g., identifying fewer hazards) and particular population sub-groups (e.g., lower participation in planning), others may provide opportunities to reduce vulnerability and increase resiliency. Strong inter-organizational coordination in rural areas can provide a unique opportunity to strengthen planning through coordination among multiple governmental agencies with similar goals, such as planning, emergency management and public health. Rural areas may also be able to leverage strong inter-organizational coordination to improve participation in planning by bringing additional stakeholders to the table to be part of the planning process. The relative strength of implementation and monitoring in rural plans may indicate stronger buy-in from stakeholders related to how the county will carry out the policies proposed in the plan to improve disaster outcomes in the future. In order to better understand how these differences are operationalized, future research should prospectively follow communities through the disaster management cycle (mitigation, preparedness, response, recovery) to observe and measure differences in order to demonstrate how high scoring plans are related to improved outcomes at both the community and individual level.
Acknowledgments
The authors would like to thank John Cooper, PhD, and Mai Nguyen, PhD, for assistance with project design and Augustus Anderson, Brennan Bouma and Tania Jordanova for assistance with plan coding and secondary data collection. Funding was provided by the United States Department of Agriculture’s National Institute of Food and Agriculture (UDSA NIFA) 2009-06143. The findings and conclusions in this report are those of the authors and do not necessarily represent the official position of the USDA.
References and Notes
- U.S. Census Bureau. Urban and Rural Classification. 2000. Available online: http://www.census.gov/geo/www/ua/ua_2k.html (accessed on 27 July 2012).
- Tickamyer, A.R.; Duncan, C.M. Poverty and opportunity structure in rural America. Annu. Rev. Sociol. 1990, 16, 67–86. [Google Scholar] [CrossRef]
- Glasgow, N. Rural/urban patterns of aging and caregiving in the United States. J. Fam. Issues 2000, 21, 611–631. [Google Scholar] [CrossRef]
- Jones, S.S.; Evans, R.S.; Allen, T.L.; Thomas, A.; Haug, P.J.; Welch, S.J.; Snow, G.L. A multivariate time series approach to modeling and forecasting demand in the emergency department. J. Biomed. Inform. 2009, 42, 123–139. [Google Scholar] [CrossRef]
- Saenz, R.; Peacock, W.G. Rural people, rural places: The hidden costs of Hurricane Katrina. Rural Realities 2006, 1(2), 1–11. [Google Scholar]
- Flora, C.B. Rural Communities: Legacy & Change; Westview Press: Boulder, CO, USA, 1992. [Google Scholar]
- Berke, P.; Cooper, J.; Salvesen, D.; Spurlock, D.; Rausch, C. Disaster plans: Challenges and choices to build the resiliency of vulnerable populations. IJMED 2010, 28, 368–394. [Google Scholar]
- Coppola, D.P. Introduction to International Disaster Management; Butterworth-Heinemann: Burlington, MA, USA, 2011. [Google Scholar]
- Cutter, S. Exposed Social Vulnerability and Climate Change in the US Southeast; OXFAM America: Washington, DC, USA, 2009. Available online: http://adapt.oxfamamerica.org/resources/Exposed_Report.pdf (accessed on 3 February 2012).
- Cross, J.A. Megacities and small towns: Different perspectives on hazard vulnerability. Global Environmental Change Part B: Environmental Hazards 2001, 3, 63–80. [Google Scholar] [CrossRef]
- Miller, K.S.; Simile, C. They Could See the Stars From Their Beds: The Plight of The Rural Poor in the Aftermath of Hurricane Hugo. Preliminary Paper #175. University of Delaware Disaster Research Center: Newark, DE, USA, 1992. [Google Scholar]
- Morrow, B.H.; Peacock, W.G. Disasters and social change: Hurricane Andrew and the reshaping of Miami? In Hurricane Andrew: Ethnicity, Gender, and the Sociology of Disasters; Peacock, W.G., Morrow, B.H., Gladwin, H., Eds.; Routledge: London, UK, 1997. [Google Scholar]
- Tootle, D.M. Disaster recovery in rural communities: A case study of Southwest Louisiana. Southern Rural Sociology 2007, 22(2), 6–27. [Google Scholar]
- Hsu, C.E.; Mas, F.S.; Jacobson, H.E.; Harris, A.M.; Hunt, V.I.; Nkhoma, E.T. Public health preparedness of health providers: Meeting the needs of diverse, rural communities. J. Natl. Med. Assoc. 2006, 98(11), 1784–1791. [Google Scholar]
- Elliot, J.R.; Pais, J. When nature pushes back: Environmental impact and the spatial redistribution of socially vulnerable populations. Soc. Sci. Quart. 2010, 91(5), 1187–1202. [Google Scholar] [CrossRef]
- Tierney, K.J. Facing the Unexpected : Disaster Preparedness and Response in the United States; Lindell, M.K., Perry, R.W., Eds.; Joseph Henry Press: Washington, DC, USA, 2001. [Google Scholar]
- Godschalk, D.R. Natural Hazard Mitigation: Recasting Disaster Policy and Planning; Island Press: Washington, DC, USA, 1999. [Google Scholar]
- Berke, P.; Cooper, J.; Salvesen, D.; Spurlock, D.; Rausch, C. Building capacity for disaster resiliency in six disadvantaged communities. Sustainability 2010, 3, 1–20. [Google Scholar]
- Berke, P.; Godschalk, D.R.; Kaiser, E.J.; Rodríguez, D.A. Urban land use planning; University of Illinois Press: Urbana, OH, USA, 2006. [Google Scholar]
- Berke, P.; Smith, G.; Lyles, W. Disasters, Coastal Infrastructure and Emergency Management; Grant from the Department of Homeland Security to the University of North Carolina at Chapel Hill Center for the Study of Natural Disasters and Hazards; University of North Carolina: Chapel Hill, NC, USA, 2011. [Google Scholar]
- Berke, P.; Smith, G.; Lyles, W. Planning for resiliency: An evaluation of state hazard mitigation plans under the Disaster Mitigation Act. Nat. Hazard. Rev. (in press).
- Tang, Z.H.; Lindell, M.K.; Prater, C.S.; Brody, S.D. Measuring tsunami planning capacity on the U.S. Pacific Coast. Nat. Hazard. Rev. 2008, 9(2), 91–100. [Google Scholar]
- Reynnells, L.; John, P. L-C. What is Rural?USDA Rural Information Center: Beltsville,MD,USA, 2008. Available online: http://www.nal.usda.gov/ric/ricpubs/what_is_rural.shtml (accessed on 15 September 2011).
- Parker, T. Measuring Rurality: Rural-Urban Continuum Codes; US Department of Agriculture: Washington, DC, USA, 2012. Available online: http://www.ers.usda.gov/data-products/rural-urban-continuum-codes.aspx (accessed on 10 August 2012).
- Salvesen, D. An Integrated Conception for Community Resilience; Grant from the Department of Homeland Security to the University of Maryland Center for the Study of Terrorism and Response to Terrorism; University of North Carolina at Chapel Hill: Chapel Hill, NC, USA, 2011. [Google Scholar]
- Berke, P.; David, G. Searching for the good plan. J. Plan. Lit. 2009, 23, 227–240. [Google Scholar] [CrossRef]
- Nelson, A.C.; French, S.P. Plan quality and mitigating damage from natural disasters: A case study of the Northridge earthquake with planning policy considerations. J. Am. Plann. Assoc. 2002, 68, 194–207. [Google Scholar] [CrossRef]
- Brody, S.D.; Godschalk, D.R.; Burby, R.J. Mandating citizen participation in plan making: Six strategic planning choices. J. Am. Plann. Assoc. 2003, 69, 245–264. [Google Scholar] [CrossRef]
- Miles, M.B.; Huberman, A.M. Qualitative Data Analysis: An Expanded Sourcebook; Sage: Newbury Park, CA, USA, 1994. [Google Scholar]
- Allison, P.D. Fixed Effects Regression Methods for Longitudinal Data Using SAS; SAS Institute: Cary, NC, USA, 2005. [Google Scholar]
- Cameron, A.C.; Trivedi, P.K. Regression Analysis of Count Data; Cambridge University Press: New York, NY, USA, 1998. [Google Scholar]
- Berke, P.; Smith, G.; Lyles, W.; Reynolds, S. Local Mitigation Planning: Do Plans Advance Community Resiliency? Natural Hazards Center, University of Colorado: Boulder, CO, USA, 2011. Available online: http://colorado.edu/hazards/workshop/2011/abstracts/index.html (accessed on 9 January 2012).
- Greenland, S. Randomization, statistics, and causal inference. Epidemiology 1990, 1, 421–429. [Google Scholar] [CrossRef]
© 2012 by the authors; licensee MDPI, Basel, Switzerland. This article is an open-access article distributed under the terms and conditions of the Creative Commons Attribution license (http://creativecommons.org/licenses/by/3.0/).