Challenges and Opportunities in Developing Sustainable Communities in the North West of England


Abstract
:1. Introduction
1.1. Sustainable Development and Sustainable Communities

| Priorities for sustainable development |
|---|
|
| Objectives for the planning system |
|---|
|
| Strategic objectives for the housing policy |
|---|
|
1.2. Indicators and Performance Requirements
| Targets |
|
| Areas of local quality of life indicators |
|
| Areas for improvement (quality of life indicators being addressed are listed in brackets) |
|
2. Methodology
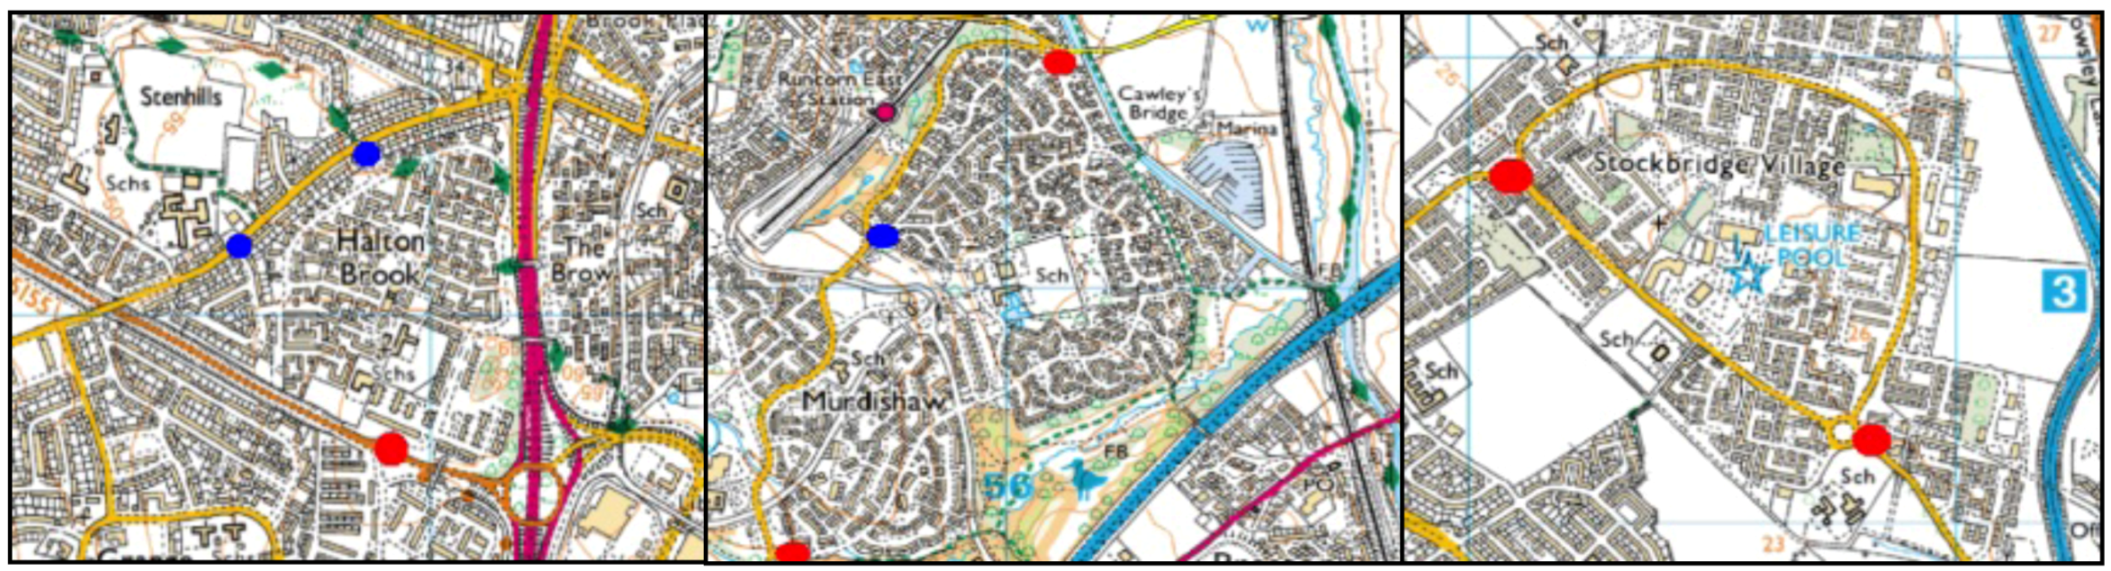
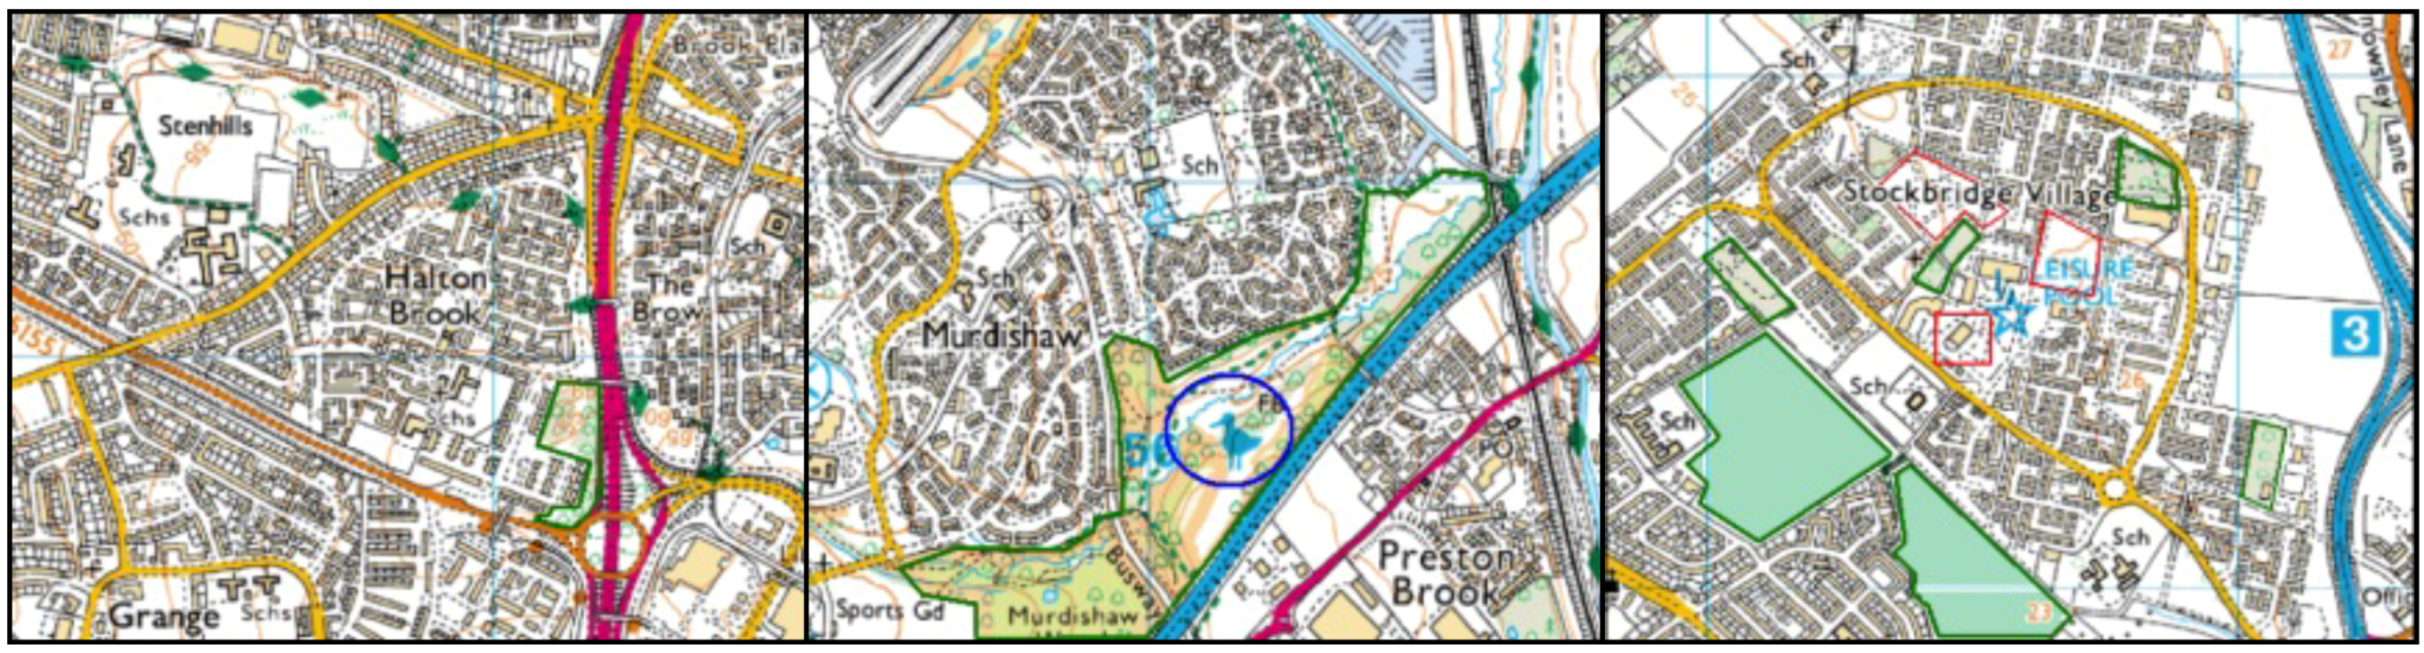
2.1. Case Study Areas and Their Status
3. Results and Discussion
3.1. Data Obtained through Statistical Analysis
3.1.1. Community Cohesion and Involvement
3.1.2. Community Safety
3.1.3. Culture and Leisure
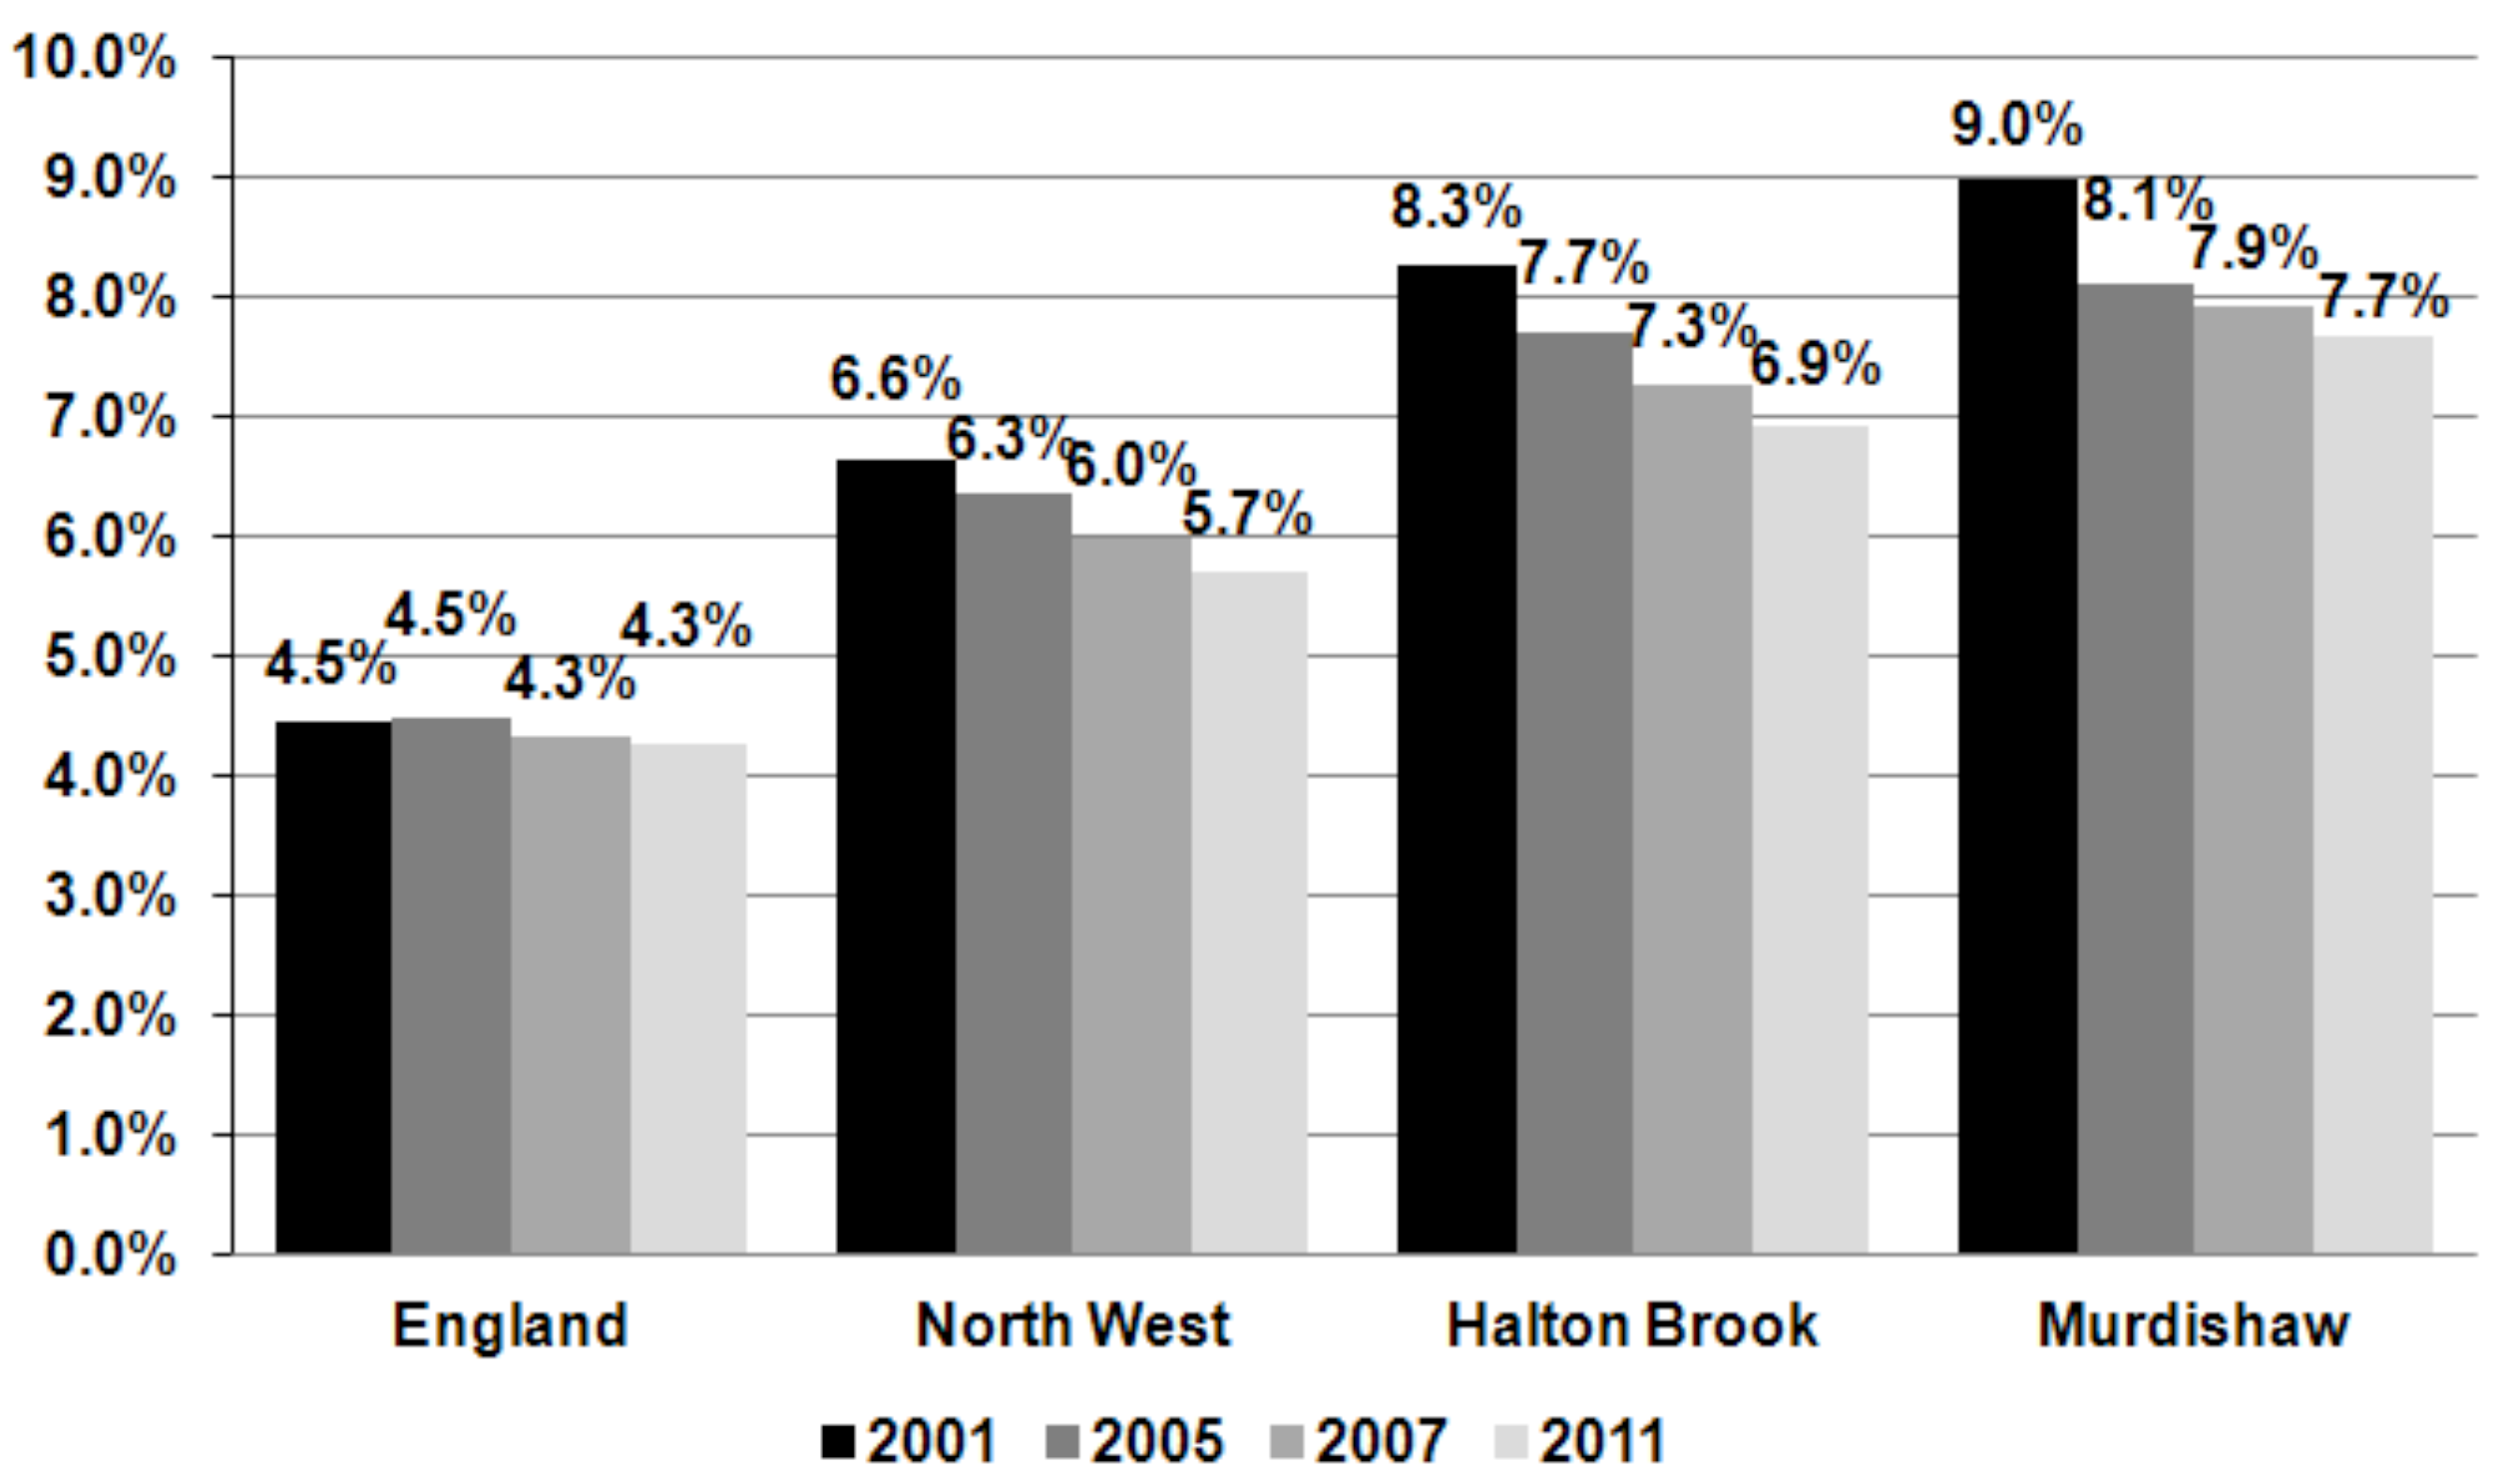
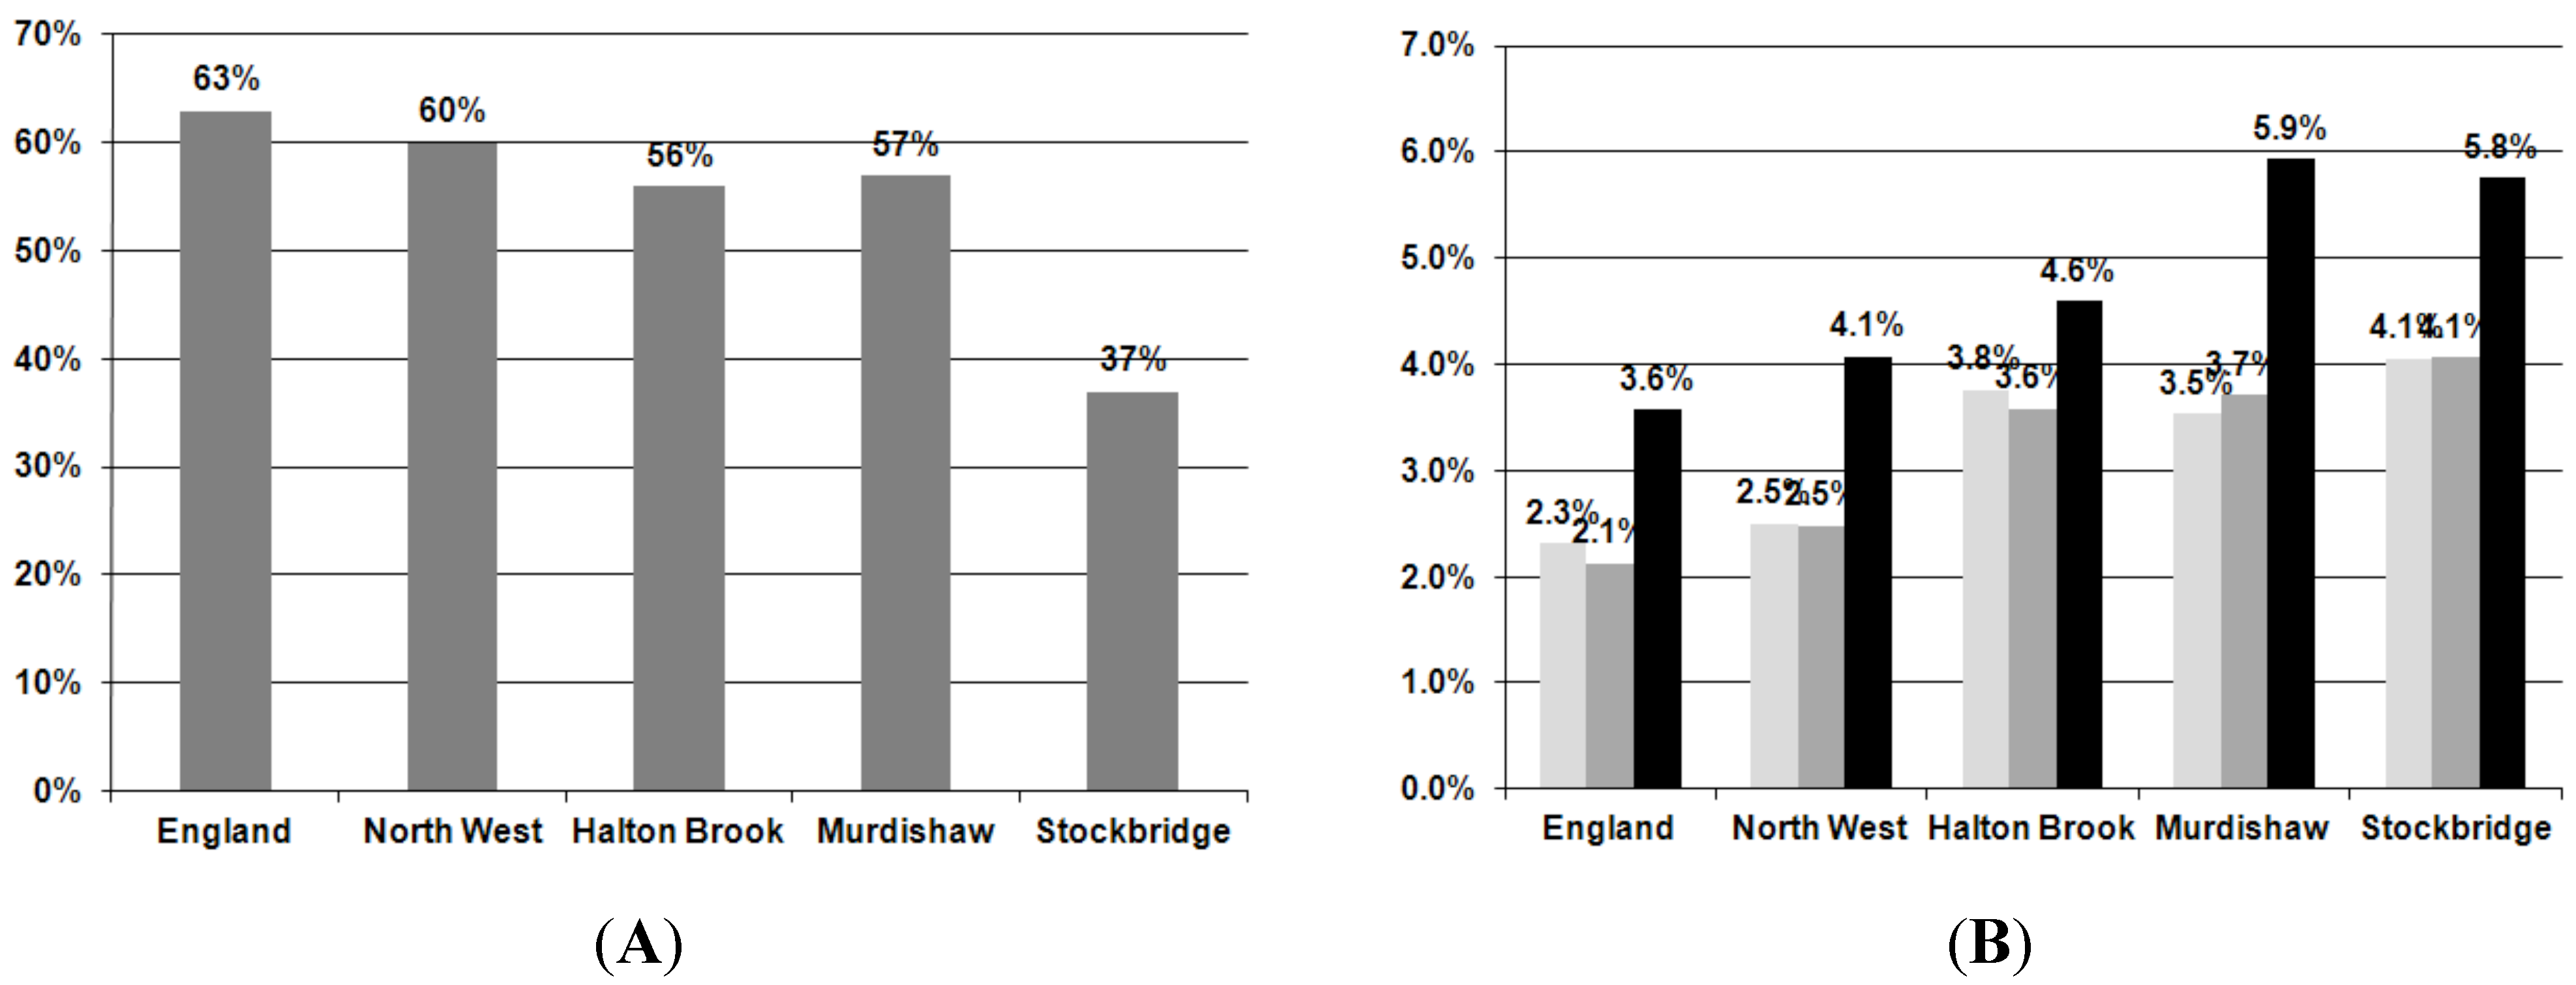
3.1.4. Economic Well-Being
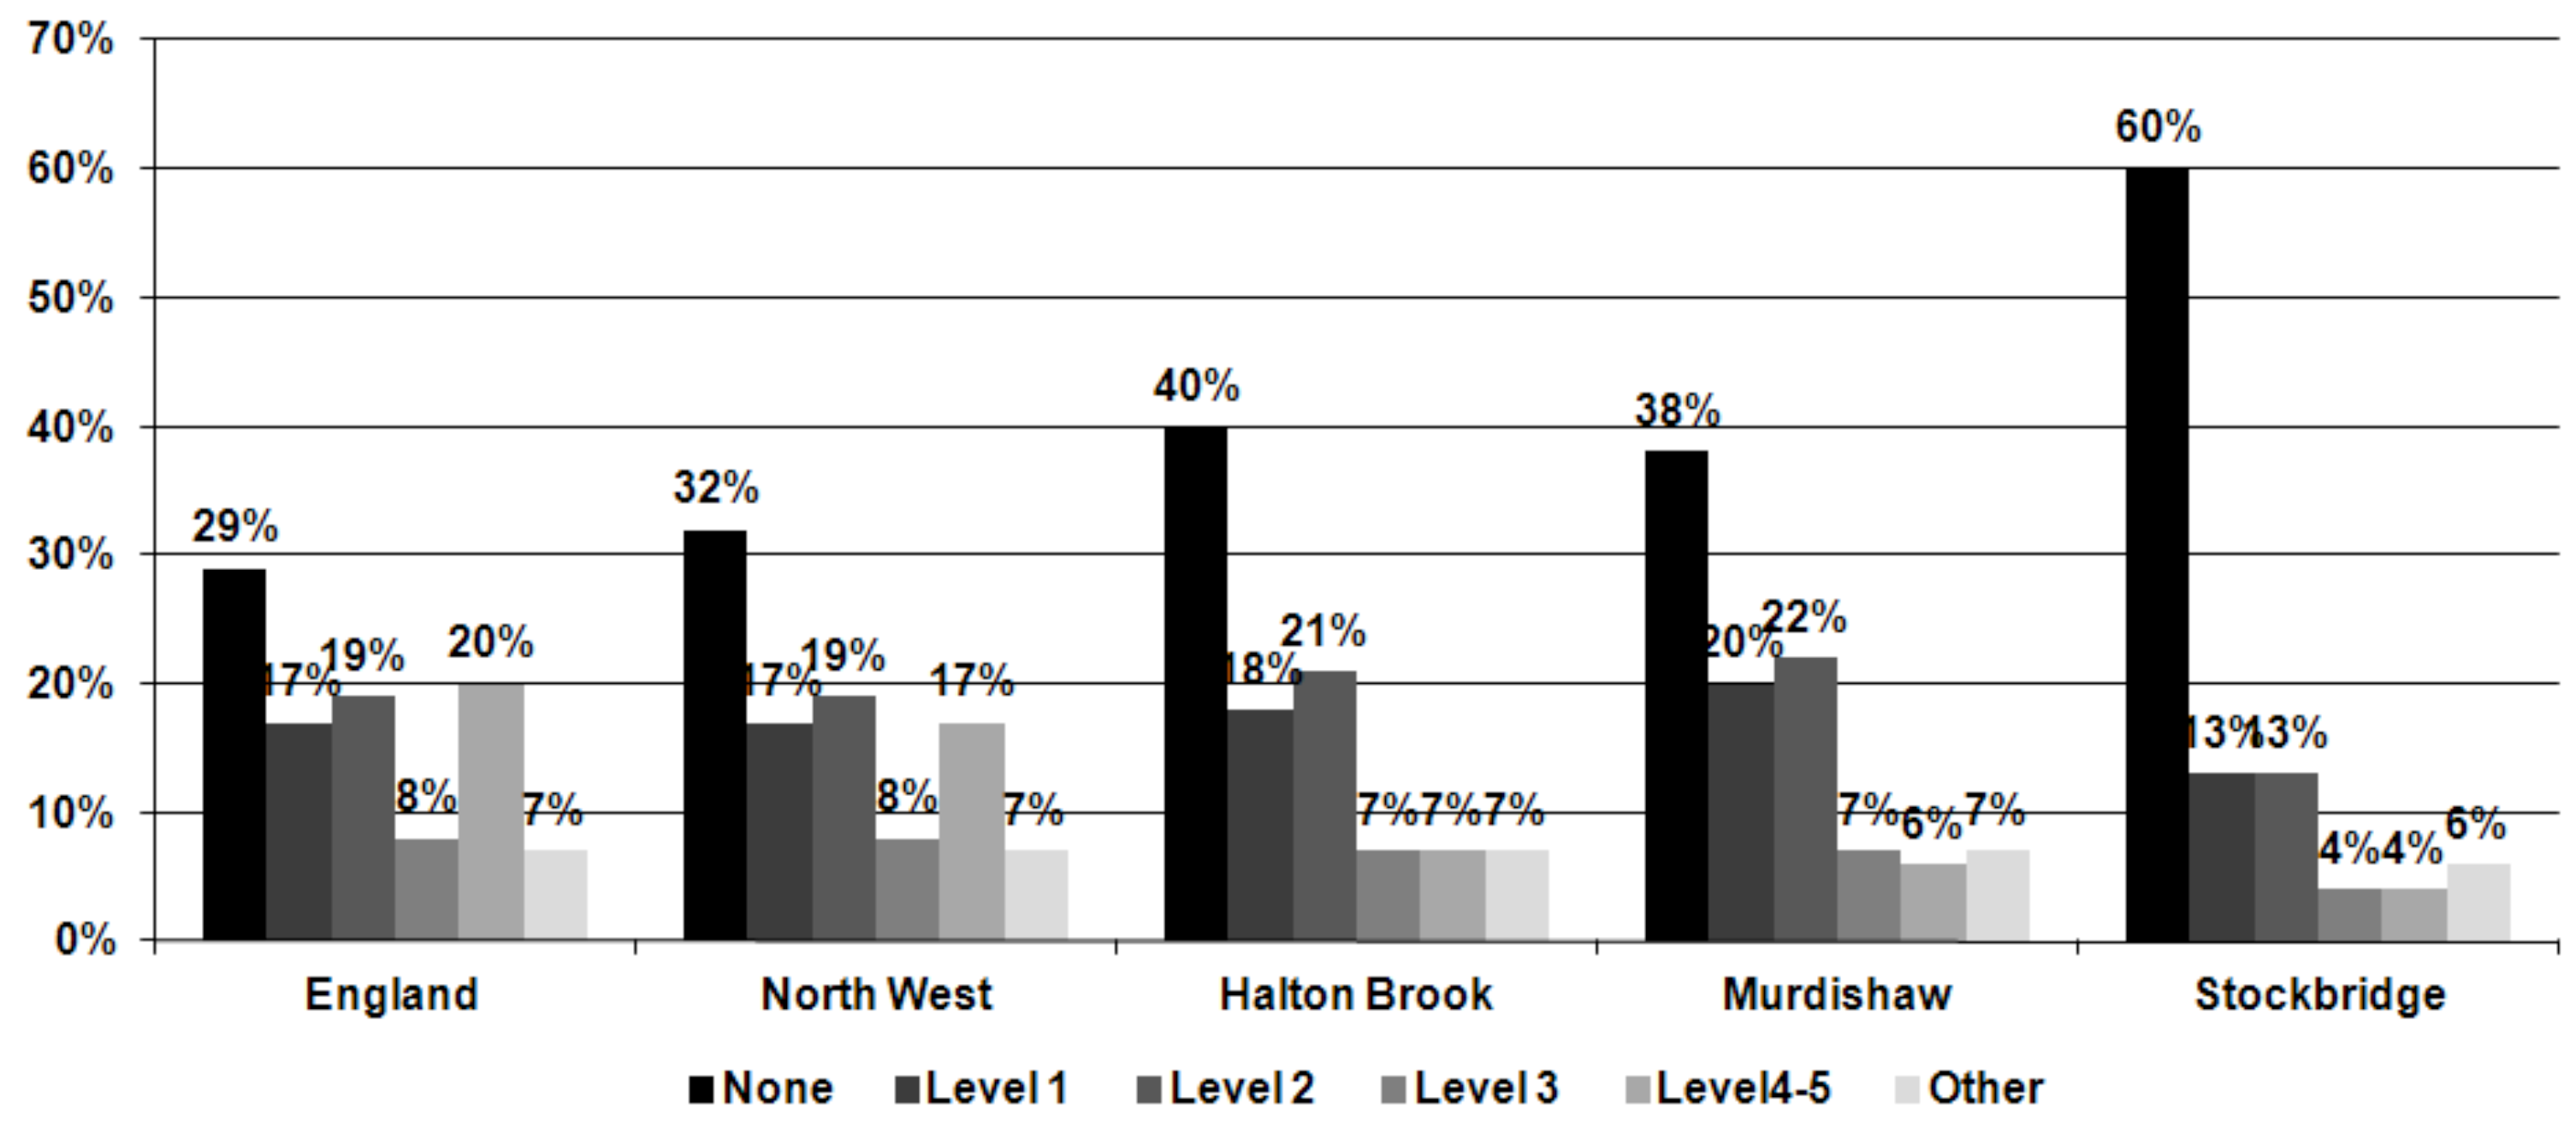
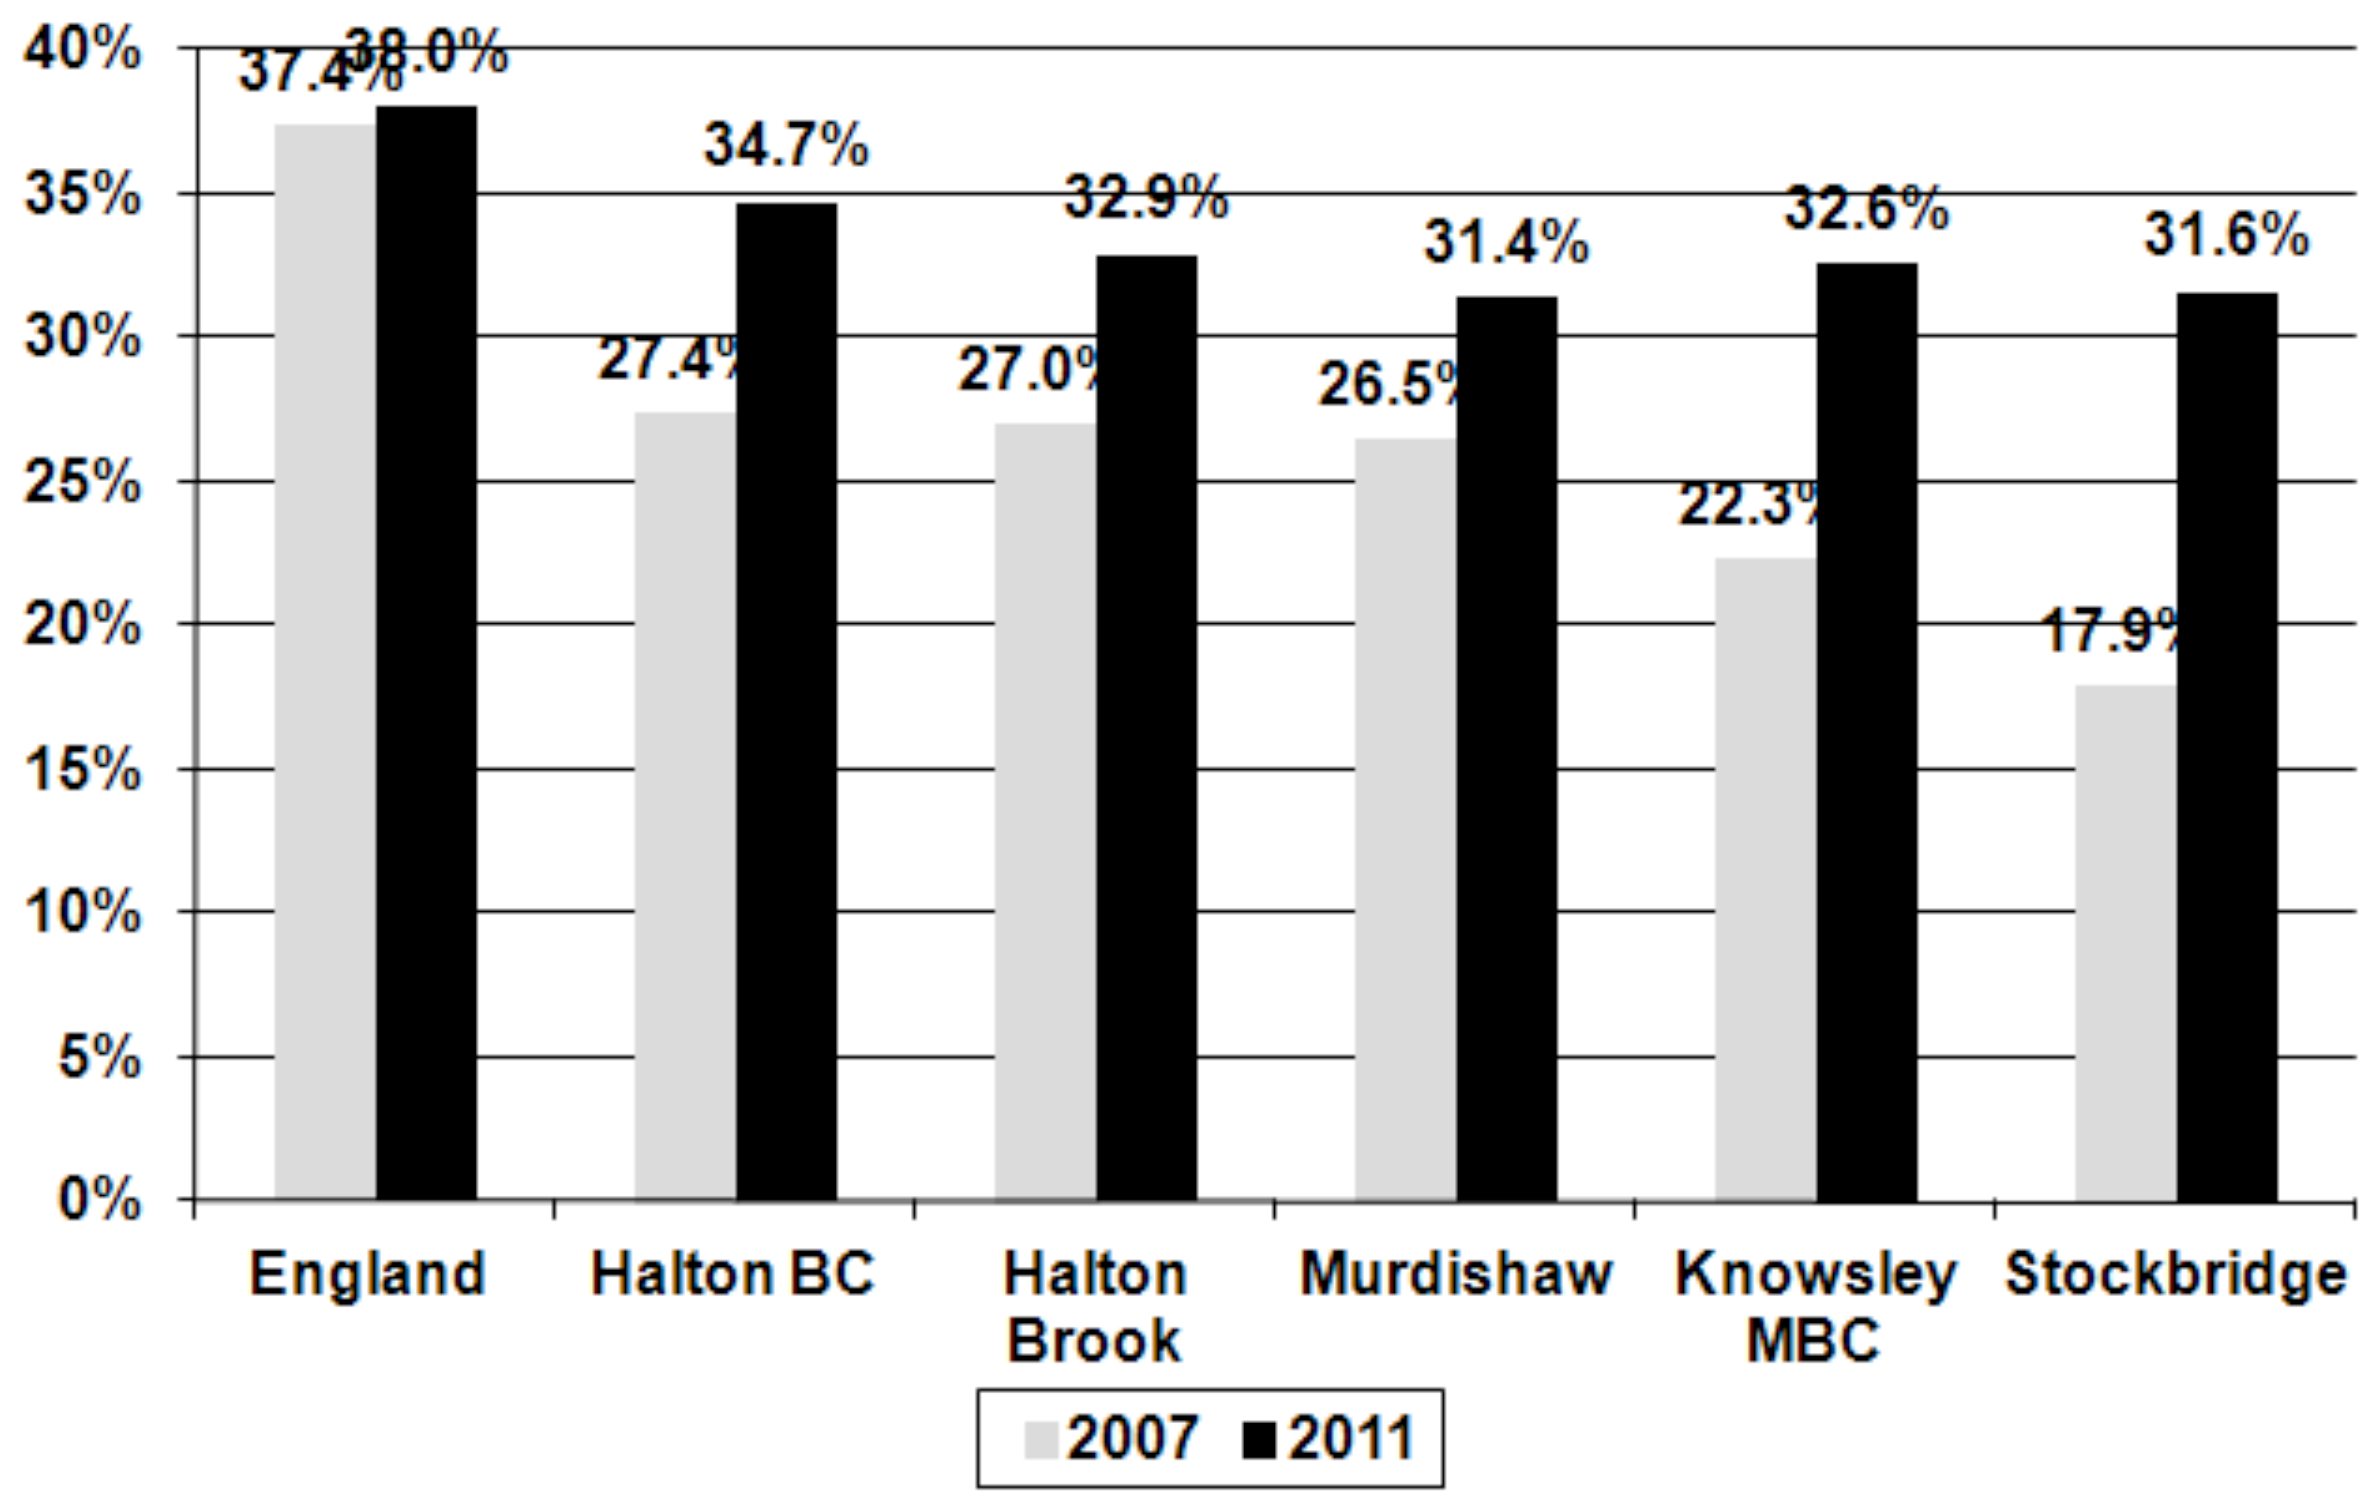
3.1.5. Education and Life-Long Learning

3.1.6. Environment
3.1.7. Health and Social Well-Being
| Indicator | Halton BC | Knowsley MBC | England | England Worst |
|---|---|---|---|---|
| Teenage pregnancy | 45.1 | 45.7 | 42.1 | 95.3 |
| Binge drinking adults | 23.8 | 25 | 18.2 | 29.2 |
| Healthy eating adults | 15.3 | 11.4 | 23.8 | 11.4 |
| Life expectancy (male) | 74.5 | 73.9 | 76.9 | 72.5 |
| Life expectancy (female) | 78.3 | 78.4 | 81.1 | 78.1 |
| Deaths from smoking | 327.2 | 366.5 | 234.4 | 366.5 |
| Infant deaths | 6.2 | 4.9 | 5.1 | 9.9 |
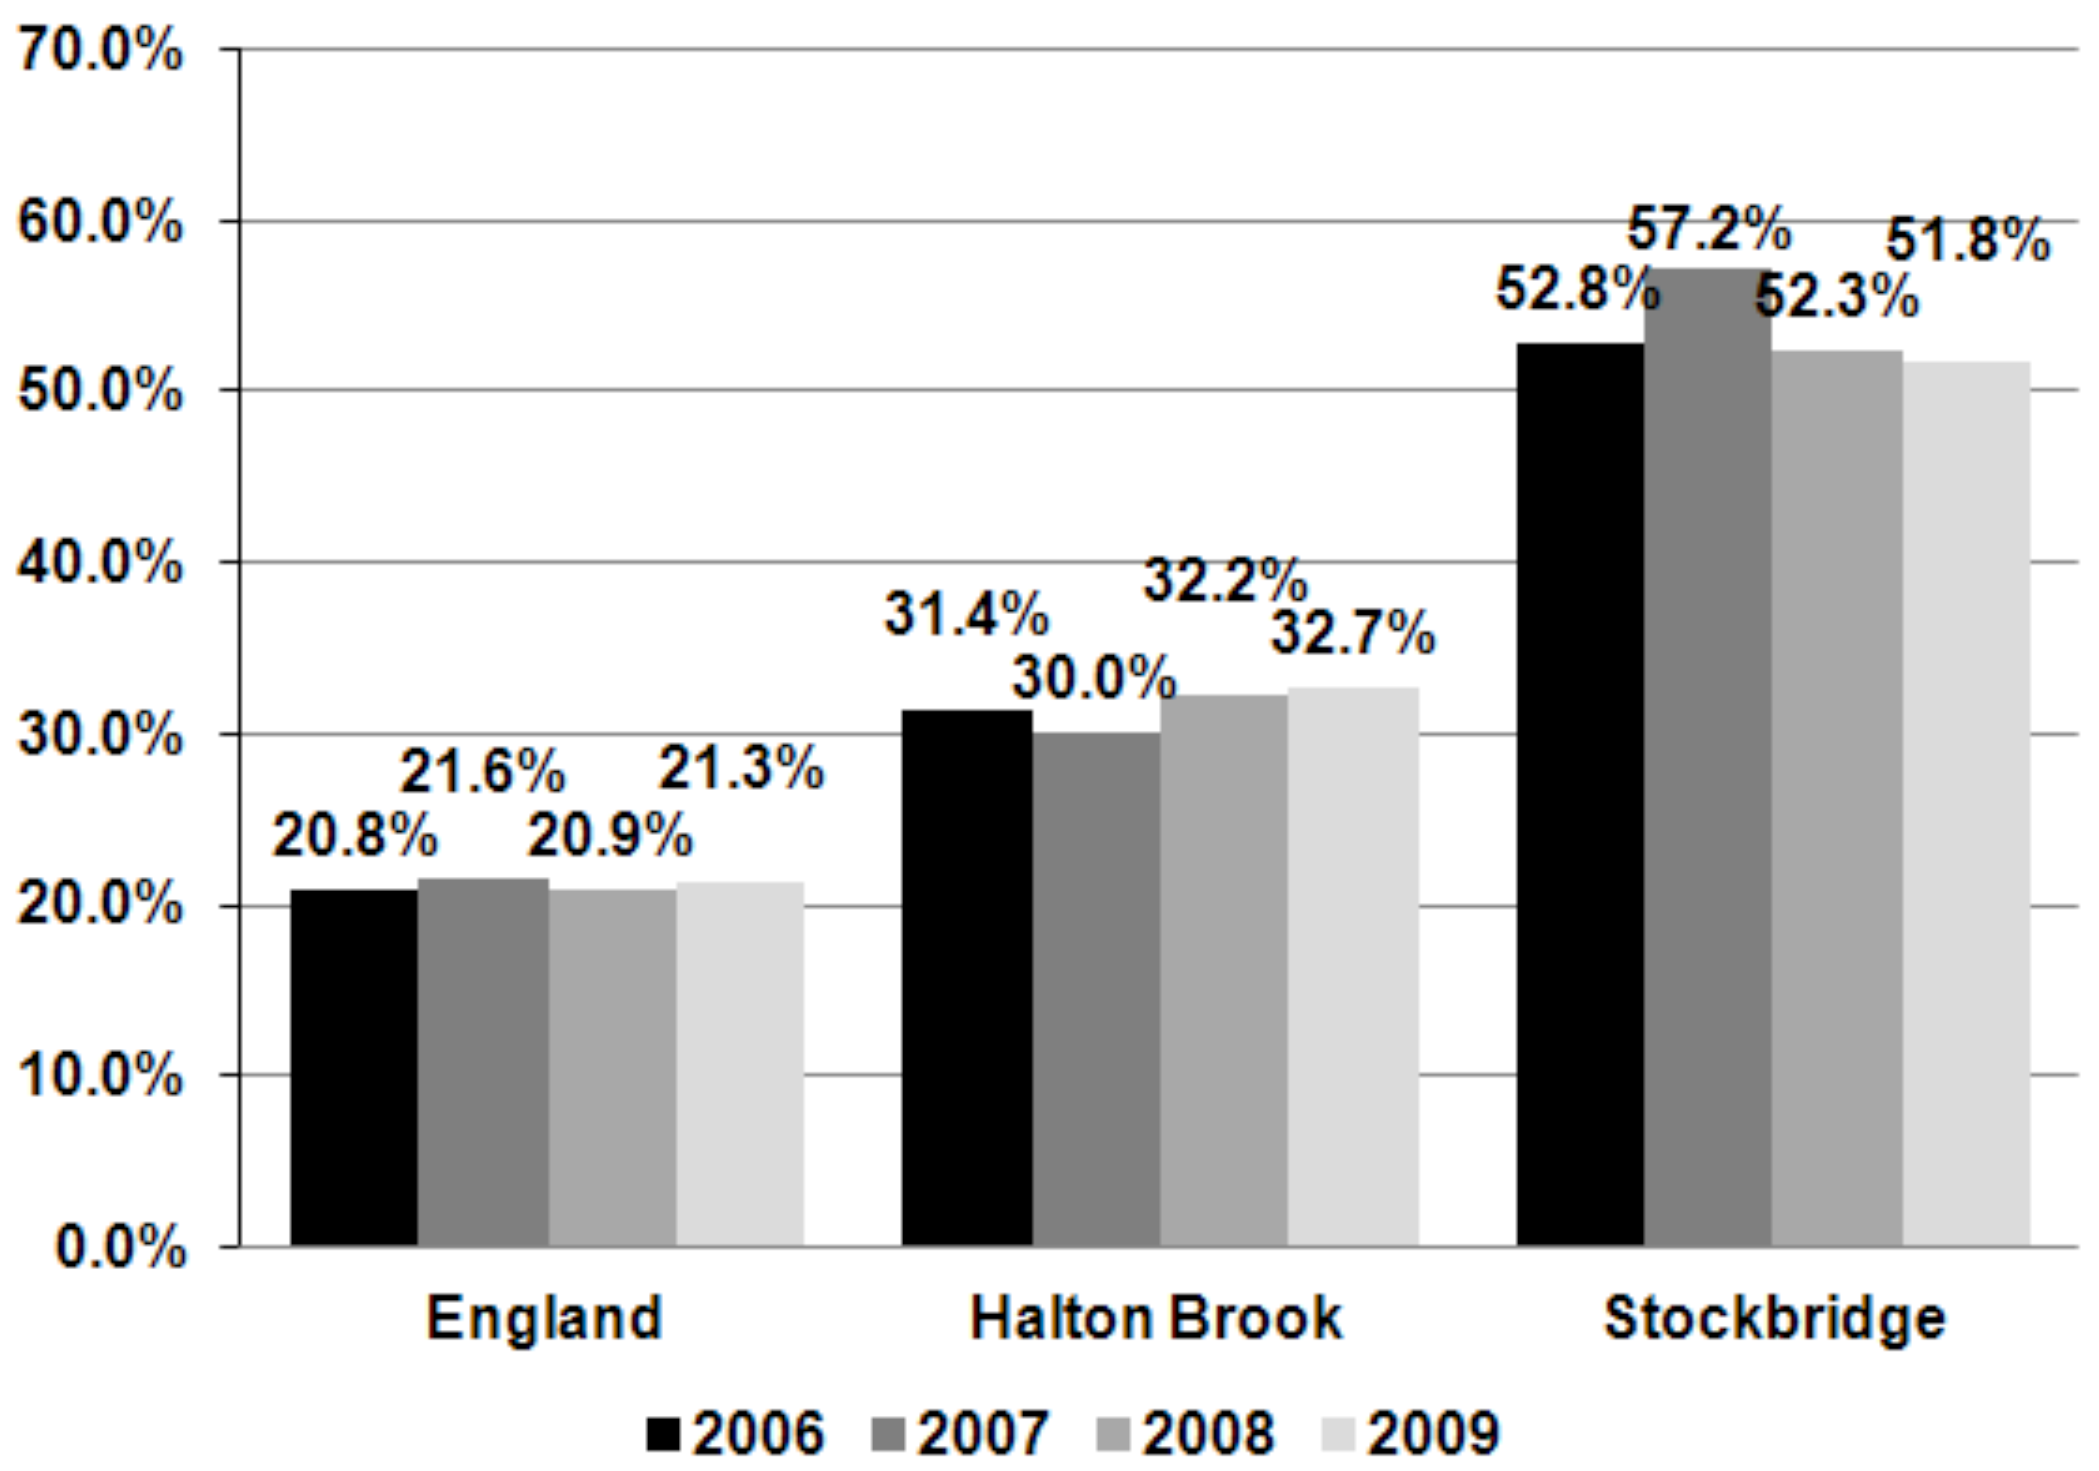

3.1.8. Housing
3.1.9. Transport and Access
3.2. Data Obtained through Questionnaire

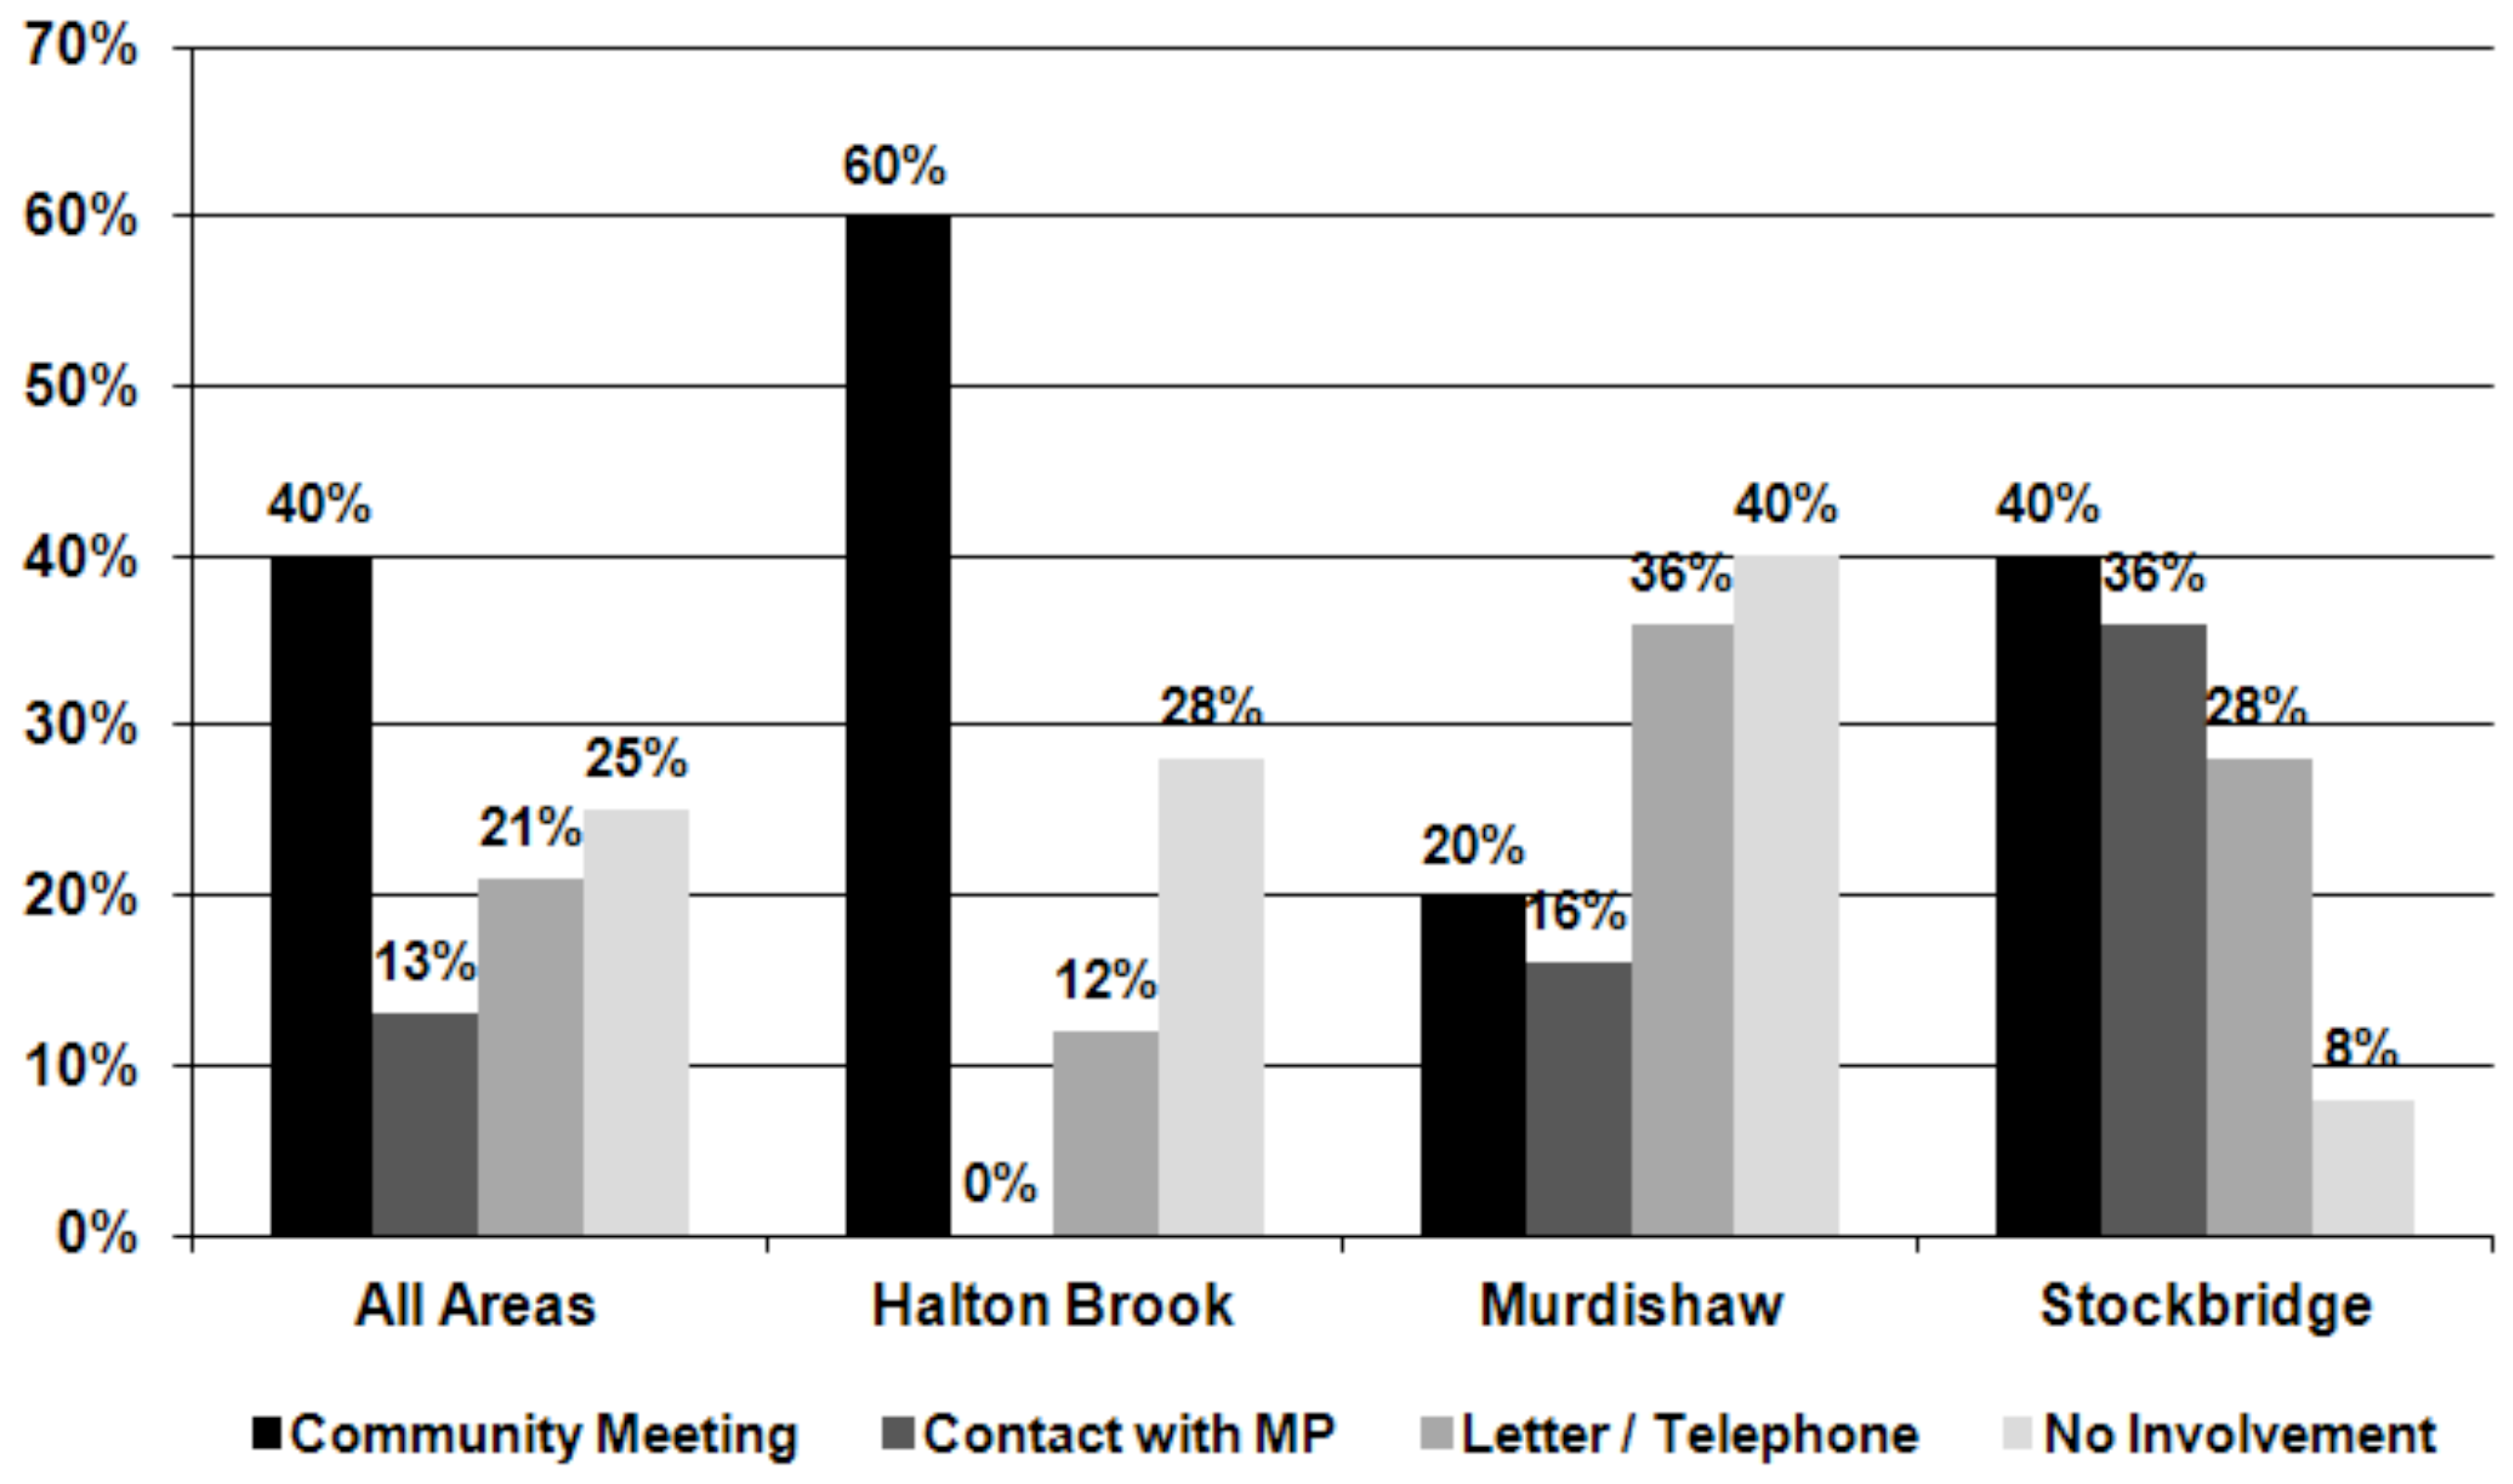
3.2.1. Community Cohesion and Involvement
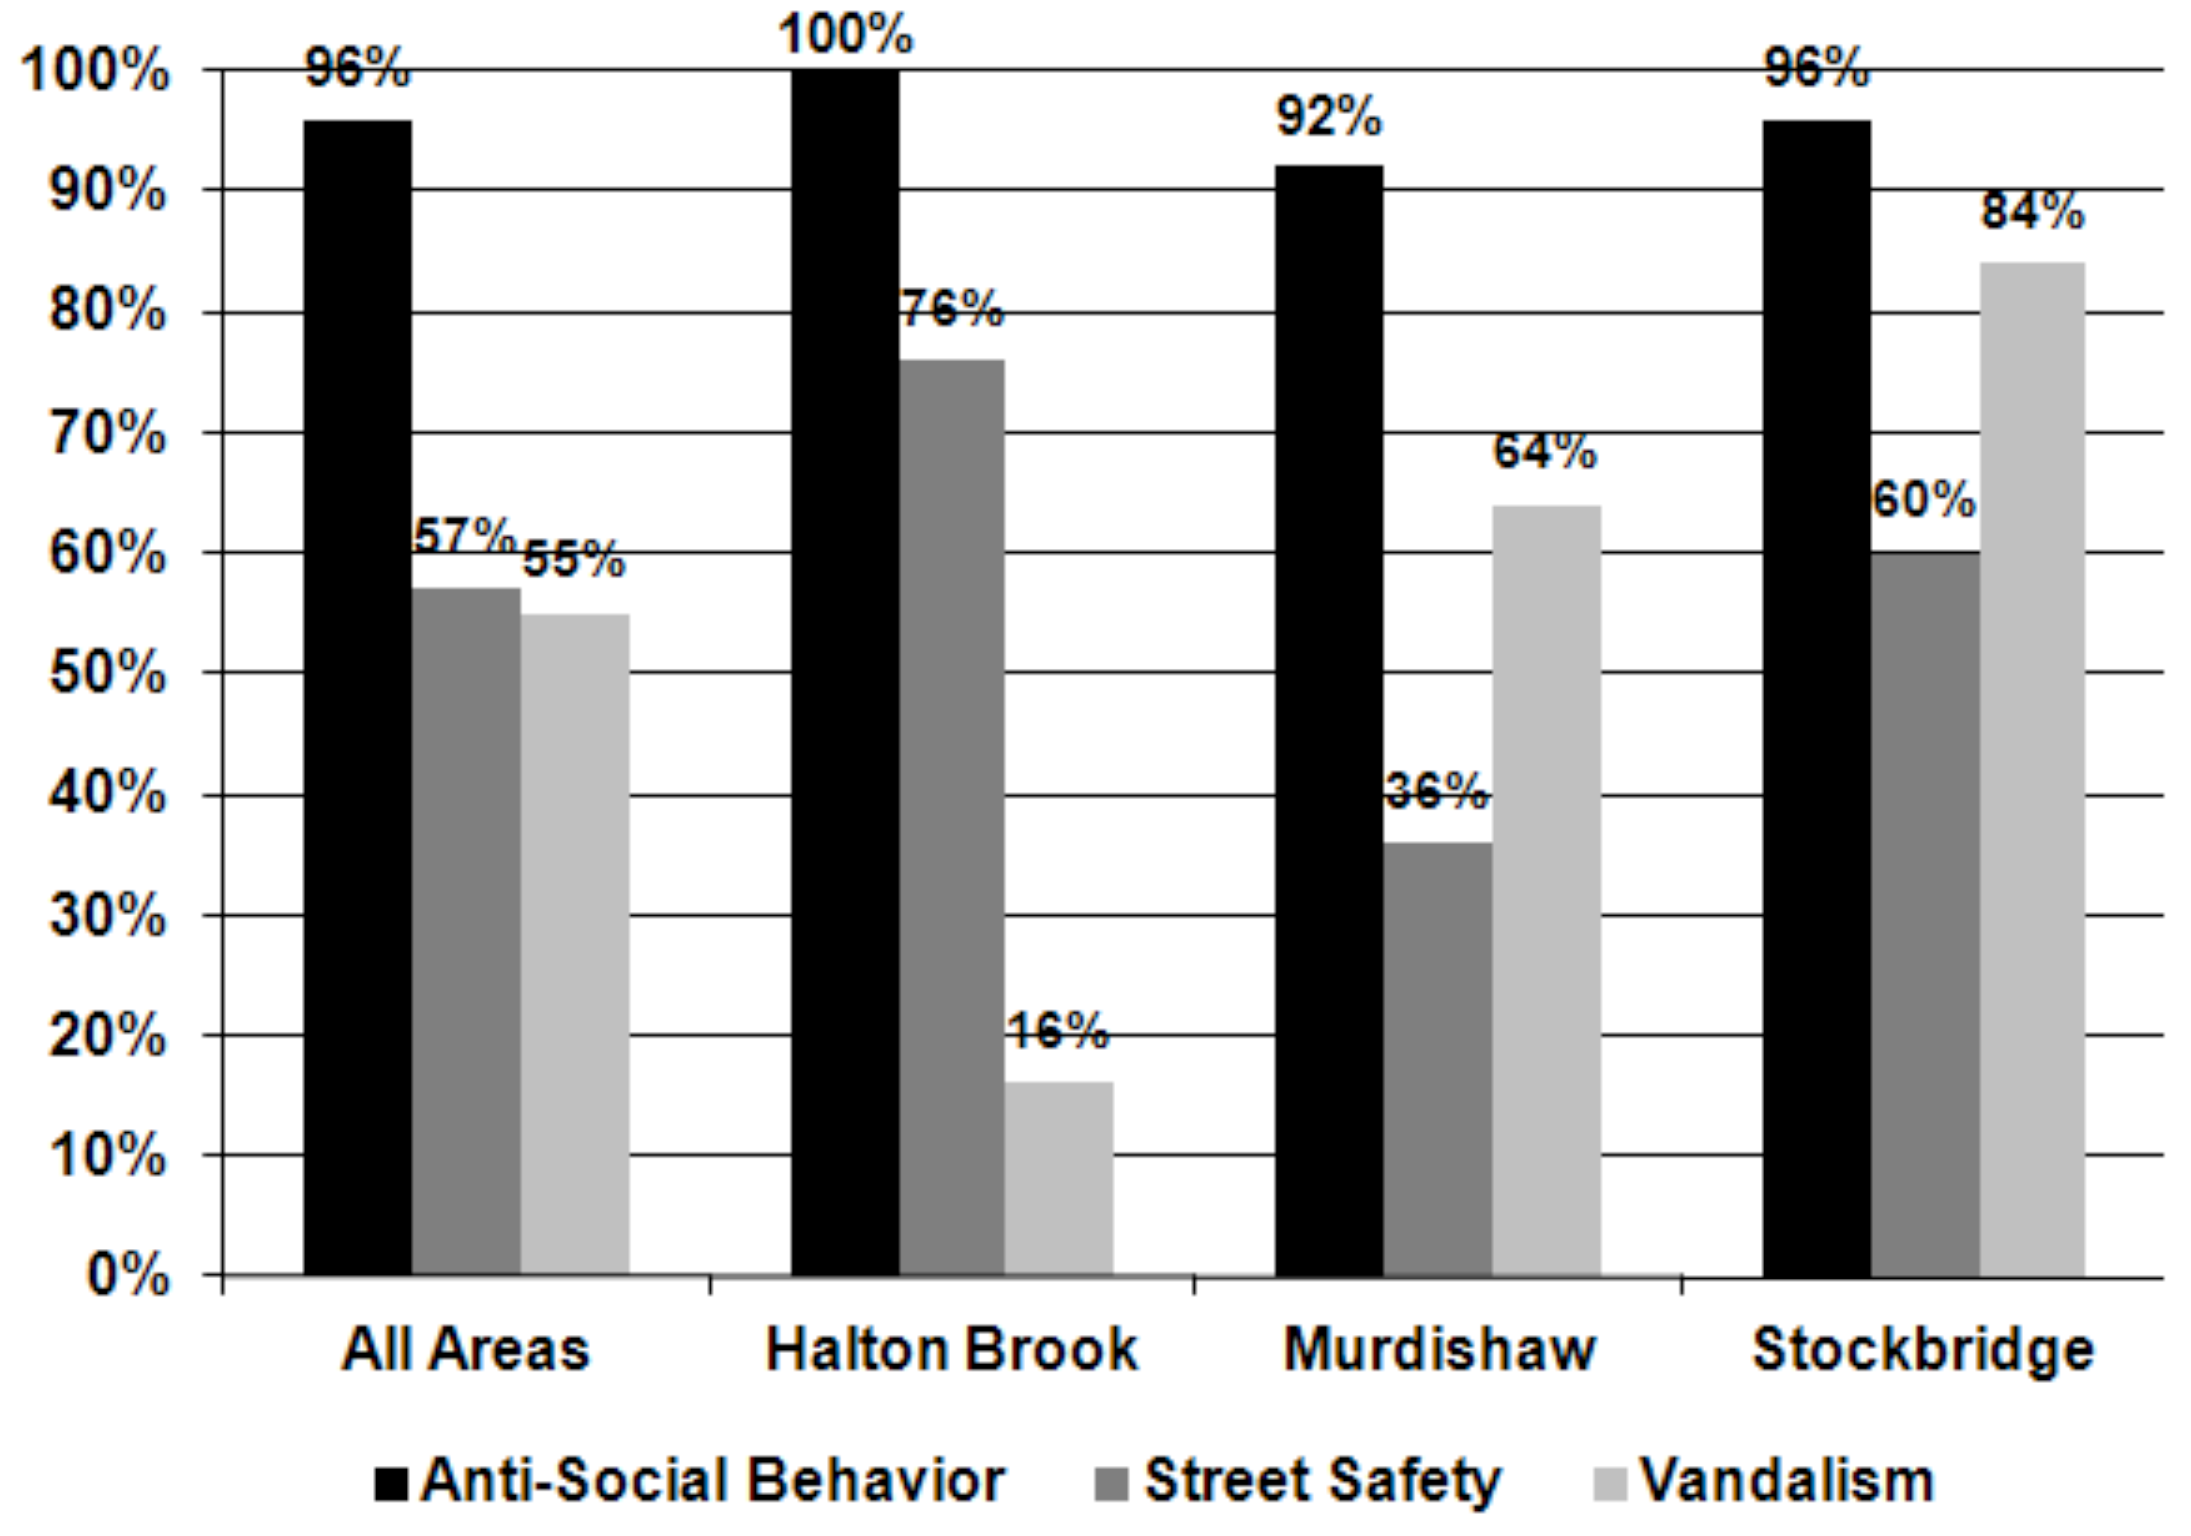
3.2.2. Community Safety

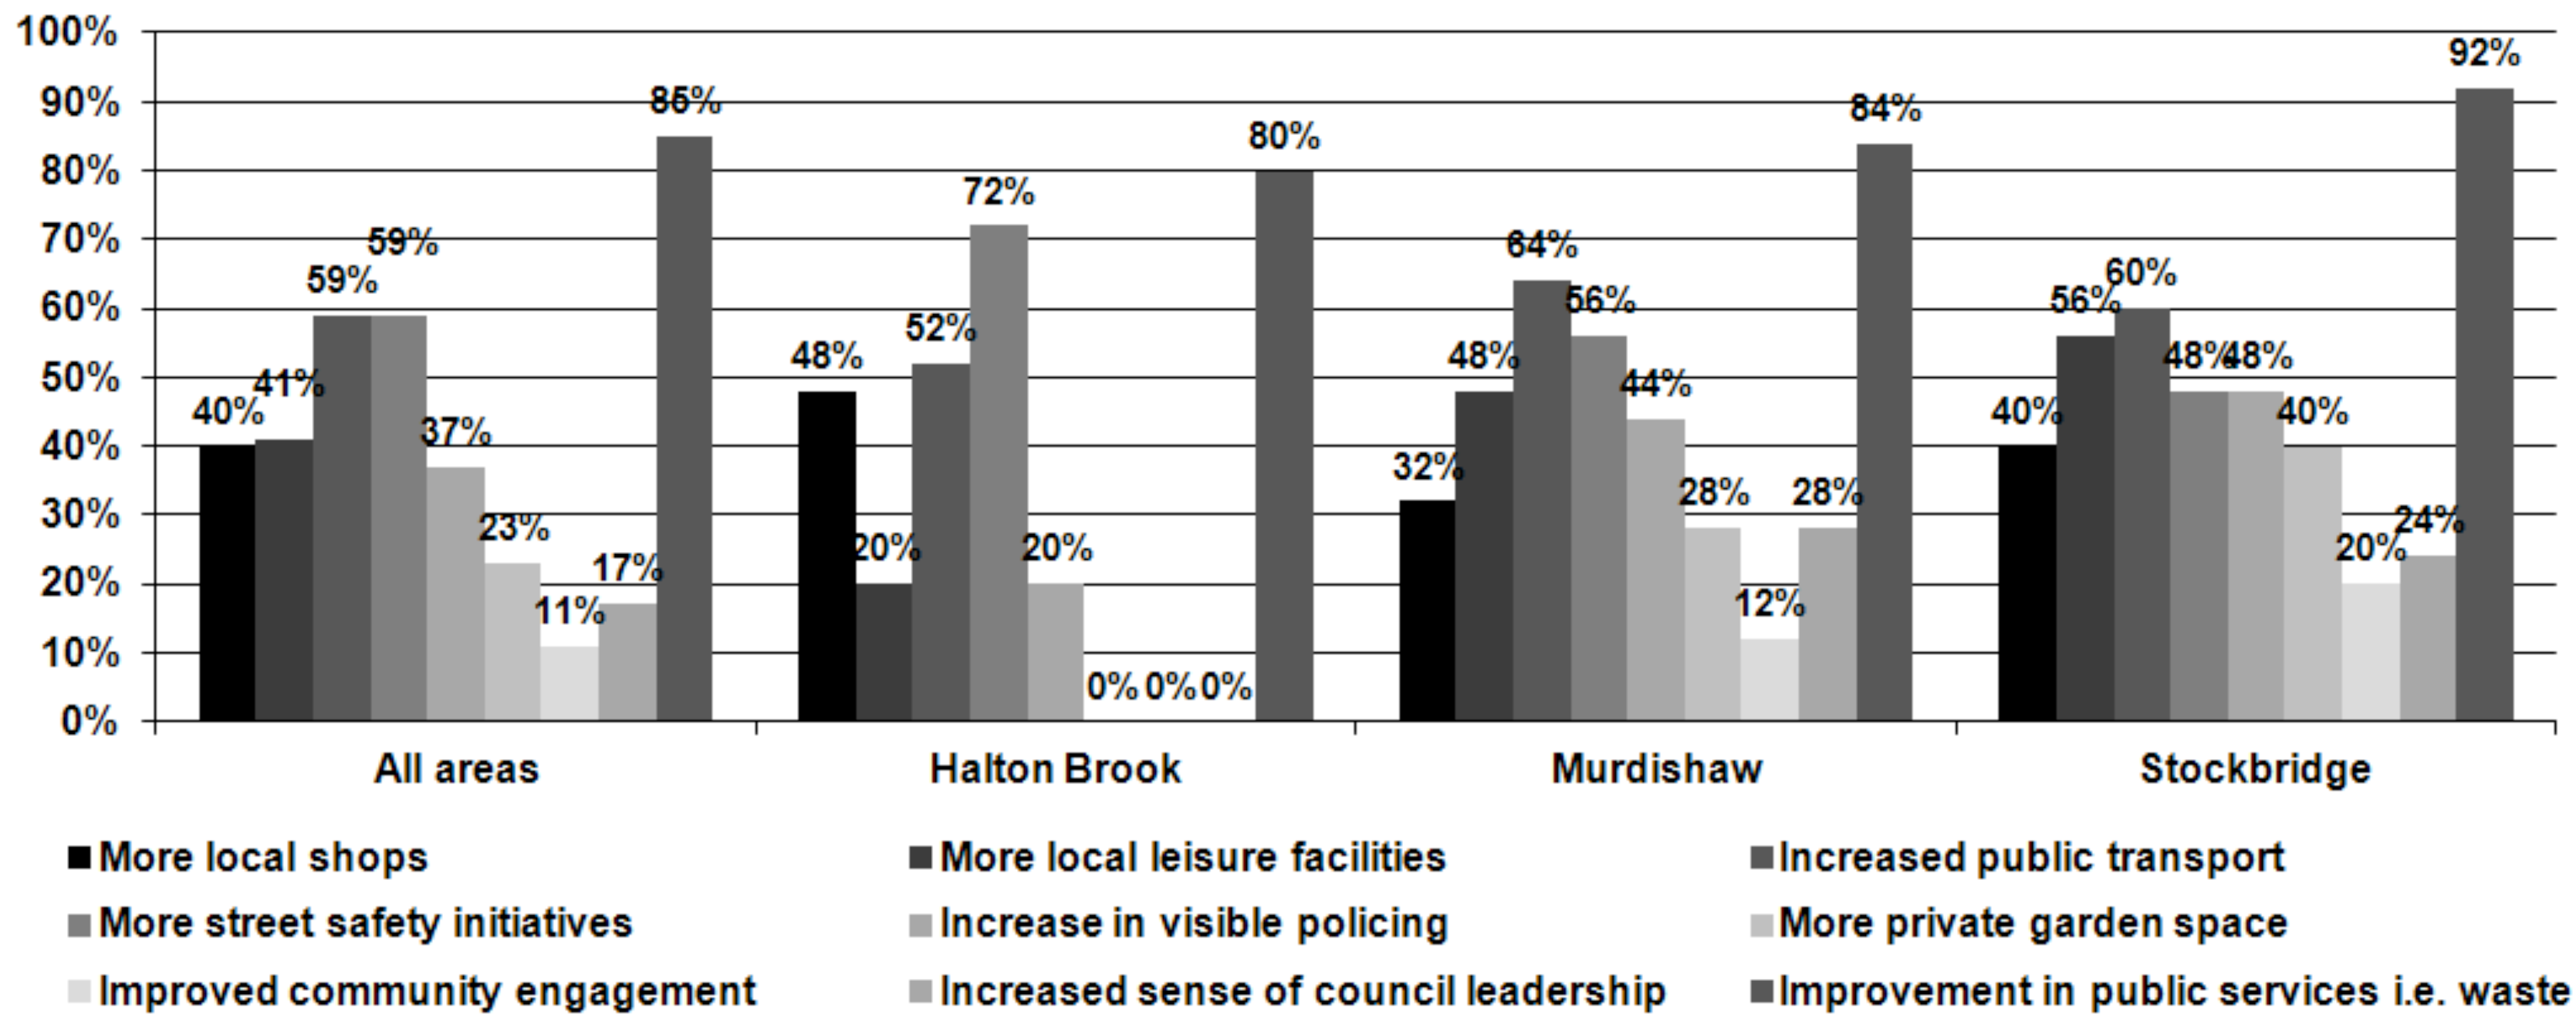
3.2.3. Culture and Leisure
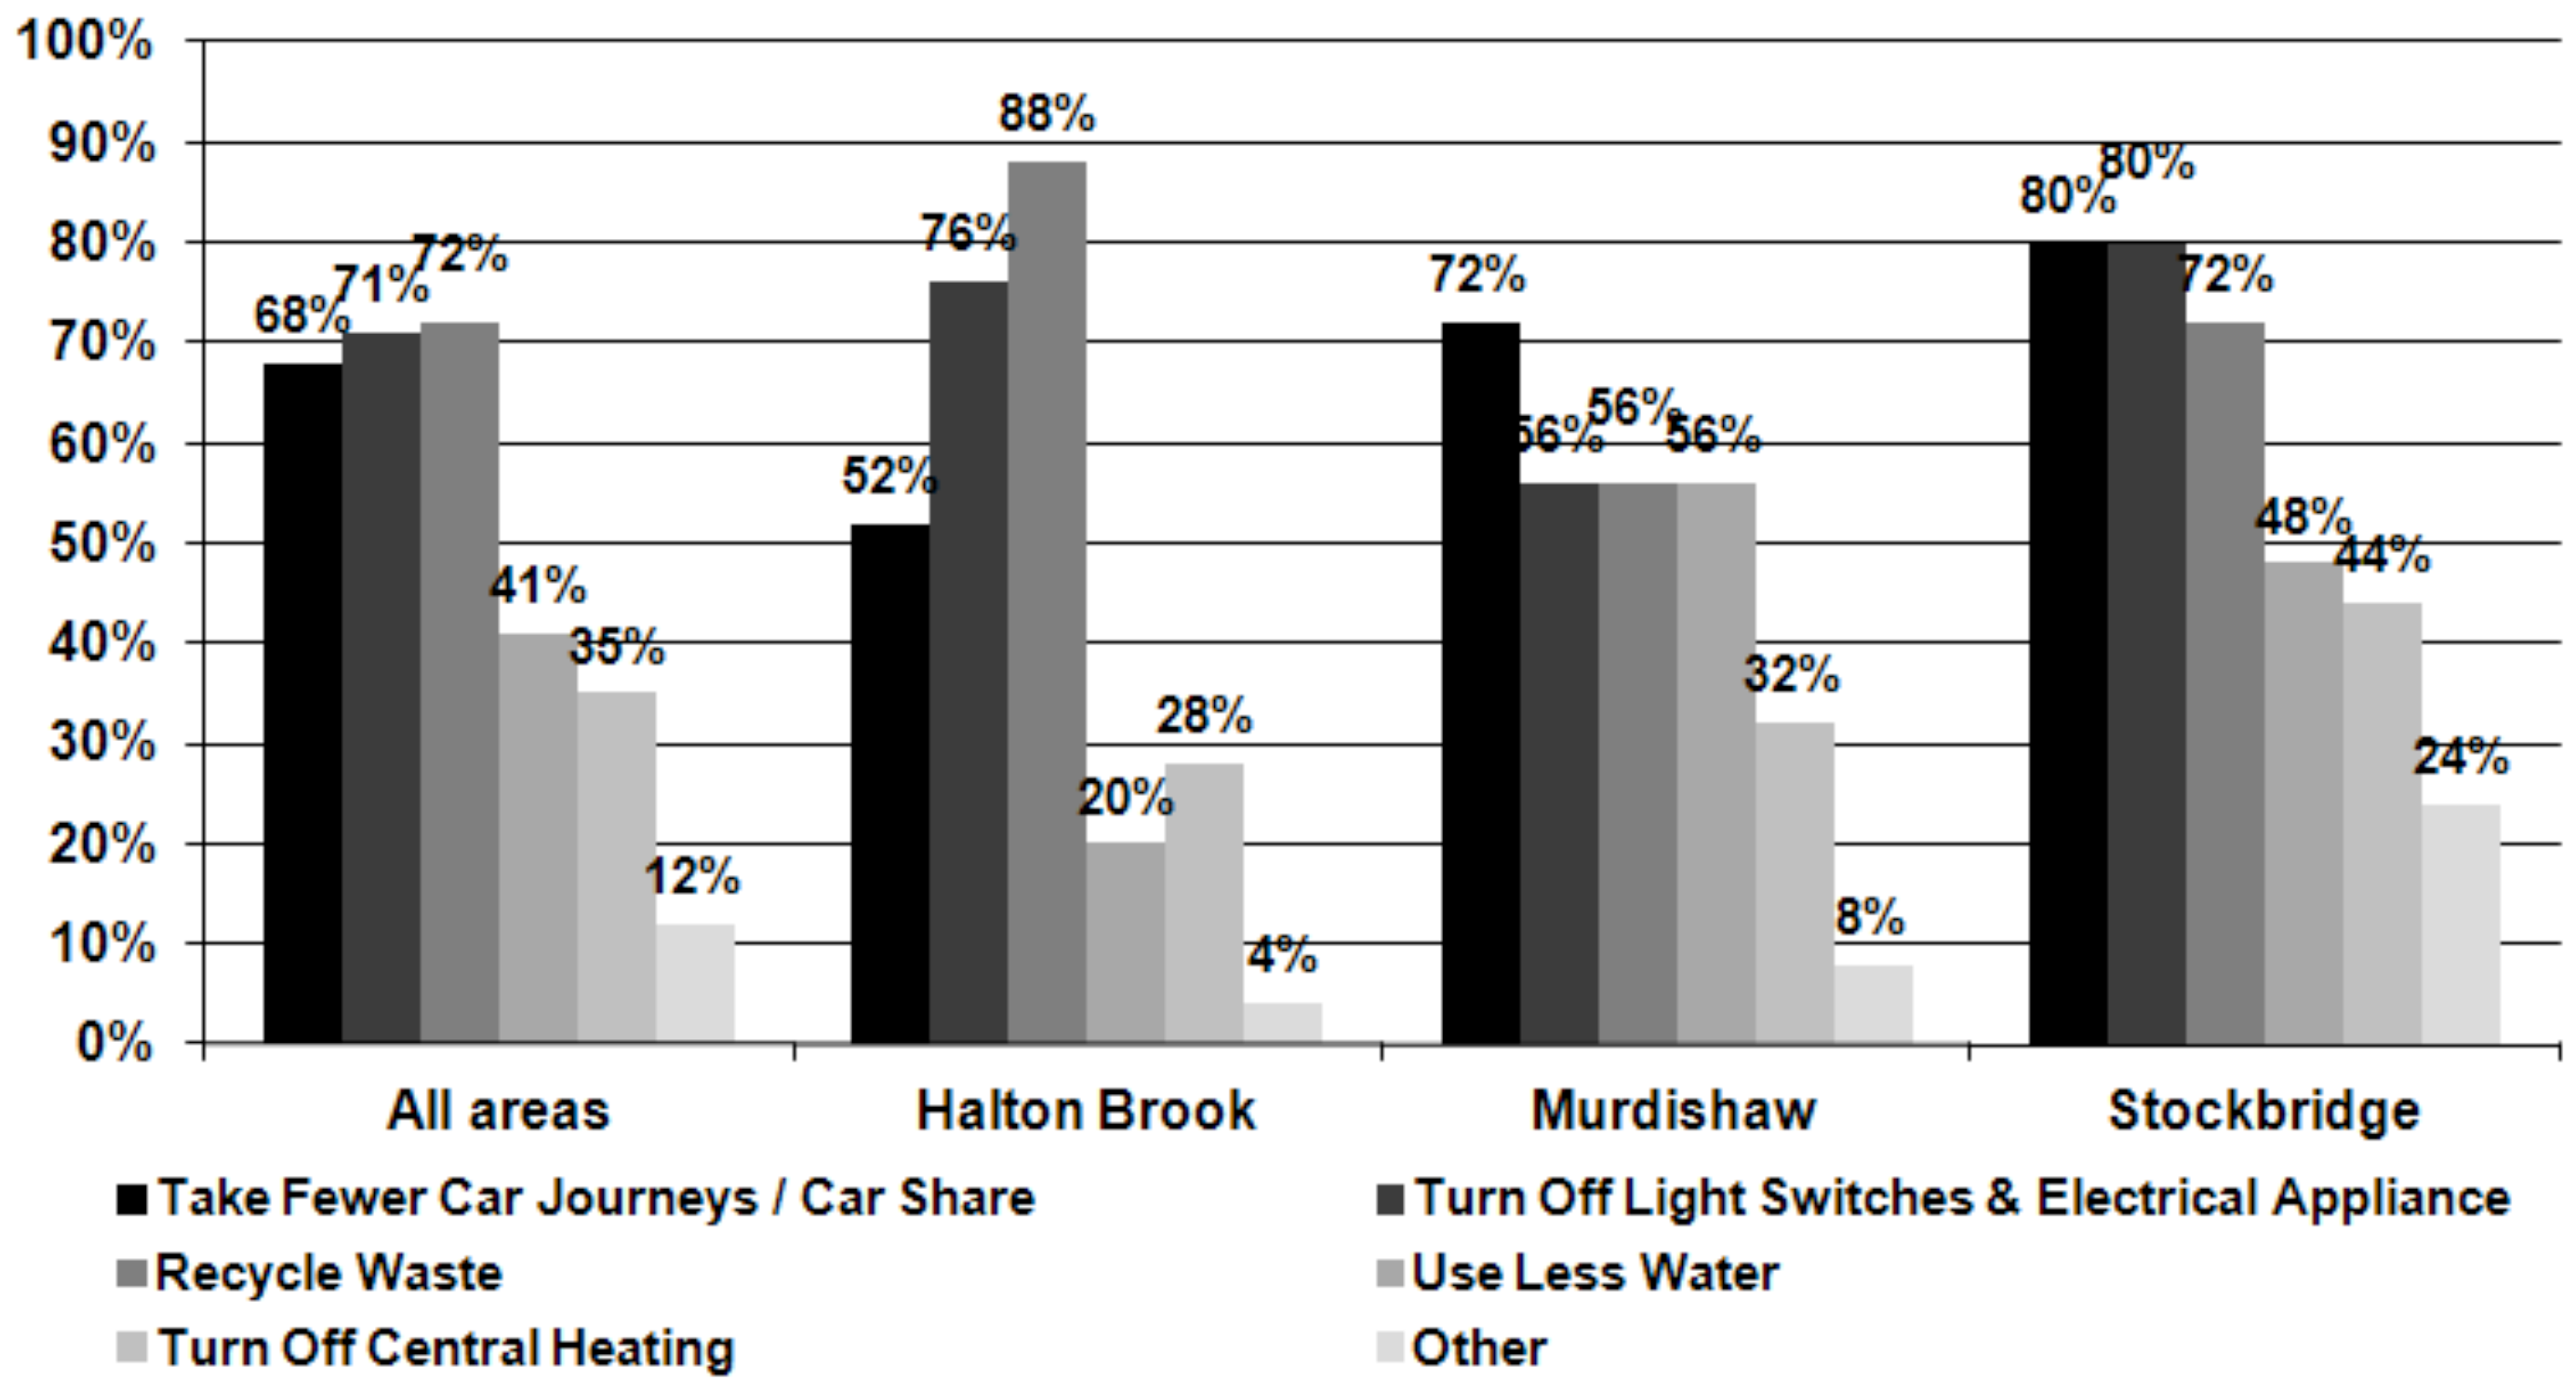
3.2.4. Environment
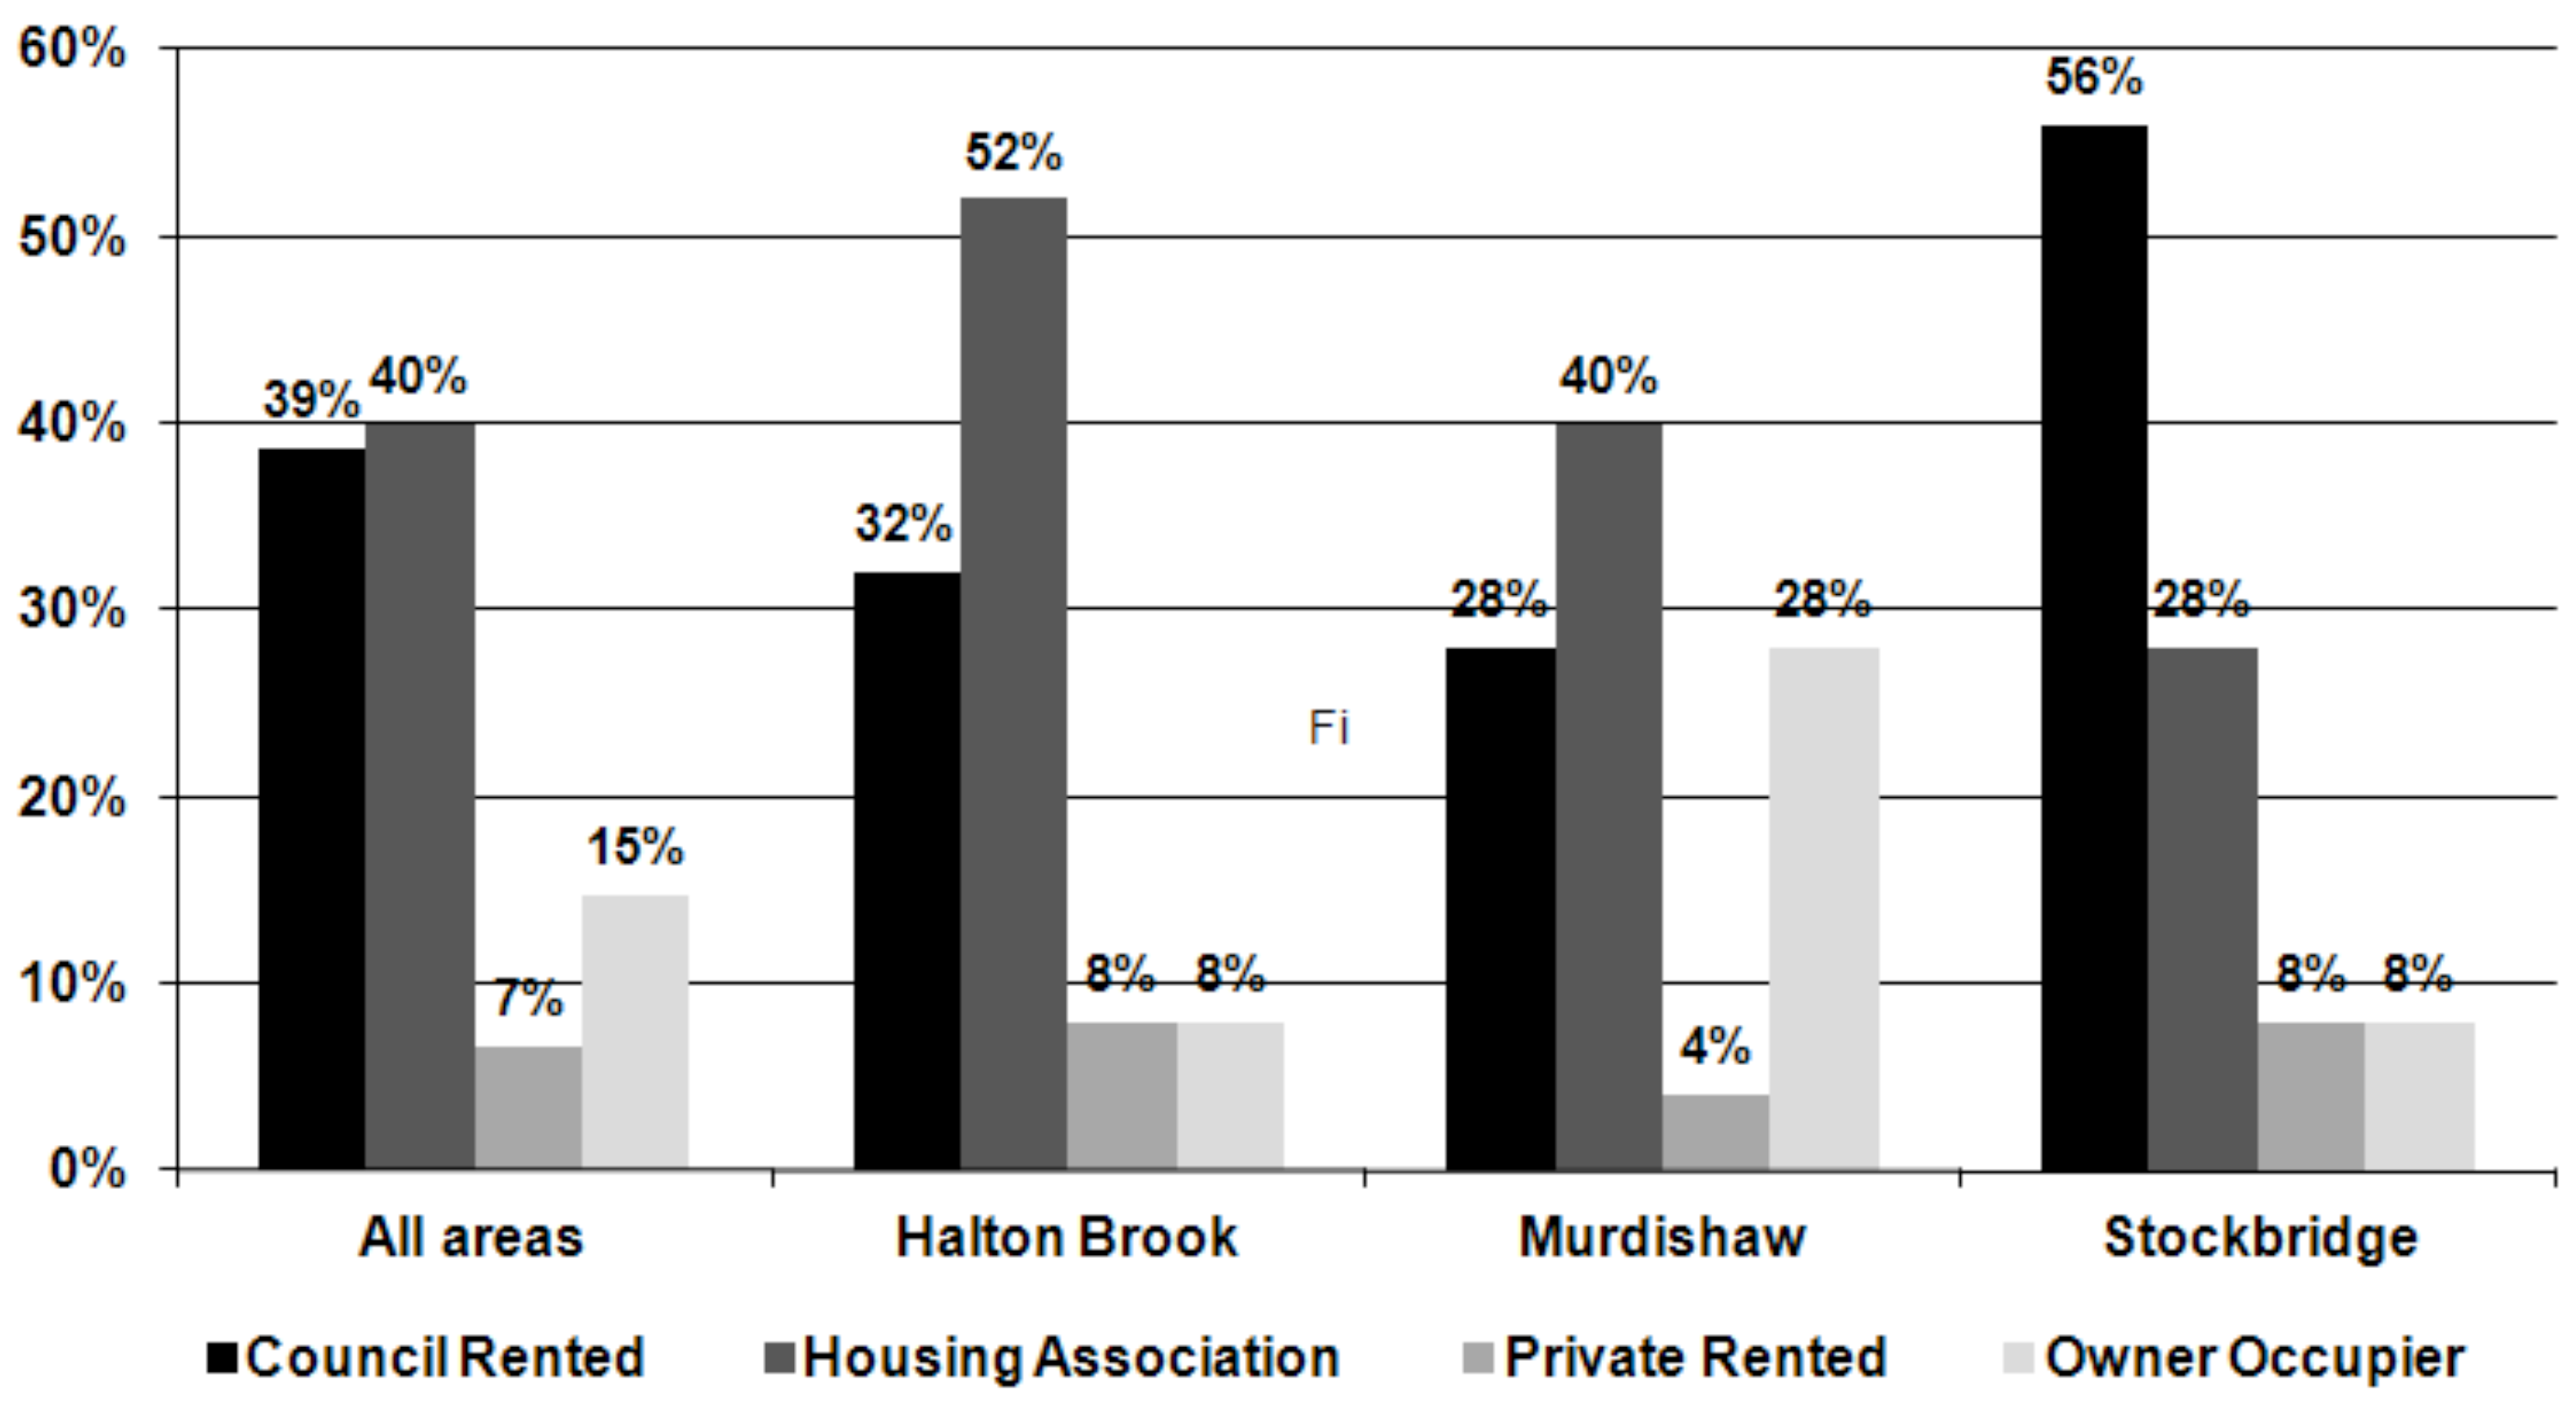
3.2.5. Housing
4. Conclusions
References
- United Nations. United Nations Conference on the Human Environment, Stockholm, 5-16 June 1972; United Nations: New York, NY, USA, 1972. Available online: http://www.unep.org/Documents.Multilingual/Default.asp?documentid=97 (accessed on 15 January 2012).
- United Nations. Process of Preparation of the Environmental Perspective to the Year 2000 and Beyond, Resolution 38/161; United Nations: New York, NY, USA, 1983. Available online: http://www.un.org/documents/ga/res/38/a38r161.htm (accessed on 15 January 2012).
- United Nations. Report of the World Commission on Environment and Development, Resolution 42/187; United Nations: New York, NY, USA, 1987. Available online: http://www.un.org/documents/ga/res/42/ares42-187.htm (accessed on 15 January 2012).
- United Nations. Agenda 21: Earth Summit—The United Nations Programme of Action from Rio; United Nations: New York, NY, USA, 1993. Available online: http://www.un.org/Pubs/textbook/e93020.htm (accessed on 15 January 2012).
- Carley, M.; Christie, I.; Hillman, M. Towards the next environment white paper. Policy Stud. 1991, 12, 36–51. [Google Scholar] [CrossRef]
- Russel, D. The United Kingdom’s sustainable development strategies: Leading the way or flattering to deceive? Environ. Policy Governance 2007, 17, 189–200. [Google Scholar]
- Department of the Environment, Transport and the Regions. Building a Better Quality of Life: A Strategy for More Sustainable Construction; Department of the Environment, Transport and the Regions: London, UK, 2000. Available online: http://www.bis.gov.uk/files/file13547.pdf (accessed on 12 January 2012).
- European Commission. Towards Sustainability: A European Union Programme of Policy and Action in Relation to the Environment and Sustainable Development; European Commission: Brussels, Belgium, 1992. Available online: http://ec.europa.eu/environment/archives/env-act5/pdf/5eap.pdf (accessed on 16 January 2012).
- Department for Communities and Local Government. Sustainable Communities: Building for the Future; Department for Communities and Local Government: London, UK, 2003. Available online: http://www.communities.gov.uk/publications/communities/sustainablecommunitiesbuilding (accessed on 11 January 2012).
- Department for Communities and Local Government. Planning Policy Statement 22: Renewable Energy; Department for Communities and Local Government: London, UK, 2004. Available online: http://www.communities.gov.uk/documents/planningandbuilding/pdf/147444.pdf (accessed on 12 January 2012).
- Department for Communities and Local Government. Planning Policy Statement 1: Delivering Sustainable Development; Department for Communities and Local Government: London, UK, 2005. Available online: http://www.communities.gov.uk/documents/planningandbuilding/pdf/planningpolicystatement1.pdf (accessed on 11 January 2012).
- Department for Communities and Local Government. Planning Policy Statement 10: Planning and Sustainable Waste Management; Department for Communities and Local Government: London, UK, 2005. Available online: http://www.communities.gov.uk/documents/planningandbuilding/pdf/147411.pdf (accessed on 12 January 2012).
- Department for Communities and Local Government. Planning Policy Statement 3: Housing; Department for Communities and Local Government: London, UK, 2006. Available online: http://www.communities.gov.uk/documents/planningandbuilding/pdf/1918430.pdf (accessed on 12 January 2012).
- Maliene, V.; Malys, N. High-quality housing—A key issue in delivering sustainable communities. Build. Environ. 2009, 44, 426–430. [Google Scholar] [CrossRef]
- Department forCommunities and Local Government. Strong and Prosperous Communities: The Local Government White Paper; Department for Communities and Local Government: London, UK, 2006. Available online: http://www.communities.gov.uk/documents/localgovernment/pdf/1179718.pdf (accessed on 12 January 2012).
- Dargan, L. Participation and local urban regeneration: The case of the new deal for communities (NDC) in the UK. Reg. Stud. 2009, 43, 305–317. [Google Scholar] [CrossRef]
- Raco, M. Building Sustainable Communities: Spatial Policy and Labour Mobility in Post-War Britain; The Policy Press: Bristol, UK, 2007. [Google Scholar]
- Maliene, V.; Howe, J.; Malys, N. Sustainable communities: Affordable housing and socio-economic relations. Local Econ. 2008, 23, 267–276. [Google Scholar]
- Department for Communities and Local Government. The Egan Review: Skills for Sustainable Communities; Department for Communities and Local Government: London, UK, 2004. Available online: http://www.communities.gov.uk/documents/communities/pdf/152086.pdf (accessed on 11 January 2012).
- Department for Communities and Local Government. National Planning Policy Framework; Department for Communities and Local Government: London, UK, 2011. Available online: http://www.communities.gov.uk/documents/planningandbuilding/pdf/2116950.pdf (accessed on 25 May 2012).
- Raco, M. Sustainable development, rolled-out neoliberalism and sustainable communities. Antipode 2005, 37, 324–347. [Google Scholar] [CrossRef]
- McDonald, S.; Malys, N.; Maliene, V. Urban regeneration for sustainable communities: A case study. Technol. Econ. Dev. Econ. 2009, 15, 49–59. [Google Scholar] [CrossRef]
- Couch, C.; Fraser, C.; Percy, S. Urban Regeneration in Europe; Blackwell Publishing: Oxford, UK, 2003. [Google Scholar]
- Audit Commission. Local Quality of Life Indicators—Supporting Local Communities to Become Sustainable; Audit Commission: London, UK, 2005. Available online: http://www.audit-commission.gov.uk/nationalstudies/firerescue/Pages/localqualityoflifeindicators_copy.aspx (accessed on 16 January 2012).
- Department for Communities and Local Government. The New Performance Framework for Local Authorities and Local Authority Partnerships; Department for Communities and Local Government: London, UK, 2007. Available online: http://www.communities.gov.uk/documents/localgovernment/pdf/505713.pdf (accessed on 12 January 2012).
- Department for Communities and Local Government. Sustainable Communities: People, Places and Prosperity: A Five Year Plan from the Office of the Deputy Prime Minister; Department for Communities and Local Government: London, UK, 2005. Available online: http://www.communities.gov.uk/documents/corporate/pdf/people-places-prosperity.pdf (accessed on 11 January 2012).
- Ellis, G. Questions of far reaching reform. Town Country Plan. 2011, 80, 15–19. [Google Scholar]
- UK National Statistics. Available online: http://www.statistics.gov.uk/hub/crime-justice/index.html (accessed on 25 May 2011).
- Hasna, A.M. Dimensions of sustainability. J. Eng. Sustain. Dev. Energy Environ. Health 2007, 2, 47–57. [Google Scholar]
- Ståhle, A. More green space in a denser city: Critical relations between user experience and urban form. Urban Design Int. 2010, 15, 47–67. [Google Scholar] [CrossRef]
- The Knowsley Partnership. Knowsley: The Borough of Choice, Sustainable Community Strategy 2008-2023; Metropolitan Borough of Knowsley: Knowsley, Merseyside, UK, 2008. Available online: http://inquiry.knowsley.gov.uk/Docs/scs_exec_summary.pdf (accessed on 24 May 2012).
- Halton Strategic Partnership. Halton’s Sustainable Community Strategy 2011-2026; Halton Strategic Partnership: Halton, UK, 2011. Available online: http://www.haltonandsthelenspct.nhs.uk/library/documents/HTSHsustainablecomunitystrategy2011final.pdf (accessed on 24 May 2012).
© 2012 by the authors; licensee MDPI, Basel, Switzerland. This article is an open-access article distributed under the terms and conditions of the Creative Commons Attribution license (http://creativecommons.org/licenses/by/3.0/).
Share and Cite
Maliene, V.; Durney-Knight, N.; Sertyesilisik, B.; Malys, N. Challenges and Opportunities in Developing Sustainable Communities in the North West of England. Challenges 2012, 3, 133-152. https://doi.org/10.3390/challe3020133
Maliene V, Durney-Knight N, Sertyesilisik B, Malys N. Challenges and Opportunities in Developing Sustainable Communities in the North West of England. Challenges. 2012; 3(2):133-152. https://doi.org/10.3390/challe3020133
Chicago/Turabian StyleMaliene, Vida, Natalie Durney-Knight, Begum Sertyesilisik, and Naglis Malys. 2012. "Challenges and Opportunities in Developing Sustainable Communities in the North West of England" Challenges 3, no. 2: 133-152. https://doi.org/10.3390/challe3020133
APA StyleMaliene, V., Durney-Knight, N., Sertyesilisik, B., & Malys, N. (2012). Challenges and Opportunities in Developing Sustainable Communities in the North West of England. Challenges, 3(2), 133-152. https://doi.org/10.3390/challe3020133