1. Background
Mission Australia, an Australian charity with a Christian ethos, and Alphacrucis University College have been developing a model of chaplaincy among communities with entrenched social disadvantage. One of the project’s goals was the development of effective measures of a chaplain’s work. Community chaplains
1 work at two levels, with the community itself and also with individuals coming into their orbit. At each level, the ability to measure the effects of an intervention is crucial. The researchers adopted wellbeing as a useful approach in measuring progress, as wellbeing may be assessed for individuals and groups.
Since the chaplains will be dealing with matters that extend beyond physical issues to include topics of spiritual importance, one of the necessary measures was determined to be a measure of spiritual wellbeing. As will be discussed below, the researchers reviewed a range of available measures of spiritual wellbeing. The team determined that no available measures fit the usage scenario. Therefore, a broadly conceived definition of spirituality was used to develop a measure of spiritual wellbeing. The process, results of a trial, and a discussion of initial psychometric properties of the scale are presented below.
2. Measuring Spiritual Wellbeing
Several criteria influenced the assessment of the various measures available. As already mentioned, the measure is intended to be used in a practical chaplaincy context; therefore, brevity was important. The individuals with whom these chaplains were working would be from communities experiencing entrenched social disadvantage, so the instrument must allow for those with lower levels of literacy. In addition, the communities in question also displayed a wide demographic variability, including substantial numbers of indigenous Australians, Muslims, Christians, and those of no or other faiths. Finally, given that the Personal Wellbeing Index (PWI) was already being used as part of the client assessment process, the unipolar, ten-point scale used therein was selected for both its familiarity to clients and the wide acceptance of this format. (For more on the PWI see,
International Wellbeing Group (
2013)).
Spiritual wellbeing as a concept is still fairly ill-defined, as is wellbeing in general (see, for example,
Cooke et al. 2016). A range of instruments have been developed such as the Spiritual Wellbeing Scale (20 items) (
Ellison 1983;
Paloutzian et al. 2021), the Spirituality Index of Wellbeing (12 items) (
Daaleman and Frey 2004), the Spiritual Assessment Inventory (49 items) (
Hall and Edwards 2002), and the Spiritual Involvement and Beliefs Scale (26 items) (
Hatch et al. 1998). A key consideration was the practical use of an instrument in the context of a chaplain–client interaction. Another key factor was whether the instrument was applicable in a multi-faith context. Thus, any instrument must not be captive to a particular worldview’s understanding of spirituality or religion.
Upon analysis, most of the above were rejected as being too lengthy or inadequate in their language or conceptualisation of spirituality. While the Spirituality Index of Wellbeing is shorter, it is designed to be used in a health setting. In addition, its structure does not represent a broad concept of spirituality, which would fit the usage scenario. For example, questions 1–6 focus on respondents’ ability to solve problems and helping themselves. The other items relate to the concept of purpose or meaning in life. While these latter questions may be a part of spirituality, as discussed below, it is not a full conceptualisation of the concept. The INSPIRIT (
Kass et al. 1991) is admirably brief, having seven questions, albeit some being multi-choice, but its heavily theocentric view of spirituality is inappropriate in a multi-cultural, multi-faith context. Similarly, the RCSS (
Exline et al. 2000) is captive to a theocentric view of spirituality. While relatively brief (8 items), the focus on transcendent experiences within a theocentric framework rendered the STI (
Seidlitz et al. 2002) inappropriate for our purposes. A final candidate, the SISRI (
King 2008), was rejected both because of its length (24 items) and on psychometric grounds (one cannot validly measure an intelligence using a self-reported measure).
The PWI has a question on spiritual wellbeing, and given Mission Australia was already using the PWI with clients, the question “satisfaction with spiritual or religious beliefs” was considered. However, it was rejected for multiple reasons. The manual does not recommend using the question (
International Wellbeing Group 2013, Appendix G). They noted multiple limitations: it being a double question, and differences arising from respondents’ understanding of the terms “spiritual” and “religion”. For example, one might have spiritual beliefs without belonging to a religion. In the research team’s estimation, one generic question is not nuanced enough to cover the range of issues present in someone’s spirituality, particularly when considering the breadth of spiritual expression across the target communities. An additional concern the researchers had is that the question seemed biased toward a Western, individualistic conceptualisation of spirituality and religion, failing to acknowledge the corporate nature of many religions and their tight integration with culture. Later feedback from survey participants in Mission Australia’s leadership echoed this concern, with questions based on the PWI’s spirituality question being criticised as lacking cultural awareness (
Chapman 2023).
One instrument, Fisher’s construct of four domains of spiritual wellbeing, operationalised in the Spiritual Wellbeing Index (
Fisher and Ng 2017;
Gomez and Fisher 2003), was seen to have the dual benefits of brevity and a solid theoretical foundation. In addition, the construct was not obviously limited to a culturally specific form of spirituality.
2 Fisher’s questions interrogate the respondent’s relationships in four domains: the Divine, with others, the environment, and the self. These are operationalised in the question: How important are each of the following relationships for you personally: a. with God (or heaven); b. with other people; c. with environment; d. with yourself (
Fisher and Ng 2017, p. 4)?
As Fisher’s original domains were discovered via interviews with teachers, a concern is that teachers are not experts in domains of spirituality. Therefore, the researchers asked others in their institution’s schools of Humanities and Social Science, as well as Ministry and Theology, to evaluate these four domains. Two additional domains were identified. First, meaning and purpose in life was identified as a commonly used measure of spiritual wellbeing. In addition, given some populations might understand relationships with “others” as something different from relationships with their “community”, an additional question concerning their relationship with the community was included, resulting in a six-item scale. These additions were provisional, with a later analysis to determine if they each interrogated a separate concept from Fisher’s original four.
Thus, a six-question scale are as follows:
Meaning or purpose in your life?
Your relationship with God/the Divine?
Your relationships with other people?
Your relationship with the wider community?
Your relationship with the environment?
Your relationship with yourself?
One additional conceptual issue was identified during the consultation phase—the complexity of spirituality could impact the unity of the scale. Given that spirituality can be conceived and experienced in widely different ways, could an instrument this broad obscure the relative importance of areas of one’s spirituality? Historically, measures of wellbeing began with a two-part format, with scores for state (
S) and importance (
I). This practice has now been abandoned, with the argument being that importance is already built into the scale (
Trauer and Mackinnon 2001). Current wellbeing scales measure a singular concept where wellbeing in that area is represented by high composite scores, which include all sub-domains. Because of the complexity and diversity of spirituality, our contention is that this cannot be assumed. Someone from a monotheistic, theocentric faith will apply much greater importance to their relationship to the Divine over the environment when compared with someone who is from a pantheistic faith, who might weight their relationship to the environment more heavily because that too is Divine. Similarly, an Indigenous Australian’s spirituality is deeply connected to the land, probably much more so than your average non-indigenous Australian. However, using Fisher’s model, individuals from both groups might indicate that their relationship in the environment domain is good. However, this is a much more important consideration in the spiritual wellbeing of Indigenous folk. For the non-indigenous, it may simply reflect the importance of environmental issues to them. Therefore, it was deemed wise to include and evaluate an importance element in the scale. The result was a two-part measure, where participants indicated both the relative importance (I) as well as their current state (S) in each of the six domains.
3. Methodology
Participants were asked to complete the Spiritual Wellbeing Scale (SWS) online, alongside various other instruments as a means of investigating its psychometric properties. The SWS, the Positive and Negative Affect Schedule (PANAS), and the Personal Wellbeing Inventory (PWI) were used together to establish convergent and discriminant validity. The responses were analysed using SPSS v.29.
3.1. Participants
The sample comprised 279 participants who provided demographic information. The sample consisted of staff from Mission Australia and staff and students from Alphacrucis University College. The participants ranged in age from their twenties to sixty and over, with 25% male and 75% females. Participants were invited to complete an online survey via email. The online survey included the Personal Wellbeing Index (PWI), an adjusted version of the PWI’s spiritual wellbeing question, the Positive and Negative Affect Schedule (PANAS), and the SWS. Additionally, demographic information, including age and gender, was requested. Ethical approval was obtained from the Alphacrucis University College Human Research Ethics Committee. This design allowed for the evaluation of the psychometric properties of the new SWS and its relevance compared to established wellbeing measures.
3.2. Instruments
Spiritual Wellbeing Scale: Developed by the authors, based on Fisher’s model, as described above. There are 12 questions in the scale, querying six domains. First respondents were asked to rate how important each of the following were to them personally on a scale from zero (not important at all) to ten (crucial). Then, using the same 0–10 scale, they were then asked to indicate how satisfied they were with each of the same six areas (not satisfied at all–satisfied).
Positive and Negative Affect Schedule (PANAS): The PANAS (
Watson et al. 1988) is a 20-item measure that assesses affective states. The PANAS consists of a positive and negative affect scale, with both scales consisting of 10 items. The Positive Affect (PA) scale measures the extent to which a person experiences positive emotions. Descriptors of positive affect include being attentive, enthusiastic, inspired, and proud. Similarly, the Negative Affect (NA) scale assesses the extent to which a person experiences negative emotions, including items such as feeling distressed, angry, scared, and nervous. Participant responses were based on how they felt over the past week on a 5-point Likert scale, ranging from 1 (very slightly/not at all) to 5 (extremely). The responses were summed to determine total PA and NA scores. The PANAS has demonstrated high reliability and construct validity in adult populations (
Crawford and Henry 2004;
Watson et al. 1988). Inter-correlations and internal consistency range from 0.86 to 0.90 for the PA scale and 0.84 to 0.87 for the NA scale (
Watson et al. 1988). Reliability within the current study was also found to be very strong, with Cronbach’s alpha of 0.88 for the PA scale, and from 0.90 for the NA scale.
Personal Wellbeing Index (PWI): The PWI is widely used to assess subjective wellbeing by evaluating satisfaction across seven key life domains: standard of living, health, achievement in life, personal relationships, personal safety, community-connectedness, and future security. This index is used in both service provision and research contexts to evaluate a holistic view of satisfaction with life (
International Wellbeing Group 2013). Each domain is measured through specific questions, such as “How satisfied are you with your standard of living?” or “How safe do you feel?” Respondents rate their satisfaction on a Likert-type scale, ranging from 0 (completely dissatisfied) to 10 (completely satisfied). The PWI demonstrates strong internal consistency, with Cronbach alpha values exceeding 0.80, indicating high reliability. The index also demonstrates strong construct validity, correlating well with broader measures of subjective wellbeing like overall life satisfaction. Results also indicate it is able to capture changes in wellbeing over time (
International Wellbeing Group 2013).
4. Results and Discussion
4.1. Importance and Satisfaction
As noted above, this scale takes an atypical approach to measuring wellbeing, returning to the past practice of having a two-part structure, one scale measuring the relative importance of the six domains and the respondent’s current state for the other. Space precludes an extended analysis; however, the results indicate that the key assumption behind the use of one-part scales is invalid for this scale. Trauer and Mackinnon argued that the universal importance of each domain in wellbeing scales is implicit in a measure. This is displayed in that “QoL domains … are rated as unimportant by quite small minorities of those asked” (
Trauer and Mackinnon 2001, p. 580). Our data indicates that this is not true for the complex construct measured by the SWS. One particular domain, relationship with God/the Divine (domain 2), had 17 per cent of respondents rate it as having no importance (0), and 26 per cent rated it as having very low or no importance (0–3).
3 This and other data reported below confirmed our decision to adopt this structure and so it will be used in the following analyses.
4.2. Calculating the Overall SWS Score
Because some domains may be rated as unimportant to a respondent, the calculation of domain and overall spiritual wellbeing scores is more complex than the past practice of multiplying state and importance for each domain. A simple multiplication (S × I) will not provide a helpful overall picture of the respondent’s spiritual wellbeing. For example, any domain rates as having zero or low importance will return a low composite score for that domain. In state-only instruments, a low domain score would normally be interpreted as low spiritual wellbeing. Yet in this case, the score is low because the domain is not important to the respondent. Similarly, summing these multiplied scores lowers the overall sum of scores, incorrectly suggesting poor spiritual health. Finally, the possible maximum would be 600, yet scores will not approach that value if any domains are rated as having low importance. See, for example, the sum of scores in the rightmost column of
Table 1. The score of 96/600 calculated using the S × I method suggests poor spiritual wellbeing, yet if calculated with more nuance, the respondent is revealed as having moderate wellbeing (see the sum of the “Weighted state” column in
Table 1).
To account for zero ratings of importance, we first convert the importance scores to proportional importance. That is, we assume that the weightings given indicate what total spiritual wellbeing looks like for that respondent. This proportion is calculated using the formula (domain weight/sum of domain weights × 10). The multiplication by ten is to scale the results to give a proportion out of ten. This method not only makes the relative weighting figure match with the other ratings out of ten, but it also contributes to the overall wellbeing scores being reported as a percentage. The weighted state score for each domain is then calculated by multiplication (reported state × proportional importance). The overall SWS score is calculated by summing the weighted state scores for each domain. Scoring out of ten and as a percentage aid interpretation by the professional and client. A sample set of scores is displayed in
Table 1. We contend that the overall SWS score calculated using this method (45.71%) is much clearer and easier to interpret than the 96/600 obtained from the simple multiplication method.
4.3. Descriptive Statistics
We received 399 responses, with almost two-thirds (244) completing the survey. Overall, the demographic spread of the respondents was quite varied, providing a range of age, gender, and cultural perspectives. Gender was the only item that was rather uneven, but even so, the sample size allowed for valid statistical analysis.
A total of 223 respondents identified their gender. The sample was biased toward females (71%), with the remainder identified as male (29%). None indicated alternate gender identities.
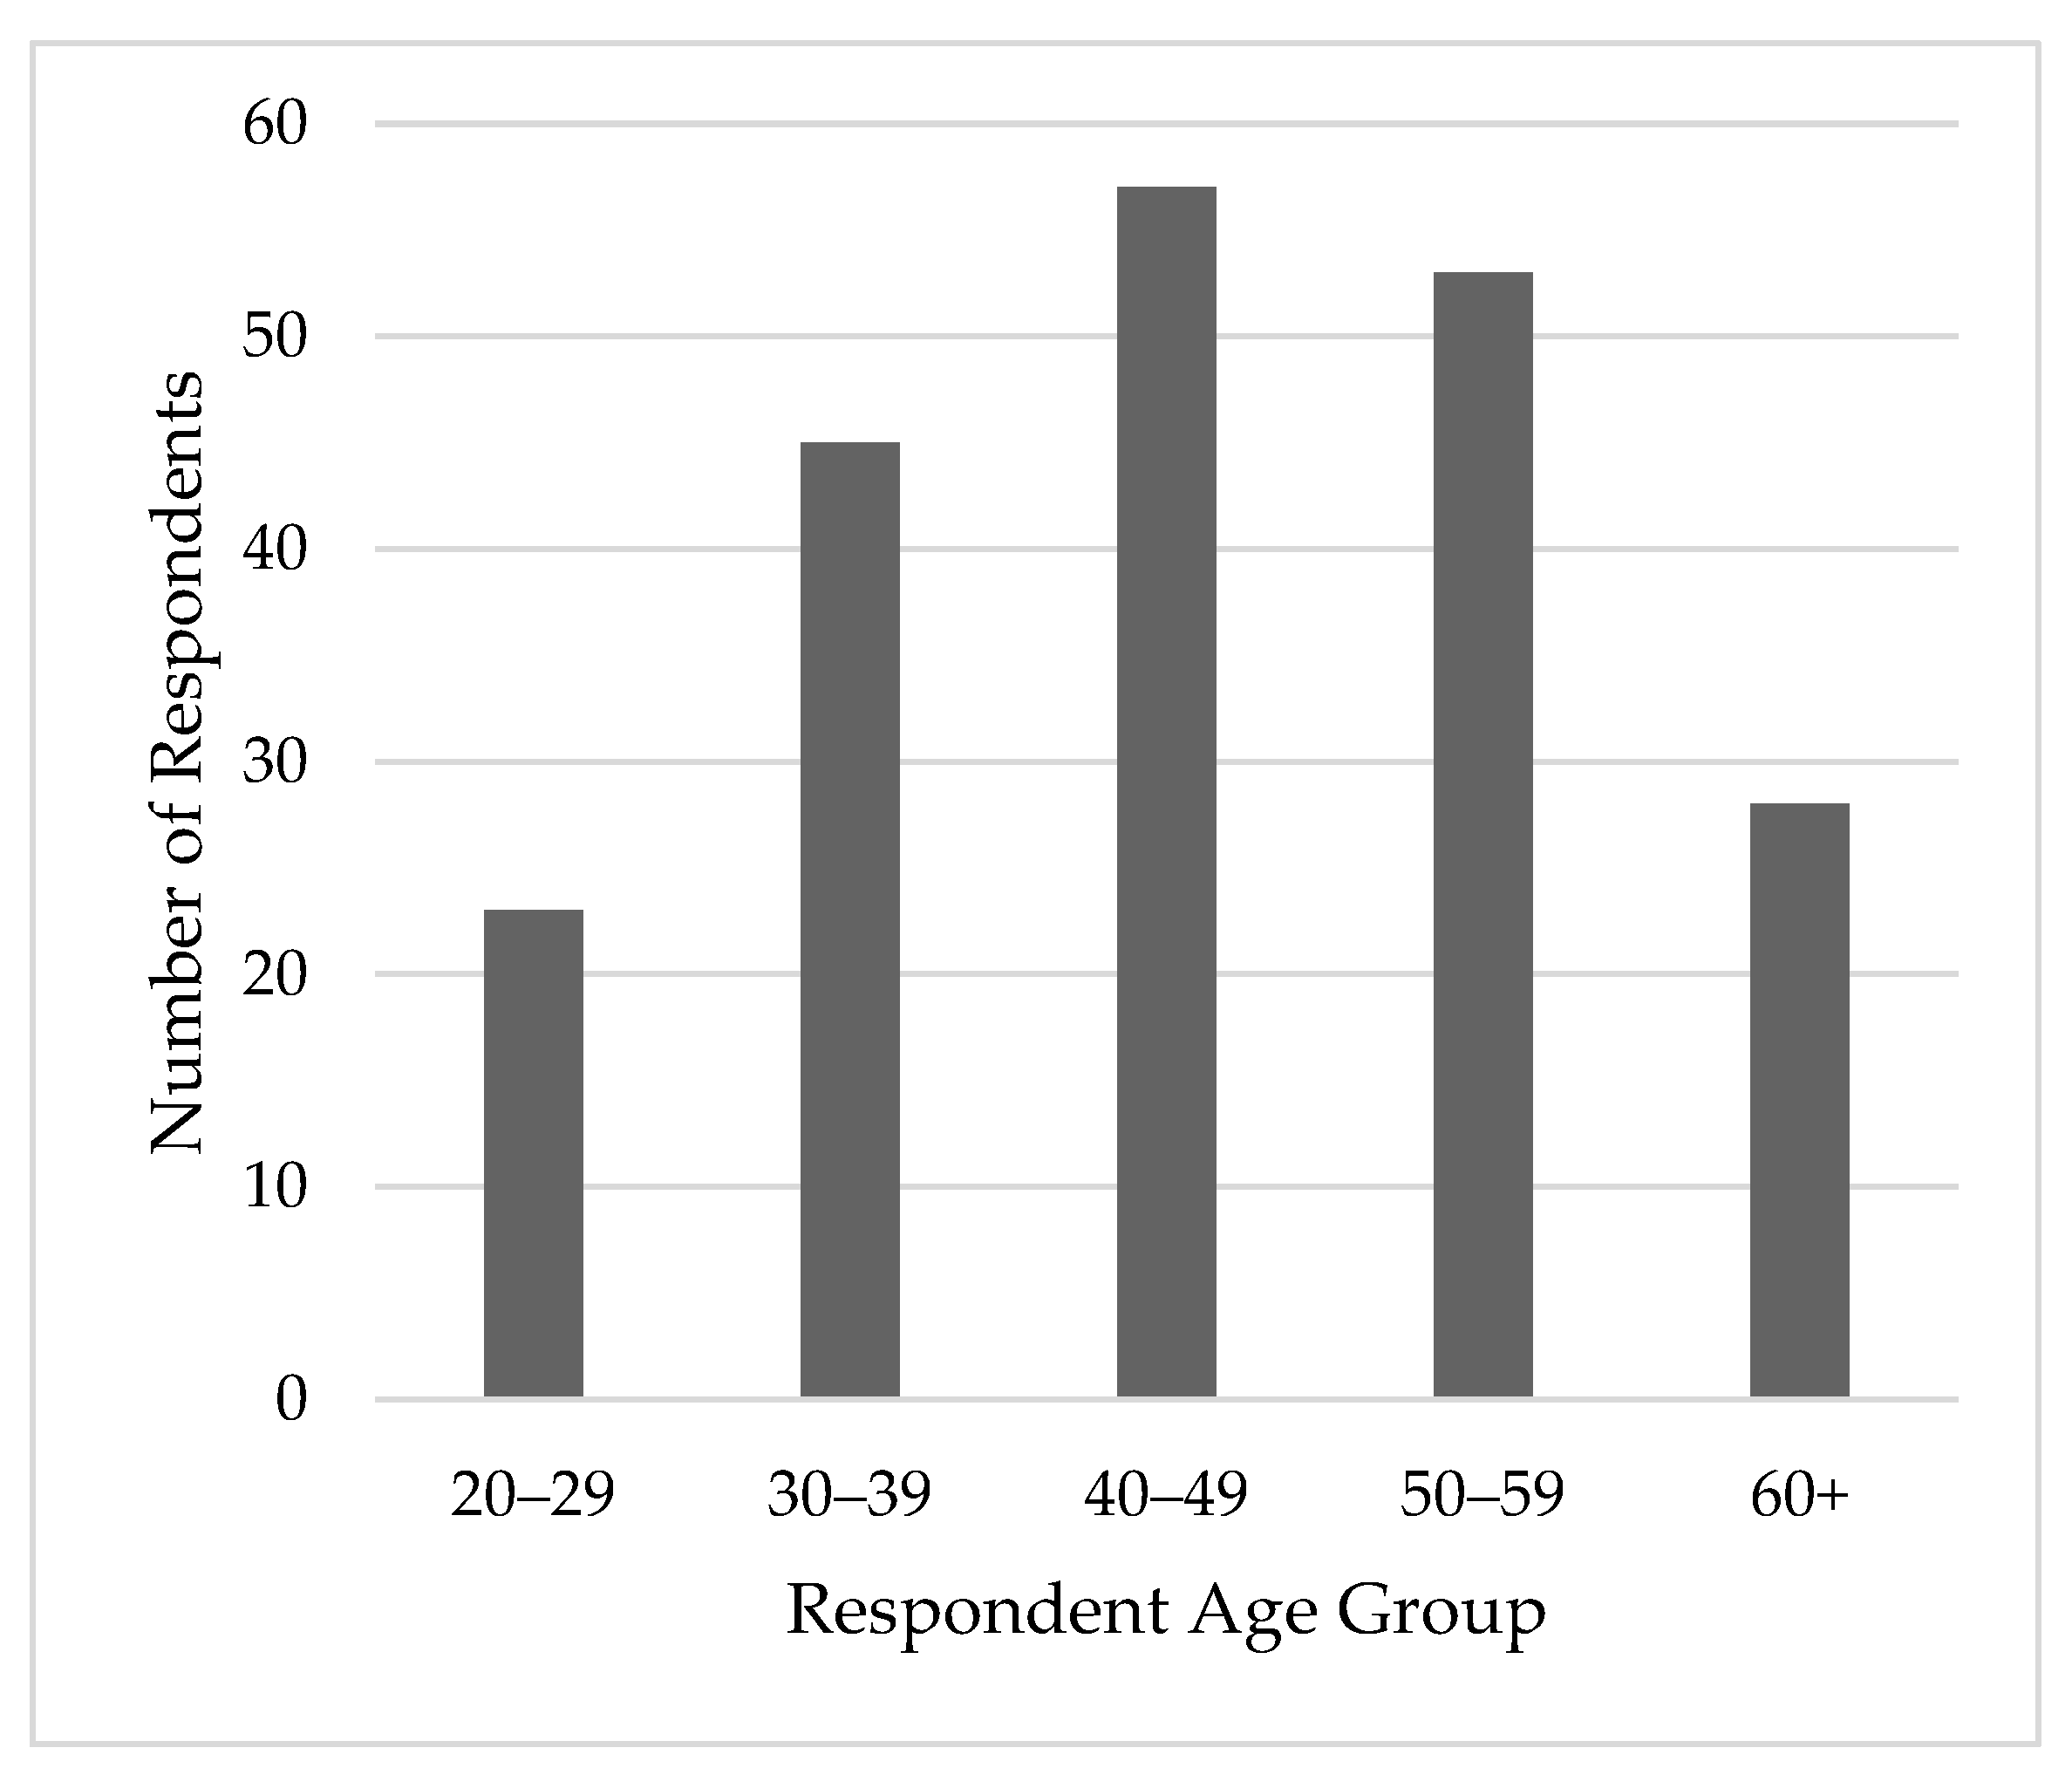
The age demographic ranged from those in their 20s to those aged 60 and over. (While ages 70 and over were an option for respondents, as only a few were in these age groups, these demographics were combined with those aged 60–69 to create a 60+ age group). The age spread was weighted toward those in mid-life (30–59 years of age). Given that a large proportion of the respondents were staff, it is unsurprising that fewer were found in the extremes of their 20s or 60+. See
Figure 1.
The ethnicity of respondents was quite varied, though two groups dominated, Oceanians and North-West Europeans, with the majority (over 85%) of the latter being British and Irish. This is unsurprising given the Australian population of the sample. While the survey allowed for finer details about ethnicity, the groups were collapsed into higher-order categories. Otherwise, the small samples in some categories would not permit valid statistical analysis. For example, 2 “Oceanian: Polynesian”, 4 “Oceanian: New Zealand” and 88 “Oceanian: Australian Peoples” were combined to create 86 “Oceanian” respondents. Respondent ethnicity, according to these higher-order groups, can be seen in
Table 2. The ethnicity of those in the “Other” category is displayed in the lower half of the table.
Most of the questions demonstrated a full range of responses, from 0 to 10 for each question. Two of the importance domains were an exception. No respondents rated relationships with other people below 3. Similarly, no respondents rated meaning or purpose in life as 0. So, while some may score these as having a relatively low importance, none marked them as having no importance to them. Similarly, most of the current satisfaction ratings expressed the full range from 0 to 10. Two domains had 1 as the lowest score—relationship with the wider community and relationship with the environment. No respondents reported that they were not at all satisfied in either of these two domains, whereas some respondents did so in every other domain. The means ranged from 6.60 to 8.52 and tended to cluster around 7. This pattern, with a mean score of around 70 per cent, is similar to other wellbeing measures such as the Personal Wellbeing Index (PWI,
International Wellbeing Group 2013, Appendix E). The standard deviations were similar, ranging from 1.82 to 2.82. The one exception is the standard deviation for the importance of relationship with God/the Divine (domain 2). The standard deviation for this item is much larger at 3.71. The data for each question in the two sub-scales are presented in
Table 3.
The finding about the absence of the lowest ratings of importance for relationships with other people underlines the importance of relationships across the population. The finding about the state of relationship with the wider community and relationship with the environment having no 0 scores perhaps indicates that all respondents gain some satisfaction from these two areas, even if it is a low amount at times.
The greater standard deviation for the importance of domain 2 may be related to it interrogating a unique construct. This is the only question where large numbers of respondents (23.4%) rated its importance between 0 and 3, whereas for the other five domains, the percentage rating at this level was a maximum of five per cent. Given that not everyone has a theocentric faith and that this instrument was designed to be useful in a multi-faith setting, the team expected that some domains would be relevant (important) for some and not others. It was expected that this would be so for a theocentric domain, where some belief systems are theocentric such as Hinduism and the Abrahamic faiths, and others are not. These data bear that out.
Finally, as we added additional questions to Fisher’s four domains, we analysed whether these questions interrogated distinct concepts, concepts that were not represented in Fisher’s initial four domains. A distinction between relationship with others and relationship with the community was considered an important one. Paired t-test analyses of the rated importance for each domain and the respondents’ current state were calculated. In both cases, a significant difference was found (Importance: t = −8.07, p < 0.001; State: t = −4.86, p < 0.001). Similarly, the general “meaning and purpose in life” question (domain 1) was compared to responses from the other five domains. Examining the importance scale, significant differences were found at the 0.001 level for three domains (domain 2—relationship with God/the Divine; domain 4—relationship with the wider community; domain 5—relationship with the environment). Domain 3—relationship with other people, and domain 6—relationship with yourself did not show any significant differences. The state responses showed a significant difference between meaning and purpose in life—domain 1, while all other domains were at the p < 0.001 level, except for domain 3—relationship with other people. These two domains’ correlation is 0.72, so while similar, they are not identical. Is domain 1 made redundant by these results? As will be discussed below, factor analysis does not indicate that the scales will be improved by the omission of this question. In summary, the results indicate that these two additional domains are interrogating separate concepts from Fisher’s initial four, both in terms of the level of importance and the current state of the respondent.
4.4. Psychometric Properties
The psychometric properties of each of the scales were examined using Cronbach α and factor analysis. First the properties of the importance scale are reported, then the state scale is examined.
The α for the importance sub-scale is very good for a short scale. (
Loewenthal and Lewis 2020, p. 73) note that while 0.8 is the normal target for α, if one has a scale with few items (less than 10), one could use lower criteria such as 0.6. They note that the application of this lower threshold may be performed if there is good evidence for validity, there are good theoretical or practical reasons for the scale, and it has less than ten items. Given this paper demonstrates that the SWS meets all these criteria, the scale’s α of 0.81 is very high. If question 2 is dropped, α rises to 0.869, reflecting its fairly low item–total correlation (0.378). See
Table 4.
A correlation analysis of the six items in the importance scale showed no potential multicollinearity, with no correlations being higher than 0.67 (0.8 being the threshold). Testing for sampling adequacy showed the data amenable to analysis (KMO = 0.795, Bartlett’s test of sphericity p < 0.001).
An initial exploratory factor analysis showed all six importance items with communalities greater than 0.2. One factor displayed an Eigenvalue > 1, explaining 58.5 per cent of the variance. Maximum-likelihood method without rotation was used. All six questions loaded onto this factor. See
Table 5.
The Cronbach α for the state scale is also excellent for a short scale, at 0.875. Similarly, with the importance scale, if the responses for question two are dropped, the α increases slightly to 0.886. See
Table 6.
A correlation analysis of the six items in the state scale was very close to the 0.8 threshold for multicollinearity, with Q3 and Q4 showing a significant correlation (r = 0.790, p < 0.001), while the remaining items showed correlations of r = 0.70 or lower. Testing for sampling adequacy showed the data amenable to analysis (KMO = 0.865, Bartlett’s test of sphericity p < 0.001).
An initial factor analysis showed all six items with communalities greater than 0.2. One factor displayed an Eigenvalue > 1. Maximum-likelihood method without rotation was used. This explained 64.3 per cent of the variance. All of the questions loaded onto this one factor, with values ranging from 0.580 to 0.878.
Both the state and importance scales show strong internal reliability, particularly for short scales like these. Even though the analysis suggests that the reliability of the importance scale could be improved by the removal of question two (relationship with God/the Divine), we argue that the scale should be retained as is. The key argument for retaining question two is the theoretical argument that no other question interrogates an important aspect of spirituality—theocentric belief. To omit it would be to exclude important data from a significant proportion of the population—those who have a theistic spirituality, such as Hindus or followers of the Abrahamic religions (Christians, Jews, and Muslims).
The decision to retain domain two is reinforced when considering the structure of the state scale, which clearly shows a one-factor structure. The slightly lower internal correlation of the importance scale is not unexpected. One would expect importance to cohere less than state, as it is more subject to the participants’ internal evaluations concerning what is important in their lives. This leads the team to give more weight to the structure revealed by the state scores. Given that the state scores show a one-factor solution with all six domains therein, a one-factor solution retaining all six domains is proposed for the two scales. Further research should continue to consider the structure of these scales.
5. Correlation with Other Measures
To establish that the SWS measured an aspect of wellbeing, but one separate from general wellbeing, several parallel measures were included in the survey. As the SWS measures a specific component of wellbeing, it should show a moderate positive correlation with other measures of wellbeing, and a stronger correlation with other measures of spiritual wellbeing. The Positive and Negative Affect Schedule (PANAS) and Personal Wellbeing Index (PWI) were included in the survey. In addition, several spiritual wellbeing questions derived from the PWI’s comments on measuring spiritual wellbeing were also added (
International Wellbeing Group 2013, Appendix G).
5.1. Personal Wellbeing Index Spirituality Questions
The Personal Wellbeing Index (PWI) has a spirituality question. This question has been a discretionary domain since 2013, because the domain was found to be not relevant to many people. The International Wellbeing Group provides suggestions for researchers about how the question might be improved. The PWI’s spirituality question was adapted following both this guidance and some theoretical considerations raised by the research team. As a result, the PWI’s original question, asking respondents to rate their satisfaction with their spiritual or religious beliefs, was expanded into three questions. These questions followed the standard PWI question prompt and response format: asking the respondents to rate their satisfaction from 0 to 10 concerning:
If the SWS questions were interrogating a similar domain to the PWI’s spirituality questions, the two sets of questions should display a moderate–strong correlation with each other. Given the PWI questions interrogate state, not importance, the SWS state questions and weighted scores were used for the comparison. All results were significant at the 0.01 level, except one which was significant at the 0.05 level.
When examining the SWS state scores, the results of a series of Spearman’s Rho calculations revealed mostly moderate correlations, with four showing low correlations (0.267 ≤ r
s ≤ 0.296). Domain 2, relationship with God/the Divine, showed consistently stronger correlations than other questions. Overall, the strongest correlations were with spiritual beliefs, followed by religious beliefs, and lowest with religious practices. Again, domain 2 was the exception, reversing this trend. It seems that domain 2 relates more closely to religious beliefs and practices, while the other five domains relate better with spiritual beliefs. The details are displayed below in
Table 7.
The correlation between weighted SWS scores and the three PWI spirituality questions displayed a slightly different pattern. Overall, the correlation figures were lower than for the raw state scores. Just under half (8 out of 18) of the relationships were at the lower end of the moderate range (0.299 ≤ r
s ≤ 0.476), with the remainder showing low levels of correlation. The pattern of correlation observed for the state scores was not replicated. Rather, the responses demonstrated no obvious pattern other than domain 2 scoring higher than the others, followed by domains 1 and 6 (as in the state scores). This difference seems to reflect the variability that weighting adds to the wellbeing scores. (The details are displayed below in
Table 7).
Overall, the moderate correlation with the PWI Spirituality questions supports the SWS measuring some form of spiritual wellbeing. However, the low and low–moderate correlations raise the following question: why, if both scales measure spiritual wellbeing, was the correlation not higher? These results appear to be comparable with what one would expect of correlations with general wellbeing measures, rather than with spiritual wellbeing measures.
To investigate the lower-than-expected correlation with the PWI spiritual wellbeing questions, the questions were subject to a factor analysis. The team’s suspicion was that the PWI’s questions only represented one part of the construct represented in the SWS. As stated above, the state and weighted scores were both analysed against the PWI spirituality questions. The data were determined to be amenable to factor analysis, both for the state scores (Bartlett’s p < 0.001, KMO MSA = 0.840) and for the weighted scores (Bartlett’s p < 0.001, KMO MSA = 0.741). In each case, an exploratory PCA analysis was used, with a threshold of Eigenvalues greater than one using varimax rotation.
The PWI and SWS state scores resolved into a two-factor structure explaining 74.5 per cent of the variance. Factor one included all the SWS questions. Factor two loaded onto all three PWI questions and SWS domain two—relationship with God/the Divine. The weighted SWS scores resolved into a similar two-factor structure, explaining 63 per cent of the total variance. Factor two included all the SWS questions except domain two—relationship with God/the Divine, while factor one included the PWI questions, domain two and a cross-loading of domain one—meaning or purpose in life (albeit at a lower level than for factor 2). The results are displayed in
Table 8 and
Table 9. Overall, correlation and factor analysis results were reasonably similar for both the state and weighted scales.
The inclusion of domain 2 with the PWI questions in both analyses suggests a reason for the lower levels of correlation between the two measures of spiritual wellbeing. Our contention is that they measure different forms of spirituality. Factor two seems to represent formal (organised) spirituality, perhaps better termed “religion”, including theocentric types of spirituality. Whereas factor one seems to relate to a broader concept of less formal, non-theocentric spirituality. This explains the relatively low levels of correlation. While both the SWS and PWI are measuring spirituality, our contention is that they are measuring different constructs of spirituality.
A reasonable question to ask following this analysis is whether the scale is improved by the addition of the PWI questions, especially given they load more strongly onto the second factor than domain one or two of the SWS. We recommend not doing so for several reasons. Some unsolicited feedback from Mission Australia staff raised concerns that the PWI spirituality questions were culturally insensitive for those with an Aboriginal or Torres Strait Islander culture, specifically that their culture and spirituality are inextricably linked. We were pleased to receive this feedback as it reflected concerns we had ourselves (but not revealed to the participants). The goal of the team was that the SWS measure spirituality broadly, allowing for diverse forms of spirituality. From the start, we were concerned that the PWI questions were theoretically based on a narrower concept of spirituality that seemed to reflect a particularly Western understanding of organised religion. This analysis bears that out. Rather than use the PWI’s questions, we developed a broader-based question. We prefer to keep domain 2’s question, as the language was specifically designed to allow for non-Western theocentric spiritualities. An additional consideration is practical use. A shorter scale, with six questions rather than nine, is preferred in a clinical or pastoral setting. This is even more relevant in cases where low levels of education and literacy are common, as is the case in the Mission Australia context. Finally, by not including these questions, we do not lose a domain, as domain two provides information on the domain of spiritual wellbeing represented by factor two.
5.2. Positive and Negative Affect Schedule
The PANAS has two scales, one measuring positive affect, the other negative affect. The SWS should correlate moderately positively with the measure of positive affect, as one would expect spiritual wellbeing to be associated with positive affect. Similarly, the SWS is expected to have a negative correlation with negative affect. As expected, the data showed the SWS having significant moderate correlations in the directions hypothesised with both the positive (r = 0.489, p < 0.01) and negative (r = −0.427, p < 0.01) affect scales.
5.3. Personal Wellbeing Index General Questions
The SWS was compared with the PWI in three ways, with each of the seven PWI domains, with the composite (average) PWI score, and with the PWI’s optional satisfaction with life as a whole question.
4 Most variables displayed moderate correlation with the SWS, with three falling into the lower end of the strong correlation range. All were significant at the 0.01 level. The two composite measures are presented first in
Table 10, with the results for the seven domains below that.
Some concern might be expressed at the strength of some of these correlations. However, our analysis is that this reflects the similarity between respondents’ evaluation of their life in the PWI and the evaluation of spirituality, a domain which touches all aspects of their lives. That is, since spiritual wellbeing connects with concepts like meaning and purpose in their lives and their wider relationships, it conceptually relates strongly to an overall evaluation of wellbeing. For this reason, we contend that we see lower correlations with the individual domains, but stronger correlations with the composite score and their overall assessment of their “Life as a Whole”. The strong correlation with “Personal relationships” is unsurprising, as it is very close in concept to the SWS’s relationship with other and relationship with the wider community questions.
Overall, the analysis of the SWS against other wellbeing measures supports its use as a measure of spiritual wellbeing that has unique characteristics.
6. SWS Demographic Characteristics
Finally, we analysed the SWS against the various demographic variables mentioned above, age, gender, and ethnicity, to determine if participants from each of these groups varied significantly in their responses. Differences in respondents’ overall SWS score, their weighting of the various importance questions, and their rating of their current state according in each of the six SWS domains were all assessed using ANOVA, with Tukey post-hoc analyses.
There was a significant relationship between age and overall spiritual wellbeing (
F(4,205) = 2.53,
p < 0.05,
η2 = 0.05), the pattern being that spiritual wellbeing increased with age. Post-hoc analysis revealed no specific between group differences. The importance of domain 5, relationship with the environment, displayed significant differences by age (
F(4,205) = 3.50,
p < 0.01,
η2 = 0.07). Post-hoc analysis revealed that the youngest cohort (those in their 20s) differed significantly from respondents in all older groups, with both the difference in means and significance increasing with the difference in ages. The state sub-scales also revealed some age variation, including domain 4, relationship with the wider community (
F(4,205) = 2.94,
p < 0.05,
η2 = 0.06). The trend toward increasing wellbeing with age was also observed in this domain; however, no specific differences were significant in the post-hoc analysis. Domain 6, relationship with yourself, also displayed a significant relationship with age (
F(4,205) = 3.28,
p < 0.05,
η2 = 0.06). As stated previously, the trend was increasing wellbeing with age; however, the post-hoc analysis revealed a significant difference between those in their 30s and those in their 60s. (The details of the mentioned post-hoc analyses are displayed in
Table 11). Overall, the tendency was to observe significant differences in spiritual wellbeing with those in their earlier decades having lower levels than those in their later decades. The effect sizes were moderate for each of the significant relationships. Interestingly, the level of importance assigned to one’s relationship the environment increased with age, indicating that this is not solely a concern of the young, as some seem to portray in the popular media.
No significant differences were found between male and female respondents. Two of the importance questions approached the 0.05 significance level, domain 5, relationship with the environment (p = 0.054) and domain 6, relationship with yourself (p = 0.070). As further data are accumulated, gender differences in importance of the various SWS domains should be revisited to establish if these results become statistically significant gender differences.
Finally, the responses of the various ethnic groups represented were analysed. The respondents differed significantly in some areas. Their overall spiritual wellbeing scores were significantly different (F(2,201) = 3.45, p < 0.05, η2 = 0.034). Post-hoc analyses revealed that the Other group displayed a significantly higher mean score (μ = 8.0) than the NW Europeans (µ = 7.3, p < 0.05). Most other comparisons displayed no significant differences. The exception was the respondents’ state scores for domain 1, meaning or purpose in life (F(2,201) = 4.56, p < 0.05, η2 = 0.04). The post-hoc analysis for domain 1 state, meaning or purpose in life, revealed that the Other group (μ = 8.59) has a significantly higher mean score than the NW Europeans (μ = 7.54, p = 0.01) and Oceanians (μ = 7.77, p < 0.05). Domain 3 state, relationships with other people, almost rose to significance at the 0.05 level, with p = 0.051.
The small numbers in many ethnic groups limit the validity of this analysis. These results suggest that ethnicity is a factor in respondents’ level of spiritual wellbeing. However, a larger sample is required to provide a clearer picture of how ethnicity is interacting here. The moderate effect sizes indicate that such an analysis is worth pursuing.
7. Field Implementation Feedback
Some important feedback was provided by the chaplaincy team using the scale in the field. This concerns the format the scale is presented in the questionnaire. The chaplains found that after completing the six importance questions, there was a tendency for respondents to repeat their importance scores in their state scores. They reported that this duplication was less pronounced when the importance and state questions were asked on a question-by-question basis. The respondent was asked to indicate the importance for domain 1, then indicate their state for that same domain, before indicating the importance of domain 2, then indicating their state for domain 2, and so on. As this feedback was only received as this paper was being accepted for publication, the research team has not been able to evaluate this claim statistically. However, as we can see little risk and potential benefit from making this change, we recommend that this amended presentation be considered going forward.
8. Further Research
As this in an initial study, there are several areas for further research. An important area is confirmatory work with other spiritual wellbeing measures. This lack of comparison is a limitation of this research. The comparative studies should both confirm that the SWS is measuring spiritual wellbeing, and it should also compare the constructs used. Such comparisons should pay attention to the above critiques of existing spiritual wellbeing measures, that some seem tied to a theocentric or ritualistic view of spirituality, and that a weighting scale is needed to capture the complexity of respondent world views in a single measure.
Further research is also required to create a larger pool of responses for analysis. A larger pool of respondent data may help clarify the role of ethnicity in spiritual wellbeing. A larger data set will also allow the creation of normalised data, thus allowing a potential diagnostic use for the measure. At present, it is limited to comparative assessments and use as an initiator for pastoral or clinical discussions. A larger data set will also provide information for further psychometric analysis of the scale.
While the language of the ethnicity question was derived from the Australian Census, and a careful explanation given alongside this question in the survey, the research team are concerned that some may have confused ethnicity and nationality. Of concern is that high numbers of respondents identified as Indigenous Australians (39.5% of valid responses), whereas the 2021 Australian census has 3% of the population as Indigenous Aboriginal or Torres Strait Islander (
abs.gov.au). To mitigate this, further research might also include a question on nationality just before the ethnicity question to distinguish these concepts in people’s minds as they are responding.
Finally, whether the questions should be presented as two blocks, with the importance and state questions being asked together, or as six domains, with the state and importance questions being asked as pairs, needs to be investigated. Results should be collected using both methods and then compared to assess if the anecdotal report of the users is supported by the data.
Author Contributions
Conceptualization, N.P. and R.L.; methodology, R.L. and N.P.; software, N.P.; validation, N.P. and R.L. formal analysis, N.P.; investigation, N.P. and R.L.; resources, N.P.; data curation, N.P.; writing—original draft preparation, N.P.; writing—review and editing, N.P. and R.L.; supervision, N.P. and R.L.; project administration, N.P. and R.L.; funding acquisition, N.P. and R.L. All authors have read and agreed to the published version of the manuscript.
Funding
This research was funded in part through a research partnership between the Alphacrucis University College and Mission Australia.
Institutional Review Board Statement
Ethical approval for this research was obtained from Alphacrucis University College Human Research Ethics Committee (approval number 91) on 21 November 2022.
Informed Consent Statement
Since participation was via an anonymous online survey, consent is implied in the completion of the survey.
Data Availability Statement
The raw data supporting the conclusions of this article will be made available by the authors on request.
Conflicts of Interest
The authors declared no potential conflicts of interest with respect to the research, authorship, and/or publication of this article.
Notes
| 1 | In the UK, the term “Community Chaplain” is understood differently, denoting a ministry with ex-prisoners seeking to reintegrate into society. |
| 2 | Paloutzian et al.’s approach of having various translations to account for language and cultural differences was not seen as a workable option ( Paloutzian et al. 2021, stc. 5.4). It seemed impractical to ask chaplains to administer a differently worded version of something like the SWBS for Indigenous clients than for Muslims or atheists. Currently the SWS is English only. |
| 3 | We will present an extended analysis and discussion on the use of a two-part structure elsewhere. |
| 4 | |
References
- Chapman, Philip. 2023. Executive, Chaplaincy & Pastoral Care, Mission Australia. Testing Spiritual Wellbeing Index, Personal communication, February 15. [Google Scholar]
- Cooke, Philip J., Timothy P. Melchert, and Korey Connor. 2016. Measuring Well-Being: A Review of Instruments. The Counseling Psychologist 44: 730–57. [Google Scholar] [CrossRef]
- Crawford, John R., and Julie D. Henry. 2004. The positive and negative affect schedule (PANAS): Construct validity, measurement properties and normative data in a large non-clinical sample. British Journal of Clinical Psychology 43: 245–65. [Google Scholar] [CrossRef] [PubMed]
- Daaleman, Timothy P., and Bruce B. Frey. 2004. The Spirituality Index of Well-Being: A New Instrument for Health-Related Quality-of-Life Research. The Annals of Family Medicine 2: 499–503. [Google Scholar] [CrossRef] [PubMed]
- Ellison, Craig W. 1983. Spiritual well-being: Conceptualization and measurement. Journal of Psychology & Theology 11: 330–40. [Google Scholar]
- Exline, Julie Juola, Ann Marie Yali, and William C. Sanderson. 2000. Guilt, Discord and Alienation: The Role of Religious Strain in Depression and Suicidality. Journal of Clinical Psychology 56: 1481–96. [Google Scholar] [CrossRef] [PubMed]
- Fisher, John, and David Ng. 2017. Presenting a 4-Item Spiritual Well-Being Index (4-ISWBI). Religions 8: 179. [Google Scholar] [CrossRef]
- Gomez, Rapson, and John W. Fisher. 2003. Domains of spiritual well-being and development and validation of the Spiritual Well-Being Questionnaire. Personality and Individual Differences 35: 1975–91. [Google Scholar] [CrossRef]
- Hall, Todd W., and Keith J. Edwards. 2002. The Spiritual Assessment Inventory: A Theistic Model and Measure for Assessing Spiritual Development. Journal for the Scientific Study of Religion 41: 341–57. [Google Scholar] [CrossRef]
- Hatch, Robert L., MaryAnn Burg, Debra S. Naberhaus, and Linda K. Hellmich. 1998. The spiritual involvement and beliefs scale: Development and testing of a new instrument. Journal of Family Practice 46: 476–86. [Google Scholar] [PubMed]
- International Wellbeing Group. 2013. Personal Wellbeing Index, 5th ed. Melbourne: Australian Centre on Quality of Life, Deakin University. Available online: http://www.acqol.com.au/instruments#measures (accessed on 30 September 2022).
- Kass, Jared D., Richard Friedman, Jane Leserman, Patricia C. Zuttermeister, and Herbert Benson. 1991. Health Outcomes and a New Index of Spiritual Experience. Journal for the Scientific Study of Religion 30: 203–11. [Google Scholar] [CrossRef]
- King, David Brian. 2008. Rethinking Claims of Spiritual Intelligence: A Definition, Model, and Measure. Master’s thesis, Trent University, Peterborough, ON, Canada. unpublished. [Google Scholar]
- Loewenthal, Kate Miriam, and Christopher Alan Lewis. 2020. An Introduction to Psychological Tests and Scales, 3rd ed. Abingdon: Routledge. [Google Scholar] [CrossRef]
- Paloutzian, Raymond F., Zuhâl Agilkaya-Sahin, Kay C. Bruce, Marianne Nilsen Kvande, Klara Malinakova, Luciana Fernandes Marques, Ahmad S. Musa, Marzieh Nojomi, Eyüp Ensar Öztürk, Indah Permata Putri, and et al. 2021. The Spiritual Well-Being Scale (SWBS): Cross-Cultural Assessment Across 5 Continents, 10 Languages, and 300 Studies. In Assessing Spirituality in a Diverse World. Edited by Amy L. Ai, Paul Wink, Raymond F. Paloutzian and Kevin A. Harris. Cham: Springer International Publishing, pp. 413–44. [Google Scholar] [CrossRef]
- Seidlitz, Larry, Alexis D. Abernethy, Paul R. Duberstein, James S. Evinger, Theresa H. Chang, and Bar’bara L. Lewis. 2002. Development of the Spiritual Transcendence Index. Journal for the Scientific Study of Religion 41: 439–53. [Google Scholar] [CrossRef]
- Trauer, Tom, and Andrew Mackinnon. 2001. Why are we weighting? The role of importance ratings in quality of life measurement. Quality of Life Research 10: 579–85. [Google Scholar] [CrossRef] [PubMed]
- Watson, David, Lee Anna Clark, and Auke Tellegen. 1988. Development and Validation of Brief Measures of Positive and Negative Affect: The PANAS Scales. Journal of Personality and Social Psychology 54: 1063–70. [Google Scholar] [CrossRef] [PubMed]
| Disclaimer/Publisher’s Note: The statements, opinions and data contained in all publications are solely those of the individual author(s) and contributor(s) and not of MDPI and/or the editor(s). MDPI and/or the editor(s) disclaim responsibility for any injury to people or property resulting from any ideas, methods, instructions or products referred to in the content. |
© 2025 by the authors. Licensee MDPI, Basel, Switzerland. This article is an open access article distributed under the terms and conditions of the Creative Commons Attribution (CC BY) license (https://creativecommons.org/licenses/by/4.0/).


