Perceived Group Deprivation and Intergroup Solidarity: Muslims’ Attitudes towards Other Minorities in the United States


Abstract
1. Introduction
2. Literature Review
2.1. African Americans, Perceived Group Deprivation, and Resulting Solidarities
2.2. The Group Deprivation–Solidarity Link among Latinx and Asian Americans
2.3. American Muslims, Perceived Group Deprivation, and Solidarity
3. Materials and Methods
3.1. Data
3.2. Analytic Strategy
3.3. Measures
3.3.1. Independent Variables
Experiences of Discrimination as Muslims
Perceived Discrimination against Muslims
3.3.2. Dependent Variables
Equality for Black People
Equality for LG People
Other Solidarity Questions—Immigrants, Jews and Hispanics
3.3.3. Control Variables
4. Results
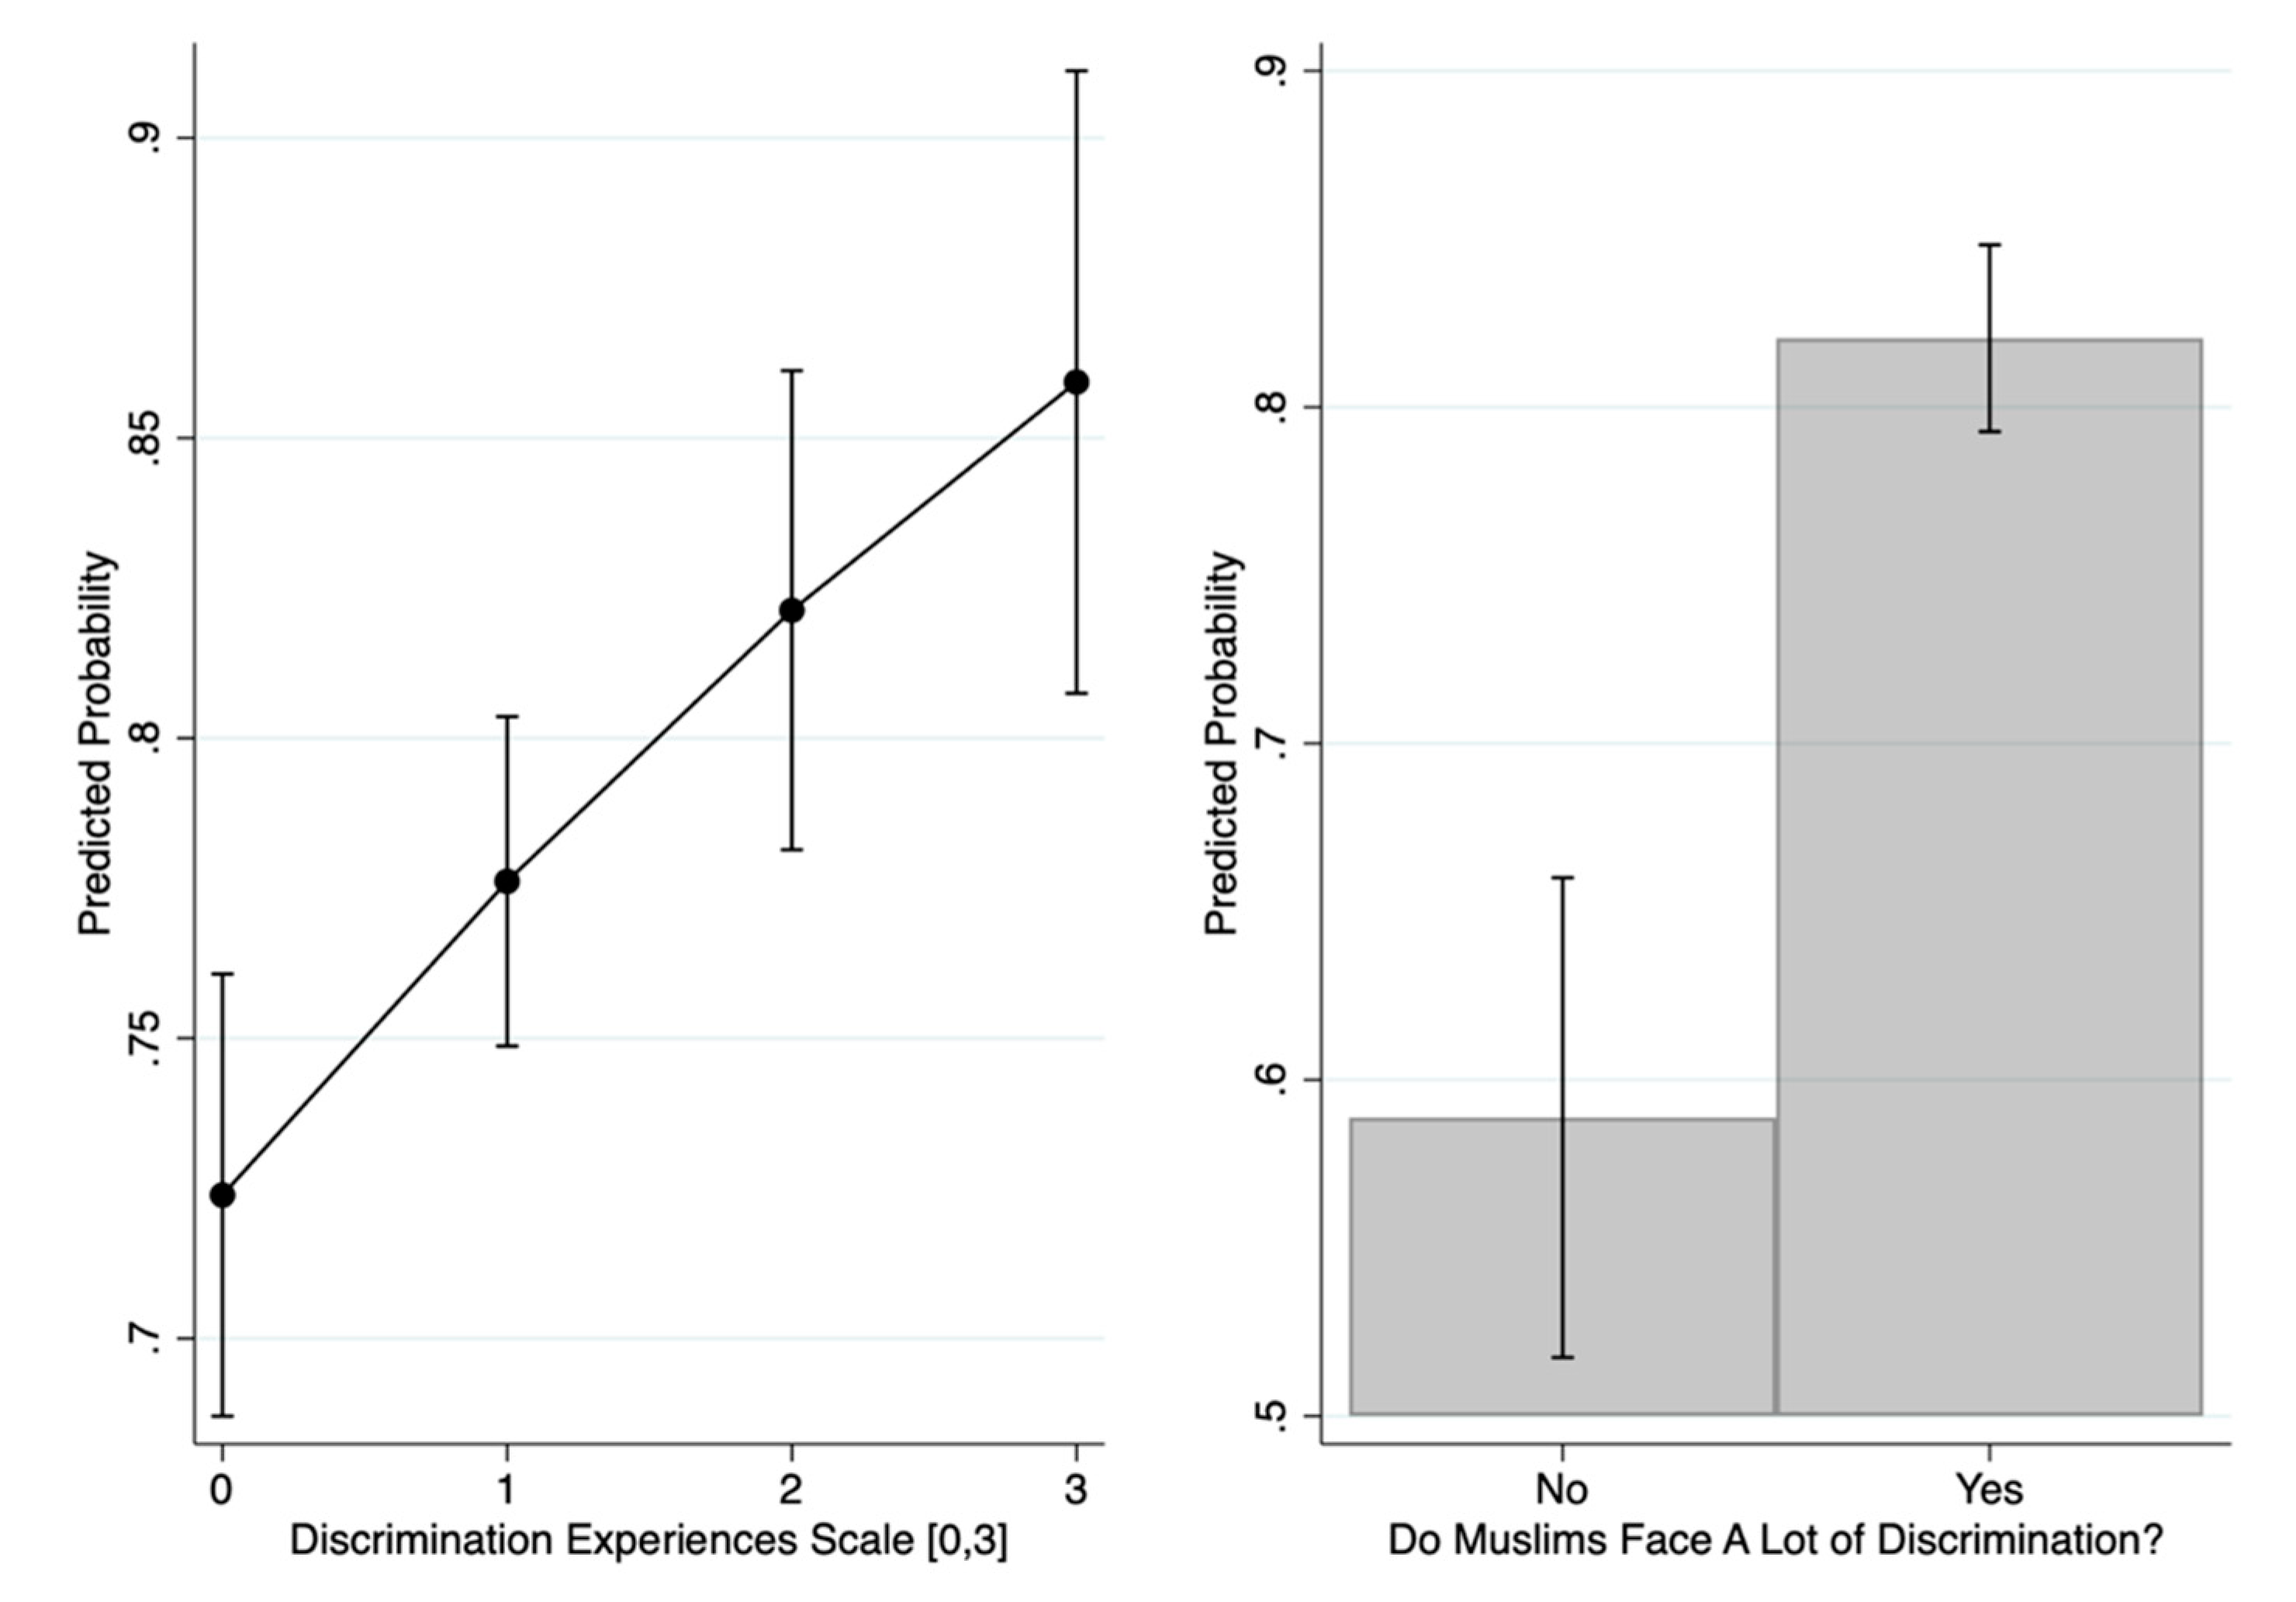
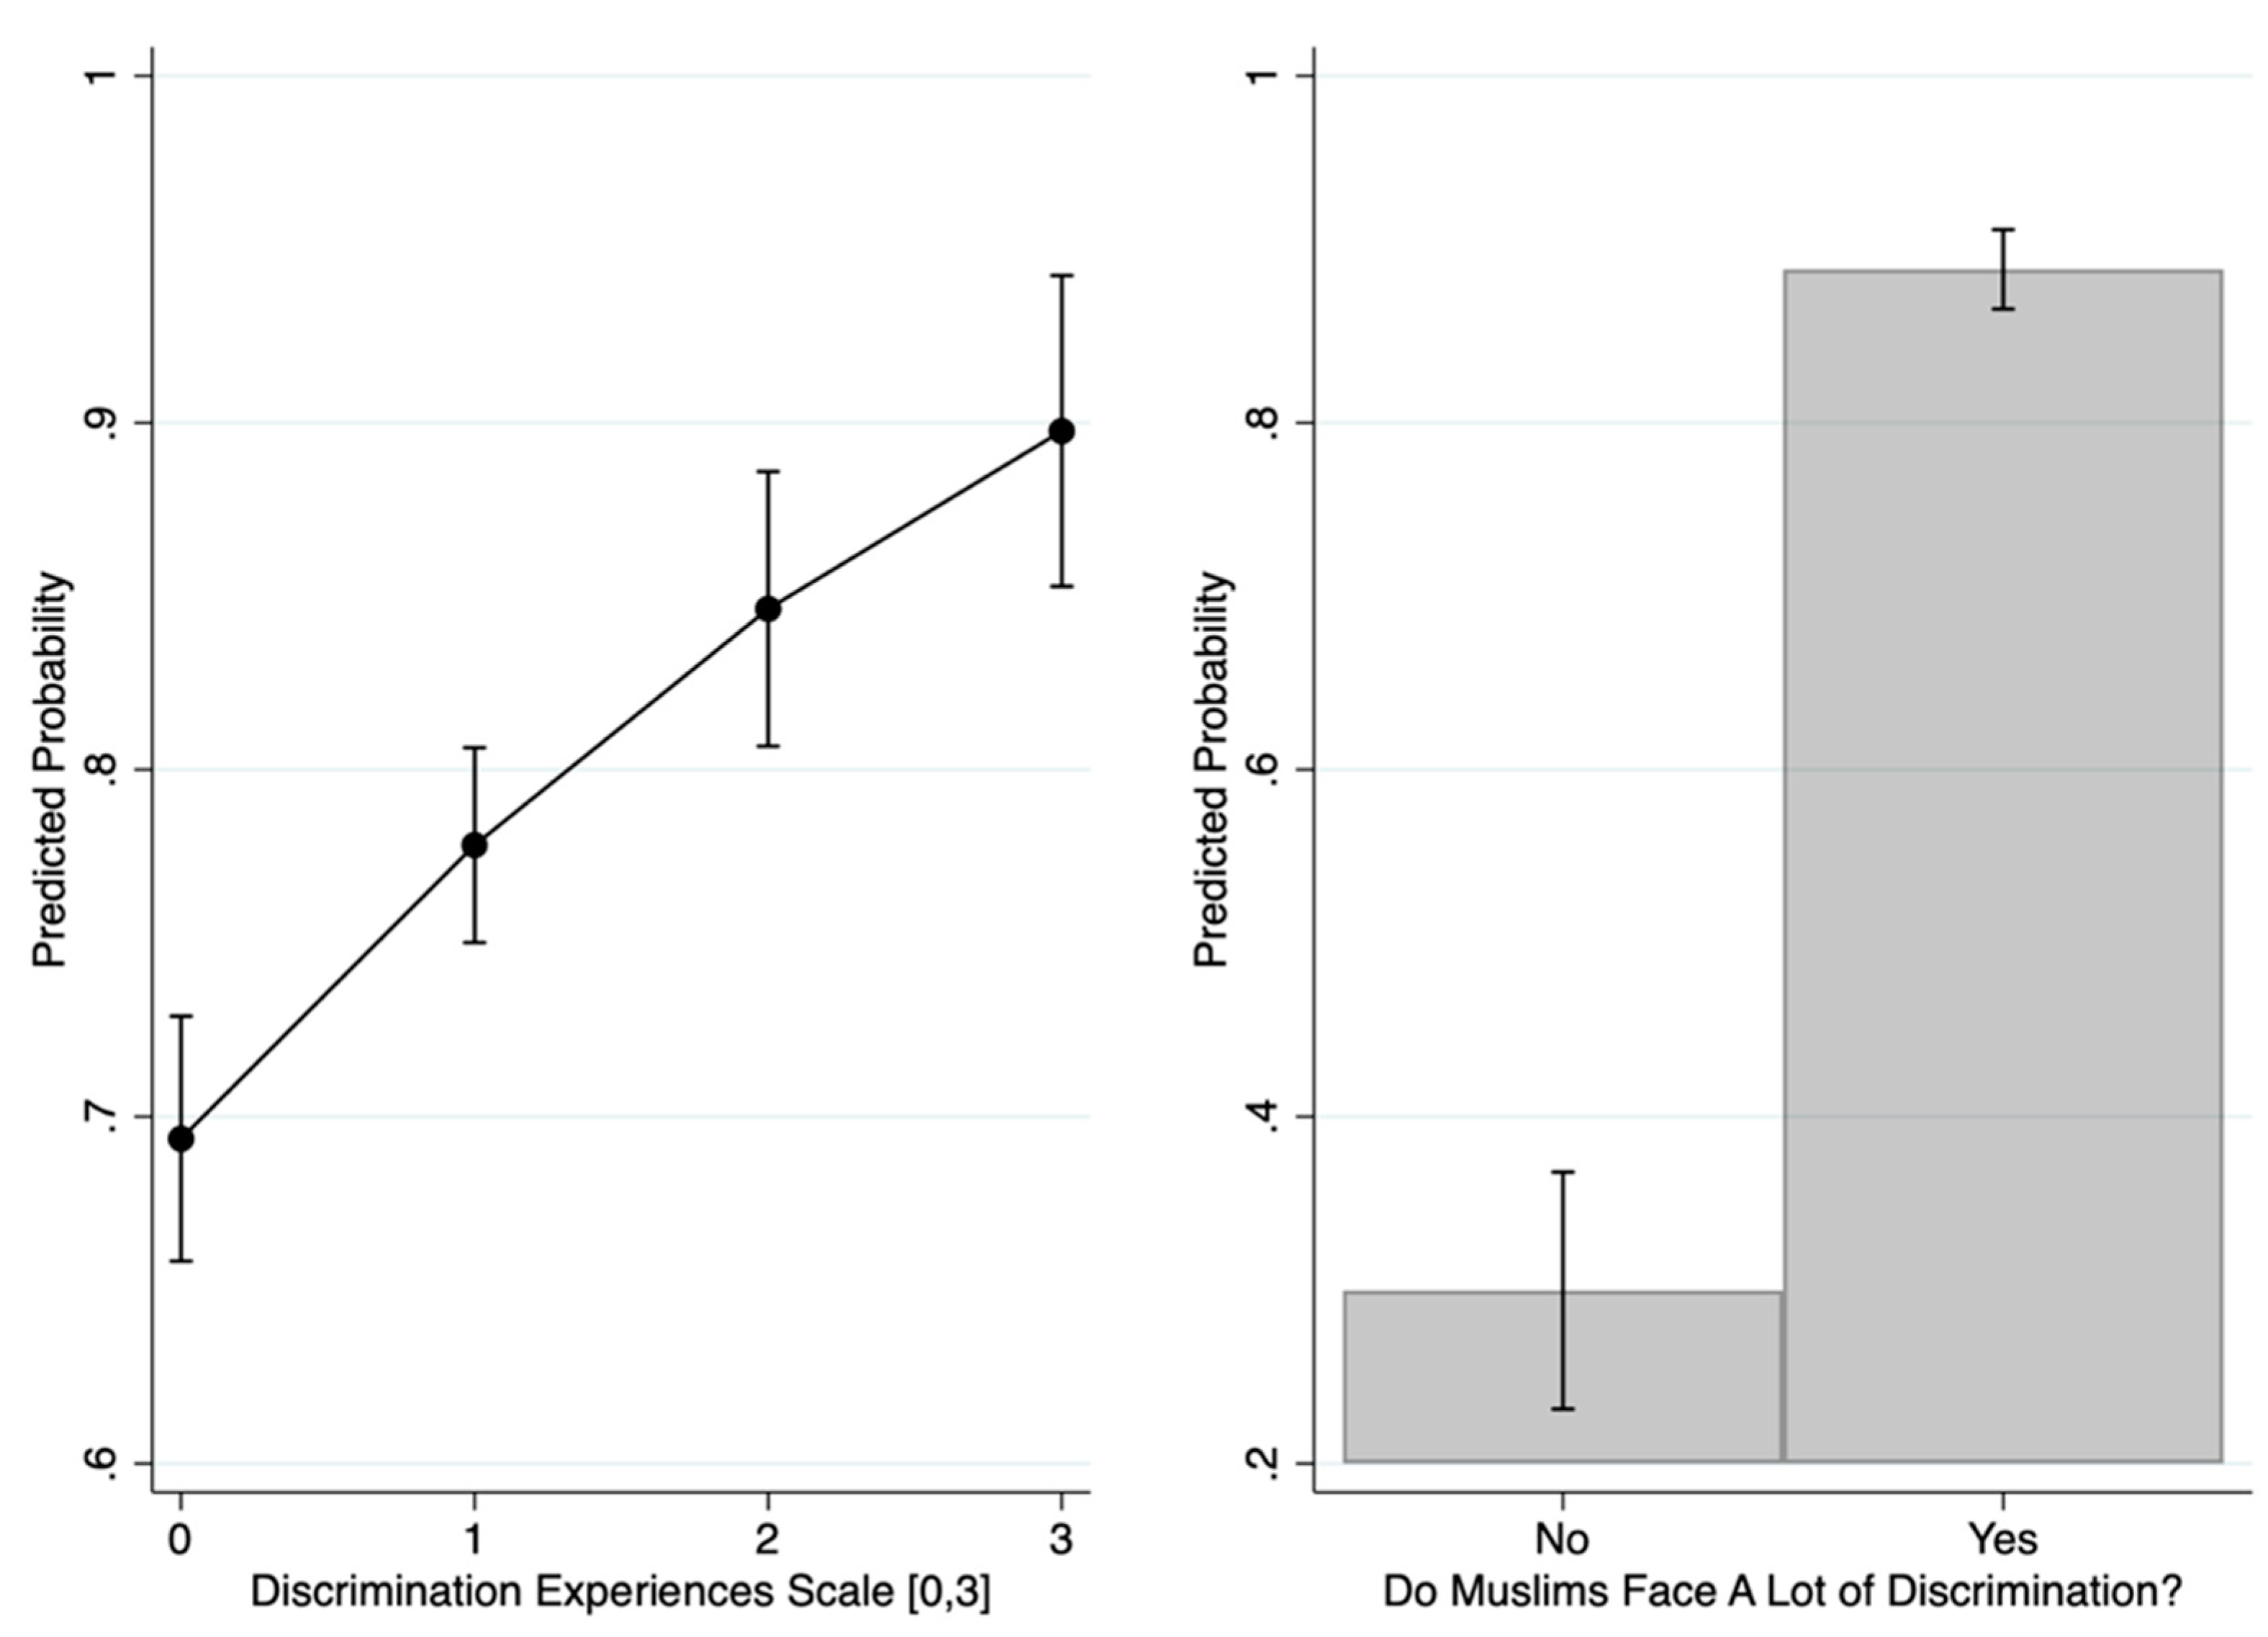
4.1. Equality for Black People
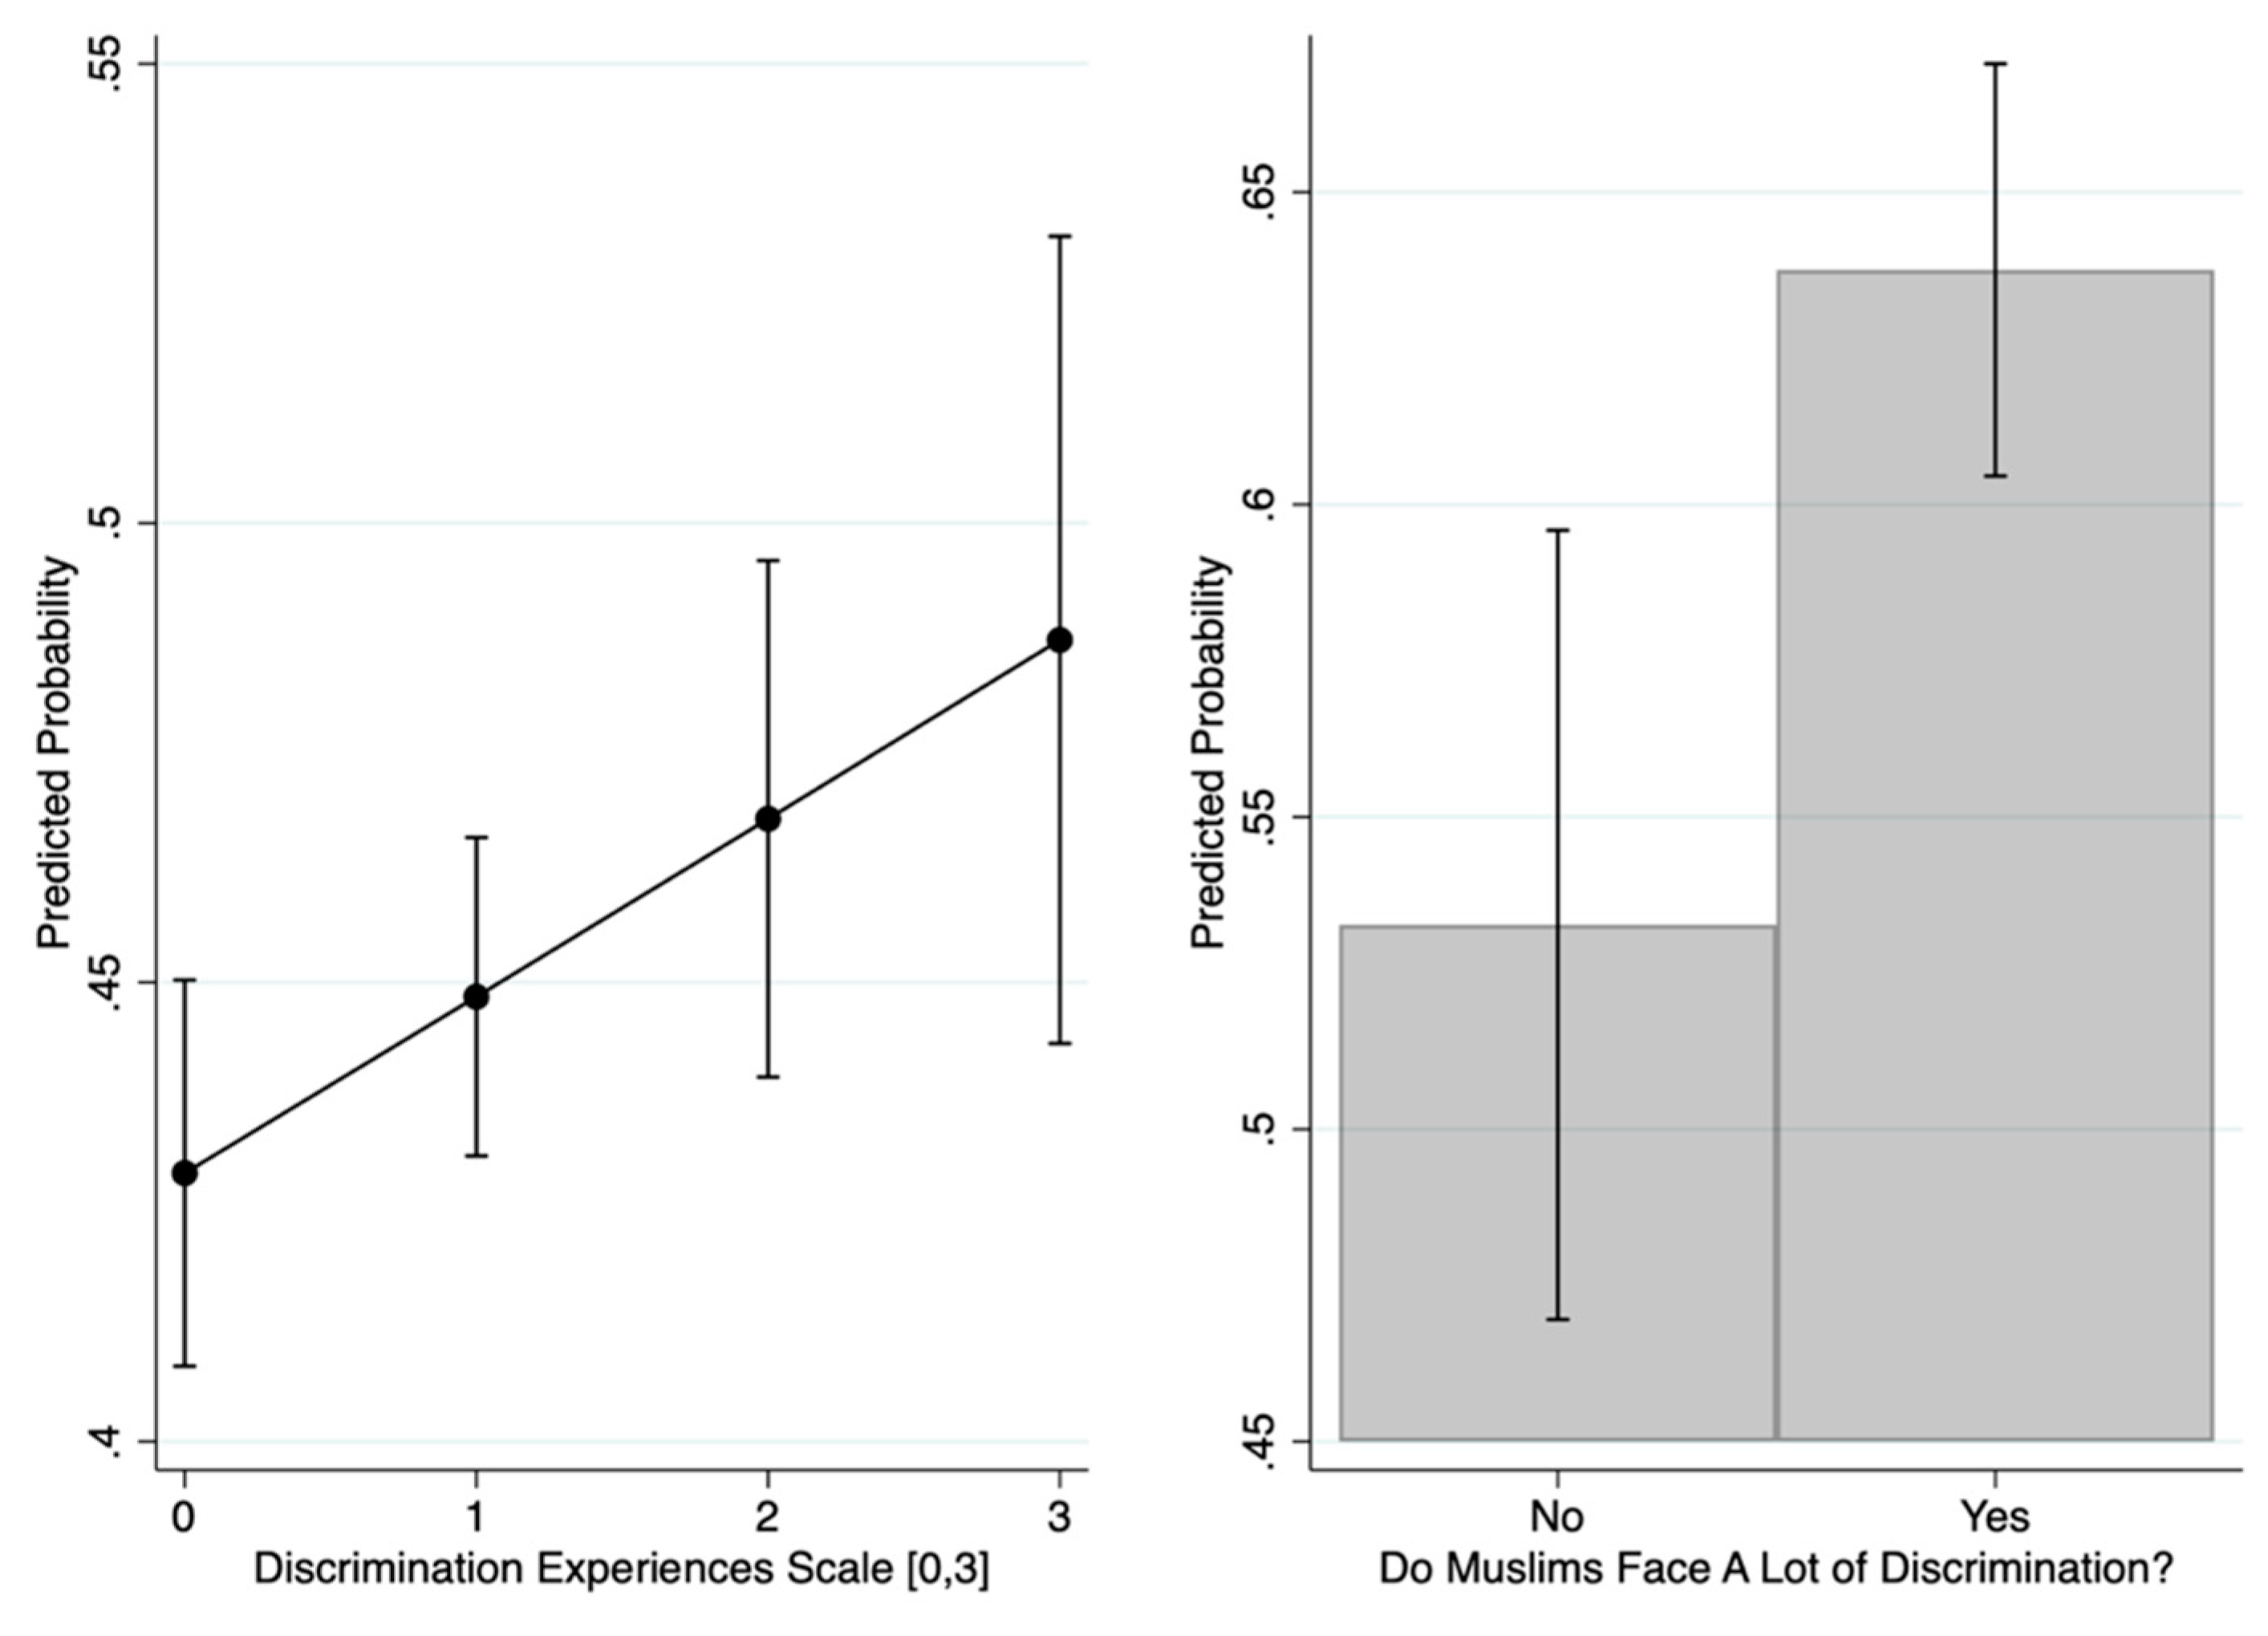
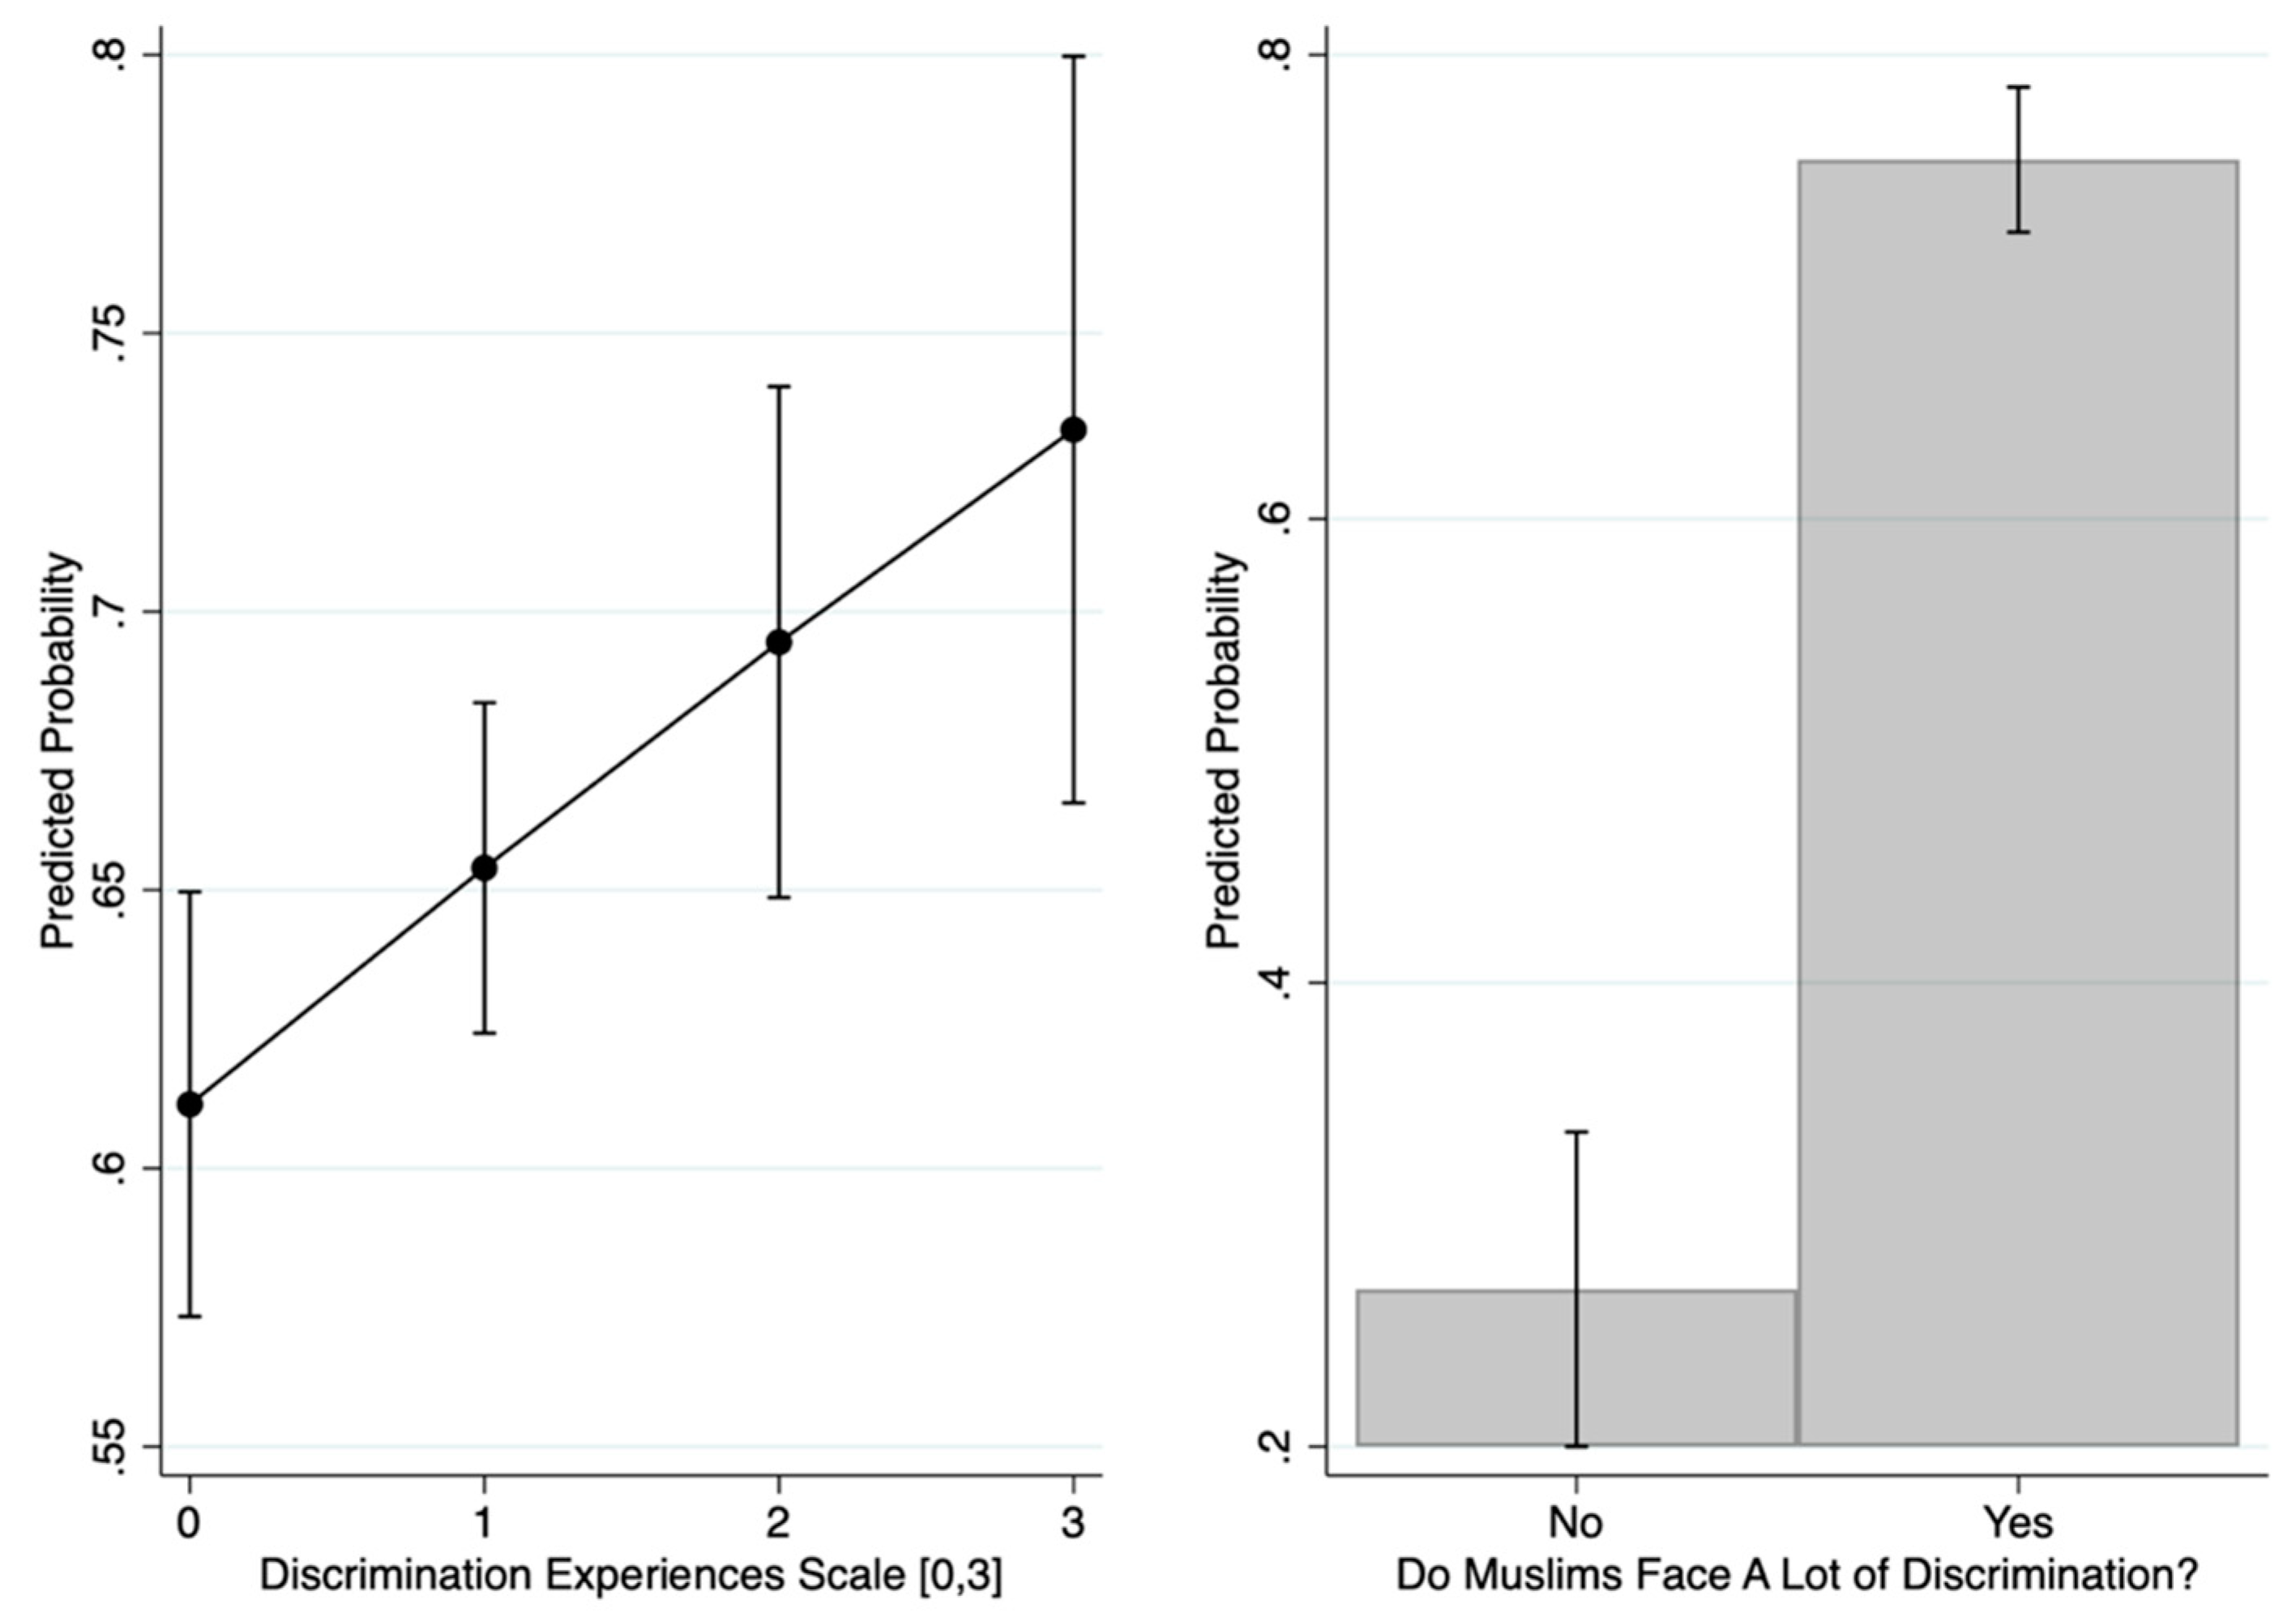
4.2. Equality for LG People
4.3. Other Solidarity Questions—Immigrants, Jews and Hispanics
5. Discussion
6. Conclusions
Author Contributions
Funding
Acknowledgments
Conflicts of Interest
Appendix A

| (1) | (2) | (3) | (4) | |
|---|---|---|---|---|
| Change Needed for Equality for Black People | Perceived Discrimination against Black People | |||
| Discrimination Experiences Scale [0,3] | 0.34 *** | 0.60 *** | ||
| Perceived Discrimination against Muslims (Ref: No) | 1.37 *** | 3.39 *** | ||
| Constant | 0.92 *** | 0.21 | 0.70 *** | −1.21 *** |
| Observations | 917 | 922 | 947 | 955 |
| (1) | (2) | (3) | (4) | |
|---|---|---|---|---|
| Homosexuality Should Be Accepted | Perceived Discrimination against Gays and Lesbians | |||
| Discrimination Experiences Scale [0,3] | 0.15 *** | 0.33 *** | ||
| Perceived Discrimination against Muslims (Ref: No) | 0.82 *** | 2.73 *** | ||
| Constant | −0.34 *** | −0.17 | 0.33 *** | −1.49 *** |
| Observations | 2612 | 841 | 886 | 895 |
| (1) | (2) | (3) | (4) | (5) | (6) | |
|---|---|---|---|---|---|---|
| Approval of Immigrant | Hispanics Face Discrimination | Jews Face Discrimination | ||||
| Discrimination Experiences Scale [0,3] | −0.01 | 0.51 *** | 0.34 *** | |||
| Perceived Discrimination against Muslims (Ref: No) | 0.70 ** | 3.23 *** | 2.72 *** | |||
| Constant | 1.89 *** | 1.91 *** | 0.35 *** | −1.72 *** | −0.61 *** | −2.64 *** |
| Observations | 2775 | 923 | 905 | 918 | 879 | 887 |
| (1) | (2) | (3) | (4) | |
|---|---|---|---|---|
| Change Needed for Equality for Black People | Perceived Discrimination against Black People | |||
| Discrimination Experiences Scale [0,3] | 0.31 *** | 0.48 *** | ||
| Perceived Discrimination against Muslims (Ref: No) | 1.26 *** | 3.27 *** | ||
| Age (Ref: 18–24) | ||||
| 25–34 | −0.18 | −0.08 | −0.62 * | −0.47 |
| 35–44 | −0.08 | 0.06 | −0.21 | 0.27 |
| 45–54 | −0.03 | 0.09 | −0.65 * | −0.40 |
| 55–64 | −0.01 | −0.03 | −0.12 | 0.00 |
| 65+ | 0.04 | 0.10 | −0.58 | −0.40 |
| Don’t Know/Refused | 0.10 | 0.10 | −0.48 | −0.73 |
| Female | 0.29 | 0.18 | 0.74 *** | 0.49 |
| Ethnicity, Race and Generation (Ref: 1st or 2nd Gen MENA) | ||||
| 1/2nd Gen S. Asian | 0.46 * | 0.47 * | 0.01 | 0.01 |
| 1/2nd Gen NB-Other | 0.69 * | 0.69 * | 0.40 | 0.57 |
| 1/2nd Gen Bl | 0.84 ** | 0.73 * | 0.88 ** | 0.93 * |
| 3rdG + Black | 1.60 *** | 1.30 ** | 2.06 *** | 1.45 ** |
| 3rdG + White | 0.27 | 0.09 | 0.68 | 0.15 |
| 3rdG + Other | 1.62 * | 1.49 * | 1.00 | 0.41 |
| Don’t Know/Refused | 0.34 | 0.23 | 1.38 | 0.99 |
| Generation (Ref: 1st Generation) | ||||
| Second Generation | 0.08 | 0.06 | 0.38 | 0.30 |
| Don’t Know/Refused | −0.26 | −0.11 | −1.01 | −0.29 |
| Income (Ref: Less than $30K) | ||||
| $30K–Under $50K | 0.41 | 0.35 | 0.39 | 0.29 |
| $50K–Under $100K | 0.30 | 0.17 | 0.69 ** | 0.49 |
| $100K + | 0.49 * | 0.38 | 1.03 *** | 0.97 ** |
| Don’t Know/Refused | 0.04 | −0.01 | 0.25 | 0.18 |
| Mosque Attendance (Ref: Never) | ||||
| Seldom | 0.38 | 0.24 | 0.84 * | 0.64 |
| Few/Year | 0.31 | 0.13 | 0.89 ** | 0.49 |
| 1–2/Month | 0.47 | 0.35 | 0.46 | 0.05 |
| 1/Week | −0.05 | −0.22 | 0.43 | −0.06 |
| >1/Week | 0.28 | 0.10 | 0.63 | 0.07 |
| Prayer Frequency (Ref: Never) | ||||
| Eid Only | −0.45 | −0.45 | −0.29 | −0.37 |
| Occasionally | −0.70 | −0.57 | −0.39 | −0.08 |
| Some/Day | −0.58 | −0.41 | −0.17 | 0.40 |
| 5/Day | −0.39 | −0.25 | −0.29 | 0.07 |
| Political Ideology (Ref: Very Conservative) | ||||
| Conservative | 1.54 ** | 1.43 ** | 0.14 | −0.49 |
| Moderate | 1.69 ** | 1.50 ** | 1.05 * | 0.51 |
| Liberal | 1.50 ** | 1.23 * | 1.31 * | 0.60 |
| Very Liberal | 1.94 *** | 1.75 ** | 1.18 * | 0.70 |
| Don’t Know/Refused | 0.95 | 0.71 | 0.60 | −0.04 |
| Constant | −1.09 | −1.48 * | −1.12 | −2.39 ** |
| Observations | 1001 | 1001 | 1001 | 1001 |
| (1) | (2) | (3) | (4) | |
|---|---|---|---|---|
| Homosexuality Should Be Accepted | Perceived Discrimination against Gays and Lesbians | |||
| Discriminations Experiences Scale [0,3] | 0.12 ** | 0.21 * | ||
| Perceived Discrimination against Muslims (Ref: No) | 0.58 ** | 2.50 *** | ||
| Age (Ref: 18–24) | ||||
| 25–34 | −0.41 ** | −0.45 | −0.83 *** | −0.74 ** |
| 35–44 | −0.75 *** | −0.99 *** | −0.81 ** | −0.62 * |
| 45–54 | −1.05 *** | −1.22 *** | −0.65 * | −0.44 |
| 55–64 | −1.00 *** | −1.39 *** | −0.66 * | −0.66 |
| 65+ | −1.57 *** | −2.03 *** | −0.92 ** | −0.74 * |
| Don’t Know/Refused | −0.80 | −0.64 | 0.95 | 0.91 |
| Female | 0.46 *** | 0.64 ** | 1.06 *** | 0.94 *** |
| Ethnicity, Race, and Generation (Ref: 1st or 2nd Gen MENA) | ||||
| 1st or 2nd Gen. S. Asian | −0.05 | 0.34 | 0.17 | 0.23 |
| 1st or 2nd Gen. Non-Black Other | 0.53 ** | 0.69 * | 0.06 | 0.05 |
| 1st or 2nd Gen. Black | 0.35 | 0.45 | 0.79 ** | 0.73 * |
| 3rd Gen. + Black | 0.25 | 0.00 | 1.22 *** | 0.71 * |
| 3rd Gen. + White | 1.03 *** | 1.58 * | 1.31 * | 1.15 |
| 3rd Gen. + Other | 0.60 * | 0.74 | 0.91 * | 0.49 |
| Don’t Know/Refused | −0.07 | 0.25 | 2.06 * | 1.87 |
| Generation (Ref: 1st Generation) | ||||
| Second Generation | 0.44 ** | 0.32 | 0.41 | 0.33 |
| Don’t Know/Refused | −0.15 | −0.44 | −2.36 * | −2.13 |
| Income (Ref: Less than $30K) | ||||
| $30K–Under $50K | −0.04 | 0.17 | 0.27 | 0.19 |
| $50K–Under $100K | 0.10 | 0.36 | 0.68 ** | 0.52 * |
| $100K + | 0.65 *** | 0.99 *** | 0.92 *** | 0.82 ** |
| Don’t Know/Refused | 0.17 | 0.56 | 0.26 | 0.25 |
| Mosque Attendance (Ref: Never) | ||||
| Seldom | −0.01 | 0.44 | 0.71 | 0.45 |
| Few/Year | −0.22 | −0.15 | 0.80 ** | 0.54 |
| 1–2/Month | −0.35 | −0.13 | 0.51 | 0.29 |
| 1/Week | −0.38 * | −0.26 | 0.32 | 0.01 |
| >1/Week | −0.80 *** | −0.58 | 0.48 | 0.11 |
| Prayer Frequency (Ref: Never) | ||||
| Eid Only | −0.19 | 0.35 | −0.66 | −0.82 |
| Occasionally | −0.30 | −0.23 | −0.64 | −0.60 |
| Some/Day | −0.76 *** | −0.46 | −0.15 | 0.13 |
| 5/Day | −1.25 *** | −1.19 ** | −0.70 * | −0.65 |
| Political Ideology (Ref: Very Conservative) | ||||
| Conservative | 0.61 | 0.96 | 0.15 | −0.14 |
| Moderate | 0.67 * | 1.18 * | 0.77 | 0.37 |
| Liberal | 1.14 *** | 1.57 * | 1.14 * | 0.65 |
| Very Liberal | 1.36 *** | 1.50 * | 0.97 | 0.60 |
| Don’t Know/Refused | 0.32 | 1.04 | 0.55 | 0.26 |
| Year (Ref: 2007) | ||||
| 2011 | 0.45 *** | |||
| 2017 | 1.07 *** | |||
| Constant | −0.39 | −0.50 | −0.84 | −1.96 ** |
| Observations | 3084 | 1001 | 1001 | 1001 |
| (1) | (2) | (3) | (4) | (5) | (6) | |
|---|---|---|---|---|---|---|
| Approval of Immigrants | Perceived Discrimination against Hispanics | Perceived Discrimination against Jews | ||||
| Discrimination Experiences Scale [0,3] | 0.00 | 0.37 *** | 0.27 *** | |||
| Perceived Discrimination against Muslims (Ref: No) | 0.81 ** | 3.04 *** | 2.57 *** | |||
| Age (Ref: 18–24) | ||||||
| 25–34 | −0.37 | −0.90 | −0.51 * | −0.38 | −0.28 | −0.18 |
| 35–44 | −0.65 ** | −0.61 | −0.55 * | −0.29 | 0.08 | 0.28 |
| 45–54 | −0.73 ** | −0.77 | −0.63 * | −0.47 | 0.13 | 0.28 |
| 55–64 | −0.46 | −0.55 | −0.37 | −0.42 | 0.13 | 0.16 |
| 65 + | −0.31 | −0.14 | −0.56 | −0.38 | 0.15 | 0.37 |
| Don’t Know/Refused | −0.92 | −0.96 | −0.31 | −0.48 | 0.93 | 0.96 |
| Female | 0.20 | 0.61 * | 0.63 *** | 0.42 * | 0.25 | 0.10 |
| Ethnicity, Race, and Generation (Ref: 1st or 2nd Gen MENA) | ||||||
| 1st or 2nd Gen. S. Asian | 0.40 * | 0.60 | 0.15 | 0.24 | −0.08 | −0.07 |
| 1st or 2nd Gen. Non-Black Other | −0.04 | −0.46 | 0.02 | −0.02 | −0.12 | −0.15 |
| 1st or 2nd Gen. Black | 0.69 * | 1.93 | 0.75 * | 0.69 | 0.85 ** | 0.78 ** |
| 3rd Gen. + Black | −1.17 *** | −1.35 ** | 1.20 *** | 0.57 | 0.62 * | 0.25 |
| 3rd Gen. + White | −0.31 | −0.93 | 0.63 | 0.27 | 0.23 | 0.04 |
| 3rd Gen. + Other | −0.95 ** | −1.03 | 0.97 * | 0.52 | 1.07 * | 0.87 * |
| Don’t Know/Refused | −0.31 | 13.87 | 0.06 | −0.47 | 0.38 | 0.17 |
| Generation (Ref: 1st Generation) | ||||||
| Second Generation | −0.29 | −0.22 | 0.29 | 0.21 | 0.67 ** | 0.67 ** |
| Don’t Know/Refused | −0.12 | −14.97 | −0.08 | 0.56 | −0.72 | −0.49 |
| Income (Ref: Less than $30K) | ||||||
| $30K–Under $50K | 0.32 | 1.04 * | 0.32 | 0.27 | 0.08 | 0.04 |
| $50K–Under $100K | 0.42 ** | 0.45 | 0.70 ** | 0.54 * | 0.61 ** | 0.48 * |
| $100K + | 1.00 *** | 0.98 * | 1.02 *** | 0.99 *** | 0.65 ** | 0.54 * |
| Don’t Know/Refused | 0.71 ** | 0.16 | 0.27 | 0.21 | 0.24 | 0.18 |
| Mosque Attendance (Ref: Never) | ||||||
| Seldom | 0.22 | 0.90 | 0.91 * | 0.77 | 0.83 * | 0.69 |
| Few/Year | 0.10 | −0.21 | 0.77 ** | 0.48 | 0.75 ** | 0.57 |
| 1–2/Month | 0.21 | −0.17 | 0.95 ** | 0.89 * | 0.36 | 0.20 |
| 1/Week | 0.10 | 0.16 | 0.55 | 0.29 | 0.38 | 0.22 |
| >1/Week | 0.18 | 0.36 | 0.68 * | 0.34 | 0.49 | 0.28 |
| Prayer Frequency (Ref: Never) | ||||||
| Eid Only | −0.15 | 1.22 | −0.48 | −0.54 | −0.54 | −0.49 |
| Occasionally | 0.41 | 0.96 | −0.37 | −0.16 | −0.52 | −0.33 |
| Some/Day | 0.23 | 0.66 | −0.14 | 0.28 | 0.11 | 0.42 |
| 5/Day | 0.26 | 0.50 | −0.14 | 0.17 | −0.22 | −0.00 |
| Political Ideology (Ref: Very Conservative) | ||||||
| Conservative | 0.44 | 0.63 | 0.09 | −0.43 | 0.29 | 0.05 |
| Moderate | 0.80 ** | 1.13 * | 0.68 | 0.08 | 0.42 | 0.05 |
| Liberal | 1.16 *** | 1.28 * | 1.30 ** | 0.71 | 0.48 | 0.01 |
| Very Liberal | 0.70 * | 0.77 | 1.14 * | 0.70 | 0.97 | 0.64 |
| Don’t Know/Refused | 0.64 * | 1.20 | 0.52 | −0.01 | 0.34 | −0.01 |
| Year (Ref: 2007) | ||||||
| 2011 | −0.15 | |||||
| 2017 | 0.58 *** | |||||
| Constant | 0.82 * | 0.29 | −1.27 * | −2.69 *** | −1.96 *** | −3.54 *** |
| Observations | 3084 | 1001 | 1001 | 1001 | 1001 | 1001 |
References
- Abdul Khabeer, Su’ad. 2016. Muslim Cool: Race, Religion, and Hip Hop in the United States. Reprint edition. New York: New York University Press. [Google Scholar]
- Alcoff, Linda Martín. 2005. Latino vs. Hispanic: The Politics of Ethnic Names. Philosophy & Social Criticism 31: 395–407. [Google Scholar] [CrossRef]
- Bail, Christopher A. 2014. Terrified: How Anti-Muslim Fringe Organizations Became Mainstream. Princeton: Princeton University Press. [Google Scholar]
- Barreto, Matt A., and Karam Dana. 2008. The Political Incorporation of Muslims in America: The Role of Religiosity in Islam. In Journal of Race, Ethnicity, and Politics. vol. 2. [Google Scholar] [CrossRef]
- Barreto, Matt A., and Nathan D. Woods. 2005. The Anti-Latino Political Context and its Impact on GOP Detachment and Increasing Latino Voter Turnout in Los Angeles County. Diversity in Democracy: Minority Representation in the United States 98: 148–69. [Google Scholar]
- Bechrouri, Ibrahim. 2018. The Informant, Islam, and Muslims in New York City. Surveillance & Society 16: 459–72. [Google Scholar] [CrossRef]
- Bonilla-Silva, Eduardo. 2001. White Supremacy and Racism in the Post-Civil Rights Era. Boulder: Lynne Rienner Publishers. [Google Scholar]
- Boundaoui, Assia. 2018. The Feeling of Being Watched. Available online: http://www.feelingofbeingwatched.com/ (accessed on 15 September 2020).
- Bowler, Shaun, Stephen P. Nicholson, and Gary M. Segura. 2006. Earthquakes and Aftershocks: Race, Direct Democracy, and Partisan Change. American Journal of Political Science 50: 146–59. [Google Scholar] [CrossRef]
- Braunstein, Ruth. 2019. Muslims as outsiders, enemies, and others: The 2016 presidential election and the politics of religious exclusion. In Politics of Meaning/Meaning of Politics. Cham, Switzerland: Springer, pp. 185–206. [Google Scholar]
- Brubaker, Rogers. 2004. Ethnicity without Groups. Cambridge: Harvard University Press. [Google Scholar]
- Cain, Bruce E., D. Roderick Kiewiet, and Carole J. Uhlaner. 1991. The Acquisition of Partisanship by Latinos and Asian Americans. American Journal of Political Science, 390–422. [Google Scholar] [CrossRef]
- Cainkar, Louise A. 2002. No Longer Invisible: Arab and Muslim Exclusion after September 11. Social and Cultural Sciences Faculty Research and Publications. Available online: https://epublications.marquette.edu/cgi/viewcontent.cgi?referer=https://www.google.com.hk/&httpsredir=1&article=1006&context=socs_fac (accessed on 21 June 2019).
- Cainkar, Louise A. 2009. Homeland Insecurity: The Arab American and Muslim American Experience after 9/11. New York: Russell Sage Foundation. [Google Scholar]
- Calfano, Brian R., and Nazita Lajevardi. 2019. Understanding Muslim Political Life in America: Contested Citizenship in the Twenty-First Century. Philadelphia: Temple University Press. [Google Scholar]
- Chan-Malik, Sylvia. 2018. Being Muslim: A Cultural History of Women of Color in American Islam. New York: New York University Press. [Google Scholar]
- Chiswick, Barry R., and Paul W. Miller. 2008. Why Is the Payoff to Schooling Smaller for Immigrants? Labour Economics 15: 1317–40. [Google Scholar] [CrossRef]
- Chouhoud, Youssef, Karam Dana, and Matt Barreto. 2019. American Muslim Political Participation: Between Diversity and Cohesion. Politics & Religion 12: 736–65. [Google Scholar]
- Cramer, J. S. 2007. Robustness of Logit Analysis: Unobserved Heterogeneity and Mis-Specified Disturbances. Oxford Bulletin of Economics and Statistics 69: 545–55. [Google Scholar] [CrossRef]
- Craun, Dustin. 2014. Lighthouse Mosque Protests Proposed Building of Oakland Spy Center. Available online: https://medium.com/@dustincraun/lighthouse-mosque-protests-proposed-building-of-oakland-spy-center-46451caaf425 (accessed on 9 November 2020).
- Cuartas, Victor Hugo. 2020. Hispanic Muslims in the United States: Agency, Identity, and Religious Commitment. Eugene: Wipf and Stock Publishers. [Google Scholar]
- Dahab, Ramsey, and Marisa Omori. 2019. Homegrown Foreigners: How Christian Nationalism and Nativist Attitudes Impact Muslim Civil Liberties. Ethnic and Racial Studies 42: 1727–46. [Google Scholar] [CrossRef]
- Dana, Karam, Matt A. Barreto, and Kassra A. R. Oskooii. 2011. Mosques as American Institutions: Mosque Attendance, Religiosity and Integration into the Political System among American Muslims. Religions 2: 504–24. [Google Scholar] [CrossRef]
- Dawson, Michael C. 1994. Behind the Mule: Race and Class in African-American Politics. Princeton: Princeton University Press. [Google Scholar]
- DiMaggio, Paul. 1997. Culture and Cognition. Annual Review of Sociology 23: 263–87. [Google Scholar] [CrossRef]
- Edgell, Penny. 2016. Seeing the White in Christian America. The Society Pages. Available online: https://thesocietypages.org/specials/seeing-the-white-in-christian-america/ (accessed on 8 November 2020).
- Espiritu, Yen L. 1992. Asian American Panethnicity: Bridging Institutions and Identities. Philadelphia: Temple University Press. [Google Scholar]
- Friedberg, Rachel M. 2000. You Can’t Take It with You? Immigrant Assimilation and the Portability of Human Capital. Journal of Labor Economics 18: 221–51. [Google Scholar] [CrossRef]
- Garcia, John A. 2000. The Latino and African American Communities: Bases for Coalition Formation and Political Action. In Immigration and Race: New Challenges for American Democracy. Edited by Gerald D. Jaynes. New Haven: Yale University Press, pp. 255–76. [Google Scholar]
- Garcia Bedolla, Lisa. 2005. Fluid Borders: Latino Power, Identity, and Politics in Los Angeles. Berkeley: Berkeley Univ of California Press. [Google Scholar]
- Gibbons, John, Sarah Gibb Millspaugh, Jason M. Lydon, Heather Concannon, Will Green, Katie Omberg, and M. Lara Hoke. 2015. Letter to Marian Ryan. July 13. Available online: http://www.scribd.com/doc/271570603/InterfaithClergy-Letter-in-Support-of-Somerville-18 (accessed on 1 October 2020).
- Golash-Boza, Tanya. 2006. Dropping the Hyphen? Becoming Latino(a)-American through Racialized Assimilation. Social Forces 85: 27–55. [Google Scholar] [CrossRef]
- Graham, David A. 2016. The Complicated Pain of America’s Queer Muslims. The Atlantic, June 14. [Google Scholar]
- Gualtieri, Sarah. 2009. Between Arab and White: Race and Ethnicity in the Early Syrian American Diaspora. Berkeley: University of California Press. [Google Scholar]
- Gurin, Patricia, Arthur H. Miller, and Gerald Gurin. 1980. Stratum Identification and Consciousness. Social Psychology Quarterly 43: 30–47. [Google Scholar] [CrossRef]
- Harris, Fredrick C. 1999. Something within: Religion in African-American Political Activism. Oxford: Oxford University Press. [Google Scholar]
- Jackman, Mary R., and Robert W. Jackman. 1973. An Interpretation of the Relation between Objective and Subjective Social Status. American Sociological Review 38: 569–82. [Google Scholar] [CrossRef]
- Jackson, Sherman A. 2005. Islam and the Blackamerican: Looking toward the Third Resurrection: Looking toward the Third Resurrection. New York: Oxford University Press. [Google Scholar]
- Jackson, Sherman A. 2014. Islam and the Problem of Black Suffering. New York: Oxford University Press. [Google Scholar]
- Jalalzai, Farida. 2009. The Politics of Muslims in America. Politics and Religion 2: 163–99. [Google Scholar] [CrossRef]
- Junn, Jane, and Natalie Masuoka. 2008. Asian American Identity: Shared Racial Status and Political Context. Perspectives on Politics 6: 729–40. [Google Scholar] [CrossRef]
- Karim, Jamillah. 2009. American Muslim Women: Negotiating Race, Class, and Gender Within the Ummah. New York: New York University Press. [Google Scholar]
- Kuha, Jouni, and Colin Mills. 2020. On Group Comparisons with Logistic Regression Models. Sociological Methods & Research 49: 498–525. [Google Scholar] [CrossRef]
- Lajevardi, Nazita, and Kassra A. Oskooii. 2018. Old-Fashioned Racism, Contemporary Islamophobia, and the Isolation of Muslim Americans in the Age of Trump. Journal of Race, Ethnicity and Politics 3: 112–52. [Google Scholar] [CrossRef]
- Leighley, Jan E., and Arnold Vedlitz. 1999. Race, Ethnicity, and Political Participation: Competing Models and Contrasting Explanations. The Journal of Politics 61: 1092–114. [Google Scholar] [CrossRef]
- Long, J. Scott, and Sarah A. Mustillo. 2018. Using Predictions and Marginal Effects to Compare Groups in Regression Models for Binary Outcomes. Sociological Methods & Research, 0049124118799374. [Google Scholar] [CrossRef]
- Love, Erik. 2017. Islamophobia and Racism in America. New York: New York University Press. [Google Scholar]
- Maghbouleh, Neda. 2017. The Limits of Whiteness: Iranian Americans and the Everyday Politics of Race, 1st ed. Stanford: Stanford University Press. [Google Scholar]
- Masuoka, Natalie. 2006. Together they Become One: Examining the Predictors of Panethnic Group Consciousness among Asian Americans and Latinos. Social Science Quarterly 87: 993–1011. [Google Scholar] [CrossRef]
- McClain, Paula D., and Joseph Stewart. 2006. Can We All Get Along?: Racial and Ethnic Minorities in American Politics. Boulder: Westview Press. [Google Scholar]
- McClain, Paula D., Niambi M. Carter, Victoria M. DeFrancesco Soto, Monique L. Lyle, Jeffrey D. Grynaviski, Shayla C. Nunnally, Thomas J. Scotto, J. Alan Kendrick, Gerald F. Lackey, and Kendra Davenport Cotton. 2006. Racial Distancing in a Southern City: Latino Immigrants’ Views of Black Americans. Journal of Politics 68: 571–84. [Google Scholar] [CrossRef]
- McClain, Paula D., Jessica D. Johnson Carew, Eugene Walton, Jr., and Candis S. Watts. 2009. Group Membership, Group Identity, and Group Consciousness: Measures of Racial Identity in American Politics? Annual Review of Political Science 12: 471–85. [Google Scholar] [CrossRef]
- Miller, Arthur H., Patricia Gurin, Gerald Gurin, and Oksana Malanchuk. 1981. Group Consciousness and Political Participation. American Journal of Political Science 25: 494–511. [Google Scholar] [CrossRef]
- Mohamed, Besheer. 2020. Beyond Black and White in Measuring Racial Identity among US Muslims. In Religion Is Raced: Understanding American Religion in the Twenty-First Century. New York: New York University Press, pp. 275–92. [Google Scholar]
- Morales, Ed. 2018. Why I Embrace the Term LatinxEd Morales. The Guardian, January 8. [Google Scholar]
- Morning, Ann. 2001. The Racial Self-Identification of South Asians in the United States. Journal of Ethnic and Migration Studies 27: 61–79. [Google Scholar] [CrossRef]
- Naber, Nadine. 2005. Muslim First, Arab Second: A Strategic Politics of Race and Gender. The Muslim World 95: 479. [Google Scholar] [CrossRef]
- Ocampo, Angela X., Karam Dana, and Matt A. Barreto. 2018. The American Muslim Voter: Community Belonging and Political Participation. Social Science Research 72: 84–99. [Google Scholar] [CrossRef]
- Omi, Michael, and Howard Winant. 1986. Racial Formation in the United States from the Sixties to the Nineties. New York: Routledge. [Google Scholar]
- Oskooii, Kassra A. 2016. How Discrimination Impacts Sociopolitical Behavior: A Multidimensional Perspective. Political Psychology 37: 613. [Google Scholar] [CrossRef]
- Padilla, Felix M. 1985. Latino Ethnic Consciousness: The Case of Mexican Americans and Puerto Ricans in Chicago. Notre Dame: University of Notre Dame Press. [Google Scholar]
- Peek, Lori. 2011. Behind the Backlash: Muslim Americans After 9/11. Philadelphia: Temple University Press. [Google Scholar]
- Perry, Samuel L., and Andrew L. Whitehead. 2015. Christian Nationalism and White Racial Boundaries: Examining Whites’ Opposition to Interracial Marriage. Ethnic and Racial Studies 38: 1671–89. [Google Scholar] [CrossRef]
- Pew Research Center. 2007. Muslim Americans: Middle Class and Mostly Mainstream. Washington, DC: Pew Research Center. [Google Scholar]
- Pew Research Center. 2011. Muslims in America: No Sign of Growth in Alienation or Support for Extremism. Washington, DC: Pew Research Center. [Google Scholar]
- Pew Research Center. 2017a. Political Typology Reveals Deep Fissures on the Right and Left. Pew Research Center-U.S. Politics & Policy. Available online: https://www.pewresearch.org/politics/2017/10/24/political-typology-reveals-deep-fissures-on-the-right-and-left/ (accessed on 10 September 2020).
- Pew Research Center. 2017b. U.S. Muslims Concerned about Their Place in Society, But Continue to Believe in the American Dream. Religion & Public Life. Available online: http://www.pewforum.org/2017/07/26/findings-from-pew-research-centers-2017-survey-of-us-muslims/ (accessed on 20 October 2020).
- Salinas, Cristobal, Jr., and Adele Lozano. 2019. Mapping and Recontextualizing the Evolution of the Term Latinx: An Environmental Scanning in Higher Education. Journal of Latinos and Education 18: 302–15. [Google Scholar] [CrossRef]
- Sanchez, Gabriel R. 2006. The Role of Group Consciousness in Political Participation among Latinos in the United States. American Politics Research 34: 427–50. [Google Scholar] [CrossRef]
- Sanchez, Gabriel R. 2008. Latino Group Consciousness and Perceptions of Commonality with African Americans. Social Science Quarterly 89: 428–44. [Google Scholar] [CrossRef]
- Schnabel, Landon. 2020. Opiate of the Masses? Inequality, Religion, and Political Ideology in the United States. Social Forces. [Google Scholar] [CrossRef]
- Selod, Saher. 2015. Citizenship Denied: The Racialization of Muslim American Men and Women Post-9/11. Critical Sociology 41: 77–95. [Google Scholar] [CrossRef]
- Selod, Saher. 2018. Forever Suspect: Racialized Surveillance of Muslim Americans in the War on Terror. New Brunswick: Rutgers University Press. [Google Scholar]
- Sewell, William H., Jr. 1992. A Theory of Structure: Duality, Agency, and Transformation. American Journal of Sociology 98: 1–29. [Google Scholar] [CrossRef]
- Shams, Tahseen. 2018. Visibility as Resistance by Muslim Americans in a Surveillance and Security Atmosphere. Sociological Forum 33: 73–94. [Google Scholar] [CrossRef]
- Swidler, Ann. 1986. Culture in Action: Symbols and Strategies. American Sociological Review 51: 273–86. [Google Scholar] [CrossRef]
- Tate, Katherine. 1993. From Protest to Politics: The New Black Voters in American Elections. New York and Cambridge: Russell Sage Foundation. Cambridge: Harvard University Press. [Google Scholar]
- Tekelioglu, Ahmet S. 2019. Muslim American Debates on Engagement with Law Enforcement. In Understanding Muslim Political Life in America: Contested Citizenship in the Twenty-First Century. Muslim American Debates on Engagement with Law Enforcement. Philadelphia: Temple University Press, vol. 12, pp. 69–86. [Google Scholar]
- Uhlaner, Carole J. 1991. Perceived Discrimination and Prejudice and the Coalition Prospects of Blacks, Latinos, and Asian Americans. Racial and Ethnic Politics in California 4: 339–71. [Google Scholar]
- Vali, Yusufi. 2012. From Public Marginalisation to Public Recognition: The Action is in the Reaction-Part II. In A New Covenant of Virtue: Islam and Community Organising. London: Citizens UK and Industrial Areas Foundation. [Google Scholar]
- Verba, Sidney, and Norman H. Nie. 1972. Participation in America: Political Democracy and Social Equality. Manhattan: Harper & Row. [Google Scholar]
- Whitehead, Andrew L., and Samuel L. Perry. 2020. Taking America Back for God: Christian Nationalism in the United States. Oxford: Oxford University Press. [Google Scholar]
- Yukich, Grace. 2018. Muslim American Activism in the Age of Trump. Sociology of Religion 79: 220–47. [Google Scholar] [CrossRef]
| 1 | As with African American, Latinx American, and Asian American, the category “Muslim American” encompasses a highly complex internal diversity yet has come to be seen and treated by the state, the media, and a significant portion of the American public as a singular and uniform racial group due to the social, legal, and political processes of “racialization” (Bonilla-Silva 2001; Lajevardi and Oskooii 2018; Omi and Winant 1986; Selod 2015). Also, like members of these other groups, Muslim Americans have—to varying degrees—undergone experiences of social marginalization and exclusion that have caused them to consider their own group to be a consistent target of discrimination and social deprivation (Braunstein 2019; Dahab and Omori 2019; Lajevardi and Oskooii 2018; Selod 2015). |
| 2 | Data from all three survey years are publicly available on the Pew Research Center’s website: www.pewresearch.org. Analysis was conducted using Stata 16, and all files associated with the project are available upon request. |
| 3 | For more details on the sampling process for each survey, see the Pew Research Center’s website and reports (Pew Research Center 2007, 2011, 2017b). |
| 4 | As will be noted below, the survey questions inquire after homosexuality and the status of lesbian and gay individuals. To hue close to the data, we use the term LG instead of the broader term LGBTQIA+ when referring to our measures and results. |
| 5 | The survey questions involved used the term Hispanic, but we acknowledge that the word and its derivatives have a problematic and contested history (Alcoff 2005). To maintain accuracy, we use the term when directly discussing the data but use Latinx in our broader discussions (Salinas and Lozano 2019; Morales 2018). |
| 6 | To ensure that our results are not sensitive to listwise deletion of missing observations, we impute missing data using chained multivariate regressions (20 iterations) and re-run our analysis using the imputed observations. The resulting estimates (Table A4, Table A5 and Table A6 in Appendix A) are nearly identical to those presented in the main text below. We use the non-imputed data in the main tables, because deriving predicted probabilities from imputed data is a cumbersome process that does not lend itself easily to replication by future scholars. For most models, the non-imputed data also give a slightly more conservative estimate of the association between our main variables. |
| 7 | Targeting by airport security and targeting by law enforcement were separate items, but they were always mentioned consecutively. |
| 8 | This coding choice did not substantially change our results, tables available upon request. |
| 9 | We have 2983 observations (out of 3084) for this variable which is reflected in the “Sample” column of Table 1A. |
| 10 | In 2007, the wording was slightly different, asking respondents to choose between “Homosexuality is a way of life that should be accepted by society” and “Homosexuality is a way of life that should be discouraged by society”. Experiments conducted by the Pew Research Center suggested that removing the phrase “is a way of life” made no difference in the overall distribution of responses. |
| 11 | In sensitivity checks, we explored the possibility of an interaction effect between experiences of discrimination and year. We did not find that the association between perceiving discrimination against one’s self and accepting homosexuality is different across different years of the survey. Tables are available upon request. We could not conduct the same sensitivity analysis with our independent variable, perception of discrimination against Muslims, because that question was only asked in 2017. |
| 12 | In a sensitivity analysis, we replace income with education. The coefficients on our independent variable of interest are nearly identical when we do. Results are available upon request. |
| 13 | We use the standard sociological definition wherein those born outside the United States are considered first generation and those born in the United States whose parents are foreign born are second generation. |
| 14 | Some scholars have noted that community embeddedness can influence Muslims’ political leanings (Ocampo et al. 2018). In an earlier iteration of these analyses, we controlled for the proportion of the respondents’ close friends who were Muslim. Including this variable did not substantially change coefficients on our independent variables of interest, though it occasionally had its own associations with the outcome variables net of other controls. While further exploring these relationships is beyond the scope of this paper, it could be a topic for future research. |
| 15 | Here too, we are considering a category that is not mutually exclusive with Muslim. Unfortunately, the survey questionnaire does not enquire about sexual orientation, so we are unable to distinguish LG Muslims from non-LG ones. That is a limitation of this study. |
| 16 | We offer this potential interpretation with the caveat that scholars have cautioned against comparing the magnitude of coefficients across and within (between different groups) logistic regression models, since the constant varies from model to model (Cramer 2007; Kuha and Mills 2020; Long and Mustillo 2018). Again, we hope this observation can spark future research that could wield stronger evidence. |
| 17 | A small but growing number of Latinx people in the United States are converting to Islam (Cuartas 2020), but fewer than a hundred respondents across three years in our sample identified as Hispanic. |


| (A) Main Variables | ||
|---|---|---|
| Mean | Sample | |
| Independent Variables | ||
| Experiences of Discrimination as a Muslim [0,3] * | 0.72 | 2983 |
| (0.02) | ||
| Perceived Discrimination against Muslims | 0.78 | 978 |
| (0.01) | ||
| Dependent Variables | ||
| Change Needed for Equality for Black People | 0.77 | 937 |
| (0.01) | ||
| Perceived Discrimination against Black People | 0.75 | 969 |
| (0.01) | ||
| Homosexuality Should Be Accepted* | 0.44 | 2694 |
| (0.01) | ||
| Perceived Discrimination against Gays and Lesbians | 0.65 | 906 |
| (0.02) | ||
| Approval of Immigrants* | 0.87 | 2858 |
| (0.01) | ||
| Perceived Discrimination against Hispanics | 0.67 | 926 |
| (0.02) | ||
| Perceived Discrimination against Jews | 0.42 | 897 |
| (0.02) | ||
| (B) Control Variables | ||
| (1) | (2) | |
| All Years | 2017 Only | |
| Age | ||
| 18–24 | 0.15 | 0.20 |
| (0.01) | (0.01) | |
| 25–34 | 0.23 | 0.24 |
| (0.01) | (0.01) | |
| 35–44 | 0.22 | 0.18 |
| (0.01) | (0.01) | |
| 45–54 | 0.20 | 0.17 |
| (0.01) | (0.01) | |
| 55–64 | 0.12 | 0.12 |
| (0.01) | (0.01) | |
| 65+ | 0.07 | 0.08 |
| (0.00) | (0.01) | |
| Don’t Know/Refused | 0.01 | 0.01 |
| (0.00) | (0.00) | |
| Gender | ||
| Male | 0.57 | 0.62 |
| (0.01) | (0.02) | |
| Female | 0.43 | 0.38 |
| (0.01) | (0.02) | |
| Ethnicity, Race and Generation | ||
| 1st or 2nd Gen. MENA | 0.29 | 0.25 |
| (0.01) | (0.01) | |
| 1st or 2nd Gen. South Asian | 0.31 | 0.30 |
| (0.01) | (0.01) | |
| 1st or 2nd Gen. Non-Black Other | 0.10 | 0.14 |
| (0.01) | (0.01) | |
| 1st or 2nd Gen. Black | 0.09 | 0.09 |
| (0.01) | (0.01) | |
| 3rd Gen.+ Black | 0.11 | 0.10 |
| (0.01) | (0.01) | |
| 3rd Gen.+ White | 0.03 | 0.03 |
| (0.00) | (0.01) | |
| 3rd Gen.+ Other | 0.03 | 0.04 |
| (0.00) | (0.01) | |
| Don’t Know/Refused | 0.04 | 0.05 |
| (0.00) | (0.01) | |
| Generation | ||
| First Generation | 0.68 | 0.63 |
| (0.01) | (0.02) | |
| Second Generation | 0.12 | 0.18 |
| (0.01) | (0.01) | |
| Third Generation or More | 0.17 | 0.15 |
| (0.01) | (0.01) | |
| Don’t Know/Refused | 0.03 | 0.03 |
| (0.00) | (0.01) | |
| Income | ||
| Less than $30K | 0.27 | 0.27 |
| (0.01) | (0.01) | |
| $30K–Under $50K | 0.16 | 0.16 |
| (0.01) | (0.01) | |
| $50K–Under $100K | 0.22 | 0.22 |
| (0.01) | (0.01) | |
| $100K+ | 0.21 | 0.24 |
| (0.01) | (0.01) | |
| Don’t Know/Refused | 0.14 | 0.11 |
| (0.01) | (0.01) | |
| Mosque Attendance | ||
| Never | 0.15 | 0.14 |
| (0.01) | (0.01) | |
| Seldom | 0.08 | 0.06 |
| (0.01) | (0.01) | |
| Few/Year | 0.20 | 0.21 |
| (0.01) | (0.01) | |
| 1–2/Month | 0.12 | 0.14 |
| (0.01) | (0.01) | |
| 1/Week | 0.27 | 0.28 |
| (0.01) | (0.01) | |
| >1/Week | 0.17 | 0.17 |
| (0.01) | (0.01) | |
| Don’t Know/Refused | 0.01 | 0.00 |
| (0.00) | (0.00) | |
| Prayer Frequency | ||
| Never | 0.10 | 0.11 |
| (0.01) | (0.01) | |
| Eid Only | 0.06 | 0.06 |
| (0.00) | (0.01) | |
| Occasionally | 0.19 | 0.21 |
| (0.01) | (0.01) | |
| Some/Day | 0.20 | 0.19 |
| (0.01) | (0.01) | |
| 5/Day | 0.43 | 0.42 |
| (0.01) | (0.02) | |
| Don’t Know/Refused | 0.02 | 0.01 |
| (0.00) | (0.00) | |
| Political Ideology | ||
| Very Conservative | 0.03 | 0.02 |
| (0.00) | (0.00) | |
| Conservative | 0.15 | 0.13 |
| (0.01) | (0.01) | |
| Moderate | 0.44 | 0.44 |
| (0.01) | (0.02) | |
| Liberal | 0.20 | 0.22 |
| (0.01) | (0.01) | |
| Very Liberal | 0.07 | 0.10 |
| (0.00) | (0.01) | |
| Don’t Know/Refused | 0.11 | 0.09 |
| (0.01) | (0.01) | |
| Observations | 3084 | 1001 |
| (1) | (2) | (3) | (4) | |
|---|---|---|---|---|
| Change Needed for Equality for Black People | Perceived Discrimination against Black People | |||
| Discrimination Experiences Scale [0,3] | 0.31 ** | 0.52 *** | ||
| Perceived Discrimination against Muslims (Ref: No) | −1.26 *** | 3.39 *** | ||
| Age (Ref: 18–24) | ||||
| 25–34 | −0.22 | −0.13 | −0.65 * | −0.56 |
| 35–44 | −0.10 | 0.02 | −0.28 | 0.28 |
| 45–54 | −0.07 | 0.06 | −0.72 * | −0.33 |
| 55–64 | −0.07 | −0.04 | −0.04 | 0.11 |
| 65+ | −0.01 | 0.00 | −0.63 | −0.50 |
| Don’t Know/Refused | 0.01 | −0.06 | −0.45 | −0.70 |
| Female | 0.26 | 0.11 | 0.82 *** | 0.55 * |
| Ethnicity, Race and Generation (Ref: 1st or 2nd Gen MENA) | ||||
| 1st or 2nd Gen. S. Asian | 0.50 * | 0.51 * | 0.01 | −0.12 |
| 1st or 2nd Gen. Non-Black Other | 0.75 * | 0.82 ** | 0.47 | 0.56 |
| 1st or 2nd Gen. Black | 0.86 ** | 0.74 * | 0.96 ** | 0.91 * |
| 3rd Gen. + Black | 1.62 *** | 1.32 ** | 2.05 *** | 1.39 ** |
| 3rd Gen. + White | 0.30 | 0.13 | 0.65 | 0.07 |
| 3rd Gen. + Other | 1.54 * | 1.39 * | 0.97 | 0.31 |
| Don’t Know/Refused | 0.15 | 0.05 | 0.86 | 0.89 |
| Generation (Ref: 1st Generation) | ||||
| Second Generation | 0.16 | 0.10 | 0.28 | 0.14 |
| Don’t Know/Refused | −0.06 | 0.07 | −0.62 | −0.28 |
| Income (Ref: Less than $30K) | ||||
| $30K–Under $50K | 0.33 | 0.35 | 0.39 | 0.28 |
| $50K–Under $100K | 0.28 | 0.13 | 0.80 ** | 0.57 |
| $100K + | 0.45 | 0.38 | 1.01 *** | 0.96 ** |
| Don’t Know/Refused | −0.07 | −0.00 | 0.20 | 0.18 |
| Mosque Attendance (Ref: Never) | ||||
| Seldom | 0.38 | 0.16 | 0.92 * | 0.63 |
| Few/Year | 0.30 | 0.11 | 1.02 ** | 0.41 |
| 1–2/Month | 0.47 | 0.25 | 0.60 | −0.13 |
| 1/Week | −0.11 | −0.33 | 0.46 | −0.28 |
| >1/Week | 0.28 | 0.01 | 0.72 * | −0.12 |
| Don’t Know/Refused + | ||||
| Prayer Frequency (Ref: Never) | ||||
| Eid Only | −0.67 | −0.58 | −0.41 | −0.39 |
| Occasionally | −0.77 * | −0.57 | −0.56 | −0.03 |
| Some/Day | −0.66 | −0.42 | −0.38 | 0.54 |
| 5/Day | −0.45 | −0.24 | −0.48 | 0.12 |
| Don’t Know/Refused ++ | −0.89 | −0.77 | ||
| Political Ideology (Ref: Very Conservative) | ||||
| Conservative | 1.58 ** | 1.54 ** | 0.08 | −0.58 |
| Moderate | 1.80 *** | 1.64 ** | 1.04 * | 0.47 |
| Liberal | 1.53 ** | 1.32 * | 1.28 * | 0.60 |
| Very Liberal | 2.09 *** | 2.01 *** | 1.09 | 0.79 |
| Don’t Know/Refused | 0.90 | 0.74 | 0.55 | −0.14 |
| Constant | −1.03 | −1.48 * | −1.03 * | 2.30 ** |
| Observations | 909 | 915 | 945 | 953 |
| (1) | (2) | (3) | (4) | |
|---|---|---|---|---|
| Homosexuality Should Be Accepted | Perceived Discrimination against Gays and Lesbians | |||
| Discriminations Experiences Scale [0,3] | 0.10 * | 0.22 ** | ||
| Perceived Discrimination against Muslims (Ref: No) | 0.59 ** | 2.53 *** | ||
| Age (Ref: 18–24) | ||||
| 25–34 | −0.46 * | −0.35 | −0.87 ** | −0.77 ** |
| 35–44 | −0.76 *** | −0.95 ** | −0.86 ** | −0.68 * |
| 45–54 | −1.09 *** | −1.21 *** | −0.60 * | −0.47 |
| 55–64 | −1.01 *** | −1.36 *** | −0.57 | −0.56 |
| 65+ | −1.58 *** | −2.18 *** | −0.95 ** | −0.80 * |
| Don’t Know/Refused | −0.95 | −0.85 | 0.98 | 0.84 |
| Female | 0.51 *** | 0.58 ** | 1.02 *** | 0.91 *** |
| Ethnicity, Race, and Generation (Ref: 1st or 2nd Gen MENA) | ||||
| 1st or 2nd Gen. S. Asian | −0.02 | 0.43 | 0.17 | 0.25 |
| 1st or 2nd Gen. Non-Black Other | 0.58 *** | 0.92 ** | 0.15 | 0.02 |
| 1st or 2nd Gen. Black | 0.36 * | 0.45 | 0.76 * | 0.75 * |
| 3rd Gen. + Black | 0.36 * | −0.01 | 1.27 *** | 0.71 * |
| 3rd Gen. + White | 1.08 *** | 1.85 ** | 1.38 * | 1.26 * |
| 3rd Gen. + Other | 0.65 | 0.86 | 0.98 * | 0.51 |
| Don’t Know/Refused | −0.14 | 0.20 | 2.26 * | 2.44 |
| Generation (Ref: 1st Generation) | ||||
| Second Generation | 0.51 ** | 0.35 | 0.45 | 0.34 |
| Don’t Know/Refused | −0.24 | −0.21 | −2.71 * | −2.76 |
| Income (Ref: Less than $30K) | ||||
| $30K–Under $50K | −0.04 | 0.10 | 0.37 | 0.34 |
| $50K–Under $100K | 0.14 | 0.32 | 0.69 ** | 0.58 * |
| $100K + | 0.72 *** | 0.93 *** | 0.83 *** | 0.85 ** |
| Don’t Know/Refused | 0.20 | 0.67 * | 0.27 | 0.25 |
| Mosque Attendance (Ref: Never) | ||||
| Seldom | 0.02 | 0.46 | 0.86 * | 0.52 |
| Few/Year | −0.25 | −0.21 | 1.04 ** | 0.57 |
| 1–2/Month | −0.37 | −0.28 | 0.60 | 0.33 |
| 1/Week | −0.38 * | −0.43 | 0.38 | −0.03 |
| >1/Week | −0.53 * | −0.89 * | 0.66 | 0.19 |
| Don’t Know/Refused+ | −2.24 * | |||
| Prayer Frequency (Ref: Never) | ||||
| Eid Only | −0.18 | 0.23 | −0.96 * | −0.92 |
| Occasionally | −0.30 | −0.25 | −0.85 * | −0.64 |
| Some/Day | −0.72 *** | −0.45 | −0.30 | 0.09 |
| 5/Day | −1.24 *** | −1.17 ** | −0.94 ** | −0.70 |
| Don’t Know/Refused++ | −0.52 | −0.51 | −0.55 | |
| Political Ideology (Ref: Very Conservative) | ||||
| Conservative | 0.63 * | 0.96 | 0.08 | −0.16 |
| Moderate | 0.71 * | 1.27 * | 0.66 | 0.33 |
| Liberal | 1.20 *** | 1.79 ** | 1.09 * | 0.62 |
| Very Liberal | 1.42 *** | 1.71 ** | 0.84 | 0.57 |
| Don’t Know/Refused | 0.23 | 0.91 | 0.39 | 0.27 |
| Year (Ref: 2007) | ||||
| 2011 | 0.54 *** | |||
| 2017 | 1.25 *** | |||
| Constant | −0.57 | −0.56 | −0.68 | −1.94 ** |
| Observations | 2612 | 835 | 885 | 894 |
| (1) | (2) | (3) | (4) | (5) | (6) | |
|---|---|---|---|---|---|---|
| Approval of Immigrants | Perceived Discrimination against Hispanics | Perceived Discrimination against Jews | ||||
| Discrimination Experiences Scale [0,3] | −0.00 | 0.39 *** | 0.26 *** | |||
| Perceived Discrimination against Muslims (Ref: No) | 0.73 * | 3.15 *** | 2.64 *** | |||
| Age (Ref: 18–24) | ||||||
| 25–34 | −0.39 | −1.04 * | −0.50 | −0.34 | −0.29 | −0.17 |
| 35–44 | −0.71 ** | −0.84 | −0.52 | −0.21 | −0.06 | 0.29 |
| 45–54 | −0.78 *** | −1.08 * | −0.65 * | −0.41 | 0.20 | 0.32 |
| 55–64 | −0.53 * | −0.58 | −0.37 | −0.41 | 0.09 | 0.14 |
| 65+ | −0.22 | −0.37 | −0.59 | −0.44 | 0.18 | 0.52 |
| Don’t Know/Refused | −1.05 * | −1.19 | −0.48 | −0.80 | 0.86 | 0.82 |
| Female | 0.17 | 0.71 * | 0.62 *** | 0.38 | 0.17 | 0.07 |
| Ethnicity, Race, and Generation (Ref: 1st or 2nd Gen MENA) | ||||||
| 1st or 2nd Gen. S. Asian | 0.40 * | 0.81 | 0.14 | 0.30 | −0.18 | −0.12 |
| 1st or 2nd Gen. Non-Black Other | −0.07 | −0.50 | 0.01 | −0.00 | −0.16 | −0.16 |
| 1st or 2nd Gen. Black | 0.71 * | 2.04 | 0.75 * | 0.62 | 0.93 ** | 0.87 ** |
| 3rd Gen. + Black | −1.22 *** | −1.32 ** | 1.21 *** | 0.54 | 0.60 * | 0.22 |
| 3rd Gen. + White | −0.17 | −0.74 | 0.69 | 0.41 | 0.18 | −0.00 |
| 3rd Gen. + Other | −0.88 ** | −1.03 | 0.87 | 0.48 | 1.13 ** | 1.02 * |
| Don’t Know/Refused | −0.33 | 14.08 | −0.20 | −0.40 | 0.49 | 0.17 |
| Generation (Ref: 1st Generation) | ||||||
| Second Generation | −0.19 | −0.29 | 0.27 | 0.16 | 0.80 *** | 0.73 ** |
| Don’t Know/Refused | 0.00 | −15.26 | 0.17 | 0.54 | −1.16 | −0.76 |
| Income (Ref: Less than $30K) | ||||||
| $30K–Under $50K | 0.30 | 1.30 ** | 0.25 | 0.26 | 0.03 | 0.12 |
| $50K–Under $100K | 0.43 ** | 0.57 | 0.69 ** | 0.53 * | 0.71 ** | 0.59 * |
| $100K + | 1.02 *** | 0.97 * | 0.92 *** | 0.94 *** | 0.67 ** | 0.62 * |
| Don’t Know/Refused | 0.70 ** | 0.04 | 0.26 | 0.34 | 0.37 | 0.31 |
| Mosque Attendance (Ref: Never) | ||||||
| Seldom | 0.19 | 0.77 | 1.05 ** | 0.83 | 0.78 * | 0.59 |
| Few/Year | 0.01 | 0.00 | 0.93 ** | 0.58 | 0.71 * | 0.55 |
| 1–2/Month | 0.17 | 0.01 | 0.99 ** | 0.84 * | 0.35 | 0.18 |
| 1/Week | 0.04 | 0.16 | 0.52 | 0.26 | 0.37 | 0.22 |
| >1/Week | 0.13 | 0.36 | 0.75 * | 0.37 | 0.43 | 0.27 |
| Don’t Know/Refused+ | 0.45 | −0.29 | −1.49 | |||
| Prayer Frequency (Ref: Never) | ||||||
| Eid Only | −0.02 | 0.83 | −0.72 | −0.71 | −0.68 | −0.47 |
| Occasionally | 0.47 | 0.67 | −0.59 | −0.26 | −0.61 | −0.32 |
| Some/Day | 0.34 | 0.30 | −0.37 | 0.13 | 0.04 | 0.44 |
| 5/Day | 0.38 | 0.31 | −0.36 | 0.10 | −0.29 | 0.02 |
| Don’t Know/Refused ++ | 1.16 | 0.15 | 0.19 | 0.85 | 0.91 | |
| Political Ideology (Ref: Very Conservative) | ||||||
| Conservative | 0.52 | 0.62 | 0.08 | −0.48 | 0.17 | −0.15 |
| Moderate | 0.91 *** | 1.17 * | 0.65 | −0.01 | 0.26 | −0.16 |
| Liberal | 1.29 *** | 1.25 * | 1.29 * | 0.70 | 0.37 | −0.14 |
| Very Liberal | 0.82 * | 0.67 | 1.14 * | 0.76 | 0.89 | 0.56 |
| Don’t Know/Refused | 0.76 * | 1.76 * | 0.28 | −0.10 | 0.03 | −0.37 |
| Year (Ref: 2007) | ||||||
| 2011 | −0.09 | |||||
| 2017 | 0.64 *** | |||||
| Constant | 0.68 | 0.56 | −1.05 | −2.67 *** | −21.74 ** | −3.50 *** |
| Observations | 2775 | 914 | 905 | 918 | 877 | 885 |
Publisher’s Note: MDPI stays neutral with regard to jurisdictional claims in published maps and institutional affiliations. |
© 2020 by the authors. Licensee MDPI, Basel, Switzerland. This article is an open access article distributed under the terms and conditions of the Creative Commons Attribution (CC BY) license (http://creativecommons.org/licenses/by/4.0/).
Share and Cite
Abdelhadi, E.; O’Brien, J. Perceived Group Deprivation and Intergroup Solidarity: Muslims’ Attitudes towards Other Minorities in the United States. Religions 2020, 11, 604. https://doi.org/10.3390/rel11110604
Abdelhadi E, O’Brien J. Perceived Group Deprivation and Intergroup Solidarity: Muslims’ Attitudes towards Other Minorities in the United States. Religions. 2020; 11(11):604. https://doi.org/10.3390/rel11110604
Chicago/Turabian StyleAbdelhadi, Eman, and John O’Brien. 2020. "Perceived Group Deprivation and Intergroup Solidarity: Muslims’ Attitudes towards Other Minorities in the United States" Religions 11, no. 11: 604. https://doi.org/10.3390/rel11110604
APA StyleAbdelhadi, E., & O’Brien, J. (2020). Perceived Group Deprivation and Intergroup Solidarity: Muslims’ Attitudes towards Other Minorities in the United States. Religions, 11(11), 604. https://doi.org/10.3390/rel11110604