1. Introduction
It is axiomatic within the curious world of Quaker academics that part of the attraction for researchers lies in the abundance of archive material. From the 1650s to the present, the Society has found no contradiction in silent worship and copious notetaking, as if a sect testifying to the necessity of simplicity sought to leave a monument built from volumes of minutes. The seeds of this centricity of the written may be found in the “pamphlet wars” of the mid-seventeenth century, when following the abolition of the Star Chamber Court all parties exploited an unfettered press to publish an explosion of opinion;
1 the contemporary collection of London stationer George Thomason amounted to 26,000 tracts, broadsides and pamphlets collected between 1640 and 1661.
2 In this environment, early Friends promoted publications and counter-publications, while their written records documented increasingly organised internal deliberations conducted by a hierarchy of administrational committees and sub-committees. These oversaw areas of importance to the Society, from scriptural justifications for beliefs and practices, to shared finances, international travel, the licensing of members, marriages and ministers—down to less obvious aspects of life and death, such as advice on curtain-fringes and serving cheese at burials.
3Given the abundance of such records in the archives, the absence of any reliable census of membership from 1650 until 1840 requires an explanation. The traditional (and practical) response ascribes this to a disinclination of the Society of Friends to define “membership”, which was finally resolved by the definition of marriage regulations in 1737. Elizabeth Isichei added a spiritual rationale, suggesting Quakers had “misgivings about King David’s punishment for numbering the people of Israel”.
4 Notwithstanding, for almost two centuries early Friends did not consider it necessary, or advisable, to compile lists of membership of the Society. Instead, the relationship of individuals with the organisation spanned a spectrum which can be thought of as four concentric circles: from the inner circle of “weighty Friends”, through those “in unity” on the benches, to the disorderly walkers who were “dealt with”, out to the “disowned”—a pseudo-excommunicated status, which for much of the long eighteenth century (and even later) could be redeemed through the expression of suitable contrition, usually required in writing.
Not quantifying numbers was an inevitable result of this rather fluid approach to membership, which was itself a product of the contemporary Quaker belief system which acknowledged “God in Everyone” in pursuit of their mission to create a worldwide church. Yet as this vision faded in the eighteenth century, first the Society and later historians began to seek explanations for what was generally perceived as a decline. The first—and most widely accepted—attempt to address this question was contained in John Stephenson Rowntree’s
Quakerism, Past and Present, subtitled “Being an enquiry into the causes of its decline …” This was published as the winning entry in an open essay contest run in 1858 on behalf of “A Gentleman…who laments that the Society of Friends is less in number than at the beginning of the century … and who … is anxious to obtain light respecting the causes of this change”.
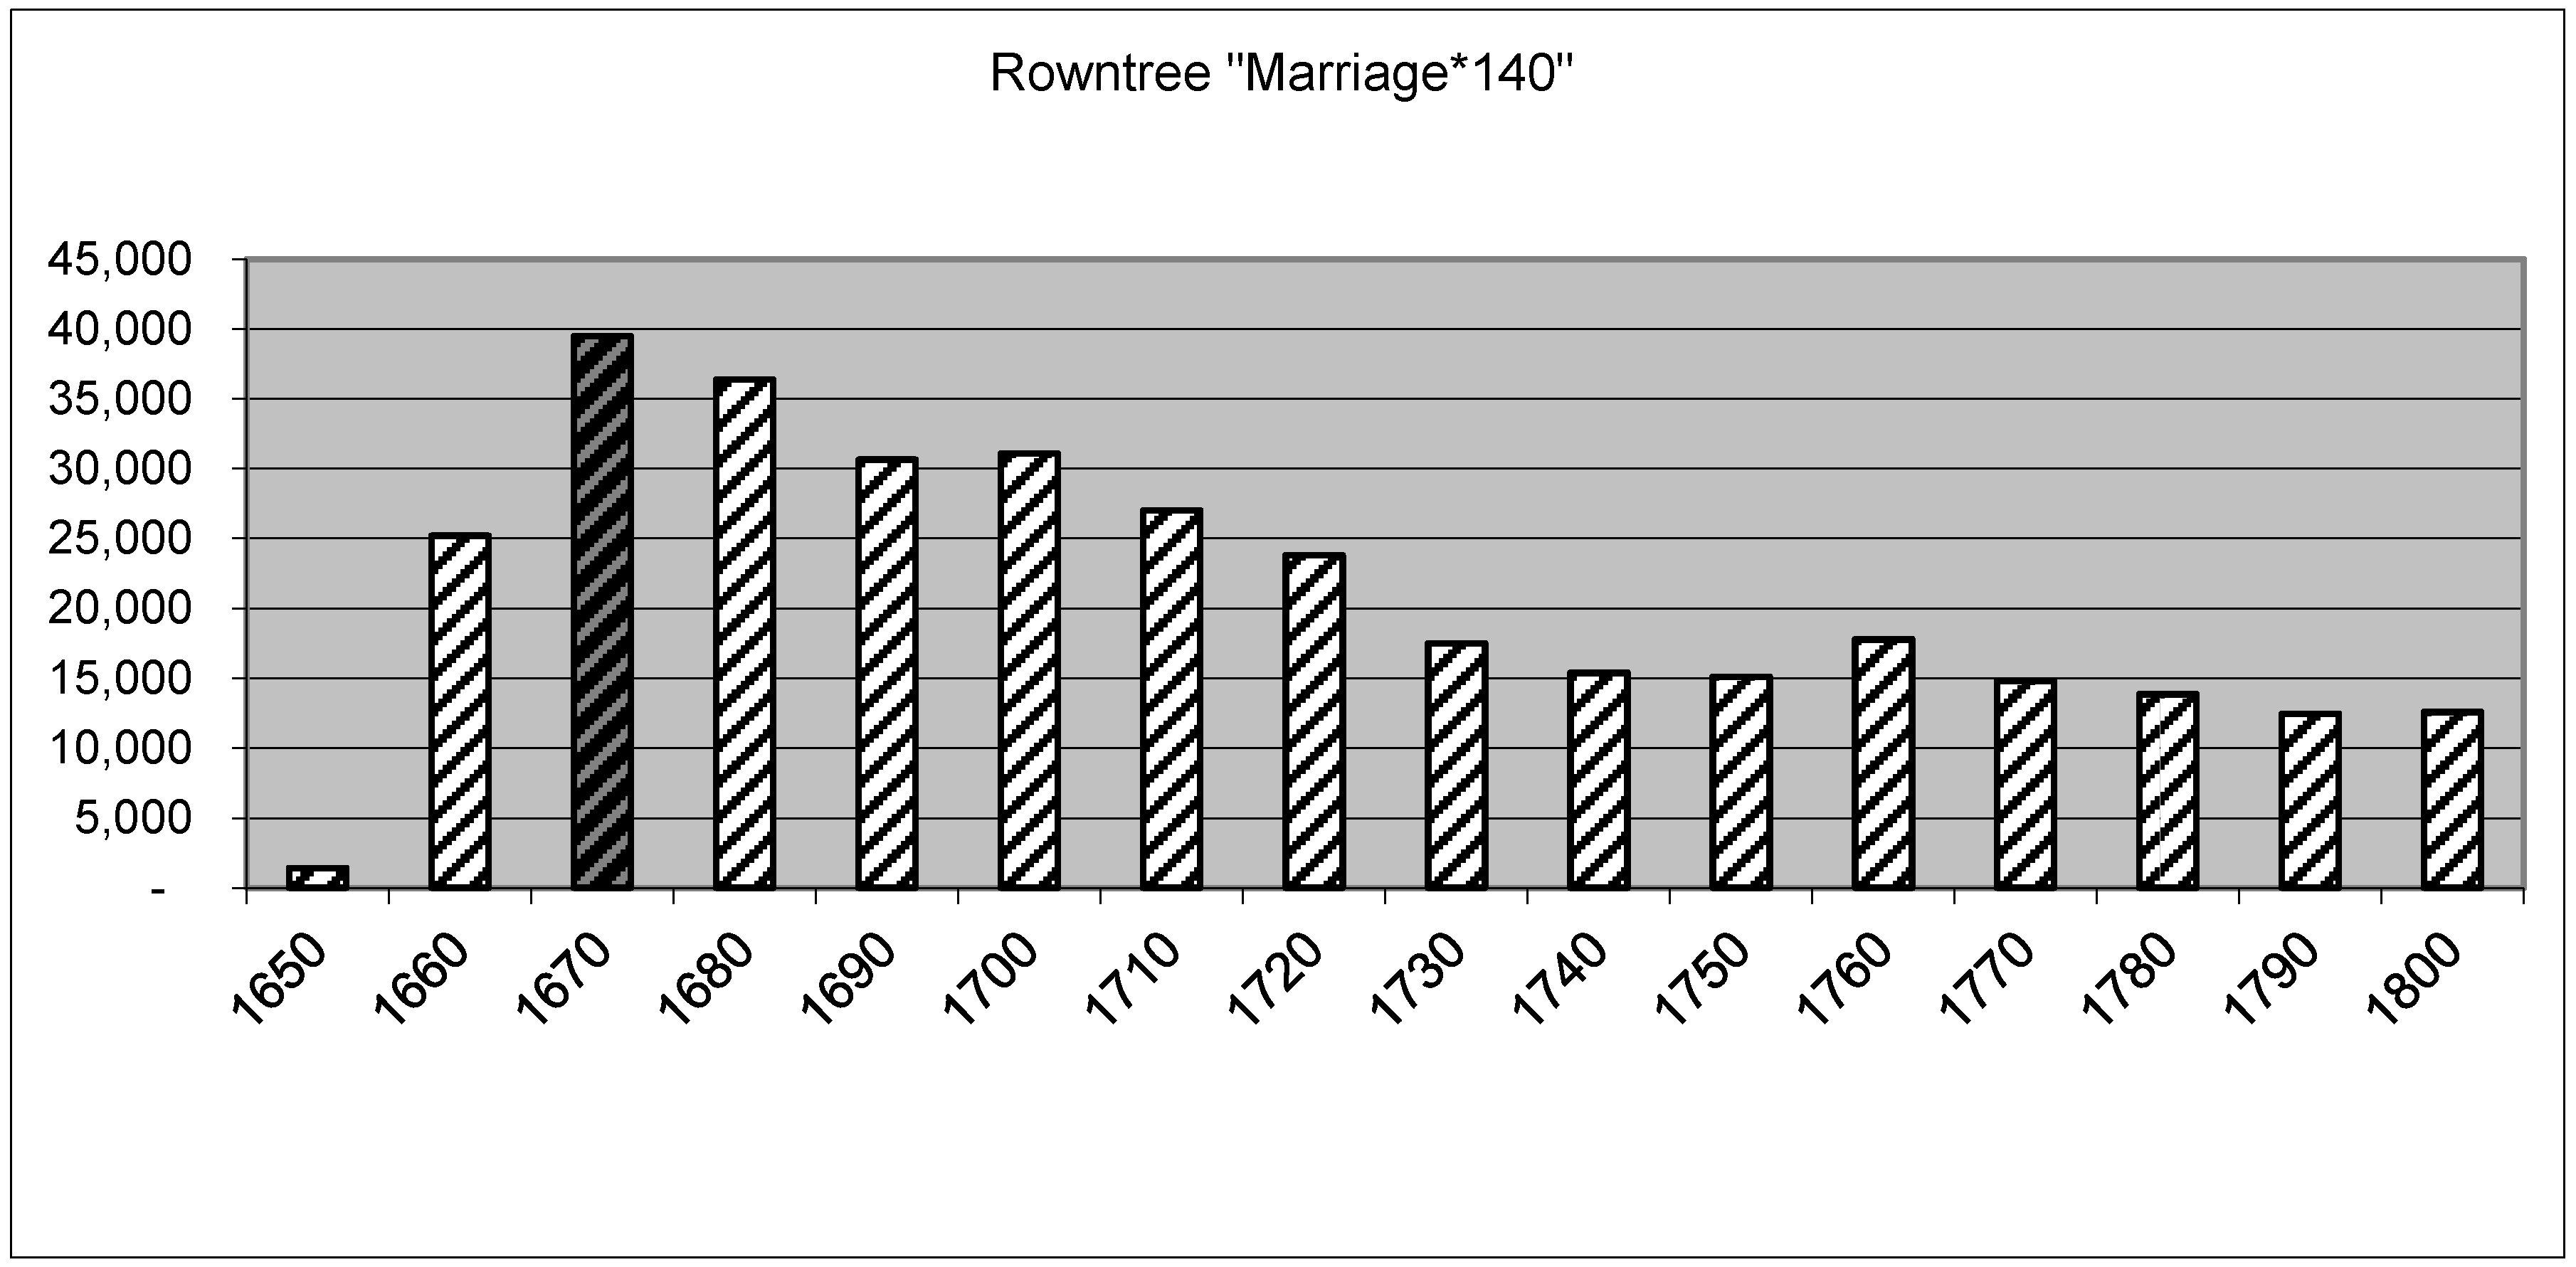
5 Significantly, Rowntree grounded his enquiry into the decline upon a foundation of numbers extrapolated from summaries of Quaker records of marriages, births and deaths, applying modified contemporary ratios to arrive at a total membership population. At the heart of his estimates are the marriage records: Rowntree first formulates a marriage ratio of 1 per 150 of the Quaker population for the year 1800. This is based on Quarterly Meeting (QM) marriage records and his estimate of the number of Quakers at the close of the century, which he back-projects from the Society’s 1847 census adjusted for those dying, leaving or joining and estimated from samples of “representative” QM records. This ratio he then modifies to 1:140 for the late seventeenth century, an increase intended to account for missing records. He next selects the high point of QM marriage registers (2820 in the decade beginning in 1670), and multiplies this by 140 to produce an initial estimate of almost 40,000 Quakers in England and Wales in 1680.
6 To this, Rowntree goes on to add or subtract extrapolated figures for various factors and geographies in pursuit of a maximum Quaker population, the decline of which his narrative addresses to account for the census membership figure of 15,345 in 1847.
7Questions of methodology notwithstanding, the figure of 40,000 has proved remarkably enduring. Fifty years later, the formative Quaker historian William Braithwaite, while not acknowledging Rowntree, came up with the same figure: his approach was to estimate the number of male Quakers from those imprisoned in the Fifth Monarchist uprising of 1661, and use a family size of approximately 6 to factor in the women and children.
8 Fifty years after Braithwaite, Isichei’s study of Victorian Quakers characterizes Rowntree’s work as careful “calculations based on all available statistics”, and accepts his estimates accordingly without further question.
9 In the same decade, Alan Gilbert uses Rowntree as his source for Quaker numbers during the long eighteenth century,
10 following Richard Vann in his 1969 work
The Social Development of English Quakerism. Yet Vann introduces a note of caution as to the quality of the records, noting that even contemporary Friends were concerned at the laxity of registration. Based upon a comparison of local meeting minutes and registers of births, he made an assessment that at some periods and in some places registrations might be off by as much as 20%, and concluded rather unhelpfully that when trying to determine whether there were fewer friends in the eighteenth century than in the seventeenth, “one man’s guess is almost as good as another’s”.
11 By the time Adrian Davies addressed the issue in 2000, he could conclude there was “a decline in the sect’s numbers” without committing to any numerical estimate at either end of the process.
12 Other historians have been encouraged to follow suit, and in the face of such consensus, any re-evaluation of Rowntree might appear unnecessary. However, as the history of the Society of Friends attracts new historians, so the historiography repays revisiting: the Quaker experience merits more texture than a simple transition from seventeenth century “enthusiasm” through eighteenth century “quietism” to “social activism” in the nineteenth, and Rowntree’s approach merits another’s guess.
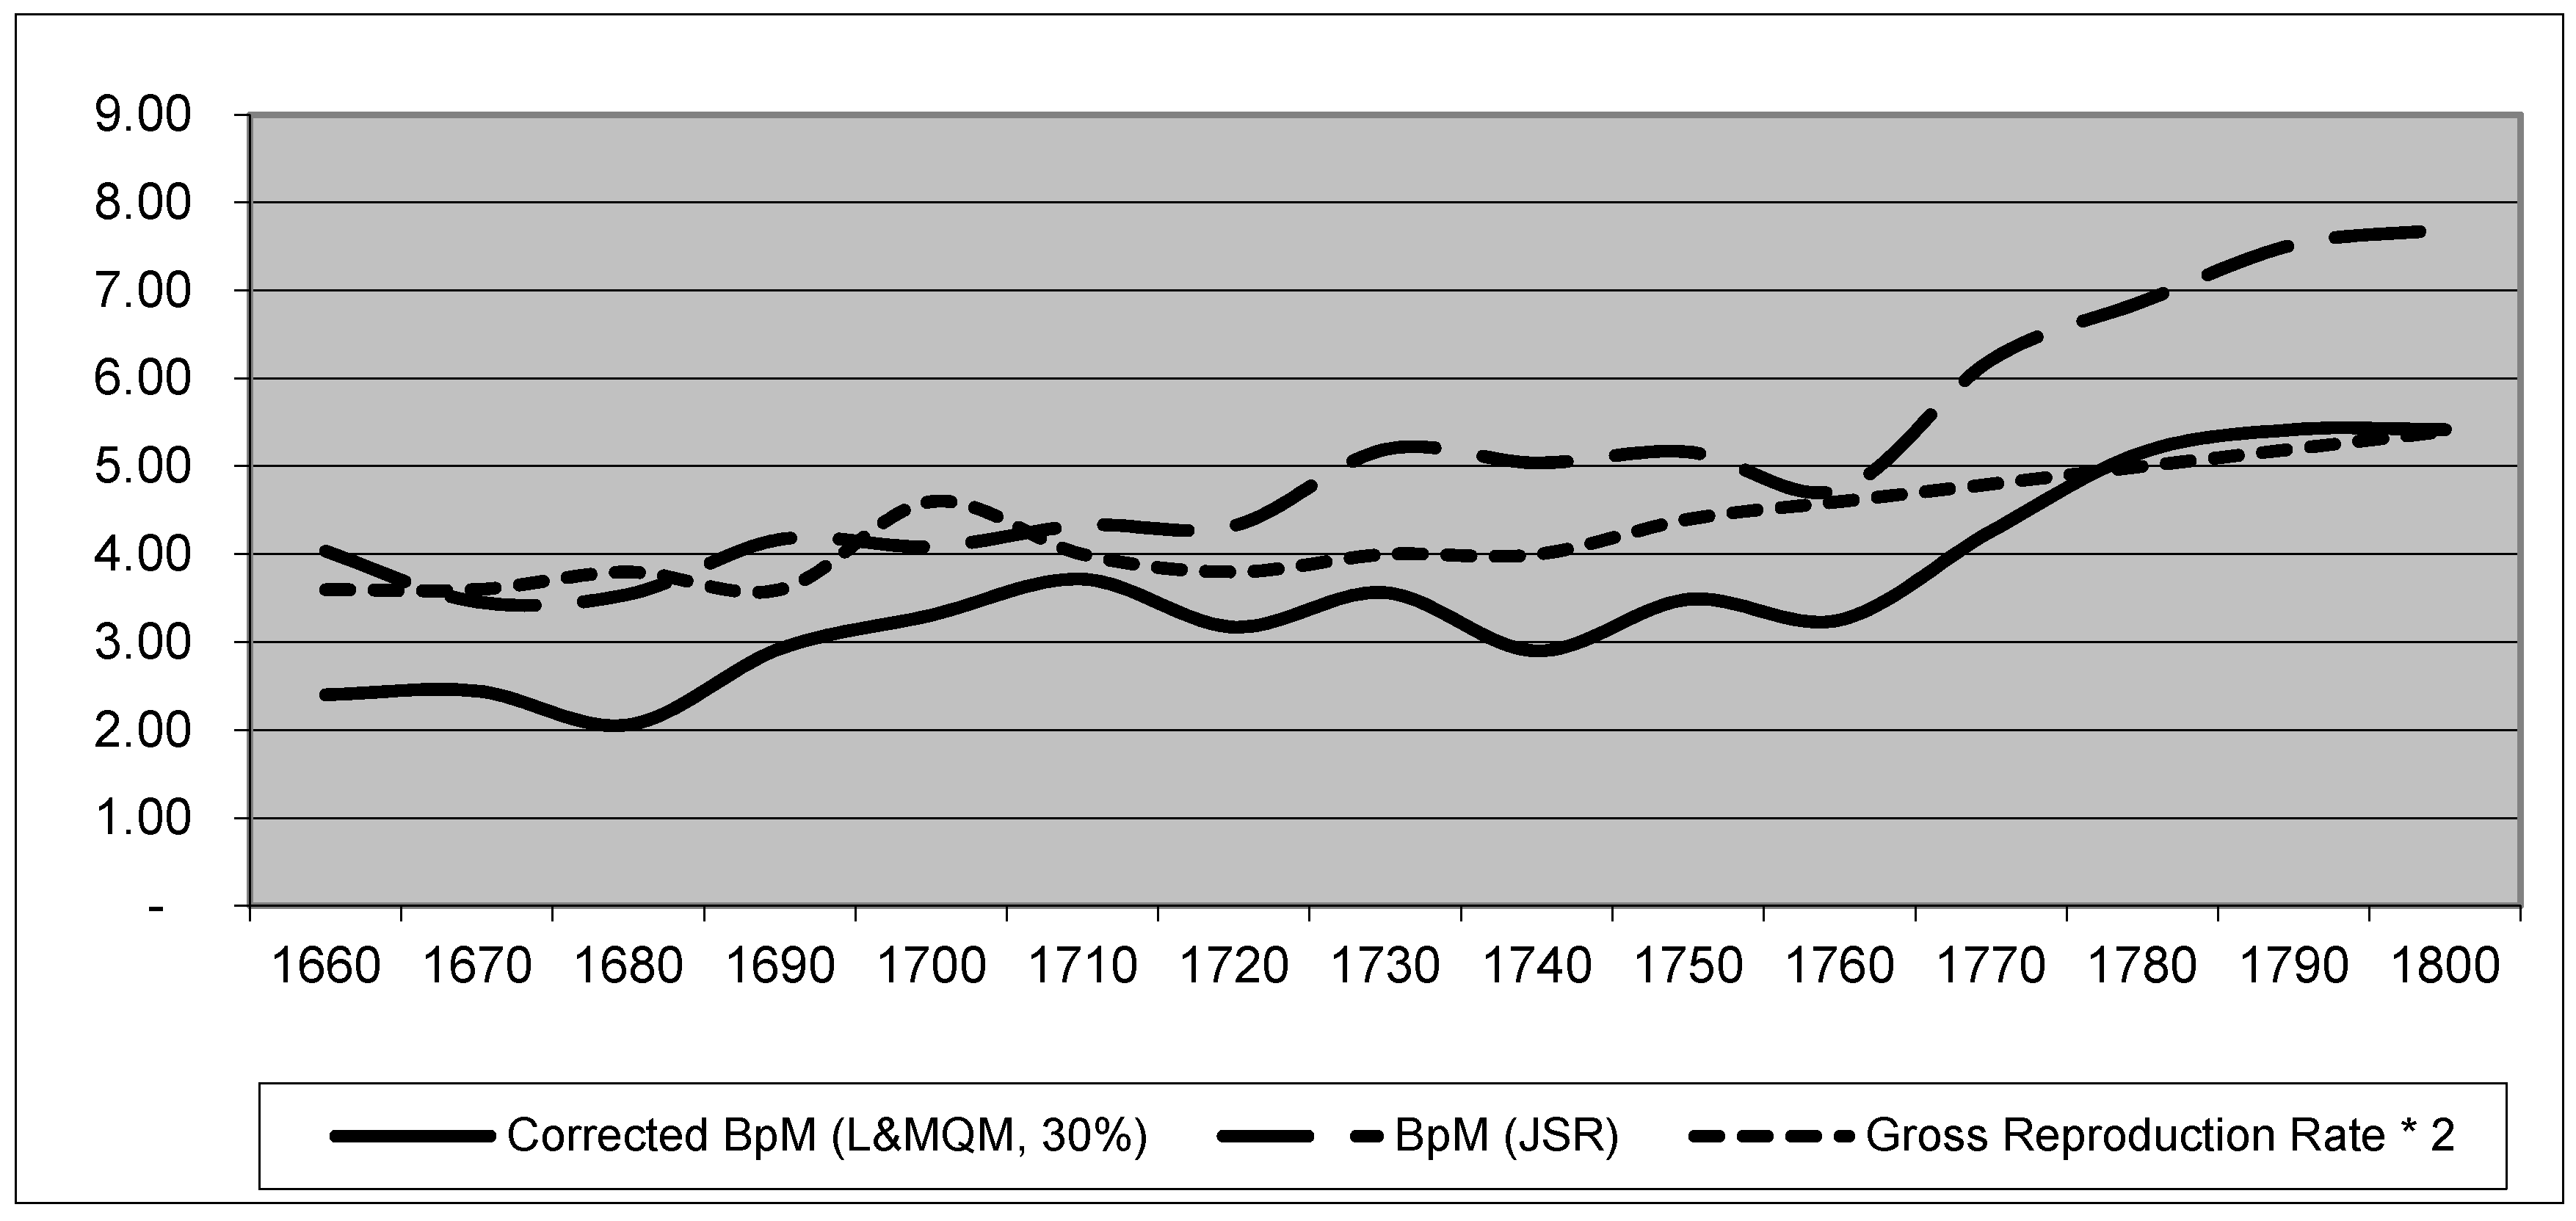
2. Constancy as a Route to Accuracy
The first questions concern the lack of methodological consistency. Rowntree was primarily concerned with an explanation for the decline in nineteenth century Quakerism, yet the application of his “marriage ratio” to the records of the Society across the whole period suggests a rather different picture (
Figure 1).
Applying the ratio of marriages against the numbers of marriages recorded in the QM registers shows that the fall in Quaker population to the mid-nineteenth century level of approximately 15,000 occurs in the 1730s, after which it remains relatively static (aside from a small anomaly in the 1760s, probably arising from the recognition of Quaker marriage in the Act of 1755). This would suggest that any explanation for the decline of Quakerism would need to be grounded in the period after 1670, when historians accept the movement was at its most vigorous. Clearly, as Vann suggests, the marriage registers cannot be wholly accurate, but there is also a question as to the applicability of this “marriage ratio”. The evidence of the birth and burial registers used by Rowntree present additional problems: deaths outnumber births by 19,442 over the period, which leaves a 50% differential by the end of the century, whereas the size of the population estimated is very low given the 113,897 births recorded, which requires an average births per marriage (BpM) rate above seven—well in excess of both Quaker and general population norms.
3. Examining Marriage
These issues can be remedied by accepting and attempting to quantify the under-recording of marriages. The “missing marriages” can be back-projected through estimates of BpM using the QM birth registers, which Rowntree provides for all decades of the period.
14 Demographers have mapped trends based upon birth records over the period for general populations, with fertility tracked as the gross reproduction rate (GRR) representing the number of female births per 1000 of population, and Richard Smith provides a review of fluctuations over the period 1541–1871 from which relevant data can be extracted.
15 Allowing differences in the male–female birth balance to even out over time (while accepting any consequent errors), the GRR becomes a useful benchmark for fertility during the period. There exist also indicators of trends in BpM. However, two significant issues arise with such indicators: first, these are constructed by aggregating different data sets across diverse smaller communities over long periods. Variables include changing patterns of nuptiality (resulting from changes in wages or occupation), differing patterns of age at marriage (or not marrying), falling decennial mean birth intervals (increasing marital fertility) and not least the significance (or otherwise) of general changes in demography.
16 While the interactions of such indices provide a fruitful source of debate for professional demographers, they do not materially assist the historian seeking to verify behaviours of discrete populations over specific periods. Secondly, the Quakers themselves are traditionally regarded by their biographers as “different”: in the words of Professor Robynne Rogers Healy, perhaps the leading authority on the sect during the long eighteenth century, they exhibited “a community cohesiveness that spanned geographic boundaries while it continued to keep Quakers apart as a ’peculiar’ people”.
17 Unfortunately, sect-specific studies seem to identify almost as many differences between groups of Friends as between Friends and non-Quakers.
18 The largest (and most recent) demographic study, Vann’s and Eversley’s
Friends in Life and Death: The British and Irish Quakers in the Demographic Transition, 1650–1900, demonstrates the difficulties which arise from using the demographic technique of family reconstruction, which demands creative assumptions which do not align easily with statistical analysis. Noting the “immense differences in the demographic data” arising from the authors’ estimates in England and Ireland,
19 historian J. William Frost concludes:
The reasons for using Quaker records for demography are clear; the birth, death, and marriage records provide more reliable information about a numerous population over a large area for a long period than any other English records. While demographers then have the difficulty of comparing Quakers with other English-men and women because Friends were by no means typical, that is not an issue for the social history of London Yearly Meeting.
20
This argument is convincing, and leaves no better alternative to the statistician than to make a count from the registers: both the number of marriages per decade and the number of births, and from a single Quaker population. The registers chosen for this somewhat laborious study are those from the London and Middlesex Quarterly Meeting (L&M QM), both because they represent the largest single QM in terms of records from 1650 to 1809, and because they have been transcribed electronically thanks to significant effort by the Quaker Family History Society. This simultaneously increases the accessible data set and reduces the effort, while methodologically introducing one or two challenges in that the transcriptions retain a sizeable number of duplicates arising from a decision to preserve alternative versions of the recorded data held in Monthly and Quarterly Meeting registers. The QM registers were essentially transcriptions of the records of subordinate Monthly Meetings, and as such introduce errors through misspellings, transposing names, months and days, general omissions, and (occasionally in the birth records), changes of given name between the dates of entry. For this pursuit of the numbers, the primary sorting criteria used date and surname, names and monthly meeting—thus enabling a common-sense approach to de-duplication.
21 This approach also has the inestimable advantage of providing a basic validation of the data given in Rowntree for the totals of marriages for L&MQM by decade: clearly, had the figures used in 1856 proved wildly inaccurate, any re-evaluation of this work would need to take a different course.
Happily, the numbers correlate well (
Table 1), and permit acceptance of other raw data used by Rowntree with some degree of confidence.
4. Evidence of Births
Having analysed the marriages, the L&M QM Birth register was subjected to a similar process of de-duplication, then totalled by decade to enable a Quaker-specific BpM rate to be calculated for L&M QM. This was then compared to the general Quaker BpM rate derived from Rowntree’s work (
Figure 2).
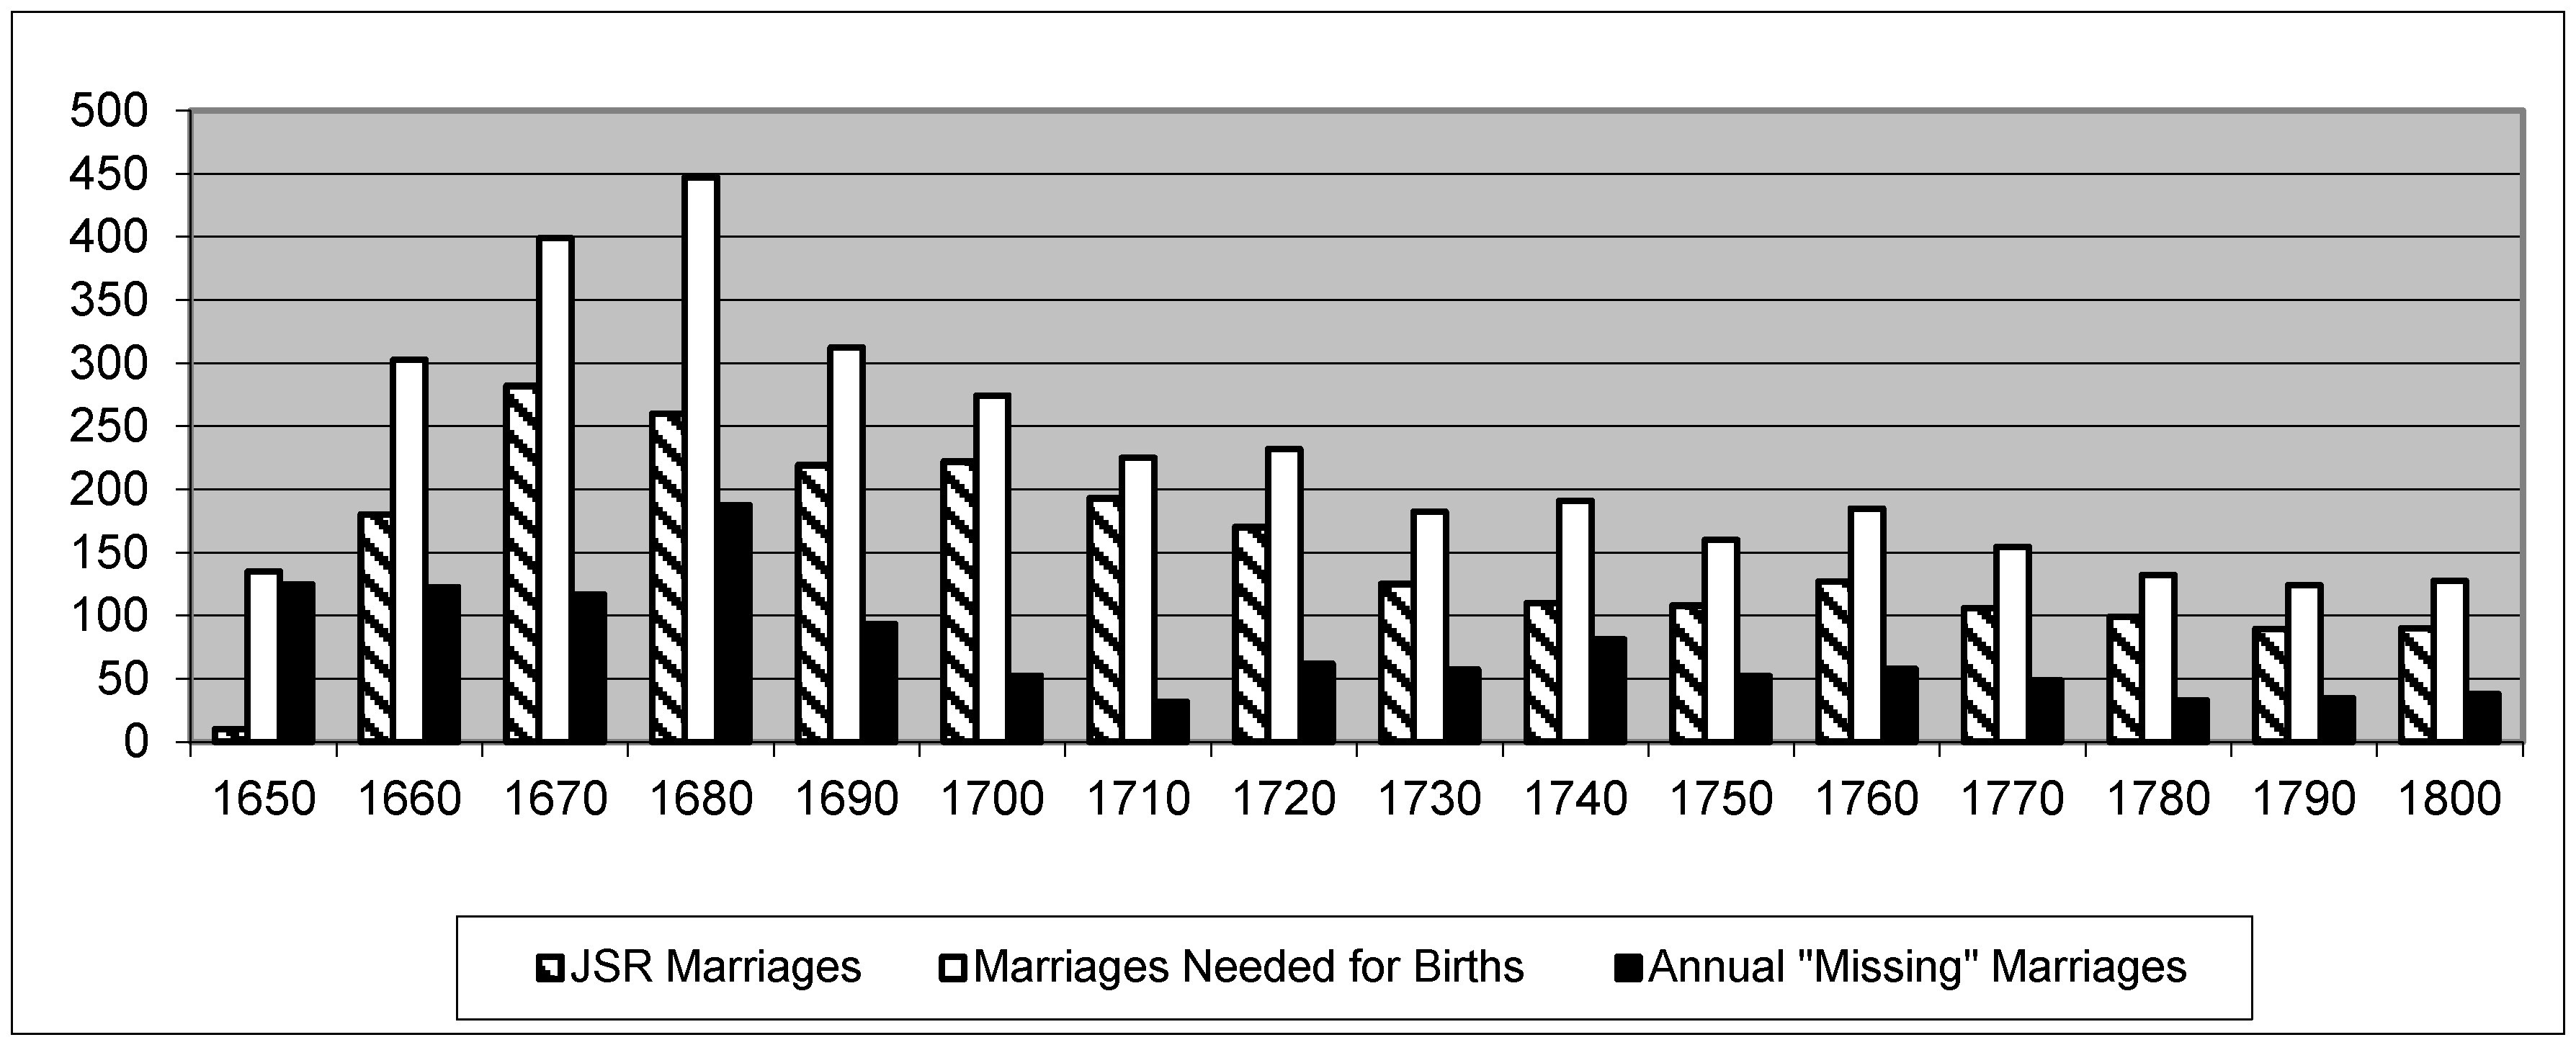
Two clear observations can be made: Quaker fertility followed that of the general population (as per the GRR) over the period; and (assuming that Quakers in general had families which similarly ranged in size to those of L&M QM), Rowntree’s marriages must be understated. Fortunately, Rowntree himself believed this was the case—hence his modification of the original marriage ratio. Using Rowntree’s data for births by decade, we can use the L&M QM BpM to estimate the number of marriages these births represent, and subtracting the number from his record, arrive at an estimate for the number of “missing” marriages (
Figure 3).
Evidently, more marriages are needed to account for the births than are in the registers. Vann notwithstanding, seeking an explanation for this under-recording solely in the slackness of the contemporary clerking procedures runs against the wider view that Quaker records were generally well kept. A much stronger explanation reflects the growing nature of the movement in the early decades: the recorded births being the natural result of marriages contracted before the parents became Quakers, thus QM marriage registers would not reflect subsequent births.
24 5. Considering Burials
Having begun to reconcile QM birth and marriage registers, the third pillar of burial records must now be considered before the three can be incorporated in a mathematical model. Burial numbers for the Society by decade are provided by Rowntree and, intriguingly, from 1750 these also include an estimate of those included who were considered to be “non-members”.
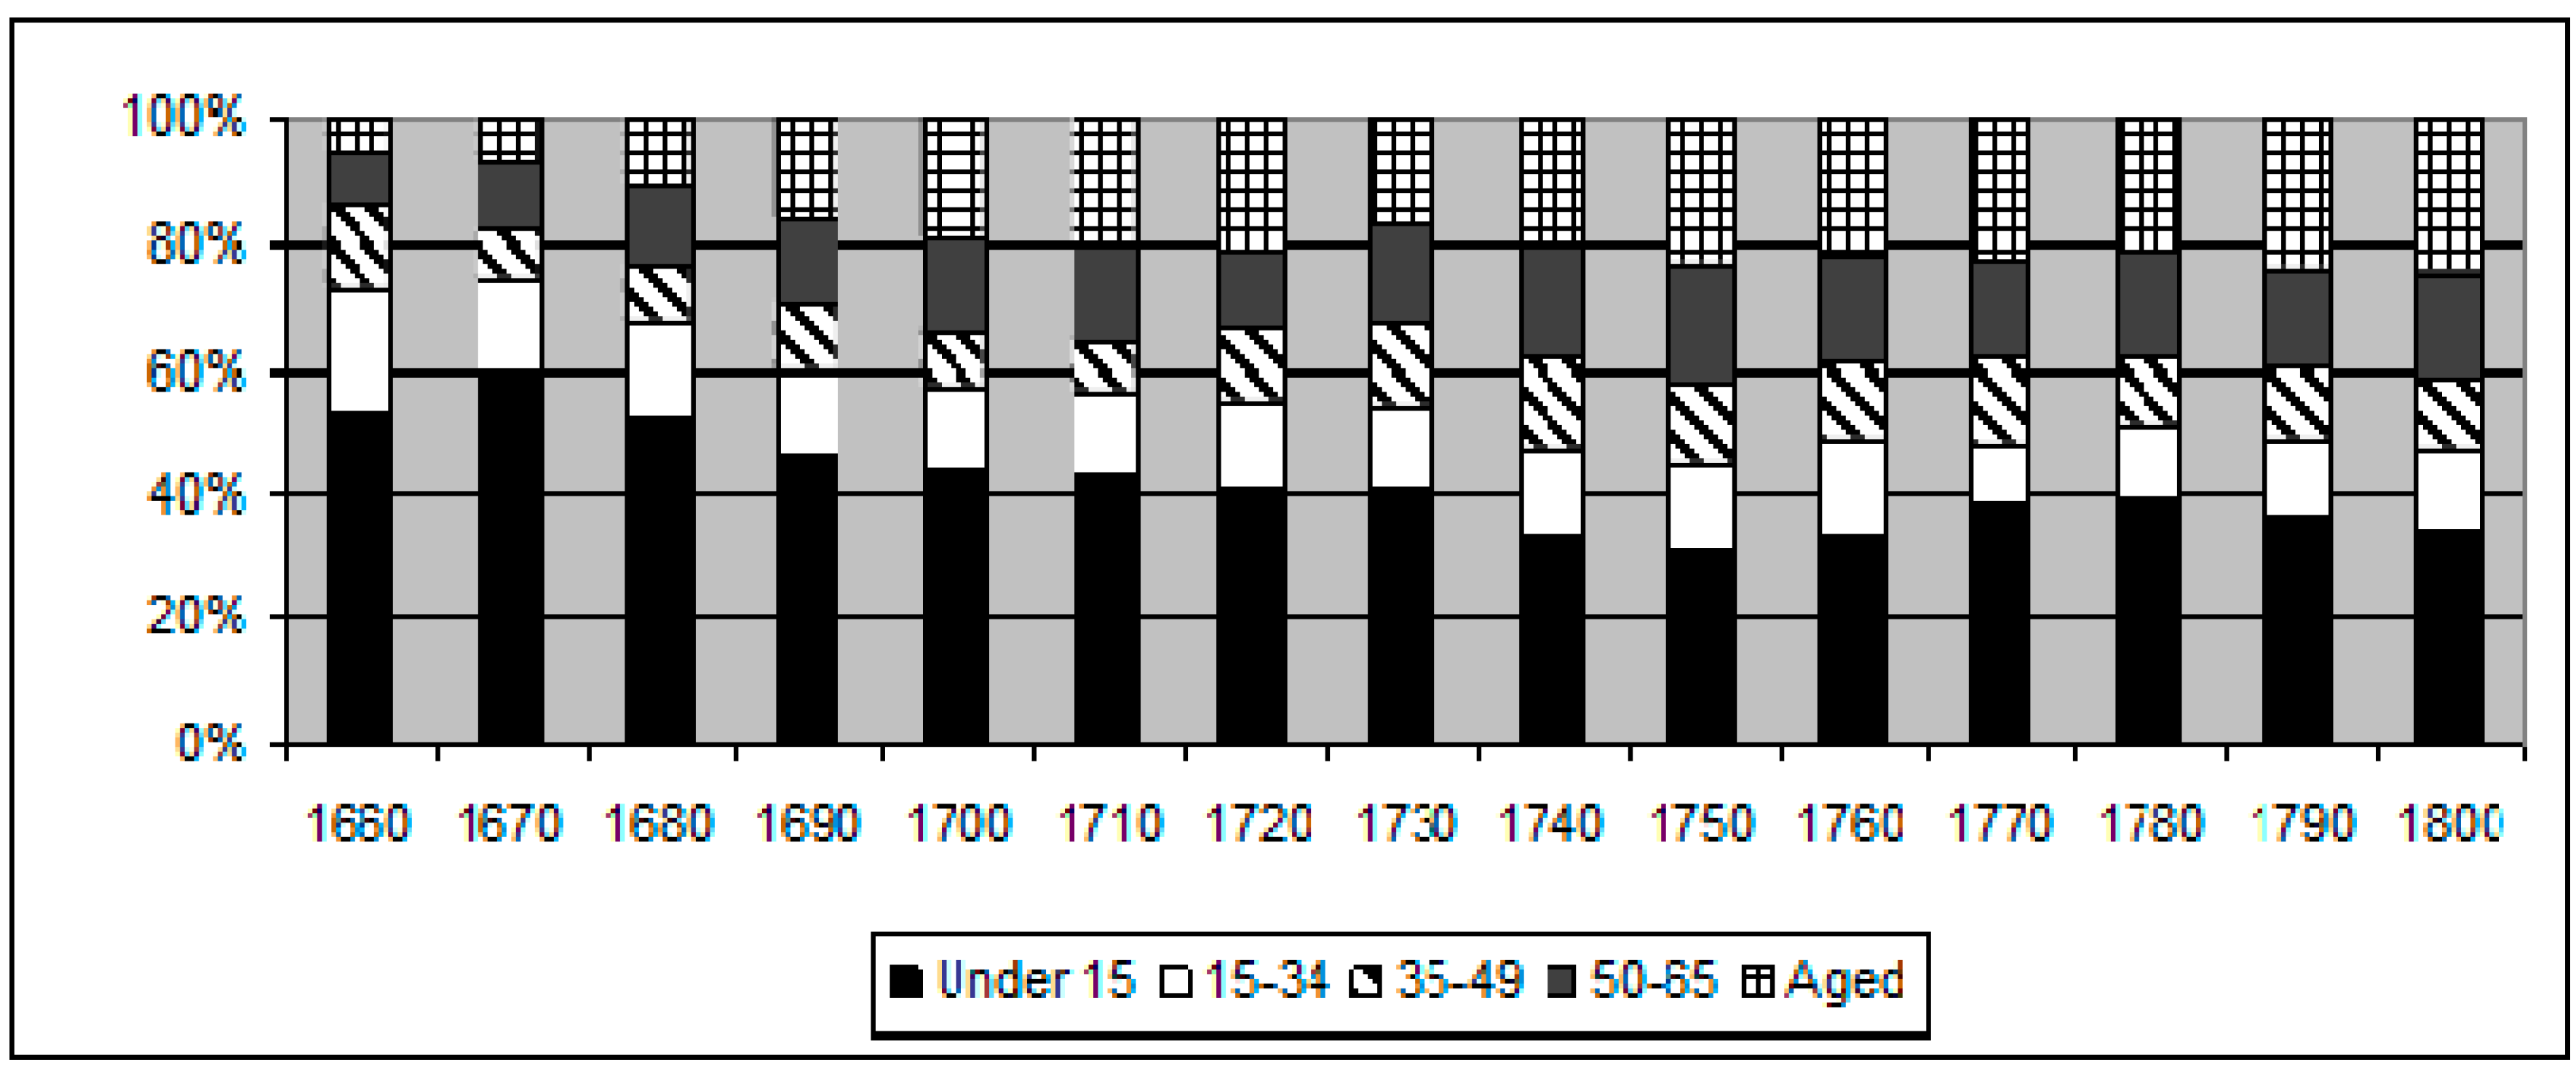
25 This topic remains a challenge to historians and demographers alike, since most scholars of Quakerism accept that the status of being “in membership” remained subject to interpretation over much of the period, with the concept of “being in unity” or “disowned” at least as widely used as that of member or non-member. Thus, these non-members might be either former Friends or, equally possibly, the (close?) relations of Friends. Considering the total numbers of burials shows that from 1670 to 1730 inclusive, more than 10,000 burial entries occur for each decade, while over the whole period from 1650 to 1809, the total number of burials recorded is in excess of 133,000. As with births, demographers have estimated a general crude death rate (CDR) over the period, which when applied to the recorded Quaker deaths by decade would produce an estimate of population. In practice, the CDR suffers the same problems of relevancy as the birth and marriage rates. Happily, the death registers for L&M QM have also been transcribed, and provide useful detail on burials throughout the period. Sorting deaths per decade by age group provides a data set of 33,231 deaths. The age groups chosen were 0–14 years, 15–34 years, 35–49 years, 50–65 years and “Aged”. This allows for the calculation not only of life expectancy at birth (
l0), but also after the age of 14 (
l15), necessary since until 1680, and in some locations after, deaths in this group accounted for more than 50% of burials.
26 The data permits the calculation of an age at death weighted by numbers per decade for London and Middlesex, giving a L&M
l0 rising from 21.6 years in the decade beginning in 1660, to 38 years by the end of the century, with a peak of 39 years in the 1750s. Although the L&M QM statistical analysis shows a more rapid increase to
l0 32 by 1700, the trend indicated aligns with the estimates Vann and Eversley produced using the alternative “family reconstruction” methodology, which gave London
l0 of 26 years at 1700, rising to 45 years by 1849; outside London their findings indicate expectancy might be ten years greater. Both sets of figures and trends are also in line with general demographic estimates created by the founders of the field, E.A. Wrigley and R. S. Schofield. Modifying expectancy to eradicate the effects of plague, the wealth of individuals, the health and even the prosperity of particular parishes within London permit a wide range of modified estimates to account for local population results, which is ultimately unhelpful: that the L&M QM registers record the deaths of around half a dozen centenarians per decade is sufficient pause for thought. However, it is safe to conclude that there was an increase in the age of the population over the period (
Figure 4).
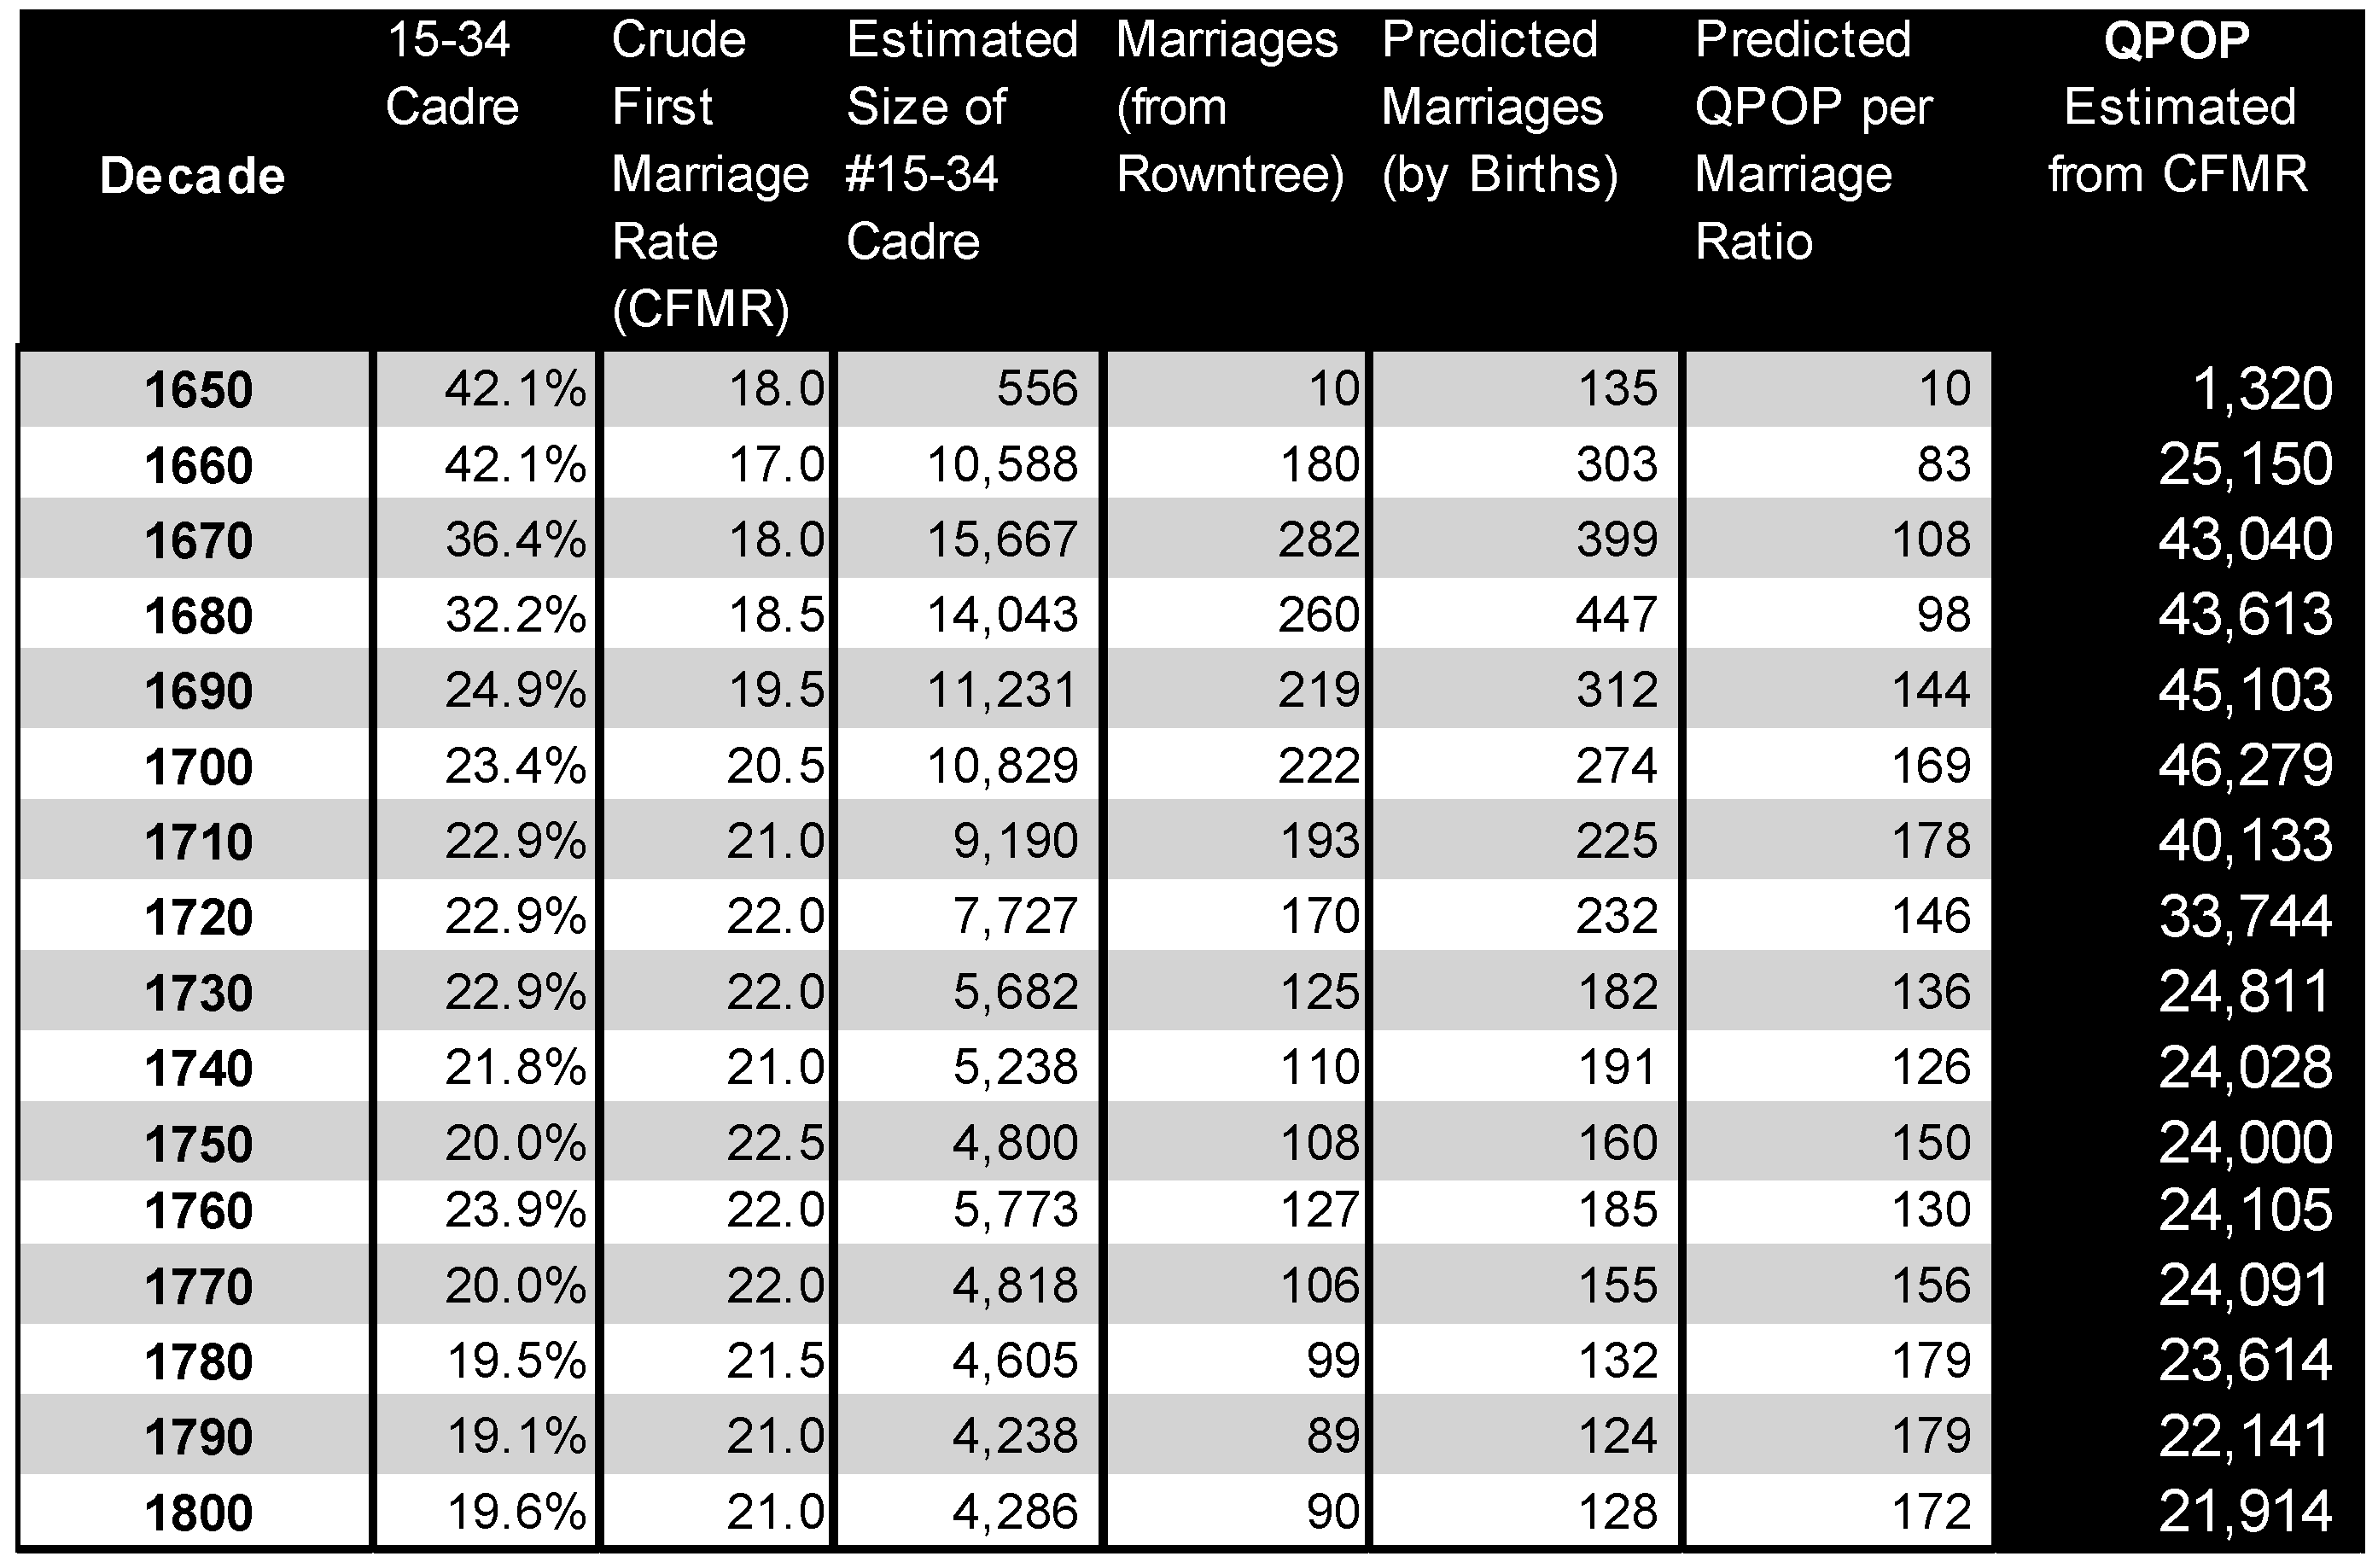
6. Calculating Population from Marriages
Having established some data points from the L&M QM registers, we can begin to assemble the rules for a model. Analysis of the L&M QM burial records shows the proportion of the Quaker population that made up each age group, which in turn provides an estimate of the size of the segment regarded as the “first marriage” cadre: 15–34 years. The crude first marriage rate (CFMR) has been mapped by demographers for the period and indicates the number of (first) marriages per 1000 of the 15–34 population, a factor which needs “adjustment” to address known Quaker propensities for initially marrying later, and later not marrying at all. While the extent of this can be debated, and following indications from the study of Quaker marriages by Wells and Zuckerman, and that of Vann and Eversley, this effect is here represented by a compression of the general CFMR by around 5% at the start of the period, to 10% by the end, both of which require a larger population per marriage. The CFMR, the revised estimate of marriages (derived from the BpM from the L&M QM Registers) and the size of the 15–34 cadre relative to that of the adult population of Quakers can be used together to generate an estimate of the Quaker population (QPOP) in England over the period (
Table 2).
27 As a reference point, Rowntree’s ratio of 1 marriage per 140 of the Quaker population can be seen to sit in the centre of the range of values generated across the period, derived from dividing QPOP by the predicted number of marriages generated from the BpM ratio (
Table 2, Col. 7).
The above QPOP derives from a steady BpM trend which requires up to one-third of the births registered to have occurred in families whose marriage was either contracted before they became Quakers, or was conducted outside the Society. Helpfully, Rowntree includes in the 1800 birth total of 6910 the note that only 4863 were births of members, giving a reference point of 30% for that decade. The estimated ratio of “convinced married” and “married out”, and some of the implications, are examined below.
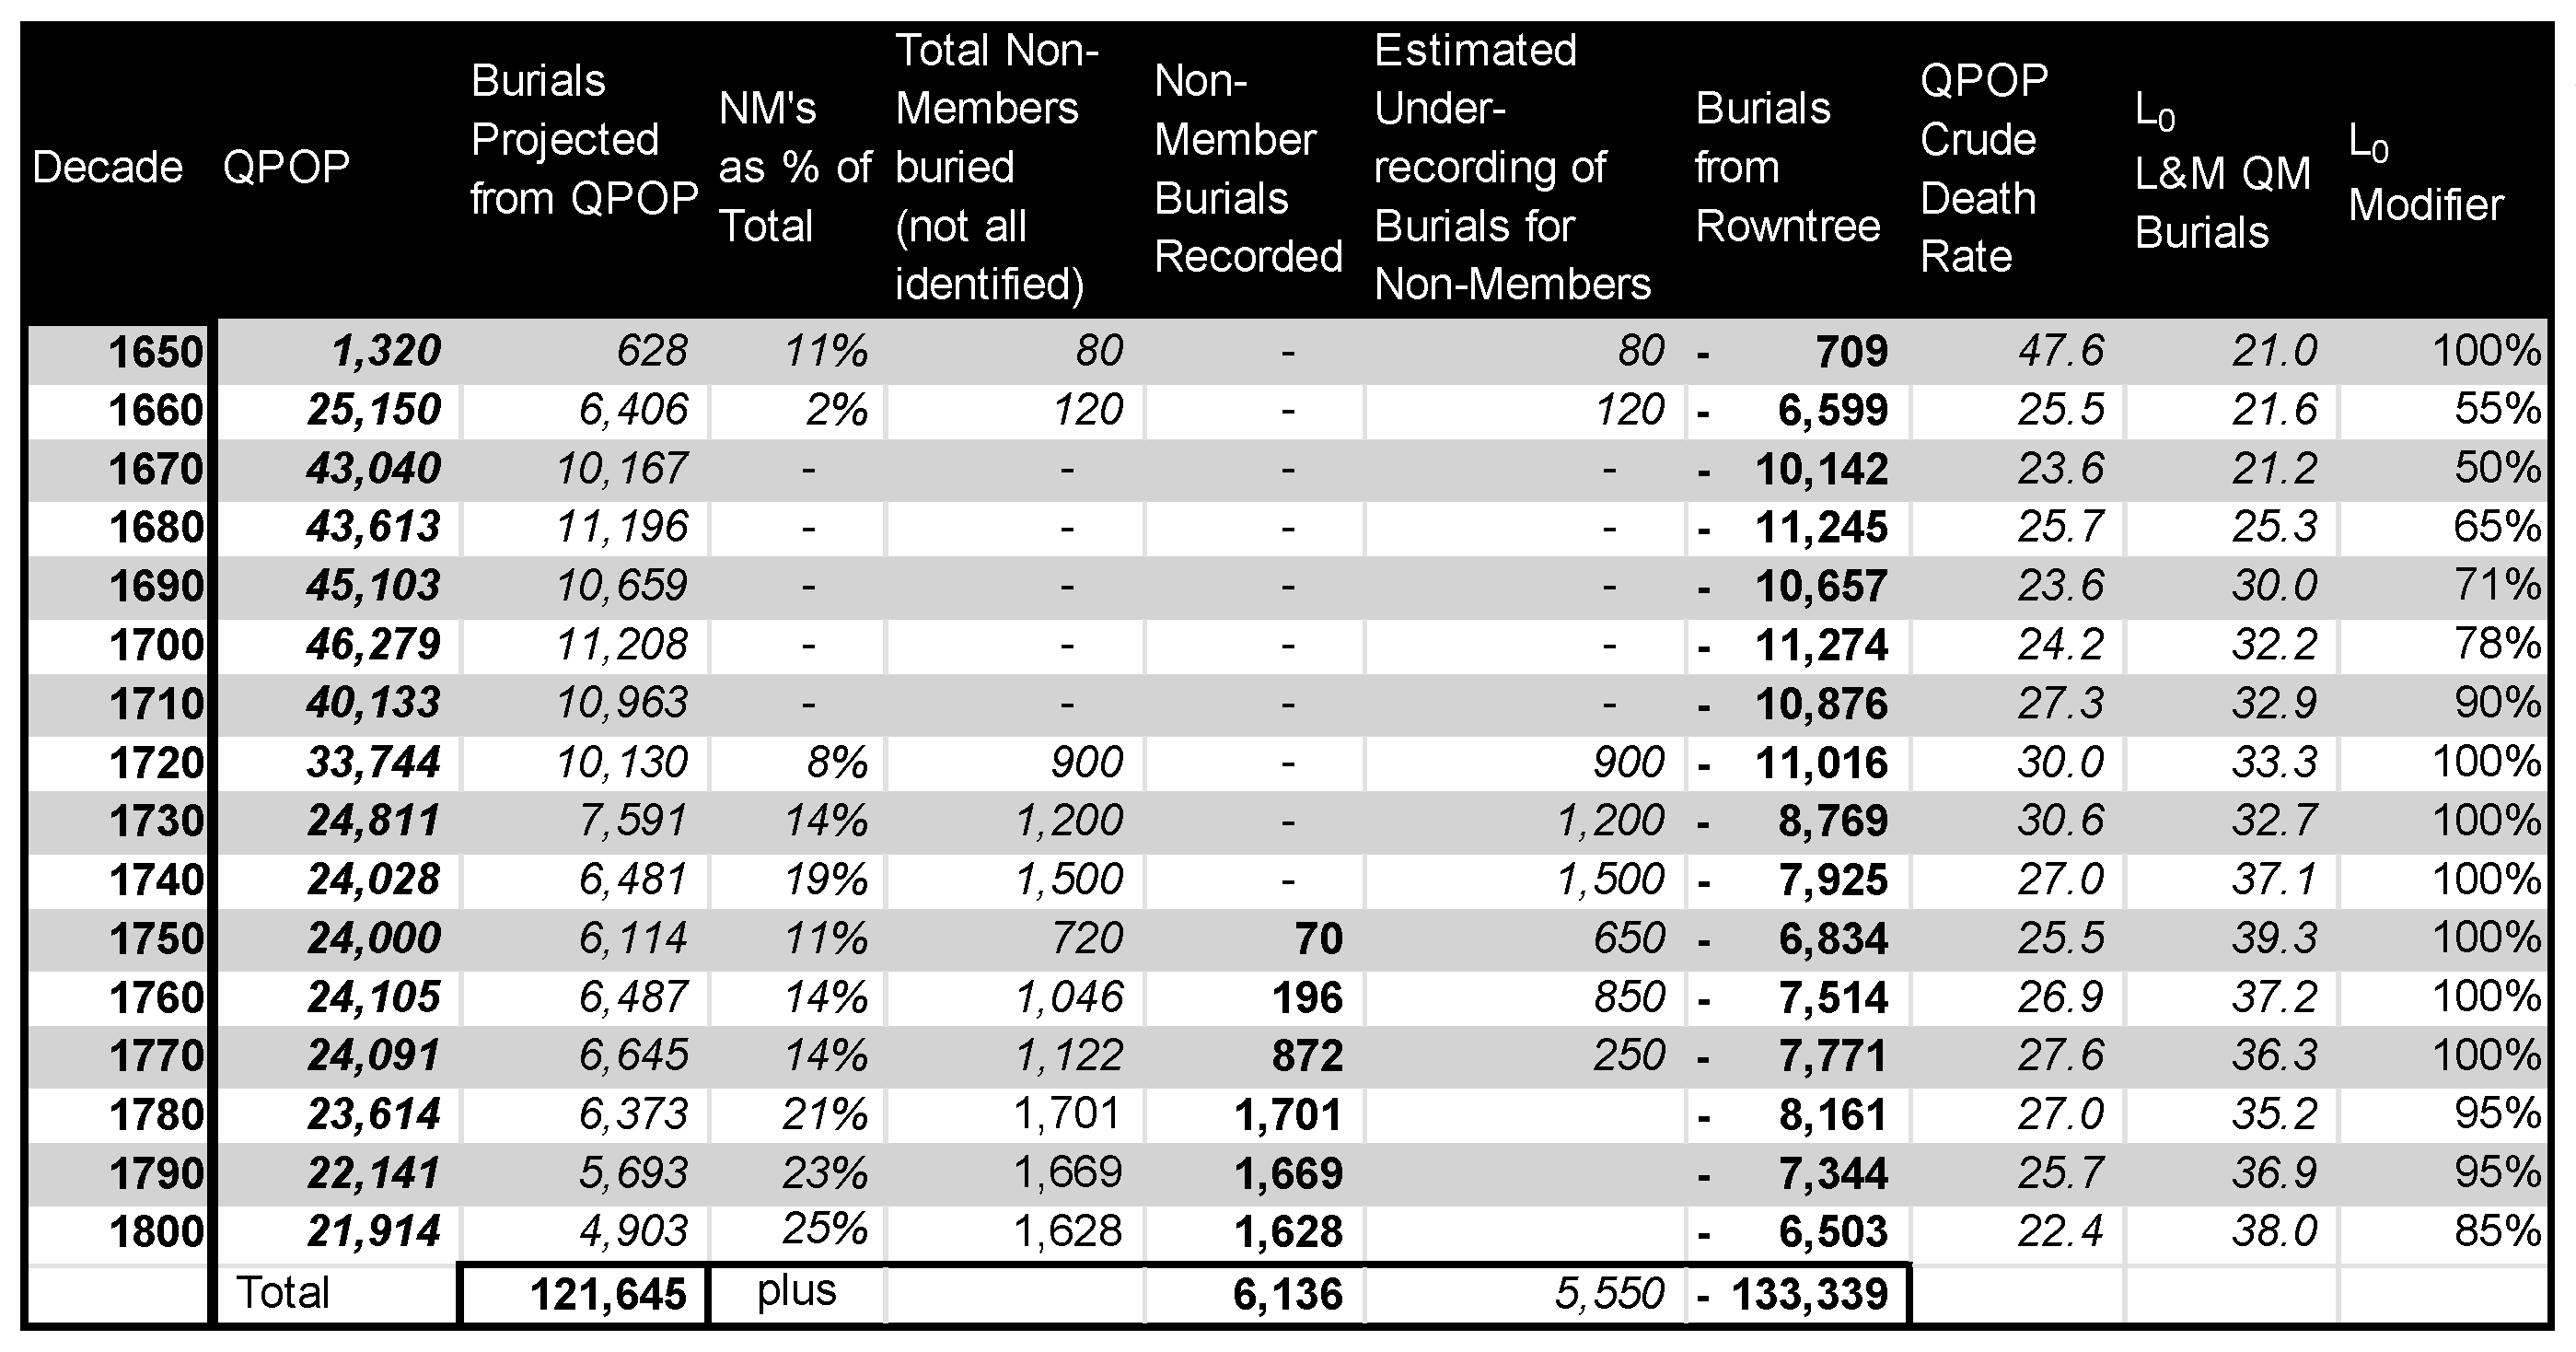
7. Accounting for Deaths
Having constructed a mechanism to align births and marriages, the model requires some accounting for deaths. As noted above, a simple subtraction of registered burials from births using QM records by decade given by Rowntree gives a balancing item, which can be used to adjust the total for the following decade. However, it is preferable first to validate if the estimated size of QPOP for each decade could reasonably be expected to generate the numbers of Quakers recorded for that period in the burial registers. This requires reviving the life expectancy trends calculated earlier from the L&M QM burial registers, which needs to be (following Wrigley and Schofield) “adjusted upwards to remove the depressing influence of London”.
28 L&M QM registers account for approximately 17–20% of total Society marriage records, so a similar ratio might be used to approximate the uplift in
l0 needed to reflect enhanced longevity outside the capital, ascending through the period. Frustratingly, this approach does not deliver the “right” numbers: instead it suggests that a much larger QPOP was required in the second half of the period, since fewer deaths arise from a longer-living population. To sustain the QPOP estimates from the birth and marriage registers actually requires
a fall in average
l0 during the long eighteenth century in order to generate the deaths recorded.
Despite being apparently counter-intuitive, such a trend is likely to have been the case. This arises because the original population of convinced Quakers was not made up of a general cross-section of the late seventeenth century population, who would exhibit death rates similar to the general population. Instead, these were largely younger adults: the median age of converts, according to Vann’s restructuring, was thirty-three.
29 The implications of this are clear: a population consisting of those who had survived Death’s predations on youth would have a significantly higher life expectancy. Calculating
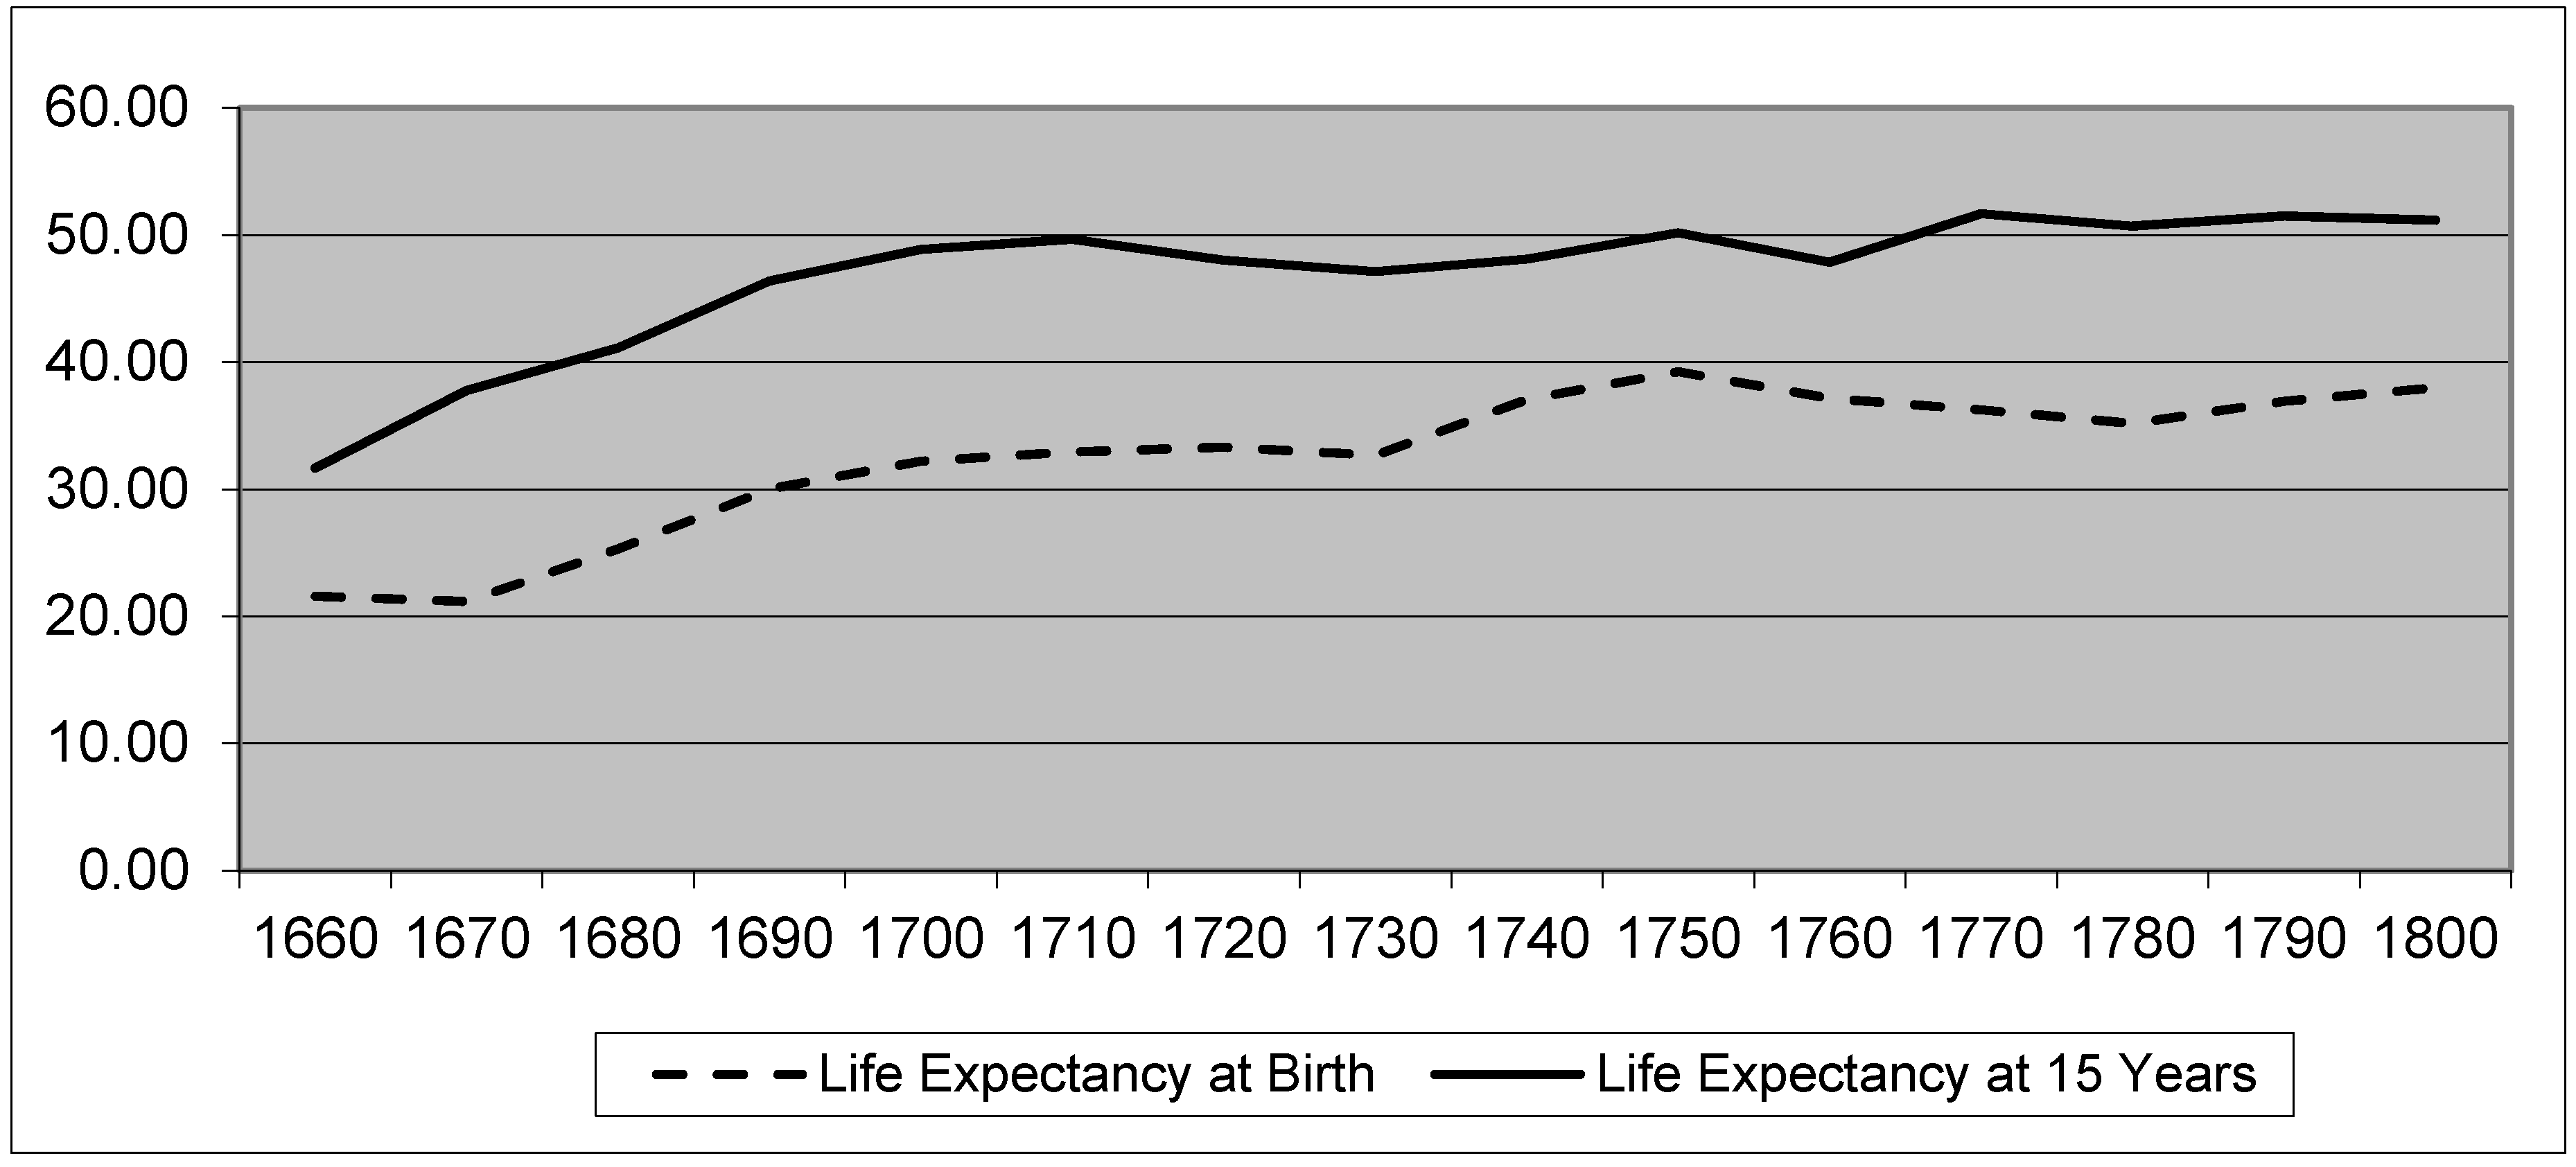
l15 from the L&M QM burial registers suggests figures between 10 and 15 years greater over the period (
Figure 5).
A Quaker population which transitioned from one consisting entirely of “convinced” converts to one sustained substantially by births within the Society would thereby expect to experience a general decline in
average life expectancy. The effect would be equally felt in regions outside London, but from the L&M data (
Figure 5) it is clear that even by the end of the century,
l0 is considerably lower than
l15 for most of the period. Assuming that Quakers in general had lifestyles that aligned more closely to other Quakers than to the general population, it can be shown using the L&M QM data that when the
overall l0 values experienced by the general QPOP “shadow” those calculated from the L&M QM registers in such a manner so that in the first decades the QPOP
l0 is higher (the “convert” effect), but subsequently falls over time to approach parity, then the estimated QPOP generates the number of burials recorded in the registers (
Table 3). The modifier needed to create appropriate shadowing of L&M QM
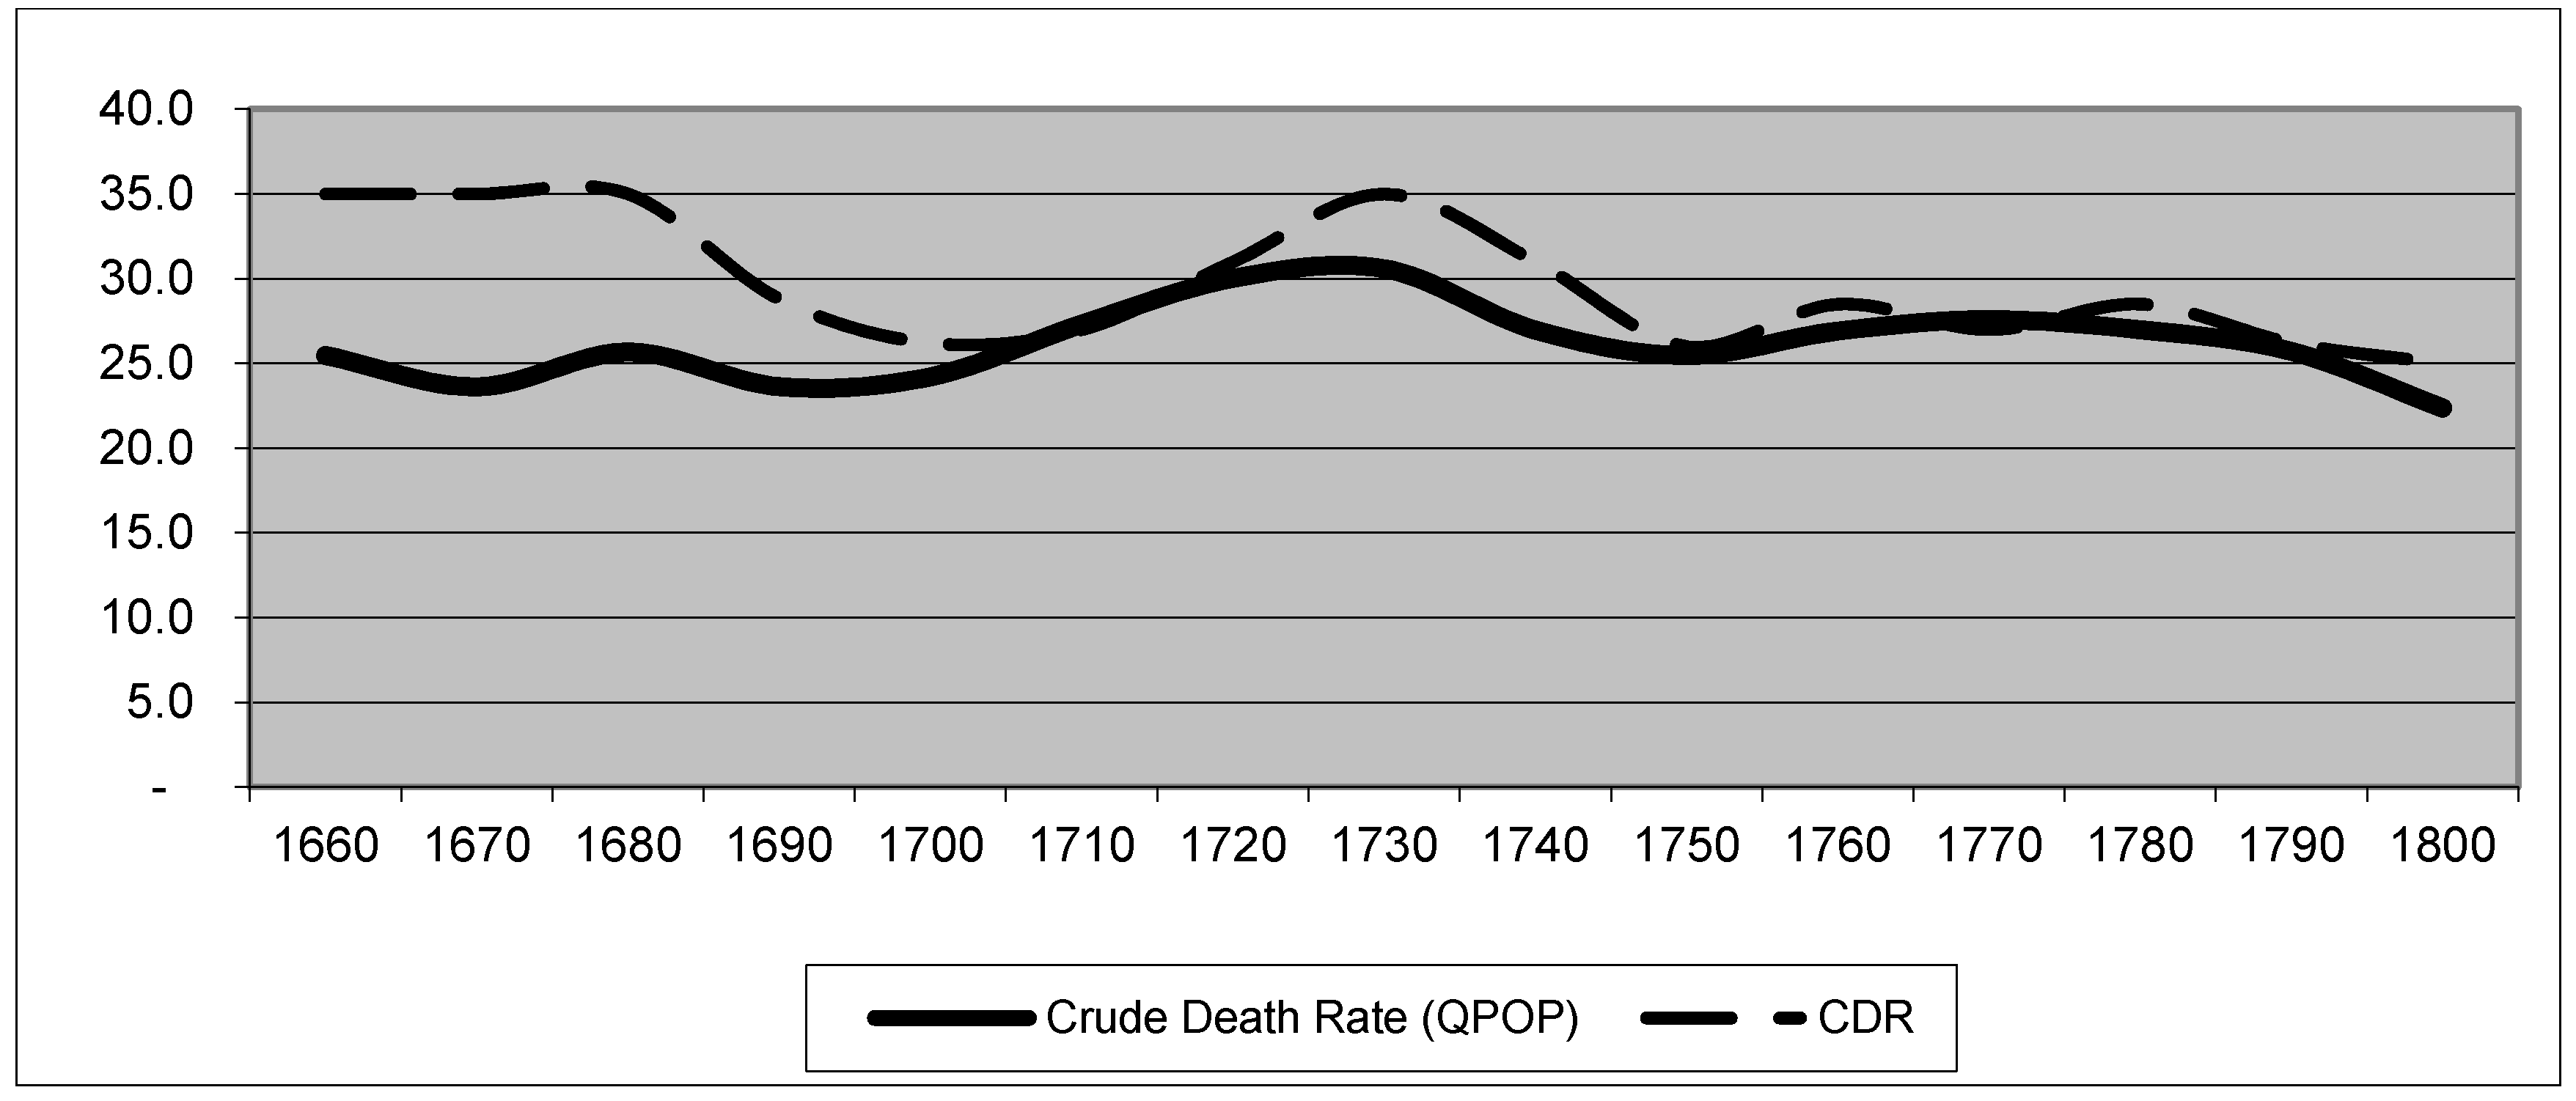
l0 can be approximated by ensuring that the CDR (deaths per 1000) used in the QPOP calculations first lags and then aligns with that noted by demographers for the general population over the period (
Figure 6).
30The CDR used above for the Quaker population is generated by modifying the L&M QM l0 to ensure it remains lower than that of the general population at the beginning of the period, an effect which is removed in order for the Quakers to draw in line with overall demographics as the Quaker population ceases to be made up of adult converts, and the impact of early-year mortality takes effect.
Table 3 shows the application of this “modifying factor” to the L&M QM
l0 from which is derived a revised crude death rate, which is applied to the QPOP estimate to generate a projected number of burial records which approximate to the burials shown in Rowntree. As with the birth records, Rowntree gives some figures for non-members buried for some decades: while such instances are recorded from 1750, it seems likely that such a practice began earlier, and the separate recordkeeping took time to take effect. Historians have not established the extent of the practice, but if Rowntree is correct in accounting for one-quarter of all burials as non-members in 1800–1809, it seems that the practice was widespread. A more likely scenario is presented in the table, with the practice starting in earnest around 1720, and increasing over the next decades until suppressed (temporarily) by the revival of Quaker discipline around 1750. This speculation allows the trends in non-member burials to make sense, without materially affecting the model.
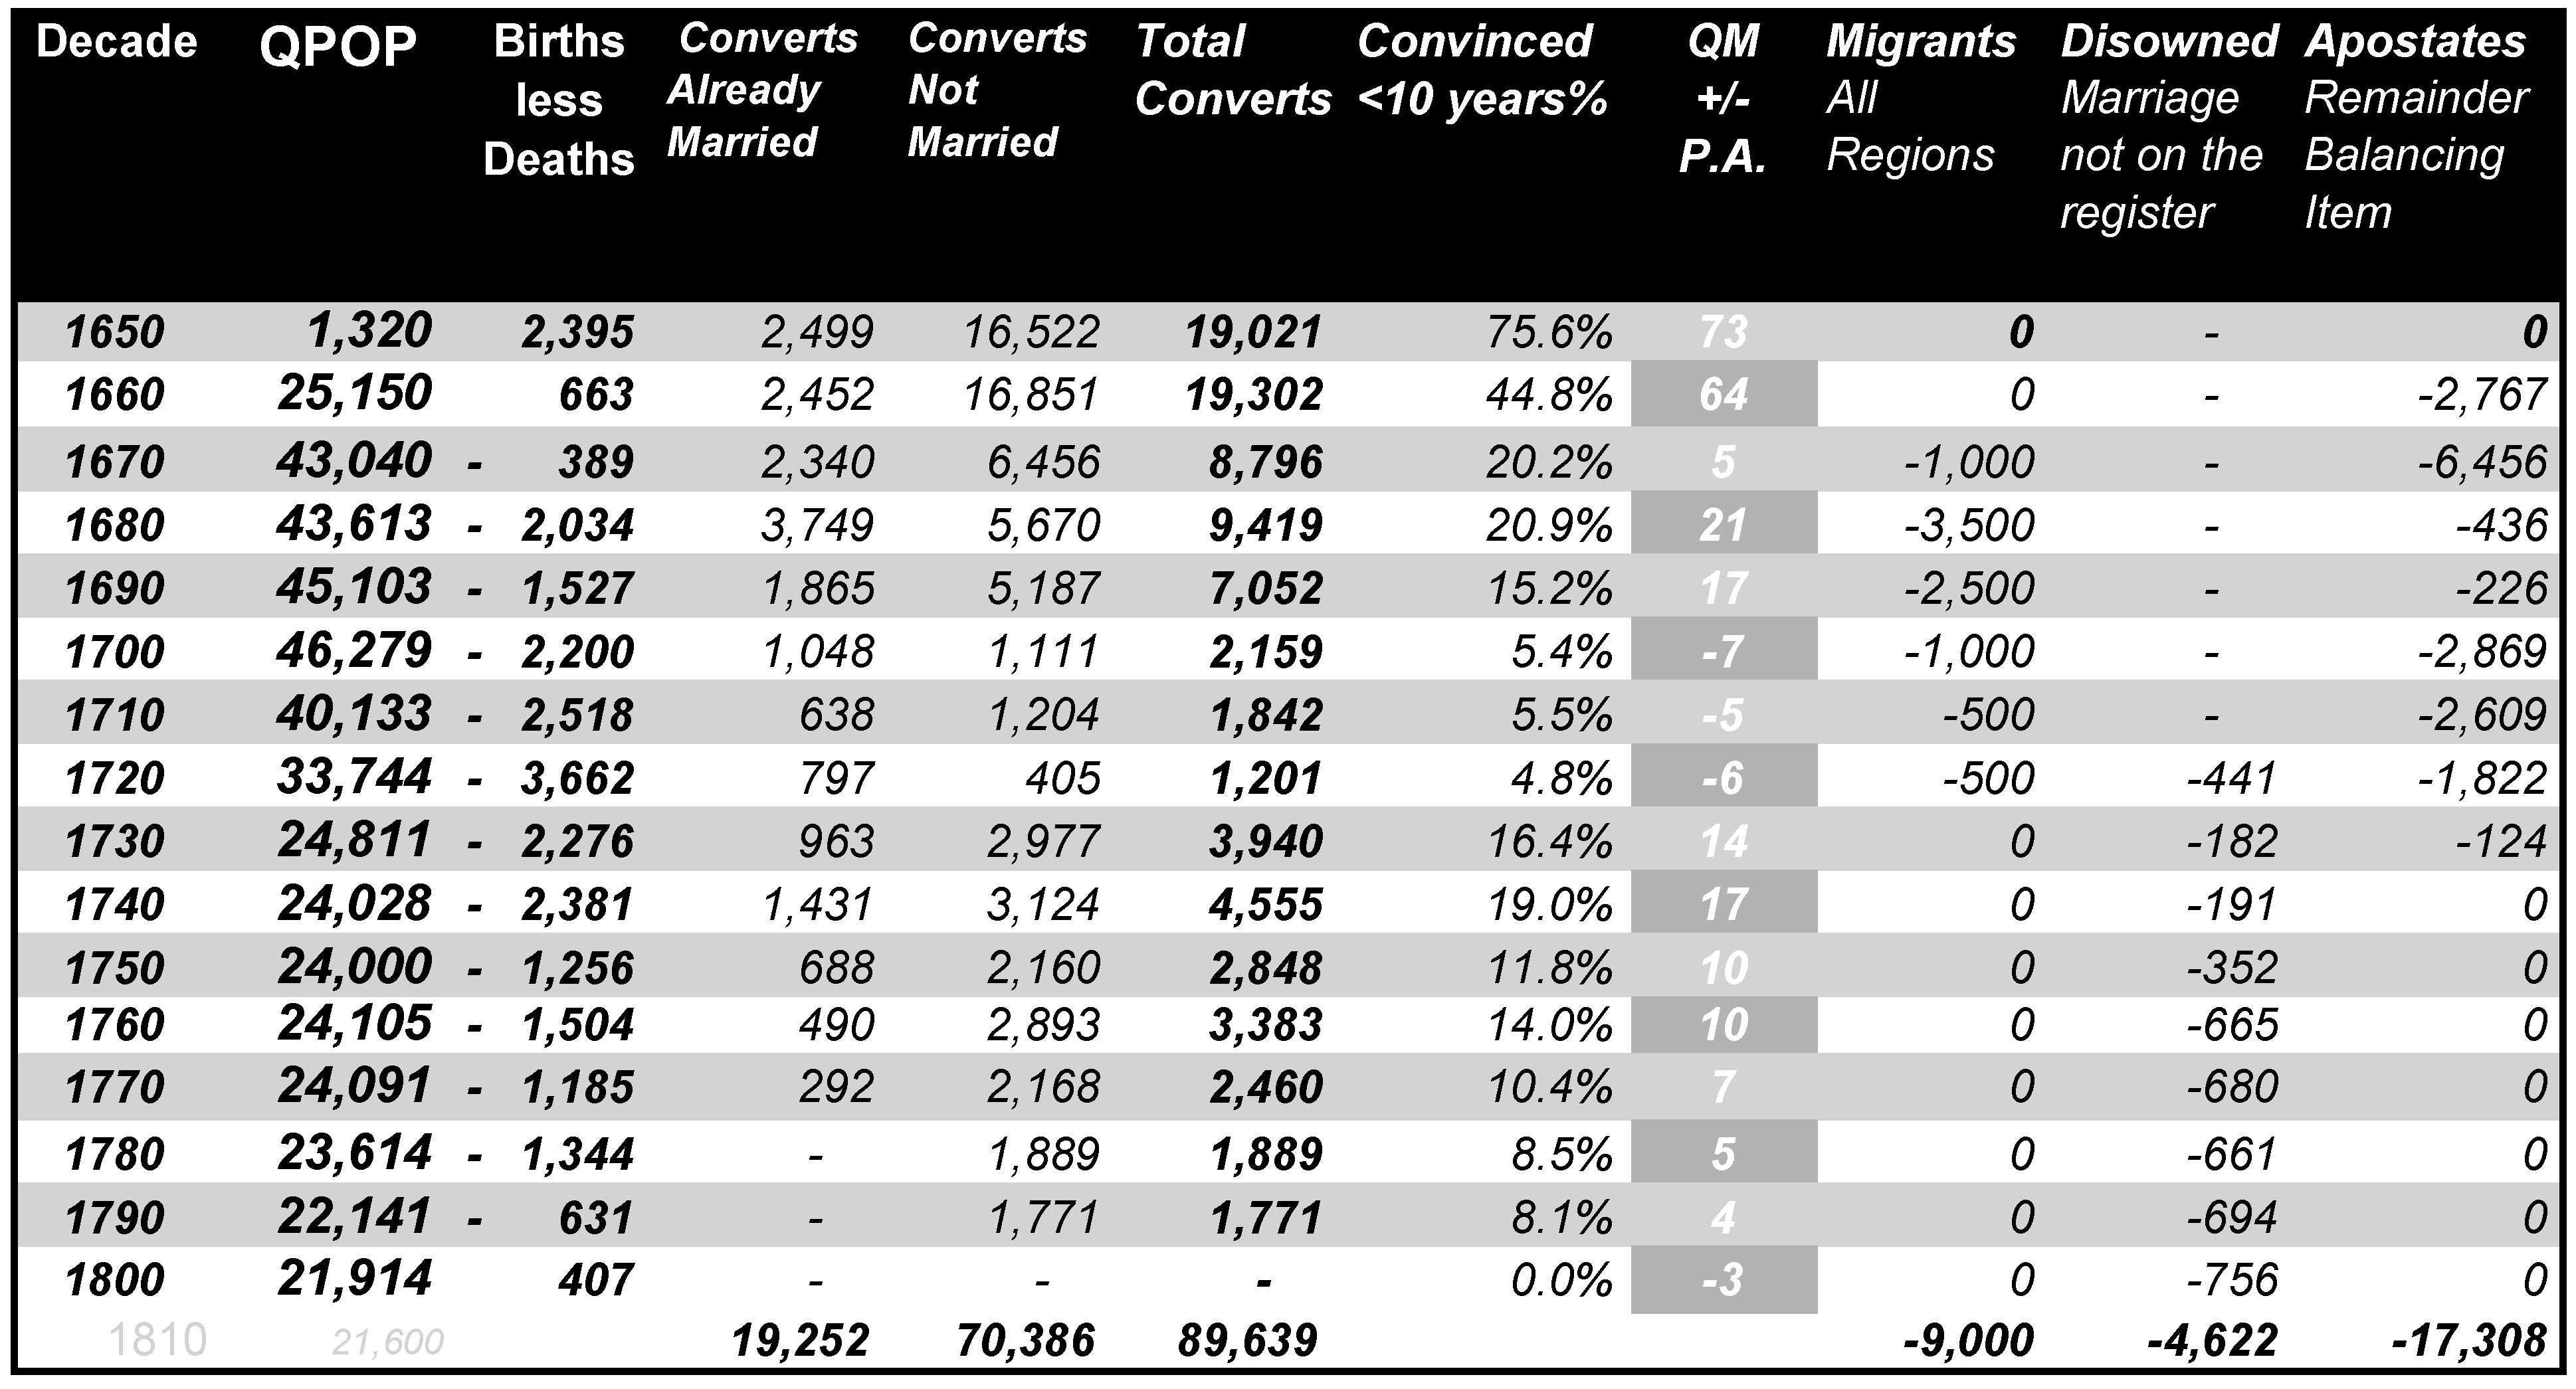
8. Swings and Roundabouts
It remains to be validated if the decadal fluctuations in the QPOP estimates can be explained by the modified data derived from the QM birth, marriage and death registers. In order to do so, three established but unquantified elements in the history of the Religious Society of Friends need to be accounted for. The first is that of “convincements”—those who flocked to join the Society in the heady millenarian days when the movement believed it was founding a new world church. The second concerns those who left, either voluntarily as migrants to seek new lives elsewhere (many to Ireland and others across the Atlantic), both before and after the founding of Pennsylvania in 1684. Finally, there are the “apostates”, those who left once it was clear that the second coming of Christ was increasingly delayed, and those who preferred to avoid the “sufferings” that the Quakers attracted through refusing to conform with the prejudicial laws against sectarians. A subset of this group, known as the “disowned”, represents those who were rebuked by the Society for not being in unity; during this period the most common reason for being in such a state was “marrying out”, either with a non-Quaker partner, or simply by the established church.
Considering the first of these, the model suggests that there must at least be some who came to the Society married, and subsequently entered their children on the register. There also need to be many who swelled the ranks in order for the CFMR to generate the remaining marriages. Accepted Quaker historiography would see this as an increasing swell of converts during the last decades of the seventeenth century, falling rapidly by the turn of the eighteenth century, yet retaining still some appeal to attract new membership over the period. The “emigrants” class has been well-charted by Quaker historians, although (perhaps again, unsurprisingly) the extent of migration remains disputed. Traditionally, many thousands were believed to have left for the New World: Richard Vann cites Joseph Illick’s estimate of 8000 by 1685, while noting that other historians have been “less venturesome in committing themselves to figures”. Vann argues for a lower earlier total based on the number of surviving Quaker removal “certificates”, giving about 1000 before 1685, and a further thousand in the 1690s. The most recent full-length study of transatlantic Quakerism, curiously, if tellingly, makes no attempt to address the subject.
31 Rowntree has no doubts that it was a considerable number, chalking up five hundred per annum between 1676 and 1700, and a “very considerable number” afterward—unfortunately his source for this was an appendix to an amateur collection of statistics, created in the mid-nineteenth century, and lacking provenance.
32 Most scholars would probably accept a number between eight and ten thousand over the period, tailing off sharply after 1700, as uncontroversial. The third group are highly likely to have begun to leave the nascent Society almost as soon as it began, towards the end of the 1660s after the chastening effect of the Great Fire of London and the plague had failed to deliver a New Jerusalem. Many of those who had become Quakers in search of personal betterment (of which there may have been many) are likely to have made the transatlantic journey even without Quaker certification, or simply abandoned sectarian religion in the spirit of an increasingly secular eighteenth century. Extant scholarship on the Quaker apostates tends to focus on the trajectories of prominent individuals, which unfortunately fails to help statistically, leaving this area very much in the dark. The final group—that of the “disowned”—is similarly lacking in quantifiable data. The solution adopted here is to make an assumption that the missing marriages until the formal marriage regulations of 1737 represent married couples joining the Society before contributing their subsequent children to the registers, while those after this point increasingly include couples who “married out”, and were disowned, before contributing theirs. While the accuracy of such an approach can only be guessed at, it has the advantage of modelling quanta while fitting an accepted interpretation of historical events which accepts significant disownments as a feature of the period of Quaker Discipline which began around 1755.
Taken together, these flows produce a model which attempts to reconcile data derived from known QM records with factors from wider demographic work, while accounting for changes in the English Quaker population for each decade over a period of one hundred and fifty years.
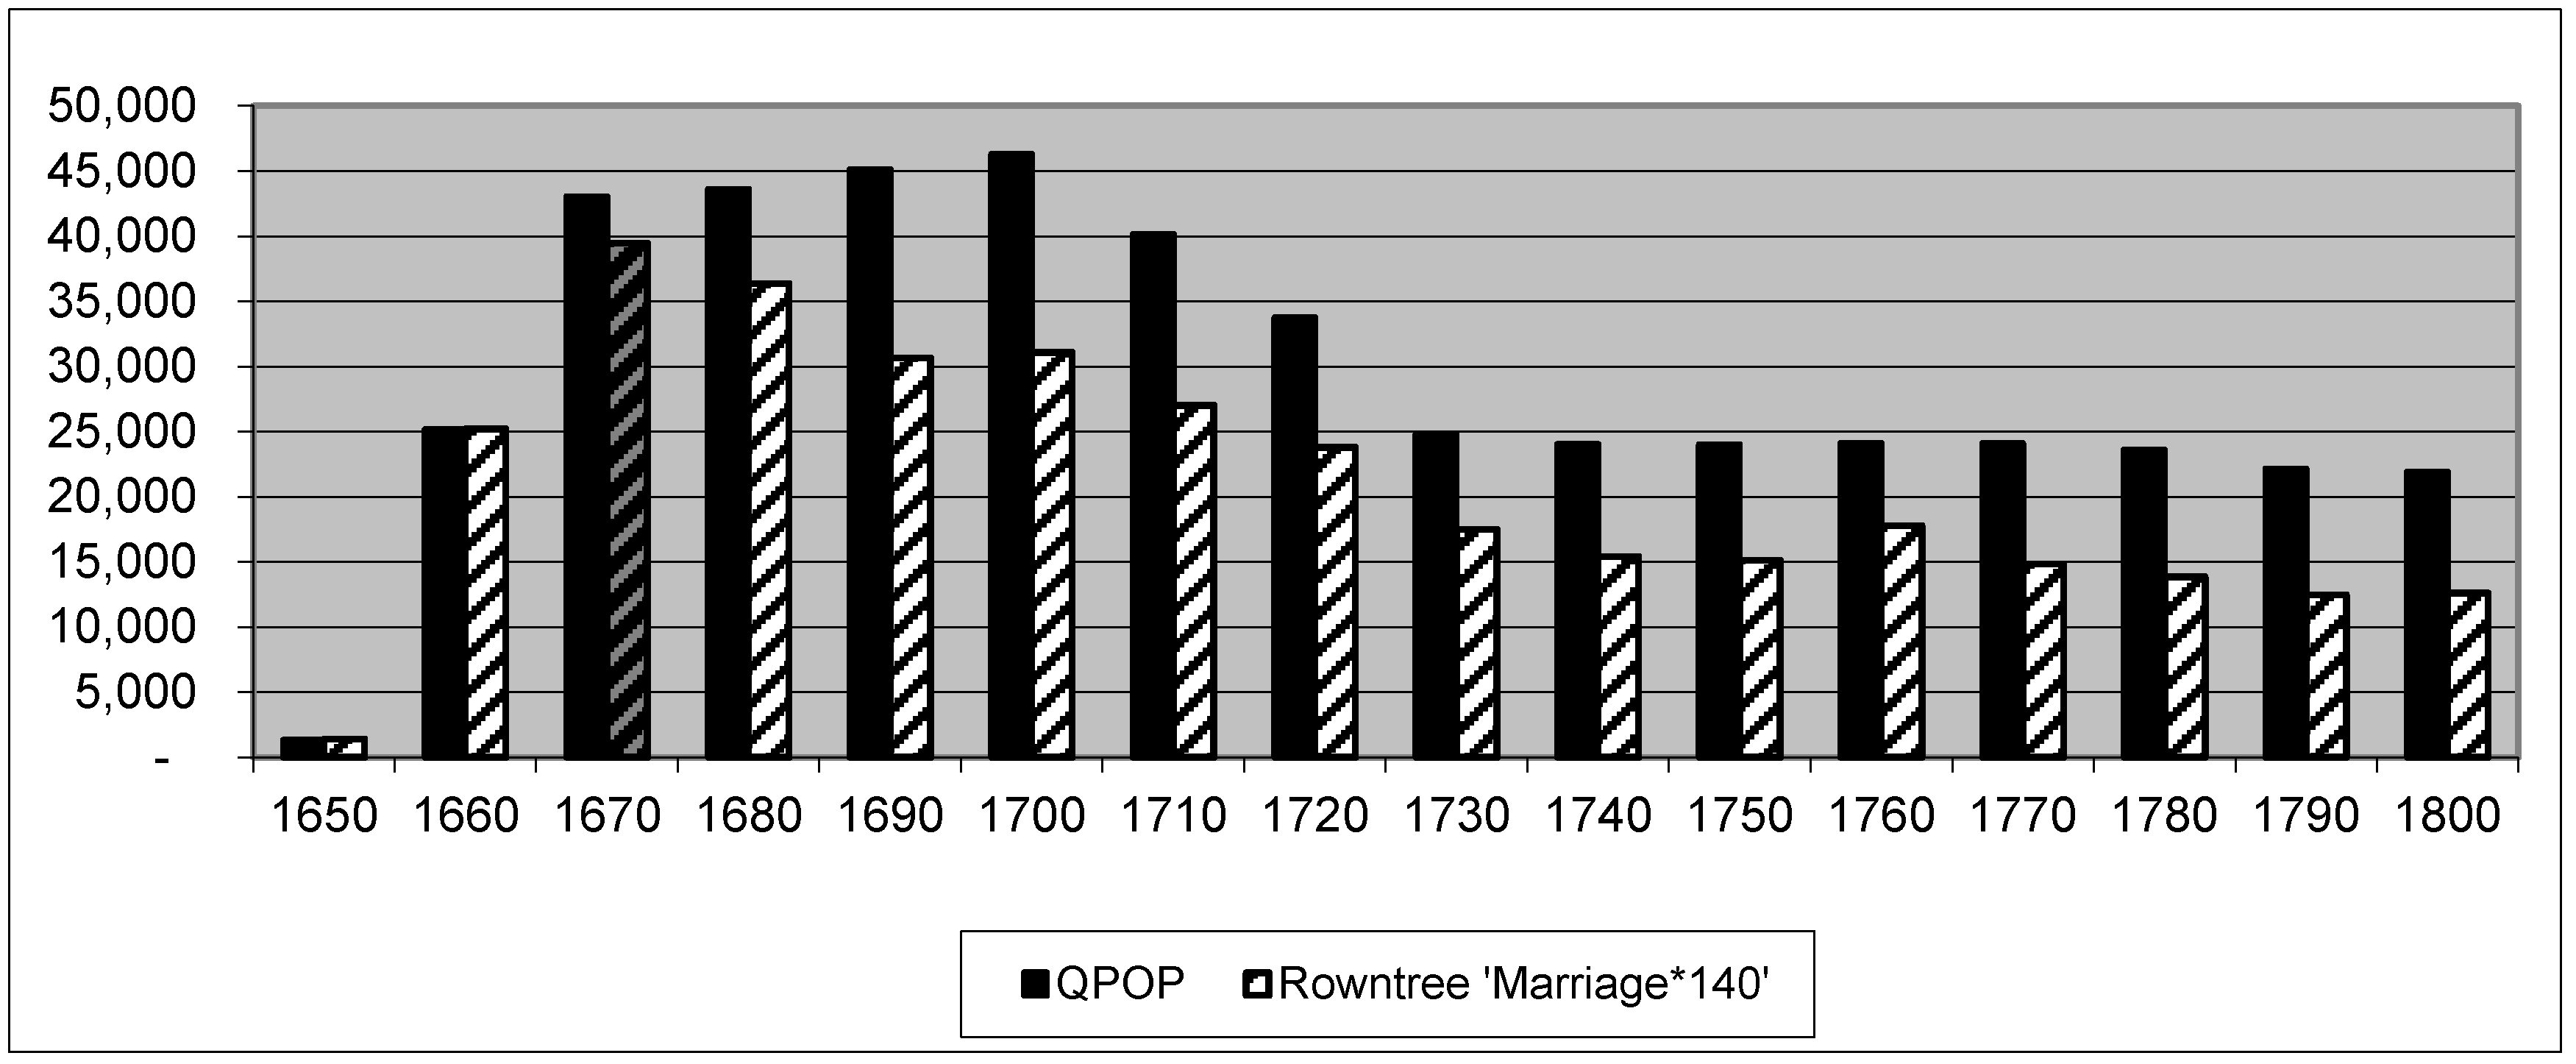
The projected populations of the model are shown in
Figure 7, against estimates from the Rowntree approach. One of the first observations might be that the figure for the beginning of the nineteenth century approximates Rowntree’s estimation of 19,800—not perfectly well, but rather better than using Rowntree’s own projections from marriage. Looking in more detail at the consequences of the assumptions above, some further points of comparison occur (
Table 4).
First, the number of projected emigrants is about half that of estimated apostates, suggesting a ratio of one in three leaving to promote Quakerism, while the remainder dropped away for other reasons—in fact, the balance could shift easily either way. Second, all major movements from emigrants and apostates together are completed by the very early eighteenth century, when the Society has the least “new blood”: over 95% of Friends would have been convinced for more than ten years. This fits the profile of the Society in Quietist mode, minimizing engagement with outsiders and with the world. Third, following a low in convincements at about the time the last apostates were leaving, there is a steady if not spectacular recovery, until around ten or twelve percent of the Society enters membership every decade. This aligns somewhat with the religious “awakening” movements of the period, not least Methodism and associated spiritual ventures. Finally, an estimate has been made of the actual annual impact these movements would have had on those in the Society’s Quarterly Meetings (see figures in grey, centre of the table, Column QM +/− P.A.). With approximately twenty-five QMs across the country, the aggregate experience would have been at first to see dozens of new Friends joining each year, tailing off until a perhaps (net) half dozen or so would leave or migrate, before that too tailed off, and by the middle of the century perhaps a dozen or half dozen might join. At the level of monthly meetings, or even lower preparatory meetings, the effect would be highly individual (and sometimes invisible) at all dates from 1700, with at most one or two joining or leaving each local meeting in any year.
9. Conclusions
In thus examining Quaker numbers during the long eighteenth century, the original motivation was to see if they could be made to “stack up”—that is, given sufficient manipulation, they could be incorporated into a model which accounted for known data. This would have enabled some conclusions to be drawn regarding the accuracy (or otherwise) of the registers over time, and allowed some comments to be made regarding Rowntree. Having brought the model this far, it seems fair to suggest that not only do the registers “stack up” but that estimates for the numbers of Quakers in the Society can be projected with some accuracy, in populations which not only align to general demographic indicators, but also reflect known dynamics within Quaker history.
Yet at no point do these projections become facts. Professor Peter H. Lindert’s warning that the “uncritical consumption of detailed estimates can be critical to intellectual health” is ever valid, and his desire to “replace old, rough, tentative guesses with new, rough, tentative guesses” remains an aspiration.
33 That said, there would appear to be more than sufficient correlations of a positive nature to justify using these figures, while awaiting further work to augment the fundamental assumptions within the model.
With respect to such further work, the model prompts new questions in several areas. The first concerns the nature and extent of eighteenth-century discipline, specifically: what was the real extent of those disowned by the Society? Previous explanations have required large numbers of Quakers to be expelled in order to reduce numbers to known “Rowntree” levels, yet the model would tend to suggest that such expulsions were minimal, and thus any resurgence of discipline was either exaggerated, or perhaps less drastic in execution and consequence. A similar question regarding numbers arises in the case of how many early Friends emigrated—as has been noted, there exists a level of uncertainty regarding this traffic where clarity would be particularly useful. Finally, the model assumes that the Society of Friends remained able to attract a number of converts throughout the period—albeit a relatively small number when compared with the awakenings that would go on to establish Methodism. Much useful work can be done on the nature of the beliefs of this membership compared with those convinced earlier, as well as perhaps on any differences between such new members and birthright Friends which might help account for later developments within the Society.
Finally, we might do well to remind ourselves that the two Biblical attempts to number the Children of God from “Beersheba even to Dan” differ by a significant margin: while we may hope to do better, this should serve to emphasize the enduring difficulties associated with historical reconstruction of population data.
34


