Religion and Innovation in Europe: Implications for Product Life-Cycle Management


Abstract
:
1. Introduction
2. Literature Review and Hypotheses Development
2.1. Evolution of Religiosity
2.2. Reasons Why Religiosity in General May Influence Attitudes towards Innovation
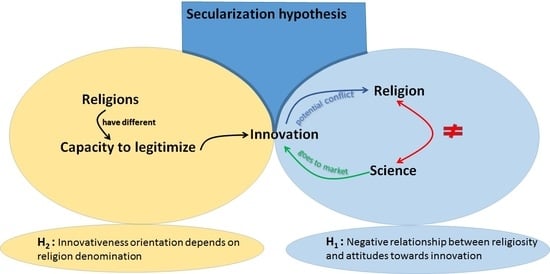
2.3. Religions and Attitudes toward Innovation
3. Data and Methodology
3.1. The Sample
- Thirteen questions about respondents’ beliefs, attitudes and behaviors towards innovation and innovative products—attraction to innovations, purchasing intention, innovation meaning, innovative buying preference, price, innovation as gadgets, innovations as fashion and innovations simplifying everyday life (dependent variables);
- Two questions regarding religiosity—the first, to what religion faith the interviewee belongs; and the second, the frequency which they attend religious acts (independent variables);
- Finally, five sociodemographic aspects that arose in the literature review as having a potential effect on the dependent variables under study—marital status, education, gender, age and type of community where the interviewee lives (control variables).
3.2. Methodology
- The tests in correlations were not significant in approximately 50% of the cases.
- There were three factors with eigenvalues greater than 1 that explained only 51% of the total variance, when the acceptable minimum is 60% (Hair et al. 2014).
- Finally, and most importantly, factors were not interpretable, even when the solution was rotated.
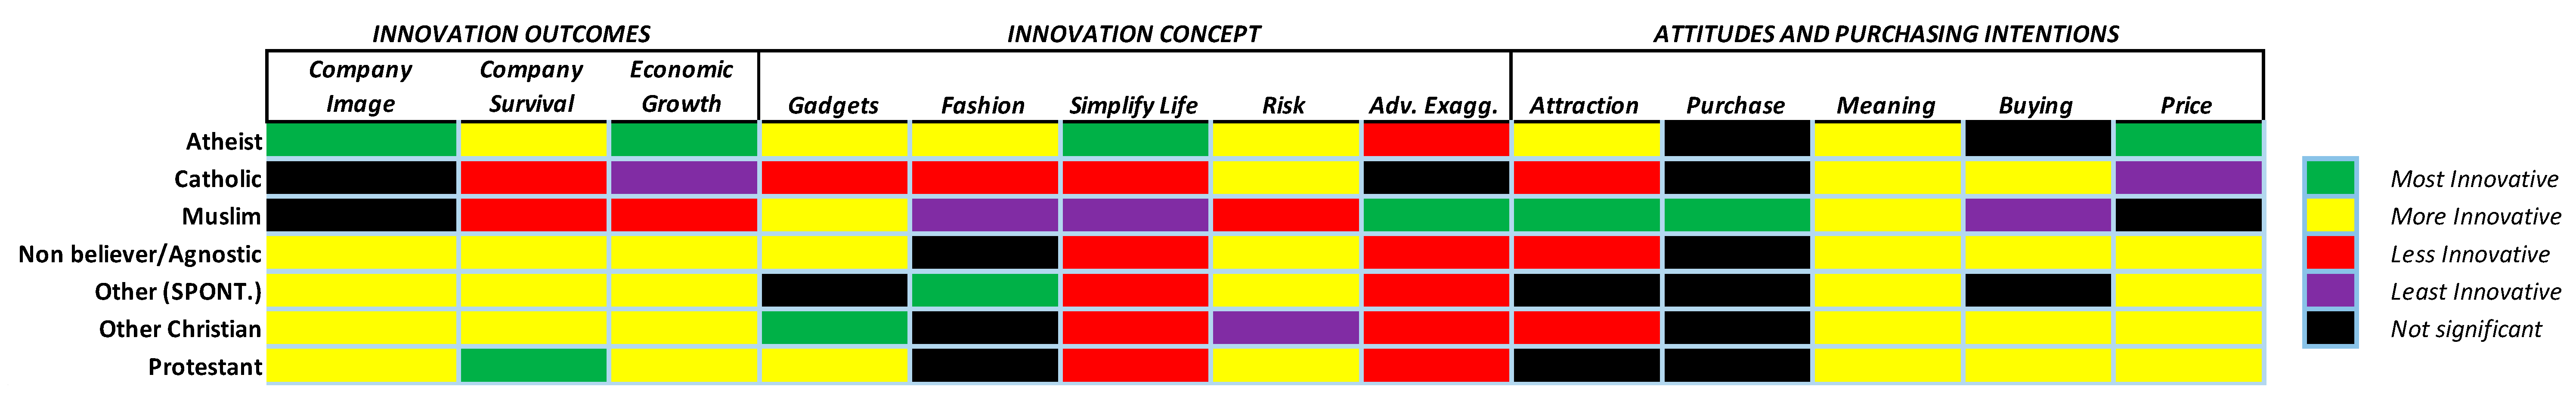
4. Results
4.1. Religion and Innovation Outcomes
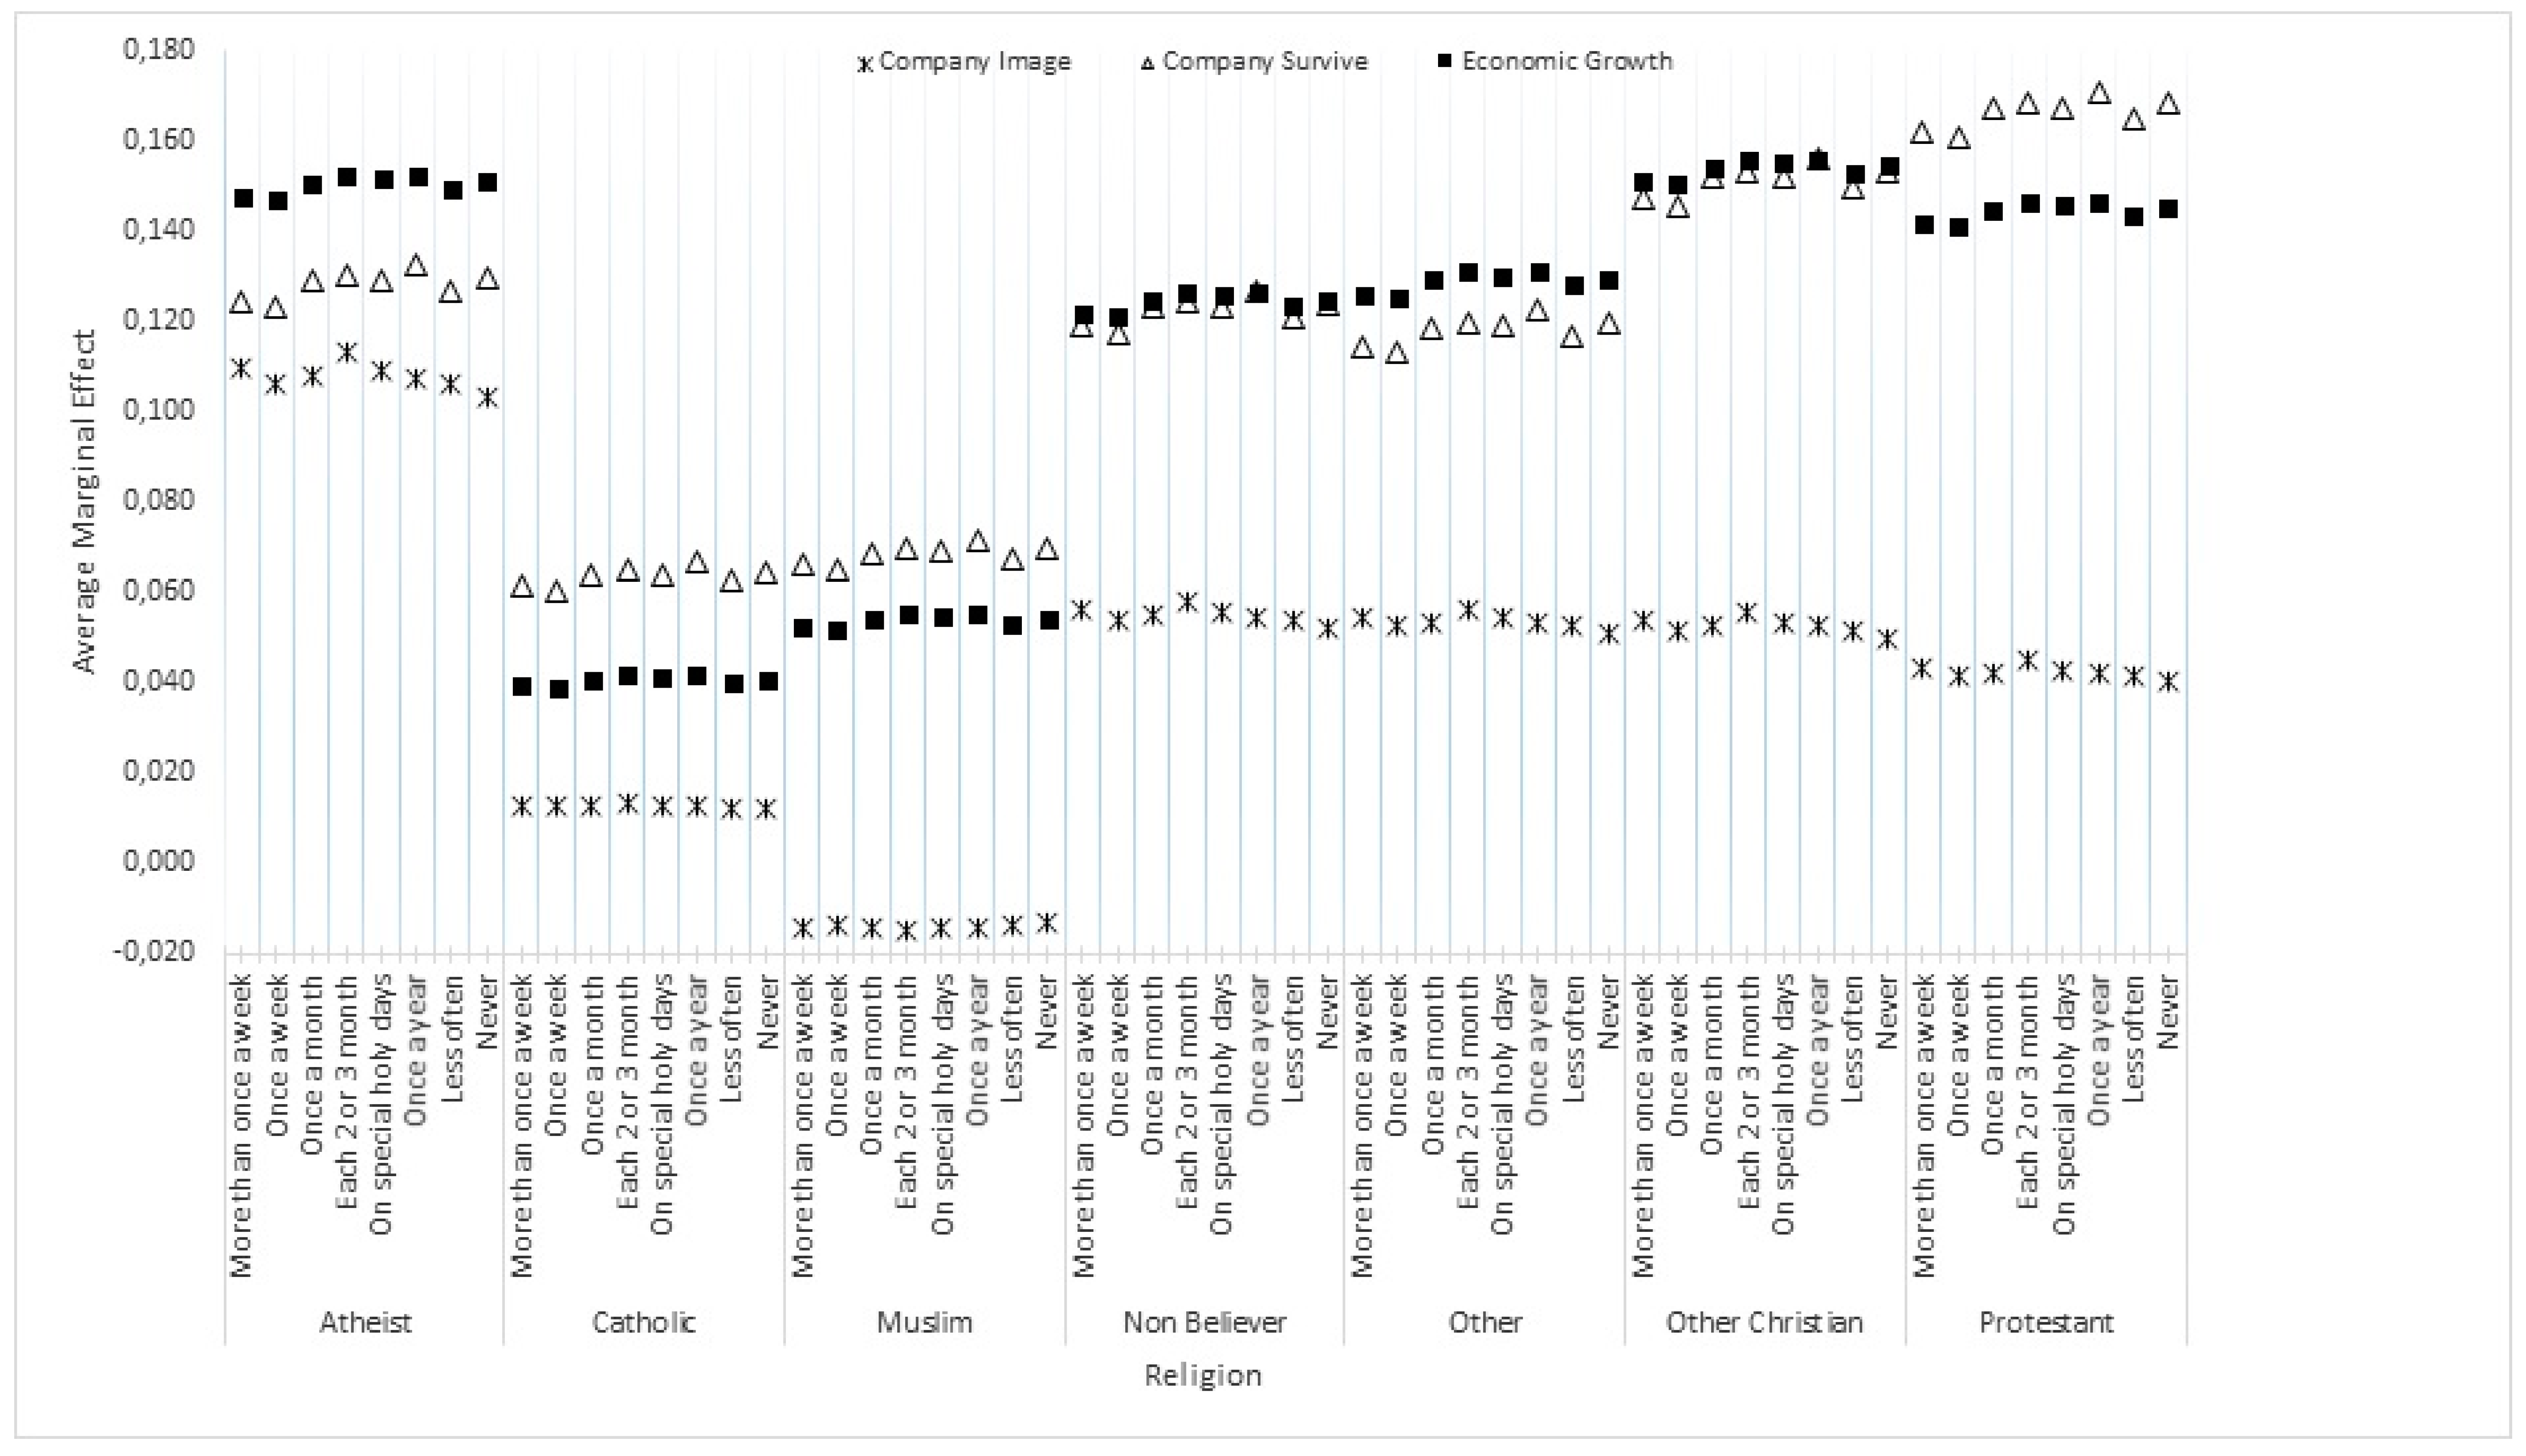
4.2. Innovation Outcomes Marginal Effects
4.3. Religion and Innovative Product and Service Concept
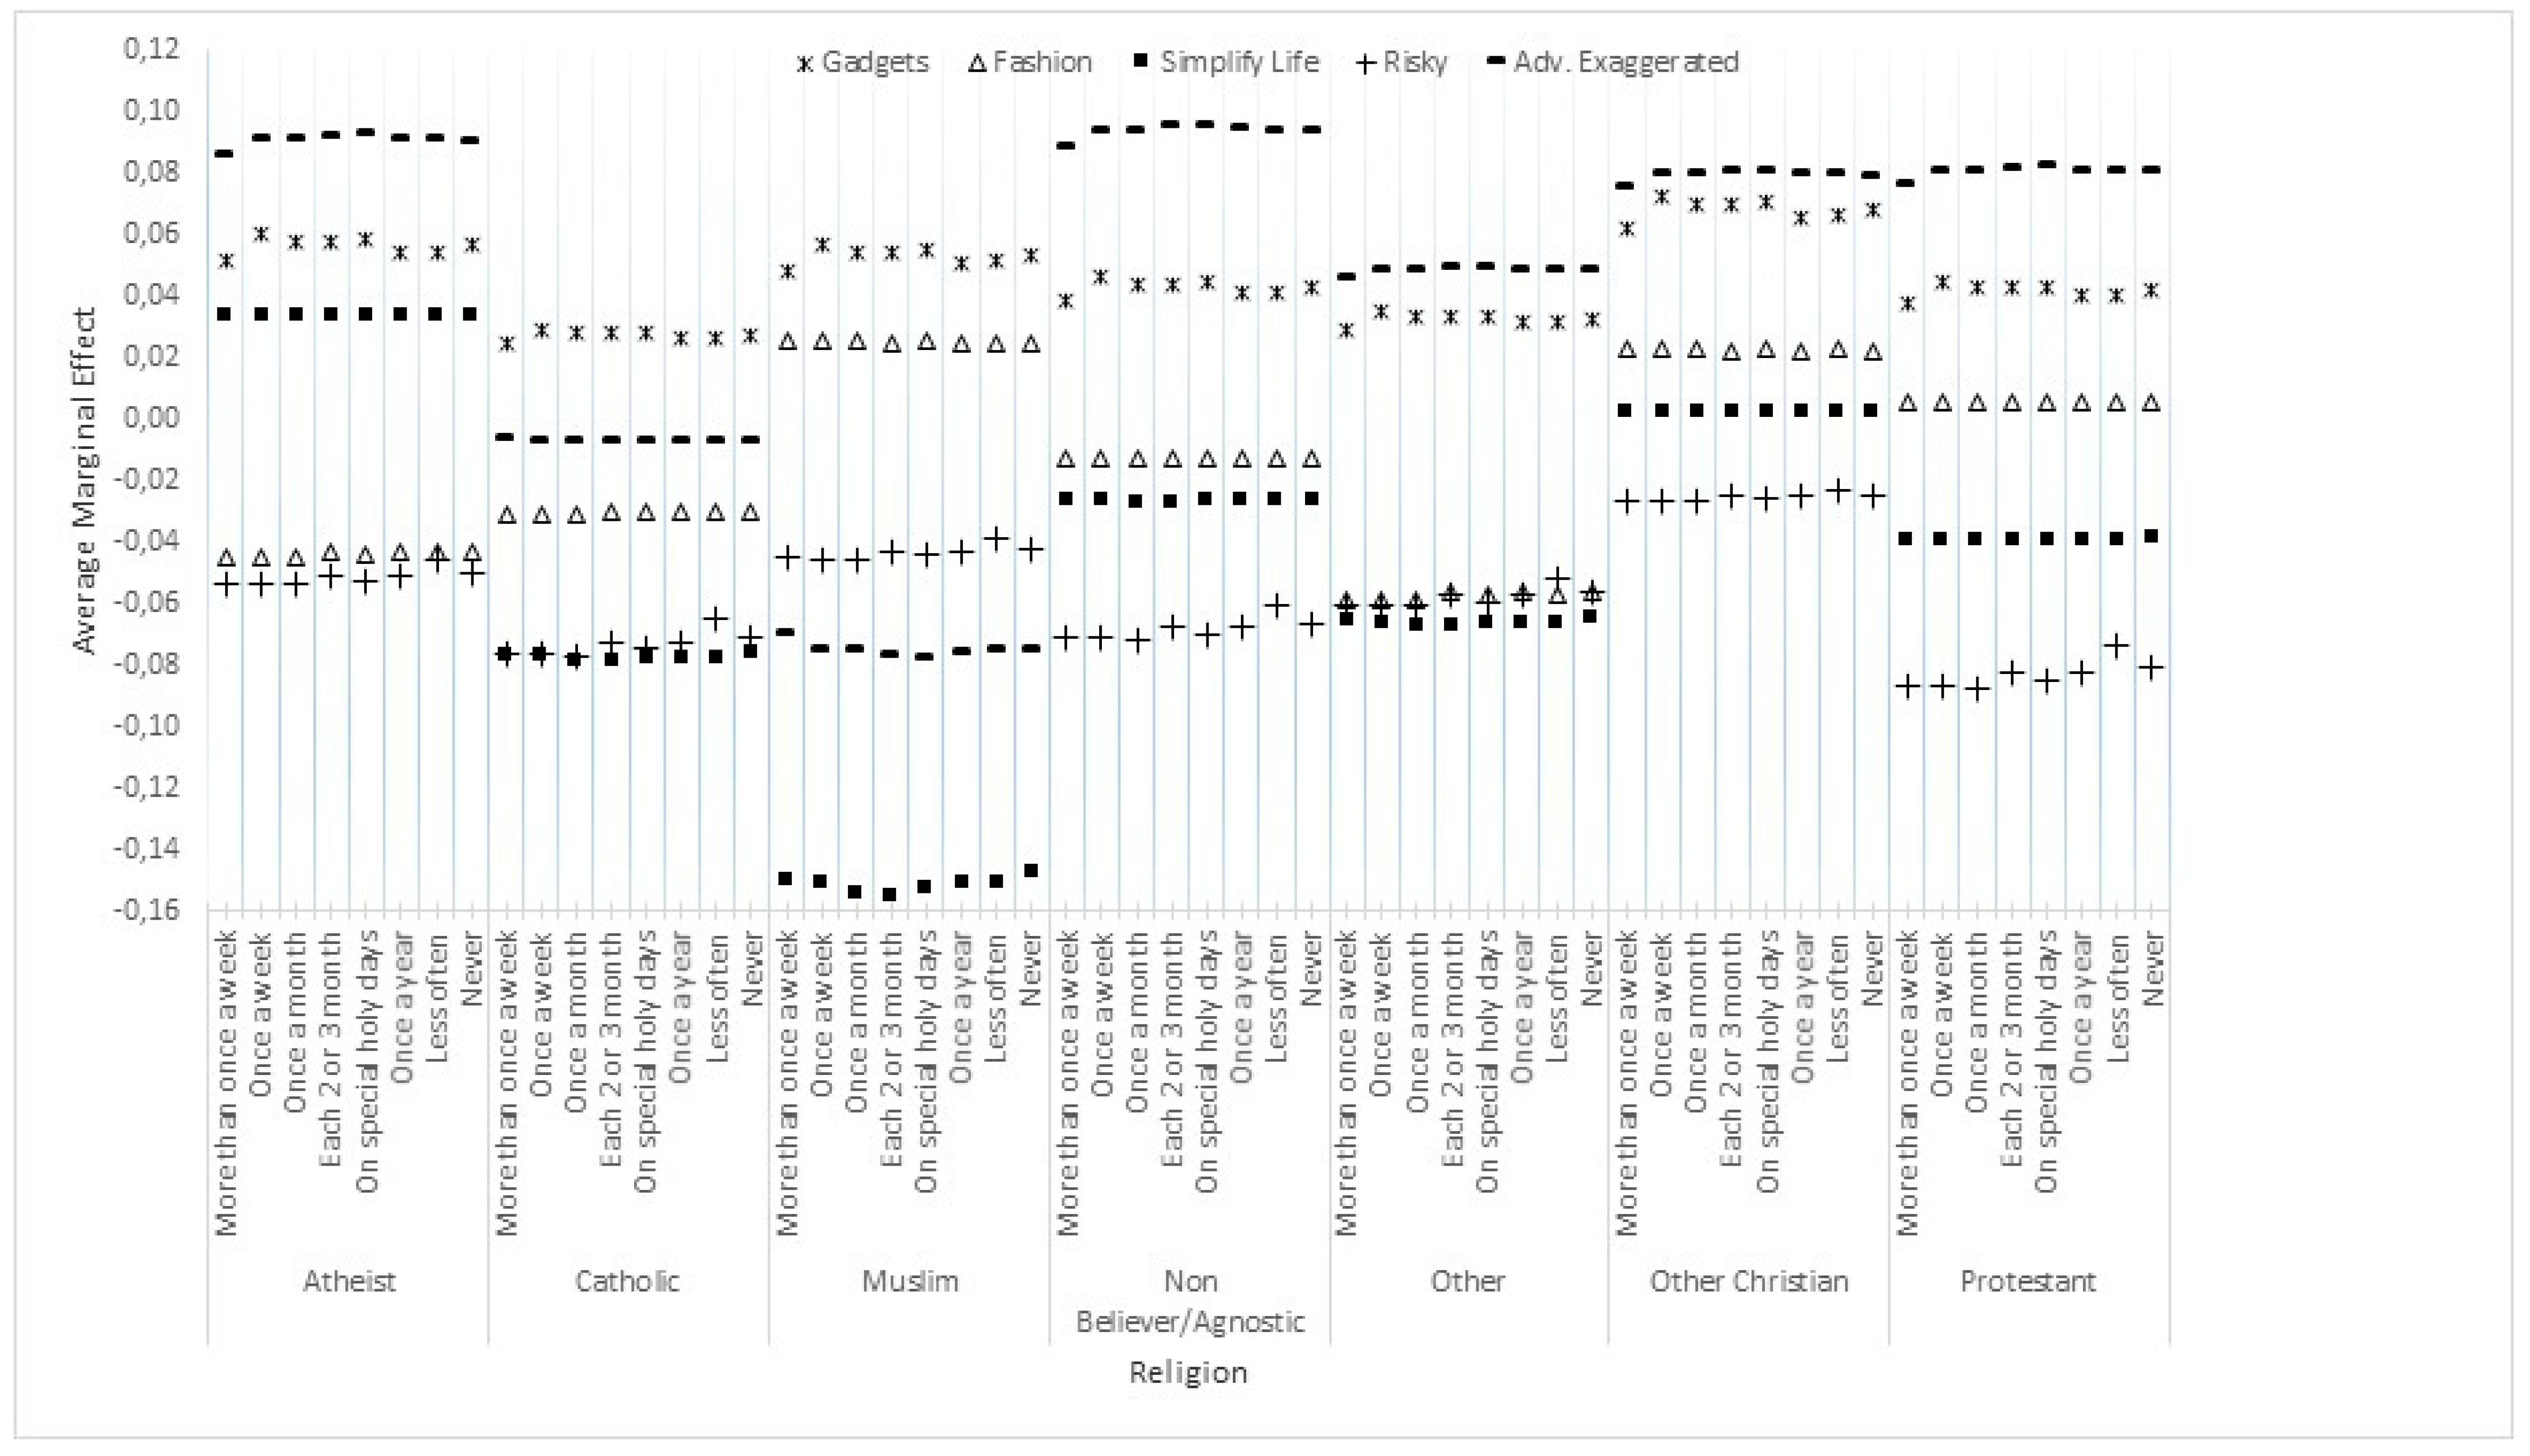
4.4. Innovative Product and Service Concept Marginal Effects
4.5. Attitudes and Purchasing Intentions for Innovative Products
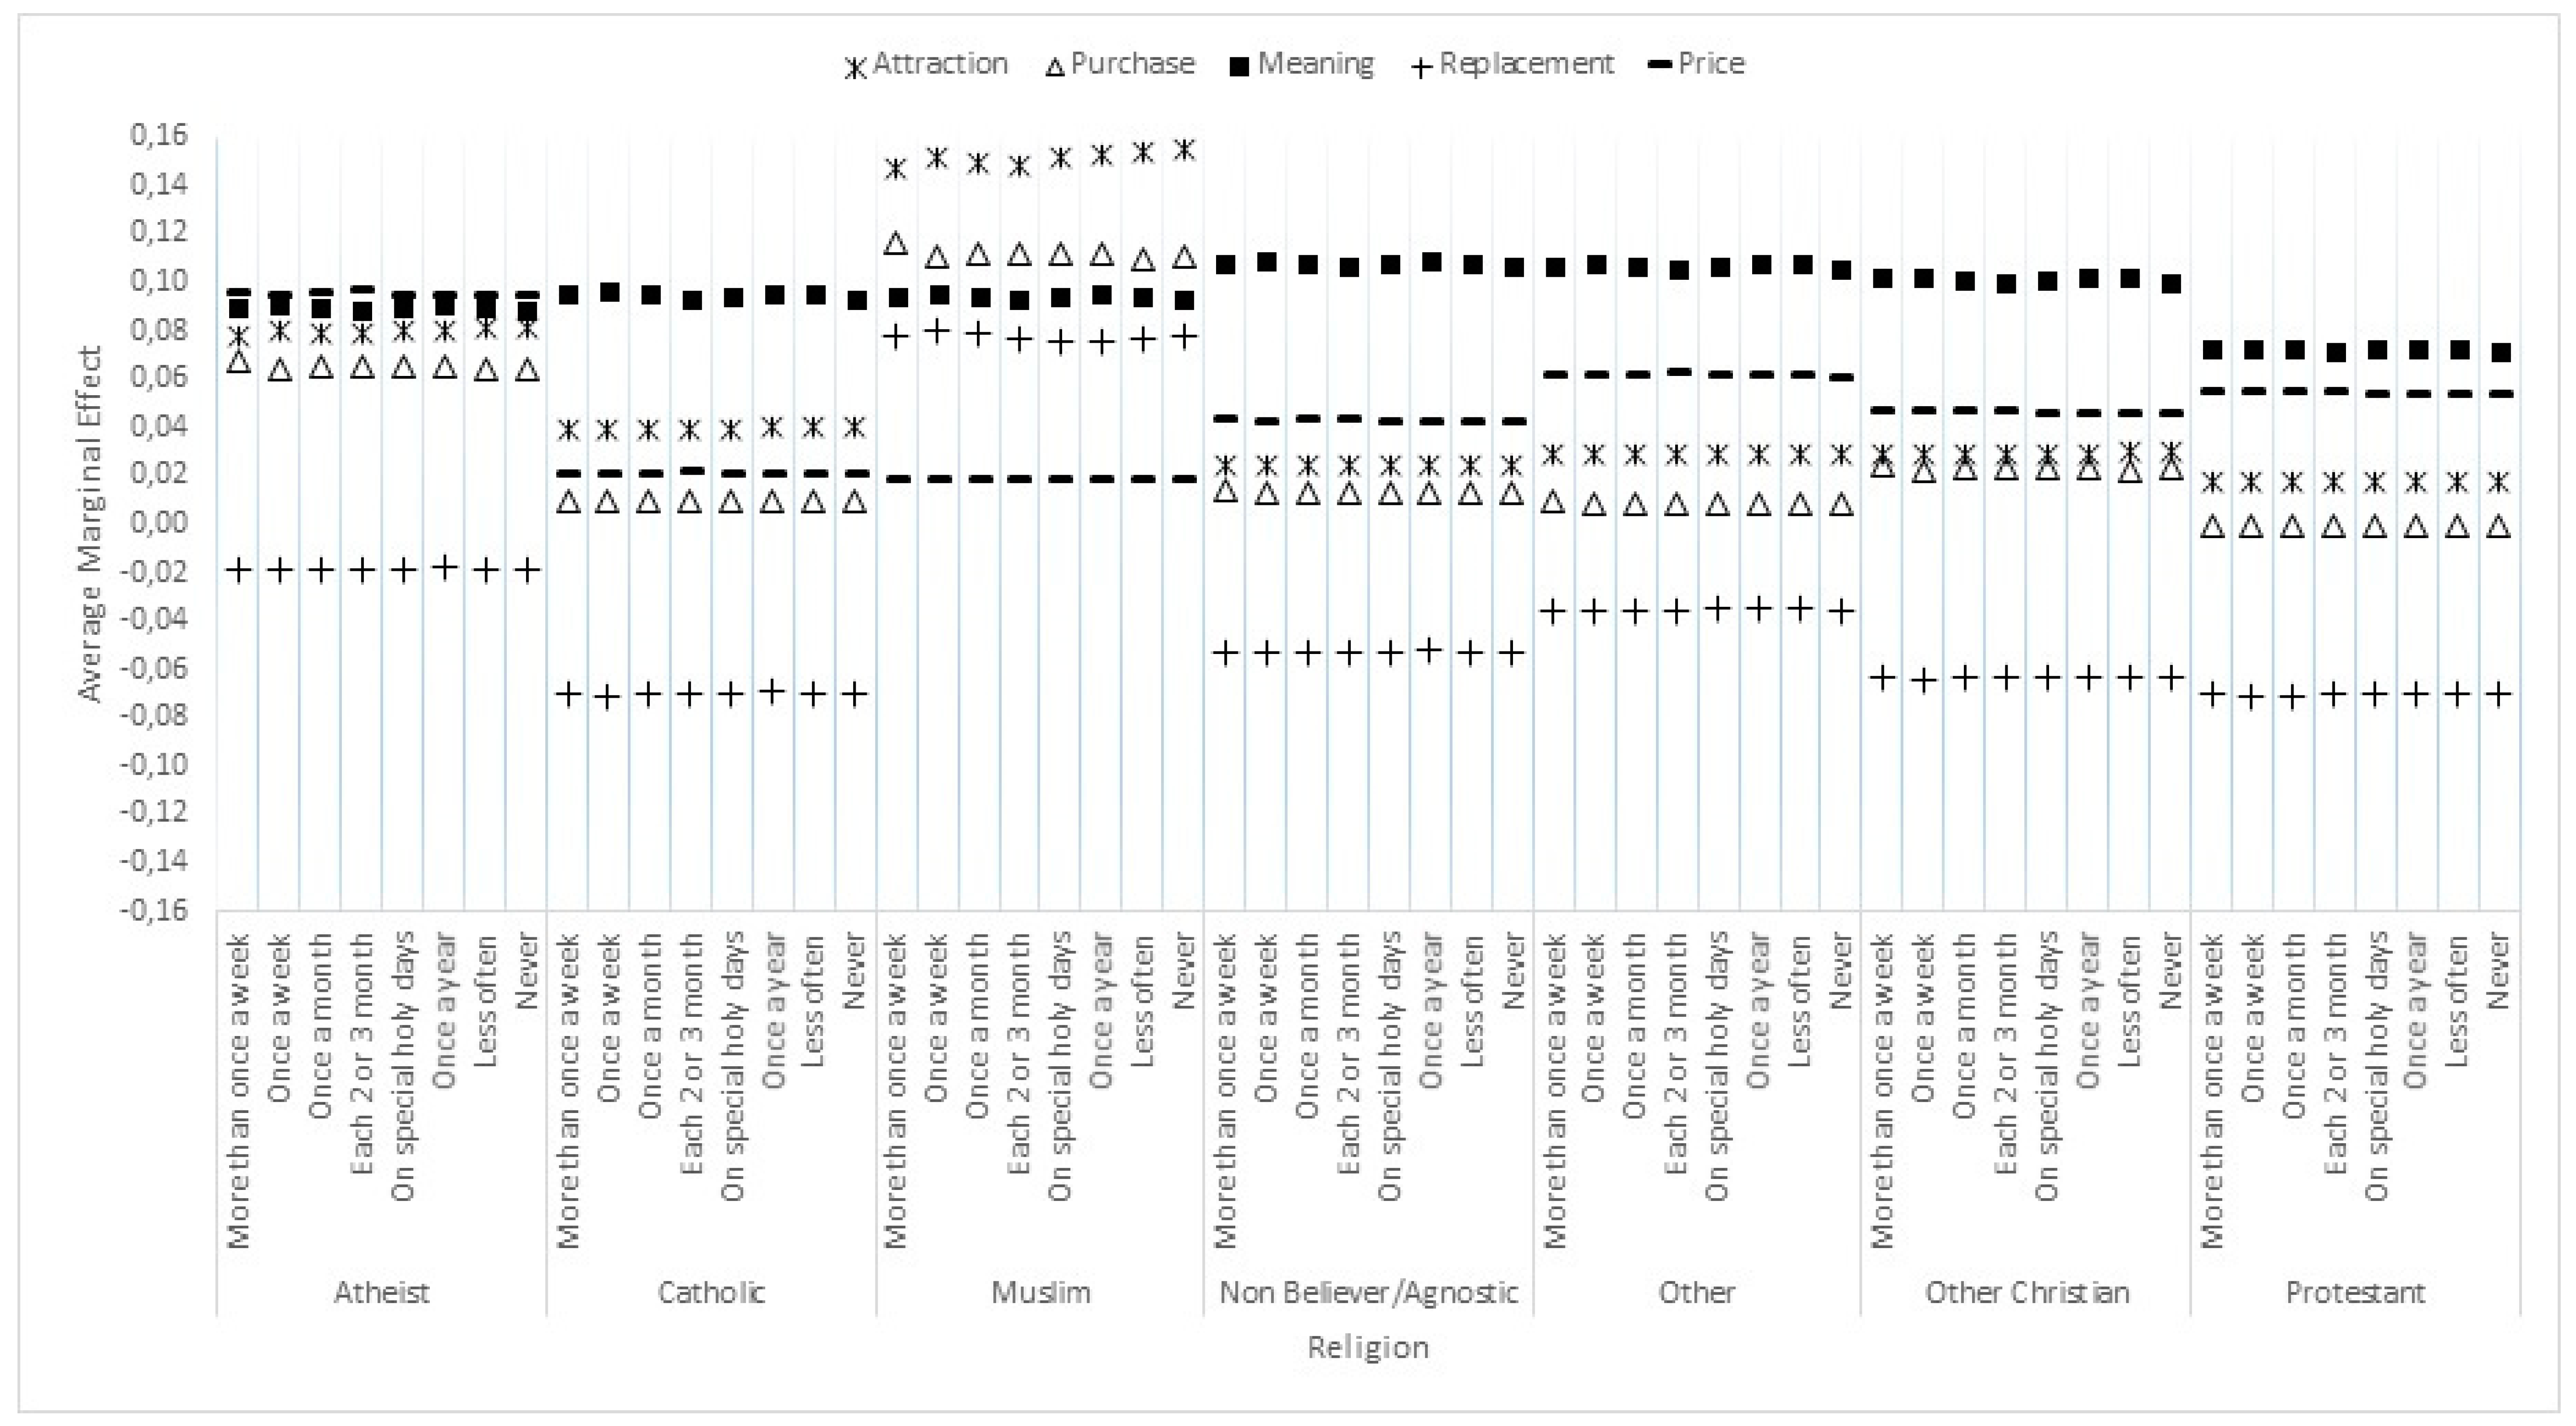
4.6. Attitudes and Purchasing Intentions for Innovative Products Marginal Effects
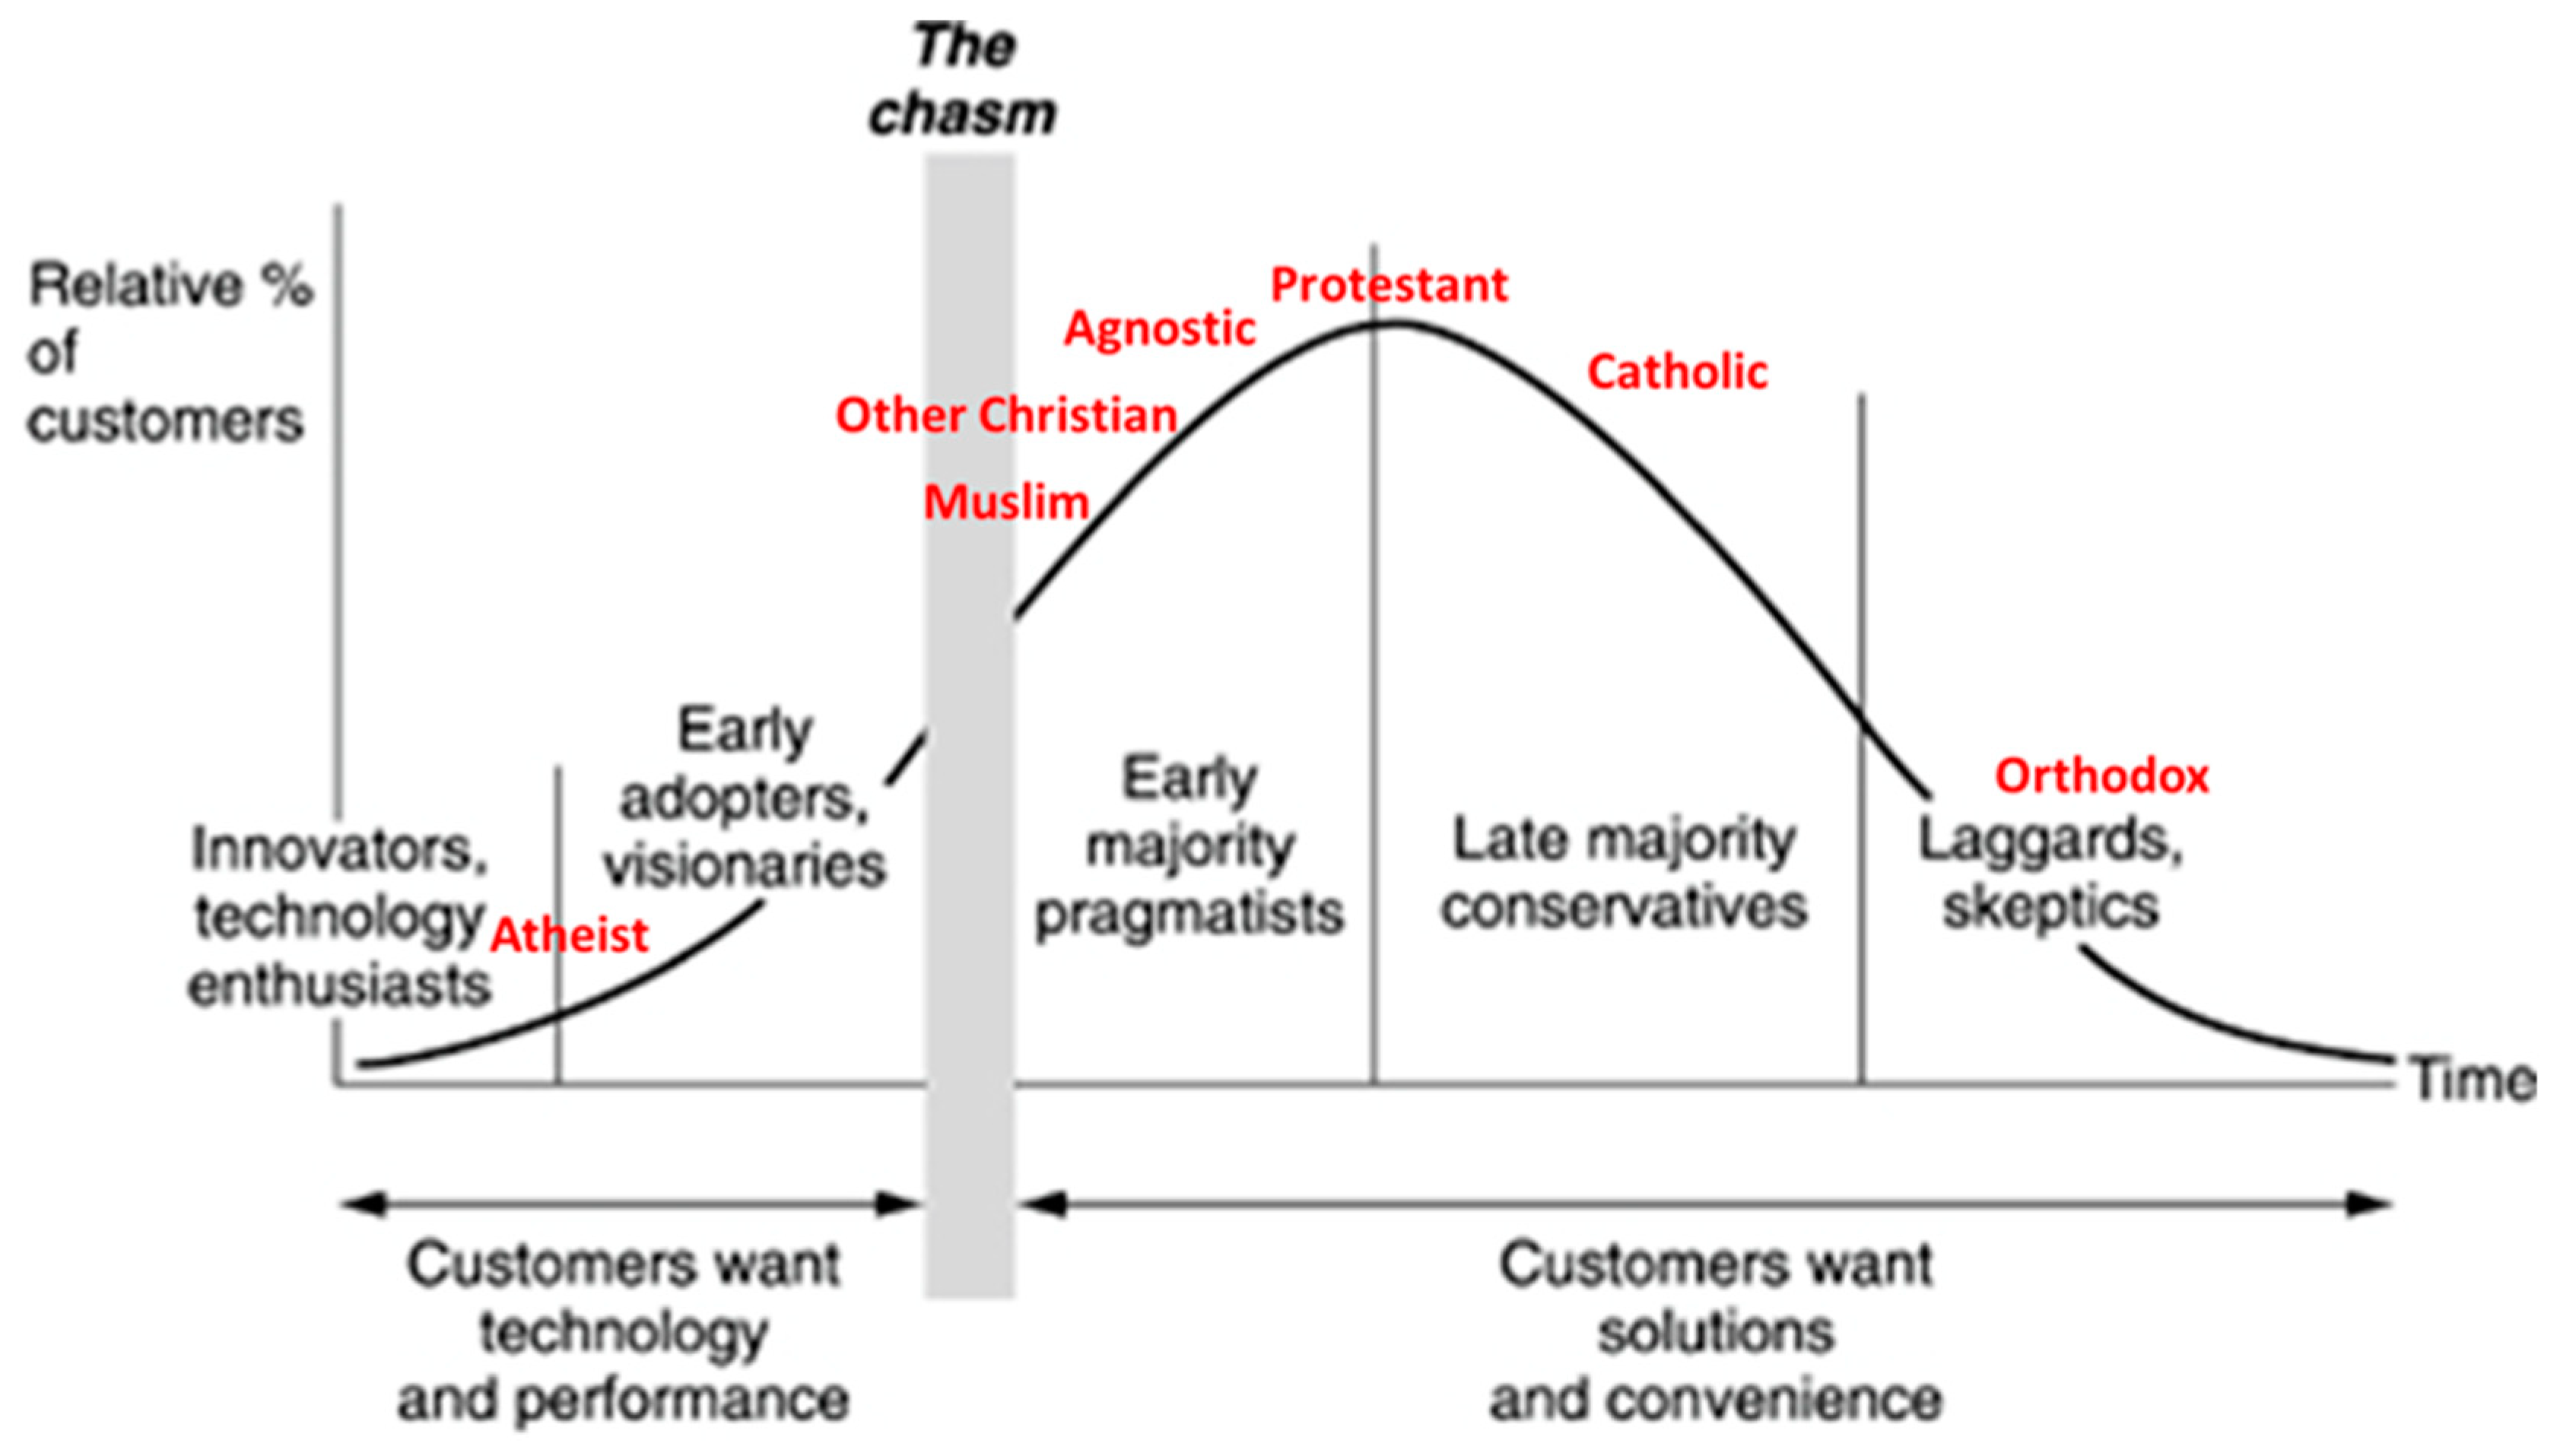
5. Discussion, Implications and Conclusions
Author Contributions
Funding
Conflicts of Interest
References
- Abramitzky, Ran. 2008. The Limits of Equality: Insights from the Israeli Kibbutz. The Quarterly Journal of Economics 123: 1111–59. [Google Scholar] [CrossRef]
- Assouad, Alexander, and K. Praveen Parboteeah. 2018. Religion and Innovation. A Country Institutional Approach. Journal of Management, Spirituality and Religion 15: 20–37. [Google Scholar] [CrossRef]
- Audretsch, David Bruce, Werner Bönte, and Jagannadha Pawan Tamvada. 2007. Religion and Entrepeneurship. Paper Number 6378. Discussion Paper Series; London: CEPR. [Google Scholar]
- Azzi, Corry, and Ronald Ehrenberg. 1975. Household Allocation of Time and Church Attendance. Journal of Political Economy 83: 27–56. [Google Scholar] [CrossRef] [Green Version]
- Barro, Robert Joseph, and Rachel M. McCleary. 2003. Religion and Economic Growth across Countries. American Sociological Review 68: 760–81. [Google Scholar] [CrossRef]
- Bartus, Tamás. 2005. Estimation of Marginal Effects Using Margeff. Stata Journal 5: 309–29. [Google Scholar] [CrossRef]
- Basedau, Matthias, Simone Gobien, and Sebastian Prediger. 2018. The Multidimensional Effects of Religion on Socioeconomic Development: A Review of the Empirical Literature. Journal of Economic Surveys 32: 1106–33. [Google Scholar] [CrossRef]
- Becker, Sascha O., and Ludger Woessmann. 2009. Was Weber Wrong? A Human Capital Theory oF Protestant Economic History. The Quarterly Jounal of Economics 124: 531–96. [Google Scholar] [CrossRef]
- Bénabou, Roland, Davide Ticchi, and Andrea Vindigni. 2015. Moral Values and Economic Behavior: Religion and Innovation. American Economic Review: Papers & Proceedings 105: 346–51. [Google Scholar] [CrossRef]
- Bénabou, Roland, Davide Ticchi, and Andrea Vindigni. 2013. Forbidden Fruits: The Political Economy of Science, Religion, and Growth. NBER Working Paper Series 80. [Google Scholar] [CrossRef]
- Bever, Edward, and Randall Styers. 2017. Magic in the Modern World: Strategies of Repression and Legitimization. Edited by Edward Bever and Randall Styers. Philadelphia: Pennsylvania State University Press. [Google Scholar]
- Brooks, Harvey. 1994. The Relationship between Science and Technology. Research Policy 23: 477–86. [Google Scholar] [CrossRef]
- Bruce, Steve. 1992. Religion and Modernization: Sociologists and Historians Debate the Secularization Thesis. Oxford & New York: Oxford University Press. [Google Scholar]
- Bruce, Steve. 2002. God Is Dead: Secularization in the West. Oxford: Wiley-Blackwell. [Google Scholar]
- Bruce, Steve. 2011. Defining Religion: A Practical Response. International Review of Sociology 21: 107–20. [Google Scholar] [CrossRef]
- Bruce, Steve. 2013. Secularisation: In Defence of an Unfashionable Theory. Oxford: Oxford University Press. [Google Scholar]
- Carpantier, Jean Francois, and Anastasia Litina. 2019. Dissecting the Act of God: An Exploration of the Effect of Religiosity on Economic Activity. B.E. Journal of Macroeconomics 19: 1–26. [Google Scholar] [CrossRef]
- Cavalcanti, Tiago V., Stephen L. Parente, and Rui Zhao. 2007. Religion in Macroeconomics: A Quantitative Analysis of Weber’s Thesis. Economic Theory 32: 105–23. [Google Scholar] [CrossRef]
- Center for Religion Studies. Fondazione Bruno Kessler. 2018. Religion and Innovation. Calibrating Research Approaches and Suggesting Strategies for a Fruitful Interaction. Lavis: Esperia. [Google Scholar]
- Cooper, Zaki, and Martha Patrick-Morsman. 2019. Why Many of Us Still Have Faith in Religion in This Scientific Age. The Guardian. Available online: https://www.theguardian.com/world/2019/jul/12/why-many-of-us-still-have-faith-in-religion-in-this-scientific-age (accessed on 17 October 2019).
- Crippen, Timothy. 1988. Old and New Gods in the Modern World: Toward a Theory of Religious Transformation. Social Forces 67: 316–36. [Google Scholar] [CrossRef]
- Damm, Darlene, Rob Nail, and Adam Hofmann. 2019. The State of the Global Grand Challenges 2019. Edited by Merry Richter and Leslie O’Neill. Santa Clara: Singularity University. [Google Scholar]
- Davie, Grace. 2002. Europe: The Exceptional Case. Parameters of Faith in the Modern World. London: Darton, Longman & Todd. [Google Scholar]
- Davis, Erik. 2017. Babalon Launching: Jack Parsons, Rocketry, and the ‘Method of Science’. In Magic in the Modern World: Strategies of Repression and Legitimization. Edited by Edward Bever and Randall Styers. Philadelphia: The Pennsylvania University Press, pp. 119–46. [Google Scholar]
- de Zwart, Frank. 2015. Unintended but Not Unanticipated Consequences. Theory and Society 44: 283–97. [Google Scholar] [CrossRef]
- Durkheim, Émile. 1925. Les Formes Élémentaires de La Vie Religieuse. Paris: Alcan. [Google Scholar]
- Durkheim, Émile. 1926. De La Division Du Travail Social. Paris: Félix Alcan. [Google Scholar]
- Eisenstadt, Shmuel Noah. 1968. The Protestant Ethic and Modernization: A Comparative View. New York: Basic Books. [Google Scholar]
- European Commission. 2009. Responsible Research & Innovation. H2020. Available online: https://ec.europa.eu/programmes/horizon2020/en/h2020-section/responsible-research-innovation (accessed on 17 October 2019).
- European Commission. 2015. State of the Innovation Union 2015. Luxembourg: Publications Office of the European Union. [Google Scholar]
- European Communities. 2005. Eurobarometer 63.4. Basic Bilingual Questionnaire Tns Opinion & Social. Luxembourg: European Communities. [Google Scholar]
- Findlen, Paula, and Hannah Marcus. 2012. Science under Inquisition: Heresy and Knowledge in Catholic Reformation Rome. Isis 103: 376–82. [Google Scholar] [CrossRef]
- Finke, Roger. 2013. Presidential Address: Origins and Consequences of Religious Freedoms: A Global Overview. Sociology of Religion: A Quarterly Review 74: 297–313. [Google Scholar] [CrossRef]
- Finke, Roger, and Rodney Stark. 1988. Religious Economies and Sacred Canopies: Religious Mobilization in American Cities, 1906. American Sociological Review 53: 41. [Google Scholar] [CrossRef] [Green Version]
- Gellner, Ernest. 1992. Postmodernism, Reason and Religion. London: Routledge. [Google Scholar]
- Guiso, Luigi, Paola Sapienza, and Luigi Zingales. 2003. People’s Opium? Religion and Economic Attitudes. Journal of Monetary Economics 50: 225–82. [Google Scholar] [CrossRef]
- Hackett, Conrad, Brian J. Grim, Marcin Stonawski, Vegard Skirbekk, Michaela Potančoková, and Phillip Connor. 2012. The Global Religious Landscape. Washington, DC: Pew Research Center. [Google Scholar] [CrossRef]
- Hair, Joseph F., William C. Black, Barry J. Babin, and Rolph E. Anderson. 2014. Multivariate Data Analysis, 7th ed.Essex: Pearson Education Limited. [Google Scholar]
- Huang, Dan, Dong Lu, and Jin Hui Luo. 2016. Corporate Innovation and Innovation Efficiency: Does Religion Matter? Nankai Business Review International 7: 150–91. [Google Scholar] [CrossRef]
- Hungerman, Daniel. 2005. Are Church and State Substitutes? Evidence from the 1996 Welfare Reform. Journal of Public Economics 89: 2245–67. [Google Scholar] [CrossRef]
- Iannaccone, Laurence. 1992. Sacrifice and Stigma: Reducing Free-Riding in Cults, Communes, and Other Collectives. Journal of Political Economy 100: 271–91. [Google Scholar] [CrossRef]
- Iannaccone, Laurence. 1998. Introduction to the Economics of Religion. Journal of Economic Literature 36: 1465–95. [Google Scholar]
- Iannaccone, Laurence. 2006. The Market for Martyrs. Interdisciplinary Journal of Research on Religion 2: 1–29. [Google Scholar]
- Iyer, Sriya. 2016. The New Economics of Religion. Journal of Economic Literature 54: 395–441. [Google Scholar] [CrossRef] [Green Version]
- Lazarus, Suleman. 2019. Where Is the Money? The Intersectionality of the Spirit World and the Acquisition of Wealth. Religions 10: 146. [Google Scholar] [CrossRef] [Green Version]
- Levy, Gilat, and Ronny Razin. 2012. Religious Beliefs, Religious Participation, and Cooperation. American Economic Journal Microeconomics 4: 121–51. [Google Scholar] [CrossRef]
- Liu, Zhen, Qingke Guo, Peng Sun, Zhao Wang, and Rui Wu. 2018. Does Religion Hinder Creativity? A National Level Study on the Roles of Religiosity and Different Denominations. Frontiers in Psychology, 1–12. [Google Scholar] [CrossRef]
- Manyika, James, Michael Chui, Jacques Bughin, Richard Dobbs, Peter Bisson, and Marrs. 2013. Disruptive Technologies: Advances That Will Transform Life, Business, and the Global Economy; McKinsey Global Insitute, May. Available online: http://www.mckinsey.com/insights/business_technology/disruptive_technologies%5Cnhttp://www.chrysalixevc.com/pdfs/mckinsey_may2013.pdf (accessed on 17 October 2019).
- Marx, Karl. 1843. Critique of Hegel’s Philosophy of Right. Cambridge: Cambridge University Press. [Google Scholar]
- Marx, Karl, and N I Stone. 2014. A Contribution to the Critique of Political Economy. Chicago: Charles H. Kerr & Company, (The Project Gutemberg EBook). [Google Scholar]
- McBride, Michael. 2010. Religious Market Competition in a Richer World. Economica 77: 148–71. [Google Scholar] [CrossRef]
- McCleary, Rachel M. 2011. The Economics of Religion as a Field of Inquiry. In THe Oxford Handbook of the Economics of Religion. New York: Oxford University Press. [Google Scholar]
- McCleary, Rachel M., and Robert Joseph Barro. 2019. The Wealth of Religions. The Political Economy of Believing and Belonging. Princeton & Oxford: Princeton University Press. [Google Scholar]
- Michalopoulos, Stelios, Alireza Naghavi, and Giovanni Prarolo. 2016. Islam, Inequality and Pre-Industrial Comparative Development. Journal of Development Economics 120: 86–98. [Google Scholar] [CrossRef]
- Milanovic, Branco. 2012. Globalization and Inequality. In The Globalization of the World Economy. Edited by Mark Casson. Cheltenham and Northampton: Edward Elgar Publishing Limited. [Google Scholar] [Green Version]
- Montgomery, James Douglas. 2003. A Formalization and Test of the Religious Economies Model. American Sociological Review 68: 782. [Google Scholar] [CrossRef]
- Mulgan, Geoff. 2016. Good and Bad Innovation: What Kind of Theory and Practice Do We Need to Distinguish Them? London: Nesta. [Google Scholar]
- Niilola, Ian. 2017. Unanticipated and Undesirable Consequences of Technology in Management Research. Helsinki: Hanken School of Economics. [Google Scholar]
- Niilola, Ian. 2018. Unanticipated and Undesirable Consequences of Innovation. Available online: https://www.viima.com/blog/unanticipated-and-undesirable-consequences-of-innovation#concepts (accessed on 17 October 2019).
- Norman, Donald A. 1998. The invisible computer: Why Good Products Can Fail, the Personal Computer Is So Complex, and Information Appliances Are the Solution. Cambridge, MA: MIT Press. [Google Scholar]
- Norris, Pippa, and Ronald Inglehart. 2011. Sacred and Secular: Religion and Politics Worldwide, 2nd ed. Cambridge: Cambridge University Press. [Google Scholar]
- Noussair, Charles N, Stefan T. Trautmann, Gijs van de Kuilen, and Nathanael Vellekoop. 2013. Risk Aversion and Religion. Journal of Risk and Uncertainty. [Google Scholar] [CrossRef]
- OECD. 2015. The Innovation Imperative: Contributing to Productivity, Growth and Well-Being. Paris: OECD Publishing. [Google Scholar]
- Pals, D. L. 2006. Eight Theories of Religions. New York & Oxford: Oxford University Press. [Google Scholar]
- Parboteeah, K. Praveen, Sascha G. Walter, and Jörn H. Block. 2015. When Does Christian Religion Matter for Entrepreneurial Activity? The Contingent Effect of a Country’s Investments into Knowledge. Journal of Business Ethics 130. [Google Scholar] [CrossRef]
- Peifer, Jared L., David R. Johnson, and Elaine Howard Ecklund. 2019. The Moral Limits of the Market: Science Commercialization and Religious Traditions. Journal of Business Ethics 157: 183–97. [Google Scholar] [CrossRef]
- Pew Research Center Religion and Public Life. 2015. The Future of World Religions: Population Growth Projections, 2010–2050. Washington, DC: Pew Research Center, Available online: http://www.pewforum.org/2015/04/02/religious-projections-2010-2050/ (accessed on 17 October 2019).
- Rogers, Everett M. 1995. Diffusion of Innovations. New York: The Free Press. [Google Scholar]
- Rotman, David. 2013. How Technology Is Destroying Jobs. MIT Technology Review 116: 27–35. [Google Scholar]
- Rubin, Jared. 2011. Institutions, the Rise of Commerce and the Persistence of Laws: Interest Restrictions in Islam and Christianity. Economic Journal 121: 1310–39. [Google Scholar] [CrossRef]
- SAS. 2018. Computing Marginal Effects for Discrete Dependent Variable Models. Available online: https://support.sas.com/rnd/app/ets/examples/margeff/index.html (accessed on 17 October 2019).
- Sherkat, Darren E. 2017. Religion, Politics, and Americans’ Confidence in Science. Politics and Religion 10: 137–60. [Google Scholar] [CrossRef]
- Simpson, J.A., E.S.C. Weiner, and Oxford University Press. 1989. The Oxford English Dictionary. Oxford: Clarendon Press. [Google Scholar]
- Smith, Adam. 1776. An Inquiry Into the Nature and Causes of the Wealth of Nations. Edited by A. L. Macfie and D. D. Raphael. Indianapolis: Liberty Press. [Google Scholar]
- Stark, Rodney. 1992. Do Catholic Societies Really Exist? Rationality and Society 4: 261–71. [Google Scholar] [CrossRef]
- Stark, Rodney. 1999. Secularization, R.I.P. Sociology of Religion 60: 249–74. [Google Scholar] [CrossRef]
- Stark, Rodney, Laurence R. Iannaccone, and Roger Finke. 1996. Religion, Science, and Rationality. The American Economic Review 86: 433–37. [Google Scholar]
- The Economist. 2013. Has the Ideas Machine Broken-Down? The Economist, January 12. [Google Scholar]
- The Economist. 2019. The Climate Issue —A Warming World. The Economist. Available online: https://www.economist.com/leaders/2019/09/19/the-climate-issue. (accessed on 17 October 2019).
- Weber, Max. 1930. The Protestant Ethic and the Spirit of Capitalism. London & New York: Rouletge. [Google Scholar]
- Weber, Max. 1946. Science as a Vocation. In From Max Weber: Essays in Sociology. Edited by H.H. Gerth and C. Wright Mills. New York: Oxford University Press, pp. 139–54. [Google Scholar]
- Weber, Max. 1978. Economy and Society. Berkeley & Los Angeles: University of California Press. [Google Scholar]
- Yerxa, Donald A. 2016. Religion and Innovation. Antagonists or Partners? London & New York: Bloomsbury Publishing. [Google Scholar]
- Zielińska, Katarzyna. 2013. Concepts of Religion in Debates on Secularization. Approaching Religion 3: 25–35. [Google Scholar] [CrossRef]
| 1 | Countries under study were those with information about number of patents filed by both residents and foreigners in the World Intellectual Policy Organization (WIPO) database for the years 1980, 1990, 1995 and 2000. For more details see Bénabou et al. (2013). |
| 2 | In order to decide which variables to include and which categories to delete, we ran an exploratory analysis using the MOSAIC technique included in the STRUCTPLOT FRAMEWORK developed in R software. Minor Religions in Europe—Jews, Buddhists, Hindus and Sikhs—and people that spontaneously manifest belonging to a different religion, do not show any remarkable pattern in their standardized residuals analysis. There are few observations in the sample to obtain significant statistical results in all the analysis that we run. Hence, we decided not to consider them for analysis. |

| Country | Number of Interviews | Population 15+ |
|---|---|---|
| Austria | 1.000 | 6679.444 |
| Belgium | 1.000 | 8508.982 |
| Bulgaria | 1.018 | 6695.512 |
| Croatia | 1.000 | 3682.826 |
| Czech Republic | 1.083 | 8757.710 |
| Denmark | 1.051 | 4380.063 |
| Estonia | 1.001 | 8867.094 |
| Finland | 1.024 | 4279.286 |
| France | 1.012 | 44,010.619 |
| Germany | 1.520 | 64,174.295 |
| Greece | 1.000 | 8674.230 |
| Hungary | 1.014 | 8503.379 |
| Ireland | 1.006 | 3089.775 |
| Italy | 1.004 | 49,208.000 |
| Latvia | 1.015 | 1394.351 |
| Lithuani | 1.003 | 2803.661 |
| Luxemburg | 504 | 367.199 |
| Malta | 500 | 322.917 |
| The Netherlands | 1.006 | 13,242.328 |
| North part of Cyprus | 500 | 157.101 |
| Poland | 1.000 | 31,610.437 |
| Portugal | 1.005 | 8080.915 |
| Republic of Cyprus | 505 | 552.213 |
| Romania | 1.004 | 18,145.036 |
| Slovakia | 1.108 | 4316.438 |
| Slovenia | 1.045 | 1663.869 |
| Spain | 1.024 | 35,882.820 |
| Sweden | 1.024 | 7376.680 |
| Turkey | 1.005 | 47,583.830 |
| United Kingdom | 1.347 | 47,685.578 |
| Total | 29.328 | 442,620.588 |
| Religion | Number of Interviews | Percent | Pew Research Percent Estimation | |
|---|---|---|---|---|
| Christians | Catholic | 13.191 | 45 | 74.5 |
| Orthodox | 3.719 | 12.7 | ||
| Protestant | 4.100 | 14 | ||
| Other Christian | 1.063 | 3.6 | ||
| Jewish | 25 | 0.1 | 0.2 | |
| Muslim | 1.747 | 6 | 5.9 | |
| Sikh | 8 | 0 | - | |
| Buddhist | 41 | 0.1 | 0.2 | |
| Hindu | 16 | 0.1 | 0.2 | |
| Atheist | 1.316 | 4.5 | 18.8 | |
| Non believer /agnostic | 3.253 | 11.1 | ||
| Other (SPONT.) | 415 | 1.4 | - | |
| Do not know (DK) | 434 | 1.5 | - | |
| Total | 29.328 | 100 | 100 | |
| Variable | Categories (Original Scale) | n (Original Sample) | Orginal Sample Share | Categories (Analysis) | n (Analysis) | Final Analysis Sample Share | Operationalization | Value | Question |
|---|---|---|---|---|---|---|---|---|---|
| Attitudes and purchasing behavior towards innovation (dependent variables) | |||||||||
| 1. Attraction | Very Attracted | 3.825 | 13.0 | Attracted | 16.554 | 59.0 | 1 | In general, to what extent are you attracted towards innovative products or services, in other words new or improved products or services? | |
| Fairly attracted | 12.729 | 43.4 | Not ATTRACTED | 11.485 | 41.0 | Reference category | 0 | ||
| Not very attracted | 8.131 | 27.7 | |||||||
| Not at all attracted | 3.354 | 11.4 | |||||||
| DK (missing) | 1.289 | 4.4 | |||||||
| 2. Purchase | More inclined to purchase | 7.745 | 26.4 | More inclined to purchase | 7.745 | 28.4 | 1 | Compared to your friends and family, would you say that you tend to be…? | |
| Less inclined to purchase | 11.919 | 40.6 | As or less inclined to purchase | 19.544 | 71.6 | Reference category | 0 | ||
| As inclined to purchase | 7.625 | 26.0 | |||||||
| DK (missing) | 2.039 | 7.0 | |||||||
| 3. Meaning | The creation of new products and services | 14.893 | 50.8 | The creation of new products and services | 14.893 | 56.7 | 1 | What does “innovation” mean for you? The creation of new products or services or the improvement of existing products or services? | |
| The improvement of existing products and services | 11.395 | 38.9 | The improvement of existing products and services | 11.395 | 43.3 | Reference category | 0 | ||
| DK (missing) | 3.040 | 10.4 | |||||||
| 4. Buy | Do not try the innovative one. | 12.736 | 43.4 | Do not try the innovative one. | 12.736 | 47,4 | Reference category | 0 | In general, when an innovative product or service is put on the market and can replace a product or service that you already trust…? |
| Try the innovative product | 14.128 | 48.2 | Try the innovative product | 14.128 | 52.6 | 1 | |||
| DK (missing) | 2.464 | 8.4 | |||||||
| 5. Price | Even if more expensive. | 1.881 | 6.4 | Even if more expensive | 10.821 | 40.0 | 1 | You would be willing to replace a product or a service that you already use by an innovative one … | |
| Only if little more expensive. | 8.940 | 30.5 | Never or only if cost the same | 16.204 | 60.0 | Reference category | 0 | ||
| Only if cost the same. | 13.232 | 45.1 | |||||||
| Never purchase | 2.972 | 10.1 | |||||||
| DK (missing) | 2.303 | 7.9 | |||||||
| 6. Gadgets | Mentioned | 23.573 | 80.4 | Mentioned | 23.573 | 80.4 | 1 | Innovative products or services are most of the time gadgets | |
| Not mentioned | 5.755 | 19.6 | Not mentioned | 5.755 | 19.6 | Reference category | 0 | ||
| 7. Fashion | Mentioned | 20.569 | 70.1 | Mentioned | 20.569 | 70.1 | 1 | Innovative products or services are a matter of fashion | |
| Not mentioned | 8.759 | 29.9 | Not mentioned | 8.759 | 29.9 | Reference category | 0 | ||
| 8. Simplify | Mentioned | 17.288 | 58.9 | Mentioned | 17.288 | 58.9 | 1 | Innovative products or services often simplify everyday life | |
| Not mentioned | 12.040 | 41.1 | Not mentioned | 12.040 | 41.1 | Reference category | 0 | ||
| 9. Image | Mentioned | 20.937 | 71.4 | Mentioned | 20.937 | 71.4 | 1 | A company that sells an innovative product or service improves the image of all its products or services | |
| Not mentioned | 8.391 | 28.6 | Not mentioned | 8.391 | 28.6 | Reference category | 0 | ||
| 10. Survive | Mentioned | 17.676 | 60.3 | Mentioned | 17.676 | 60.3 | 1 | A company which does not innovate is a company that will not survive | |
| Not mentioned | 11.652 | 39.7 | Not mentioned | 11.652 | 39.7 | Reference category | 0 | ||
| 11. Risky | Mentioned | 24.498 | 83.5 | Mentioned | 24.498 | 83.5 | 1 | Purchasing an innovative product or service is risky for the consumer | |
| Not mentioned | 4.830 | 16.5 | Not mentioned | 4.830 | 16.5 | Reference category | 0 | ||
| 12. Advantages exaggerated | Mentioned | 20.128 | 68.6 | Mentioned | 20.128 | 68.6 | 1 | The advantages of innovative products or services are often exaggerated | |
| Not mentioned | 9.200 | 31.4 | Not mentioned | 9.200 | 31.4 | Reference category | 0 | ||
| 13. Economic growth | Mentioned | 17.182 | 58.6 | Mentioned | 17.182 | 58.6 | 1 | Innovation is essential for improving economic growth | |
| Not mentioned | 12.146 | 41.4 | Not mentioned | 12.146 | 41.4 | Reference category | 0 | ||
| Religiosity (independent variables) | |||||||||
| 14. Religion | Catholic | 13.191 | 45.0 | Catholic | 13.191 | 46.5 | Do you consider yourself to be…? | ||
| Orthodox | 3.719 | 12.7 | Orthodox | 3.719 | 13.1 | Reference category | |||
| Protestant | 4.100 | 14.0 | Protestant | 4.100 | 14.4 | ||||
| Other Christian | 1.063 | 3.6 | Other Christian | 1.063 | 3.7 | ||||
| Jewish | 25 | 0.1 | Muslim | 1.747 | 6.2 | ||||
| Muslim | 1.747 | 6.0 | Atheist | 1.316 | 4.6 | ||||
| Sikh | 8 | 0.0 | Non believer/Agnostic | 3.253 | 11.5 | ||||
| Buddhist | 41 | 0.1 | |||||||
| Hindu | 16 | 0.1 | |||||||
| Atheist | 1.316 | 4.5 | |||||||
| Non believer/Agnostic | 3.253 | 11.1 | |||||||
| Other (SPONTANEOUS) | 415 | 1.4 | |||||||
| DK (missing) | 434 | 1.5 | |||||||
| 15. Attendance | More than once a week | 1.234 | 4.2 | More than once a week | 1.234 | 4.3 | Reference category | Apart from weddings or funerals, about how often do you attend religious services? | |
| Once a week | 4.406 | 15.0 | Once a week | 4.406 | 15.2 | ||||
| About once a month | 2.563 | 8.7 | About once a month | 2.563 | 8.8 | ||||
| About each 2 or 3 month | 2.051 | 7.0 | About each 2 or 3 month | 2.051 | 7.1 | ||||
| Only on special holy days | 5.651 | 19.3 | Only on special holy days | 5.651 | 19.5 | ||||
| About once a year | 2.451 | 8.4 | About once a year | 2.451 | 8.4 | ||||
| Less often | 3.656 | 12.5 | Less often | 3.656 | 12.6 | ||||
| Never | 7.018 | 23.9 | Never | 7.018 | 24.2 | ||||
| DK (missing) | 298 | 1.0 | |||||||
| Socio-demographic (control variables) | |||||||||
| 16. Marital Status | Married | 15.225 | 51.9 | Married | 15.225 | 52.1 | Marital Status. Could you give me the letter which corresponds best to your own current situation? | ||
| Remarried | 632 | 2.2 | Remarried | 632 | 2.2 | ||||
| Unmarried, currently living with partner | 2.402 | 8.2 | Unmarried, currently living with partner | 2.402 | 8.2 | ||||
| Unmarried, having never lived with a partner | 4.463 | 15.2 | Unmarried, having never lived with a partner | 4.463 | 15.3 | ||||
| Unmarried, having previously lived with a partner, but now on my own | 1.097 | 3.7 | Unmarried, having previously lived with a partner, but now on my own | 1.097 | 3.8 | ||||
| Divorced | 1.704 | 5.8 | Divorced | 1.704 | 5.8 | ||||
| Separated | 424 | 1.4 | Separated | 424 | 1.5 | ||||
| Widowed | 3.040 | 10.4 | Widowed | 3.040 | 10.4 | Reference category | |||
| Other (SPONTANEOUS) | 243 | 0.8 | Other (SPONTANEOUS) | 243 | 0.8 | ||||
| Refusal (SPONTANEOUS) | 98 | 0.3 | |||||||
| 17. Education | Up to 14 years | 4.538 | 15.5 | Up to 14 years | 4.538 | 15.7 | How old were you when you stopped full-time education? | ||
| 15 years | 2.097 | 7.2 | 15 years | 2.097 | 7.2 | ||||
| 16 years | 2.253 | 7.7 | 16 years | 2.253 | 7.8 | ||||
| 17 years | 2.023 | 6.9 | 17 years | 2.023 | 7.0 | ||||
| 18 years | 5.002 | 17.1 | 18 years | 5.002 | 17. | ||||
| 19 years | 2.419 | 8.2 | 19 years | 2.419 | 8.4 | ||||
| 20 years | 1.371 | 4.7 | 20 years | 1.371 | 4.7 | ||||
| 21 years | 999 | 3.4 | 21 years | 999 | 3.5 | ||||
| 22 years and older | 5.233 | 17.8 | 22 years and older | 5.233 | 18.1 | ||||
| Still studying | 2.700 | 9.2 | Still studying | 2.700 | 9.3 | ||||
| No full-time education | 302 | 1.0 | No full-time education | 302 | 1.0 | Reference category | |||
| DK (missing) | 391 | 1.3 | |||||||
| 18. Gender | Male | 13.078 | 44.6 | Male | 13.078 | 44.6 | Gender | ||
| Female | 16.250 | 55.4 | Female | 16.250 | 55.4 | Reference category | |||
| 19. Age | 15–24 years | 3.948 | 13.5 | 15–24 years | 3.948 | 13.5 | AGE. How old are you? | ||
| 25–34 years | 4.733 | 16.1 | 25–34 years | 4.733 | 16.1 | ||||
| 35–44 years | 5.243 | 17.9 | 35–44 years | 5.243 | 17.9 | ||||
| 45–54 years | 4.904 | 16.7 | 45–54 years | 4.904 | 16.7 | ||||
| 55–64 years | 4.559 | 15.5 | 55–64 years | 4.559 | 15.6 | ||||
| 65 years and older | 5.931 | 20.2 | 65 years and older | 5.931 | 20.2 | Reference category | |||
| Missing | 10 | 0.0 | |||||||
| 20. Community | Rural area or village | 10.989 | 37.5 | Rural area or village | 10.989 | 37.6 | Reference category | TYPE OF COMMUNITY. Would you say you live in a...? | |
| Small or middle sized town | 10.385 | 35.4 | Small or middle sized town | 10.385 | 35.6 | ||||
| Large town | 7.818 | 26.7 | Large town | 7.818 | 26.8 | ||||
| DK (missing) | 136 | 0.5 | |||||||
| Dependent Variable: | |||||||
|---|---|---|---|---|---|---|---|
| Company Image | Company Survival | Economic Growth | |||||
| Log-Odds | Odds | Log-Odds | Odds | Log-Dds | Odds | ||
| Religion (Ref. cat. Orthodox) | Atheist | 0.511 *** −0.075 | 1.667 | 0.563 *** −0.072 | 1.755 | 0.647 *** −0.072 | 1.910 |
| Catholic | 0.066 −0.044 | 1.068 | 0.288 *** −0.042 | 1.334 | 0.182 *** −0.041 | 1.200 | |
| Muslim | −0.074 −0.071 | 0.928 | 0.309 *** −0.065 | 1.362 | 0.240 *** −0.0651 | 1.271 | |
| Non believer/Agnostic | 0.272 *** −0.061 | 1.312 | 0.538 *** −0.057 | 1.713 | 0.539 *** −0.057 | 1.714 | |
| Other (SPONT. | 0.264 ** −0.1179 | 1.303 | 0.520 *** −0.111 | 1.683 | 0.558 *** −0.111 | 1.747 | |
| Other Christian | 0.261 *** −0.079 | 1.298 | 0.657 *** −0.074 | 1.930 | 0.662 *** −0.074 | 1.939 | |
| Protestant | 0.212 *** −0.053 | 1.236 | 0.720 *** −0.05 | 2.055 | 0.623 *** −0.05 | 1.864 | |
| Religiosity (Ref. cat. More than once a week) | Once a week | −0.095 −0.076 | 0.909 | −0.035 −0.071 | 0.966 | −0.019 −0.072 | 0.982 |
| Once a month | −0.058 −0.082 | 0.944 | 0.137 * −0.076 | 1.147 | 0.132 * −0.077 | 1.141 | |
| Each 2 or 3 month | 0.095 −0.084 | 1.100 | 0.1707 * −0.0789 | 1.100 | 0.239 *** −0.077 | 1.270 | |
| On special holy days | −0.015 −0.075 | 0.985 | 0.143 ** −0.07 | 1.153 | 0.188 *** −0.07 | 1.207 | |
| Once a year | −0.066 −0.083 | 0.940 | 0.297 *** −0.077 | 1.345 | 0.228 *** −0.078 | 1.256 | |
| Less often | −0.098 −0.079 | 0.907 | 0.0567 −0.7315 | 1.067 | 0.075 −0.074 | 1.078 | |
| Never | −0.177 ** −0.077 | 0.837 | 0.174 ** −0.071 | 1.190 | 0.145 ** −0.072 | 1.156 | |
| Marital Status (Ref. cat. Widowed) | Divorced | 0.204 *** −0.078 | 1.226 | 0.322 *** −0.069 | 1.383 | 0.159 ** −0.07 | 1.173 |
| Married | 0.287 *** −0.057 | 1.332 | 0.283 *** −0.05 | 1.328 | 0.236 *** −0.05 | 1.266 | |
| Remarried | 0.440 *** −0.102 | 1.552 | 0.340 *** −0.096 | 1.405 | 0.284 ** −0.096 | 1.328 | |
| Separated | 0.233 * −0.125 | 1.263 | 0.178 −0.115 | 1.195 | 0.113 −0.115 | 1.120 | |
| Unmarried. living with partner | 0.328 *** −0.076 | 1.388 | 0.250 *** −0.069 | 1.284 | 0.266 *** −0.069 | 1.304 | |
| Unmarried. never lived with partner | 0.328 *** −0.076 | 1.282 | 0.305 *** −0.0672 | 1.356 | 0.196 *** −0.067 | 1.216 | |
| Unmarried. previously lived with partner | 0.252 *** −0.074 | 1.300 | 0.301 *** −0.082 | 1.352 | 0.200 ** −0.082 | 1.221 | |
| Other (SPONTANEOUS | 0.001 −0.167 | 1.001 | 0.094 −0.152 | 1.098 | 0.08 −0.151 | 1.084 | |
| Education (Ref. cat. No full-time education) | Up to 14 years | 0.445 ** −0.181 | 1.560 | 0.315 ** −0.148 | 1.370 | 0.799 *** −0.175 | 2.223 |
| 15 years | 0.567 *** −0.185 | 1.763 | 0.394 *** −0.152 | 1.483 | 0.895 *** −0.179 | 2.448 | |
| 16 years | 0.674 *** −0.185 | 1.962 | 0.564 *** −0.151 | 1.758 | 1.153 *** −0.178 | 3.167 | |
| 17 years | 0.723 *** −0.185 | 2.061 | 0.699 *** −0.152 | 2.012 | 1.262 *** −0.179 | 3.533 | |
| 18 years | 0.7441 *** −0.1811 | 2.103 | 0.690 *** −0.148 | 1.993 | 1.303 *** −0.175 | 3.680 | |
| 19 years | 0.878 *** −0.184 | 2.405 | 0.878 *** −0.151 | 2.407 | 1.538 *** −0.178 | 4.656 | |
| 20 years | 0.884 *** −0.188 | 2.422 | 0.919 *** −0.155 | 2.507 | 1.502 *** −0.181 | 4.490 | |
| 21 years | 0.879 *** −0.192 | 2.409 | 1.061 *** −0.159 | 2.889 | 1.617 *** −0.185 | 5.038 | |
| 22 years and older | 1.039 *** −0.181 | 2.828 | 0.991 *** −0.148 | 2.694 | 1.765 *** −0.175 | 5.844 | |
| Still studying | 0.974 *** −0.1896 | 2.684 | 0.849 *** −0.158 | 2.337 | 1.493 *** −0.183 | 4.452 | |
| Sex (Ref. cat. Female) | Male | 0.180 *** −0.028 | 1.198 | 0.159 *** −0.026 | 1.172 | 0.203 *** −0.026 | 1.225 |
| Age (Ref. cat. 65 years and older) | 15–24 years | 0.326 *** −0.074 | 1.386 | 0.022 −0.069 | 1.022 | 0.176 * −0.069 | 1.193 |
| 25–34 years | 0.360 *** −0.0542 | 1.433 | 0.150 *** −0.05 | 1.162 | 0.149 ** −0.05 | 1.161 | |
| 35–44 years | 0.328 *** −0.051 | 1.389 | 0.210 *** −0.046 | 1.234 | 0.198 *** −0.046 | 1.218 | |
| 45–54 years | 0.311 *** −0.05 | 1.365 | 0.206 *** −0.046 | 1.228 | 0.247 *** −0.046 | 1.280 | |
| 55–64 years | 0.252 *** −0.05 | 1.286 | 0.229 *** −0.045 | 1.257 | 0.222 *** −0.045 | 1.249 | |
| Community (Ref. cat. Rural area) | Large town | 0.099 *** −0.035 | 1.104 | 0.068 ** −0.0323 | 1.070 | 0.0533 −0.032 | 1.054 |
| Small or middle sized town | 0.01 −0.032 | 1.010 | 0.02 −0.029 | 1.021 | 0.003 −0.03 | 1.003 | |
| Constant | −2.364 *** −0.197 | 0.094 | −2.105 *** −0.165 | 0.122 | −2.560 *** −0.19 | 0.077 | |
| Observations | 28,052 | 28,052 | 28,052 | ||||
| Log Likelihood | −16,443.05 | −18,262.67 | −18,206.29 | ||||
| Akaike Inf. Crit. | 32,968.1 | 36,607.35 | 36,494.59 | ||||
| Dependent Variable | |||||||||||
|---|---|---|---|---|---|---|---|---|---|---|---|
| Gadgets | Fashion | Simplify Life | Risky | Advantages Exaggerated | |||||||
| Log-Odds | Odds | Log-Odds | Odds | Log-Odds | Odds | Log-Odds | Odds | Log-Odds | Odds | ||
| Religion (Ref.cat. Orthodox) | Atheist | 0.367 *** −0.088 | 1.443 | −0.213 *** −0.078 | 0.808 | 0.139 * −0.071 | 1.149 | −0.324 *** −0.093 | 0.724 | 0.410 *** −0.074 | 1.507 |
| Catholic | 0.188 *** −0.051 | 1.206 | −0.146 *** −0.042 | 0.864 | −0.326 *** −0.039 | 0.722 | −0.485 *** −0.048 | 0.616 | −0.036 −0.042 | 0.965 | |
| Muslim | 0.346 *** −0.077 | 1.414 | 0.113 * −0.065 | 1.120 | −0.657 *** −0.065 | 0.518 | −0.271 *** −0.079 | 0.763 | −0.402 *** −0.074 | 0.669 | |
| Non believer/Agnostic | 0.286 *** −0.071 | 1.331 | −0.06 −0.06 | 0.942 | −0.111 ** −0.056 | 0.895 | −0.446 *** −0.073 | 0.640 | 0.423 *** −0.059 | 1.527 | |
| Other (SPONT.) | 0.22 −0.138 | 1.247 | −0.283 ** −0.123 | 0.754 | −0.277 ** −0.112 | 0.758 | −0.372 ** −0.145 | 0.690 | 0.226 ** −0.115 | 1.253 | |
| Other Christian | 0.435 *** −0.087 | 1.545 | 0.103 −0.076 | 1.108 | 0.011 −0.073 | 1.011 | −0.154 * −0.088 | 0.857 | 0.362 *** −0.075 | 1.436 | |
| Protestant | 0.278 *** −0.062 | 1.321 | 0.025 −0.051 | 1.026 | −0.163 *** −0.049 | 0.849 | −0.563 *** −0.063 | 0.570 | 0.366 *** −0.051 | 1.442 | |
| Religiosity (Ref. cat. More than once a week) | Each 2 or 3 month | 0.197 ** −0.096 | 1.217 | −0.105 −0.08 | 0.900 | 0.202 *** ’−0.078 | 1.224 | −0.88 −0.098 | 0.916 | 0.198 ** −0.083 | 1.219 |
| Less often | −0.99 −0.089 | 1.104 | −0.097 −0.074 | 0.908 | 0.037 −0.072 | 1.037 | −0.253 *** −0.092 | 0.777 | 0.158 ** −0.077 | 1.171 | |
| Never | 0.157 * −0.086 | 1.170 | −0.118 −0.072 | 0.889 | −0.068 −0.071 | 0.934 | −0.114 −0.088 | 0.892 | 0.146 * −0.076 | 1.158 | |
| On special holy days | 0.213 ** −0.084 | 1.237 | −0.071 −0.07 | 0.932 | 0.089 −0.069 | 1.093 | −0.032 −0.085 | 0.969 | 0.216 *** −0.074 | 1.241 | |
| Once a month | 0.183 ** −0.092 | 1.201 | −0.012 −0.077 | 0.988 | 0.155 ** −0.075 | 1.168 | 0.015 −0.093 | 1.015 | 0.156 * −0.081 | 1.169 | |
| Once a week | 0.265 *** −0.085 | 1.303 | −0.003 −0.071 | 0.997 | 0.03 −0.07 | 1.031 | 0.007 −0.086 | 1.007 | 0.158 ** −0.075 | 1.171 | |
| Once a year | 0.092 −0.095 | 1.097 | −0.109 −0.079 | 0.896 | 0.047 −0.077 | 1.048 | −0.085 −0.097 | 0.919 | 0.173 ** −0.082 | 1.188 | |
| Marital Status (Ref. cat. Widowed) | Divorced | 0.113 −0.083 | 1.120 | 0.095 −0.071 | 1.100 | 0.137 ** −0.069 | 1.147 | 0.136 −0.086 | 1.146 | 0.141 ** −0.071 | 1.151 |
| Married | 0.142 ** −0.057 | 1.153 | −0.044 −0.05 | 0.957 | 0.244 *** −0.049 | 1.277 | 0.018 −0.059 | 1.019 | 0.151 *** −0.05 | 1.163 | |
| Other (SPONTANEOUS) | 0.388 ** −0.177 | 1.473 | 0.177 −0.154 | 1.194 | 0.229 −0.149 | 1.257 | −0.051 −0.217 | 0.950 | −0.066 −0.165 | 0.936 | |
| Remarried | 0.044 −0.119 | 1.045 | 0.075 −0.1 | 1.078 | 0.366 *** −0.095 | 1.442 | 0.101 −0.121 | 1.106 | 0.184 * −0.098 | 1.203 | |
| Separated | 0.410 *** −0.129 | 1.507 | −0.01 −0.119 | 0.990 | 0.135 −0.114 | 1.145 | 0.262 * −0.14 | 1.300 | 0.024 −0.121 | 1.024 | |
| Unmarried, living with partner | 0.198 ** −0.082 | 1.219 | 0.029 −0.071 | 1.030 | 0.181 *** −0.068 | 1.199 | 0.14 −0.088 | 1.150 | 0.203 *** −0.07 | 1.225 | |
| Unmarried, never lived with partner | 0.315 *** −0.078 | 1.370 | −0.041 −0.069 | 0.960 | 0.218 *** −0.067 | 1.243 | 0.200 ** −0.083 | 1.222 | 0.193 *** −0.069 | 1.213 | |
| Unmarried, previously lived with partner | 0.394 *** −0.095 | 1.482 | 0.007 −0.085 | 1.007 | 0.265 *** −0.081 | 1.303 | 0.156 −0.106 | 1.169 | 0.331 *** −0.083 | 1.392 | |
| Education (Ref. cat. No full−time education) | 15 years | 0.159 −0.159 | 1.172 | 0.351 ** −0.145 | 1.420 | 0.266 * −0.148 | 1.305 | 0.493 ** −0.194 | 1.637 | 0.754 *** −0.171 | 2.125 |
| 16 years | 0.167 −0.159 | 1.182 | 0.260 * −0.146 | 1.297 | 0.435 *** −0.148 | 1.545 | 0.572 *** −0.193 | 1.772 | 0.725 *** −0.171 | 2.064 | |
| 17 years | 0.083 −0.16 | 1.087 | 0.308 ** −0.147 | 1.361 | 0.516 *** −0.148 | 1.675 | 0.610 *** −0.195 | 1.841 | 0.858 *** −0.171 | 2.357 | |
| 18 years | −0.019 −0.155 | 0.981 | 0.281 ** −0.142 | 1.324 | 0.570 *** −0.144 | 1.769 | 0.610 *** −0.189 | 1.840 | 0.817 *** −0.167 | 2.263 | |
| 19 years | −0.11 −0.16 | 0.895 | 0.242 * −0.146 | 1.274 | 0.710 *** −0.147 | 2.033 | 0.464 ** −0.195 | 1.590 | 0.754 *** −0.171 | 2.126 | |
| 20 years | 0.042 −0.166 | 1.043 | 0.329 ** −0.151 | 1.389 | 0.583 *** −0.152 | 1.792 | 0.513 ** −0.2 | 1.670 | 0.940 *** −0.174 | 2.561 | |
| 21 years | 0.076 −0.171 | 1.078 | 0.338 ** −0.155 | 1.402 | 0.711 *** −0.156 | 2.036 | 0.551 *** −0.205 | 1.735 | 0.974 *** −0.178 | 2.649 | |
| 22 years and older | −0.045 −0.155 | 0.956 | 0.226 −0.142 | 1.253 | 0.715 *** −0.144 | 2.045 | 0.427 ** −0.19 | 1.532 | 0.935 *** −0.167 | 2.548 | |
| Still studying | −0.089 −0.168 | 0.912 | 0.403 *** −0.153 | 1.496 | 0.594 *** −0.154 | 1.811 | 0.449 ** −0.204 | 1.566 | 0.893 *** −0.177 | 2.444 | |
| Up to 14 years | 0.171 −0.153 | 1.186 | 0.339 ** −0.14 | 1.403 | 0.176 −0.144 | 1.192 | 0.489 *** −0.188 | 1.630 | 0.555 *** −0.167 | 1.741 | |
| Sex (Ref. cat. Female) | Male | −0.029 −0.031 | 0.972 | −0.142 *** −0.027 | 0.868 | 0.115 *** −0.026 | 1.122 | 0.041 −0.034 | 1.042 | −0.037 −0.027 | 0.963 |
| Age (Ref. cat. 65 years and older) | 15–24 years | −0.097 −0.081 | 0.907 | 0.183 ** −0.071 | 1.201 | 0.425 *** −0.068 | 1.530 | −0.497 *** −0.09 | 0.608 | −0.279 *** −0.072 | 0.757 |
| 25–34 years | −0.215 *** −0.06 | 0.806 | −0.025 −0.053 | 0.976 | 0.470 *** −0.049 | 1.601 | −0.535 *** −0.065 | 0.586 | −0.326 *** −0.052 | 0.722 | |
| 35–44 years | −0.112 ** −0.055 | 0.894 | 0.058 −0.048 | 1.060 | 0.292 *** −0.046 | 1.339 | −0.341 *** −0.058 | 0.711 | −0.150 *** −0.048 | 0.860 | |
| 45–54 years | −0.165 *** −0.054 | 0.848 | 0.002 −0.048 | 1.002 | 0.270 *** −0.045 | 1.310 | −0.312 *** −0.057 | 0.732 | −0.053 −0.047 | 0.948 | |
| 55–64 years | −0.027 −0.052 | 0.973 | 0.008 −0.046 | 1.008 | 0.140 *** −0.045 | 1.151 | −0.215 *** −0.055 | 0.806 | −0.018 −0.045 | 0.982 | |
| Community (Ref. cat. Rural area) | Large town | 0.027 −0.039 | 1.028 | 0.024 −0.034 | 1.024 | 0.091 *** −0.032 | 1.095 | 0.037 −0.041 | 1.037 | −0.045 −0.034 | 0.956 |
| Small or middle sized town | −0.019 −0.036 | 0.981 | −0.008 −0.031 | 0.992 | 0.027 −0.029 | 1.027 | −0.102 *** −0.039 | 0.903 | −0.116 *** −0.031 | 0.891 | |
| Constant | −1.883 *** −0.177 | 0.153 | −0.949 *** −0.157 | 0.387 | −1.241 *** −0.16 | 0.289 | −1.439 *** −0.205 | 0.237 | −1.792 *** −0.183 | 0.167 | |
| Observations | 28.052 | 28.052 | 28.052 | 28052 | 28052 | ||||||
| Log Likelihood | −13,893.19 | 17,091.11 | 18,507.56 | −12453.93 | −17211.76 | ||||||
| Akaike Inf. Crit. | 27.86839 | 34.26422 | 37.09711 | 2498986 | 3450551 | ||||||
| Dependent Variable | |||||||||||
|---|---|---|---|---|---|---|---|---|---|---|---|
| Gadgets | Fashion | Simplify Life | Risky | Advantages Exaggerated | |||||||
| Log–Odds | Odds | Log–Odds | Odds | Log–Dds | Odds | Log–Dds | Odds | Log–Odds | Odds | ||
| Religion (Ref. cat. Orthodox) | Atheist | 0.368 *** −0.078 | 1.445 | 0.328 *** −0.079 | 1.388 | 0.379 *** −0.075 | 1.460 | −0.081 −0.077 | 0.922 | 0.419 *** −0.076 | 1.520 |
| Catholic | 0.180 *** −0.042 | 1.197 | 0.049 −0.047 | 1.050 | 0.399 *** −0.042 | 1.491 | −0.303 *** −0.043 | 0.739 | 0.093 ** −0.044 | 1.097 | |
| Muslim | 0.729 *** −0.072 | 2.073 | 0.545 *** −0.07 | 1.724 | 0.396 *** −0.066 | 1.485 | 0.350 *** −0.07 | 1.420 | 0.082 −0.069 | 1.086 | |
| Non believer/Agnostic | 0.110 * −0.06 | 1.116 | 0.071 −0.064 | 1.073 | 0.451 *** −0.059 | 1.569 | −0.229 *** −0.06 | 0.795 | 0.190 *** −0.06 | 1.210 | |
| Other (SPONT.) | 0.131 −0.118 | 1.140 | 0.046 −0.127 | 1.048 | 0.448 *** −0.116 | 1.566 | −0.154 −0.118 | 0.857 | 0.273 ** −0.119 | 1.313 | |
| Other Christian | 0.132 * −0.077 | 1.141 | 0.12 −0.085 | 1.128 | 0.427 *** −0.078 | 1.532 | −0.274 *** −0.078 | 0.761 | 0.206 *** −0.078 | 1.228 | |
| Protestant | 0.079 −0.052 | 1.082 | −0.002 −0.058 | 0.998 | 0.307 *** −0.052 | 1.359 | −0.304 *** −0.052 | 0.738 | 0.241 *** −0.053 | 1.272 | |
| Religiosity (Ref. cat. More than once a week) | Each 2 or 3 month | −0.017 −0.081 | 0.983 | −0.132 −0.091 | 0.876 | −0.069 −0.08 | 0.933 | 0.029 −0.081 | 1.030 | 0.093 −0.084 | 1.098 |
| Less often | −0.191 ** −0.075 | 0.826 | −0.193 ** −0.084 | 0.824 | 0.013 −0.074 | 1.013 | 0.072 −0.076 | 1.074 | −0.077 −0.078 | 0.926 | |
| Never | −0.212 *** −0.073 | 0.809 | −0.155 * −0.082 | 0.857 | −0.069 −0.072 | 0.933 | 0.015 −0.073 | 1.015 | −0.11 −0.076 | 0.896 | |
| On special holy days | −0.119 * −0.071 | 0.888 | −0.137 * −0.08 | 0.872 | −0.015 −0.07 | 0.985 | 0.095 −0.072 | 1.100 | −0.085 −0.074 | 0.919 | |
| Once a month | −0.044 −0.078 | 0.957 | −0.142 −0.088 | 0.867 | −0.011 −0.077 | 0.989 | −0.111 −0.078 | 0.895 | −0.039 −0.081 | 0.962 | |
| Once a week | −0.118 −0.072 | 0.889 | −0.179 ** −0.082 | 0.836 | 0.055 −0.071 | 1.057 | −0.209 *** −0.073 | 0.811 | −0.051 −0.076 | 0.950 | |
| Once a year | −0.155 * −0.08 | 0.856 | −0.149 * −0.088 | 0.861 | 0.052 −0.078 | 1.053 | 0.106 −0.08 | 1.112 | −0.098 −0.082 | 0.907 | |
| Marital Status (Ref. cat. Widowed) | Divorced | 0.123 * −0.07 | 1.131 | 0.162 * −0.088 | 1.176 | 0.053 −0.071 | 1.054 | 0.215 *** −0.072 | 1.240 | 0.161 ** −0.077 | 1.175 |
| Married | 0.294 *** −0.05 | 1.342 | 0.224 *** −0.067 | 1.251 | −0.048 −0.051 | 0.953 | 0.289 *** −0.052 | 1.336 | 0.363 *** −0.057 | 1.438 | |
| Other (SPONTANEOUS) | 0.368 ** −0.173 | 1.445 | 0.134 −0.166 | 1.143 | −0.142 −0.155 | 0.867 | 0.122 −0.156 | 1.129 | 0.521 *** −0.157 | 1.684 | |
| Remarried | 0.463 *** −0.1 | 1.589 | 0.413 *** −0.113 | 1.511 | 0.015 −0.099 | 1.015 | 0.435 *** −0.099 | 1.544 | 0.504 *** −0.103 | 1.656 | |
| Separated | 0.166 −0.116 | 1.180 | 0.398 *** −0.131 | 1.489 | −0.117 −0.118 | 0.890 | 0.298 ** −0.118 | 1.347 | 0.181 −0.124 | 1.198 | |
| Unmarried, living with partner | 0.168 ** −0.071 | 1.183 | 0.142 * −0.084 | 1.152 | 0.008 −0.07 | 1.008 | 0.387 *** −0.072 | 1.472 | 0.449 *** −0.075 | 1.566 | |
| Unmarried, never lived with partner | 0.176 ** −0.069 | 1.192 | 0.231 *** −0.083 | 1.260 | −0.137 ** −0.069 | 0.872 | 0.179 ** −0.07 | 1.196 | 0.352 *** −0.074 | 1.421 | |
| Unmarried, previously lived with partner | 0.178 ** −0.086 | 1.195 | 0.052 −0.098 | 1.054 | 0.093 −0.084 | 1.097 | 0.096 −0.086 | 1.100 | 0.305 *** −0.088 | 1.357 | |
| Education (Ref. cat. No full−time education) | 15 years | 0.092 −0.144 | 1.096 | 0.127 −0.188 | 1.136 | 0.116 −0.154 | 1.123 | 0.294 * −0.155 | 1.342 | −0.247 −0.159 | 0.781 |
| 16 years | 0.353 ** −0.143 | 1.424 | 0.455 ** −0.185 | 1.576 | −0.096 −0.153 | 0.909 | 0.507 *** −0.155 | 1.660 | 0.08 −0.158 | 1.084 | |
| 17 years | 0.343 ** −0.144 | 1.410 | 0.379 ** −0.186 | 1.460 | −0.029 −0.154 | 0.972 | 0.516 *** −0.156 | 1.675 | 0.116 −0.158 | 1.123 | |
| 18 years | 0.486 *** −0.14 | 1.626 | 0.399 ** −0.182 | 1.491 | 0.02 −0.15 | 1.021 | 0.614 *** −0.151 | 1.847 | 0.234 −0.154 | 1.264 | |
| 19 years | 0.764 *** −0.144 | 2.148 | 0.579 *** −0.185 | 1.784 | 0.057 −0.153 | 1.059 | 0.777 *** −0.155 | 2.175 | 0.407 *** −0.157 | 1.503 | |
| 20 years | 0.773 *** −0.149 | 2.166 | 0.567 *** −0.189 | 1.762 | −0.097 −0.158 | 0.907 | 0.732 *** −0.16 | 2.080 | 0.416 *** −0.161 | 1.515 | |
| 21 years | 0.794 *** −0.154 | 2.212 | 0.531 *** −0.193 | 1.701 | −0.115 −0.161 | 0.891 | 0.644 *** −0.163 | 1.904 | 0.471 *** −0.165 | 1.601 | |
| 22 years and older | 0.873 *** −0.14 | 2.393 | 0.687 *** −0.181 | 1.989 | −0.270 * −0.15 | 0.764 | 0.815 *** −0.152 | 2.259 | 0.658 *** −0.154 | 1.932 | |
| Still studying | 0.844 *** −0.154 | 2.325 | 0.560 *** −0.189 | 1.751 | −0.114 −0.16 | 0.892 | 0.764 *** −0.162 | 2.147 | 0.374 ** −0.163 | 1.453 | |
| Up to 14 years | 0.028 −0.139 | 1.028 | −0.026 −0.182 | 0.974 | −0.1 −0.149 | 0.905 | 0.19 −0.151 | 1.209 | −0.374 ** −0.154 | 0.688 | |
| Sex (Ref. cat. Female) | Male | 0.308 *** −0.027 | 1.360 | 0.334 *** −0.029 | 1.397 | −0.065 ** −0.027 | 0.937 | 0.070 ** −0.027 | 1.072 | 0.226 *** −0.027 | 1.254 |
| Age (Ref. cat. 65 years and older) | 15–24 years | 1.298 *** −0.074 | 3.660 | 1.125 *** −0.077 | 3.079 | −0.156 ** −0.07 | 0.856 | 1.106 *** −0.072 | 3.021 | 0.843 *** −0.072 | 2.323 |
| 25–34 years | 1.059 *** −0.052 | 2.885 | 0.915 *** −0.059 | 2.498 | −0.230 *** −0.051 | 0.794 | 0.909 *** −0.052 | 2.482 | 0.665 *** −0.053 | 1.945 | |
| 35–44 years | 0.835 *** −0.047 | 2.304 | 0.709 *** −0.056 | 2.032 | −0.260 *** −0.047 | 0.771 | 0.785 *** −0.048 | 2.193 | 0.634 *** −0.05 | 1.885 | |
| 45–54 years | 0.572 *** −0.046 | 1.772 | 0.406 *** −0.057 | 1.501 | −0.156 *** −0.047 | 0.855 | 0.534 *** −0.047 | 1.706 | 0.469 *** −0.05 | 1.598 | |
| 55–64 years | 0.376 *** −0.045 | 1.457 | 0.359 *** −0.057 | 1.432 | −0.101 ** −0.046 | 0.904 | 0.347 *** −0.046 | 1.414 | 0.342 *** −0.049 | 1.407 | |
| Community (Ref. cat. Rural area) | Large town | 0.120 *** −0.034 | 1.127 | 0.140 *** −0.037 | 1.151 | −0.057 * −0.033 | 0.95 | 0.081 ** −0.034 | 1.085 | 0.085 ** −0.034 | 1.088 |
| Small or middle sized town | 0.107 *** −0.031 | 1.113 | 0.069 ** −0.034 | 1.072 | 0.006 −0.03 | 1.01 | 0.105 *** −0.031 | 1.111 | 0.135 *** −0.031 | 1.144 | |
| Constant | −1.238 *** −0.157 | 0.290 | −2.306 *** −0.203 | 0.1 | −0.289 * −0.166 | 0.75 | −1.189 *** −0.168 | 0.305 | −1.686 *** −0.172 | 0.185 | |
| Observations | 26.212 | 26.212 | 25.298 | 25.817 | 25.96 | ||||||
| Log Likelihood | −14,830.99 | −14,830.99 | −17,155.17 | −16,810.79 | −16,533.69 | ||||||
| Akaike Inf. Crit. | 29.74399 | 29.74399 | 34.39235 | 33.70357 | 33.14938 | ||||||
| 2010 Estimated Population | % in 2010 | 2050 Projected Population | % in 2050 | Popultation Growth 2010–2050 | % Increase 2010–2050 | Compound Annual Growth Rate (%) | |
|---|---|---|---|---|---|---|---|
| Christians | 553,280,000 | 74.5 | 454,090,000 | 65.2 | −99,190,000 | −17.9 | −0.5 |
| Unafiliated | 139,890,000 | 18.8 | 162,320,000 | 23.3 | 22,420,000 | 16 | 0.4 |
| Muslims | 43,470,000 | 5.9 | 70,870,000 | 10.2 | 27,400,000 | 63 | 1.2 |
| Jews | 1,420,000 | 0.2 | 1,200,000 | 0.2 | −220,000 | −15.2 | −0.4 |
| Hindus | 1,380,000 | 0.2 | 2,660,000 | 0.4 | 1,280,000 | 92.9 | 1.7 |
| Buddhists | 1,350,000 | 0.2 | 2,490,000 | 0.4 | 1,140,000 | 85 | 1.5 |
| Other Religions | 890,000 | 0.1 | 1,100,000 | 0.2 | 210,000 | 23.3 | 0.5 |
| Folk Religions | 870,000 | 0.1 | 1,590,000 | 0.2 | 720,000 | 83.1 | 1.5 |
| Regional Total | 742,550,000 | 100 | 696,330,000 | 100 | −46,220,000 | −6.2 | −0.2 |
| Estimated 2010 European Poulation | Percentage of European Christian | Estimated 2010 World Total | Percentage of World Total | |
|---|---|---|---|---|
| Catholic | 254,441,790 | 55.7 | 1,064,610,000 | 23.9 |
| Protestant | 100,880,640 | 22.1 | 800,640,000 | 12.6 |
| Orthodox | 98,782,220 | 21.6 | 260,380,000 | 76.9 |
| Other Christians | 3,098,870 | 0.7 | 28,430,000 | 10.9 |
| 100 |
© 2019 by the authors. Licensee MDPI, Basel, Switzerland. This article is an open access article distributed under the terms and conditions of the Creative Commons Attribution (CC BY) license (http://creativecommons.org/licenses/by/4.0/).
Share and Cite
Recio-Román, A.; Recio-Menéndez, M.; Román-González, M.V. Religion and Innovation in Europe: Implications for Product Life-Cycle Management. Religions 2019, 10, 589. https://doi.org/10.3390/rel10100589
Recio-Román A, Recio-Menéndez M, Román-González MV. Religion and Innovation in Europe: Implications for Product Life-Cycle Management. Religions. 2019; 10(10):589. https://doi.org/10.3390/rel10100589
Chicago/Turabian StyleRecio-Román, Almudena, Manuel Recio-Menéndez, and María Victoria Román-González. 2019. "Religion and Innovation in Europe: Implications for Product Life-Cycle Management" Religions 10, no. 10: 589. https://doi.org/10.3390/rel10100589
APA StyleRecio-Román, A., Recio-Menéndez, M., & Román-González, M. V. (2019). Religion and Innovation in Europe: Implications for Product Life-Cycle Management. Religions, 10(10), 589. https://doi.org/10.3390/rel10100589