
Numerical Study on the Hydrodynamic Characteristics of a Double-Row Floating Breakwater Composed of a Pontoon and an Airbag


Abstract
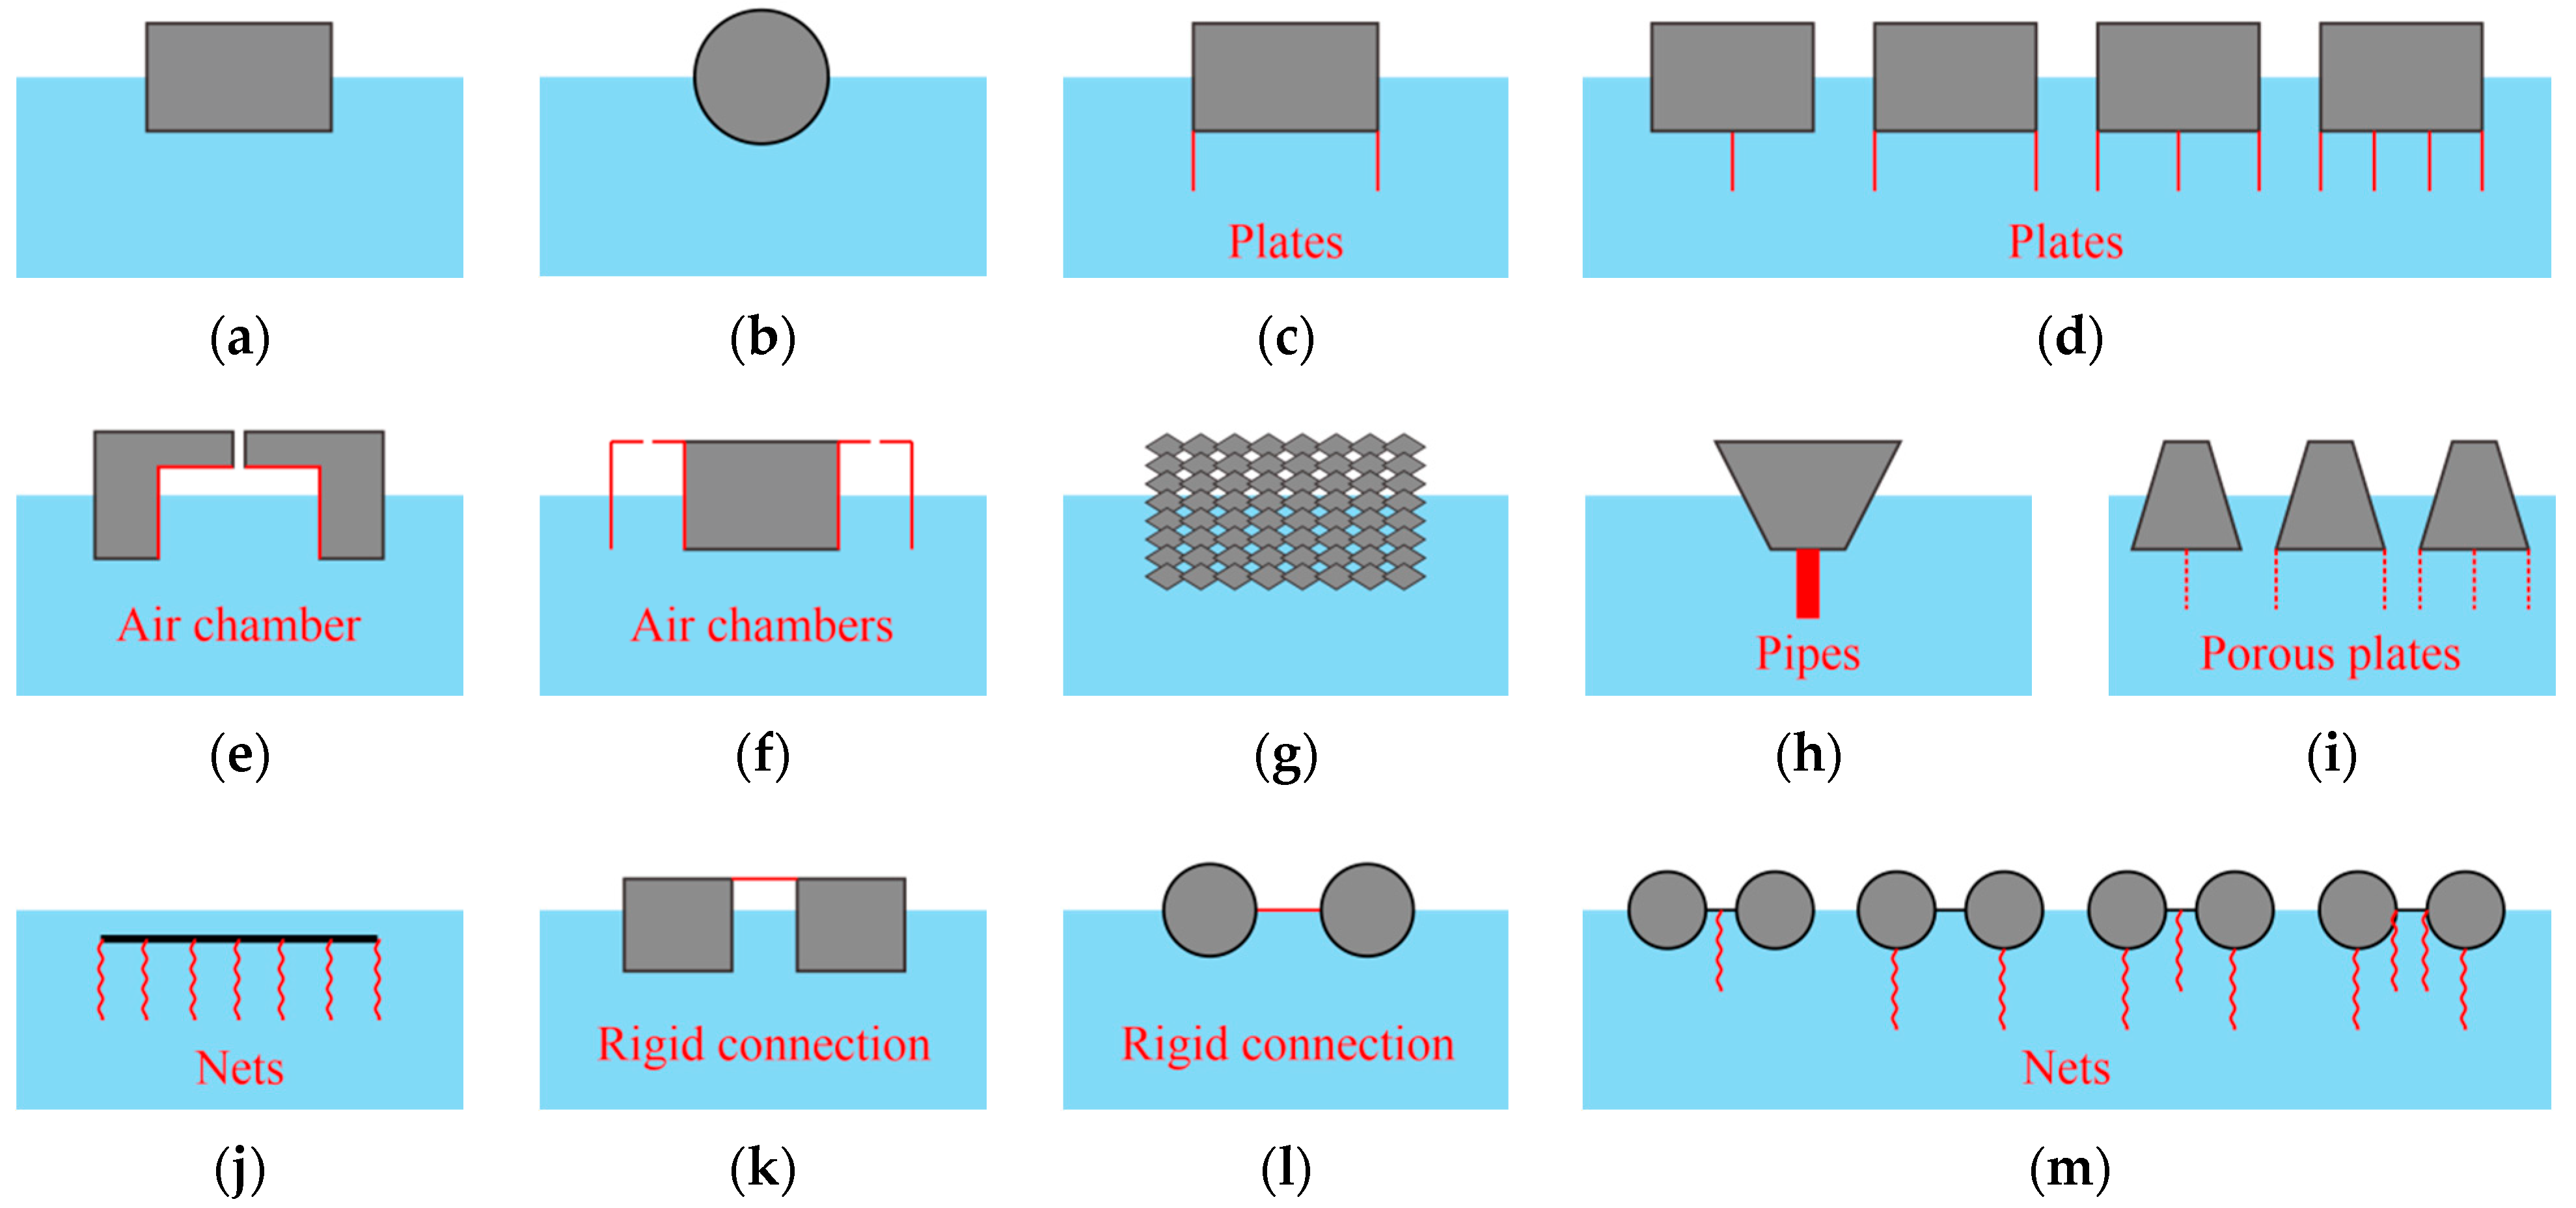
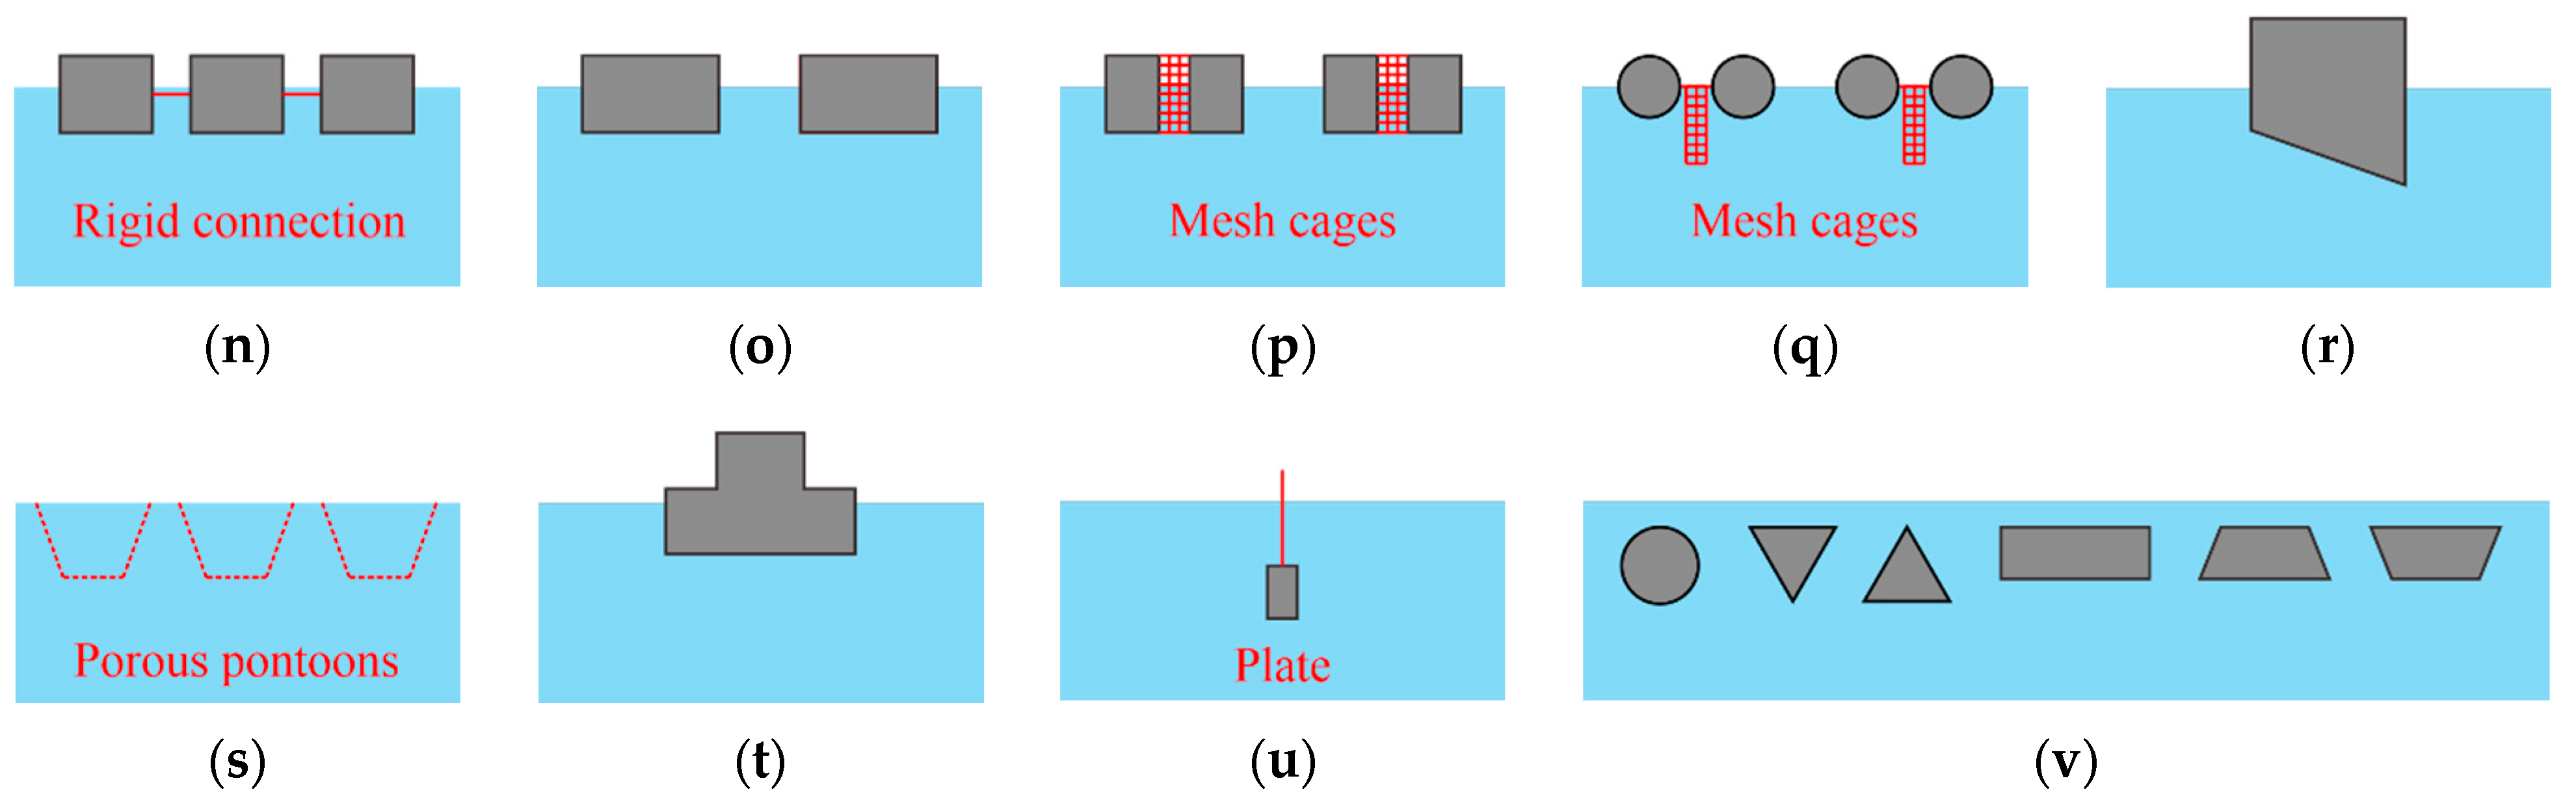
:1. Introduction
2. Numerical Model
2.1. Fluid Equations
2.2. Floating Body Equations
2.2.1. Solid Boundary Treatment
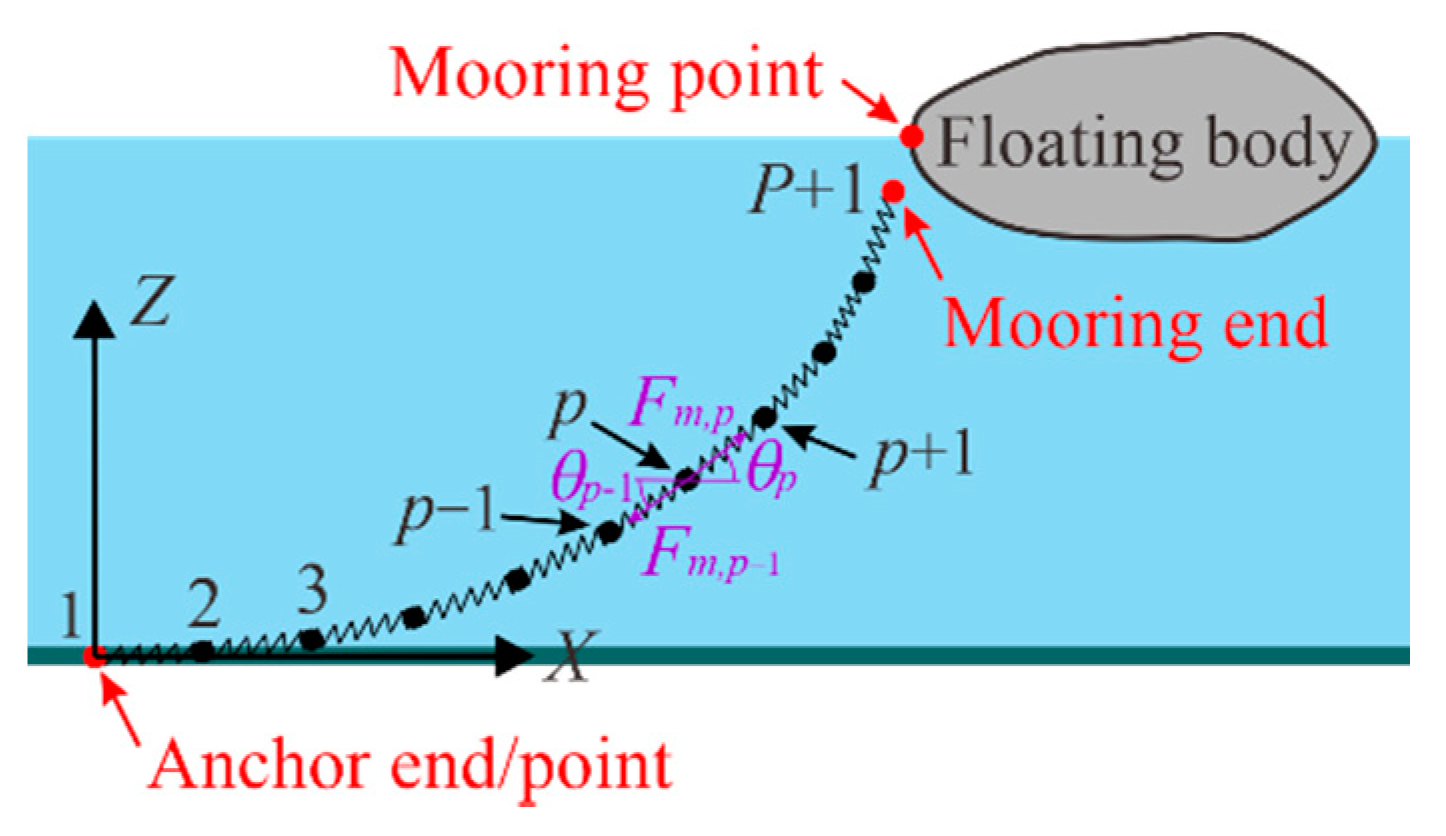
2.2.2. Mooring System Implementation
3. Model Validation
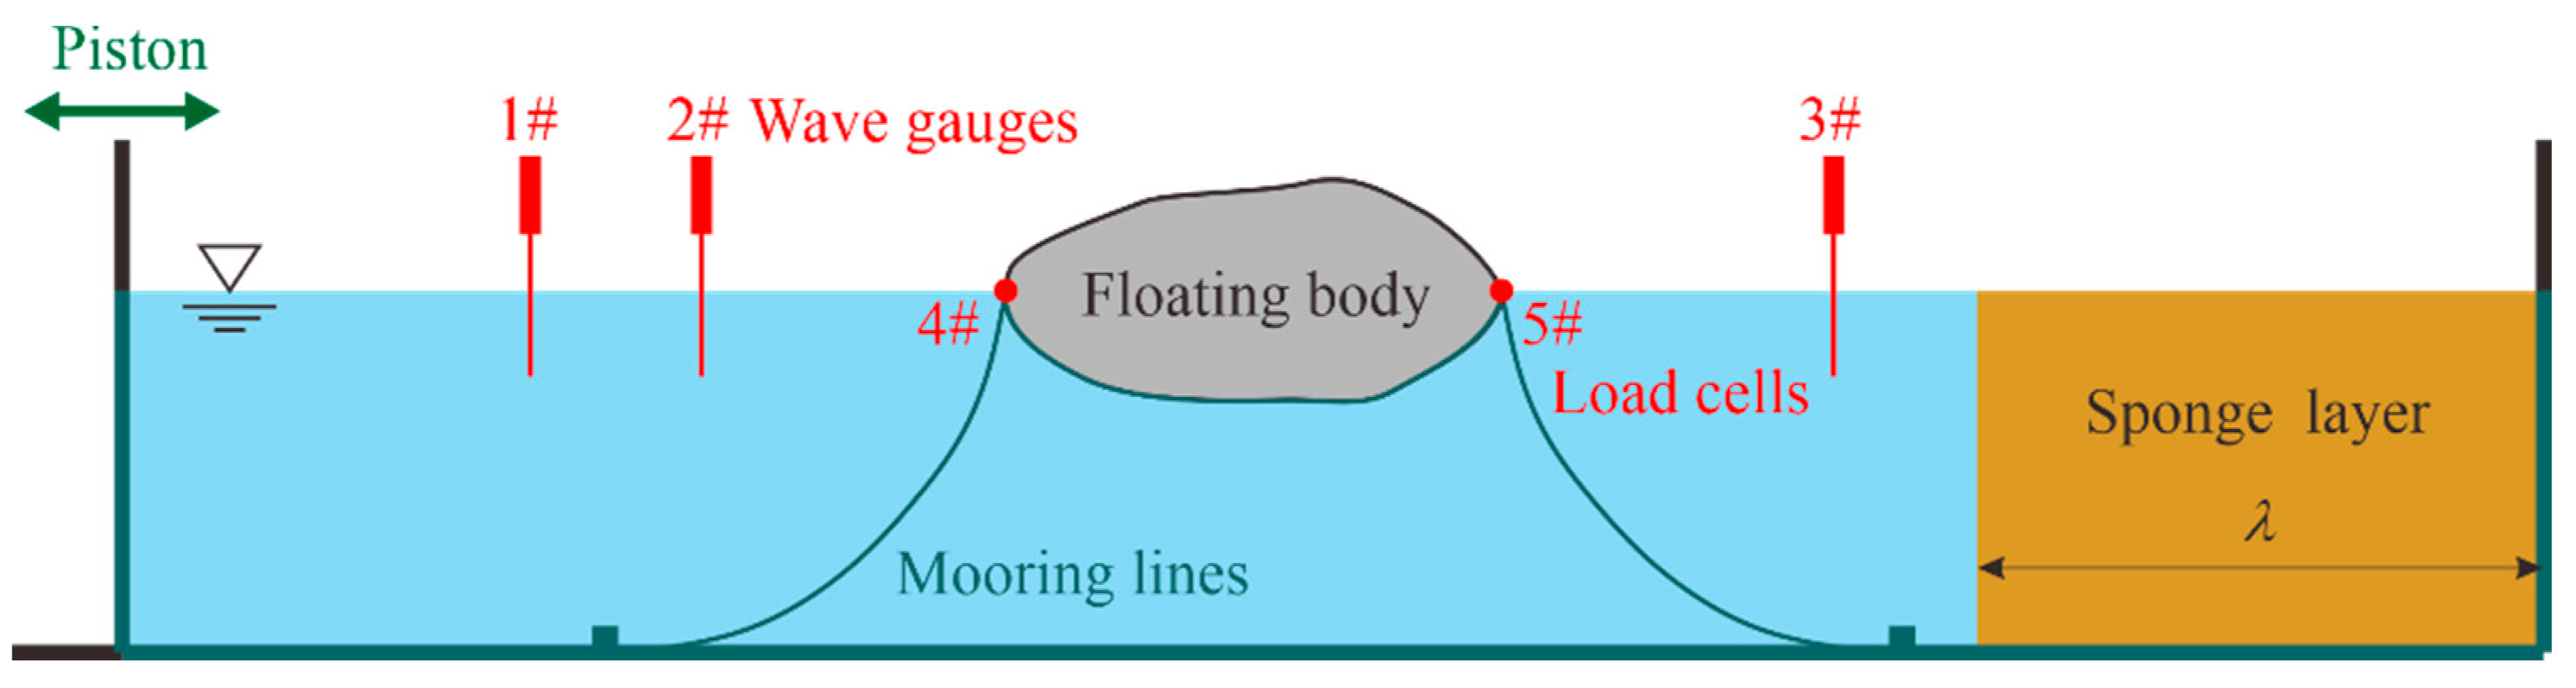
3.1. Numerical Wave Flume
3.2. Validation Case 1
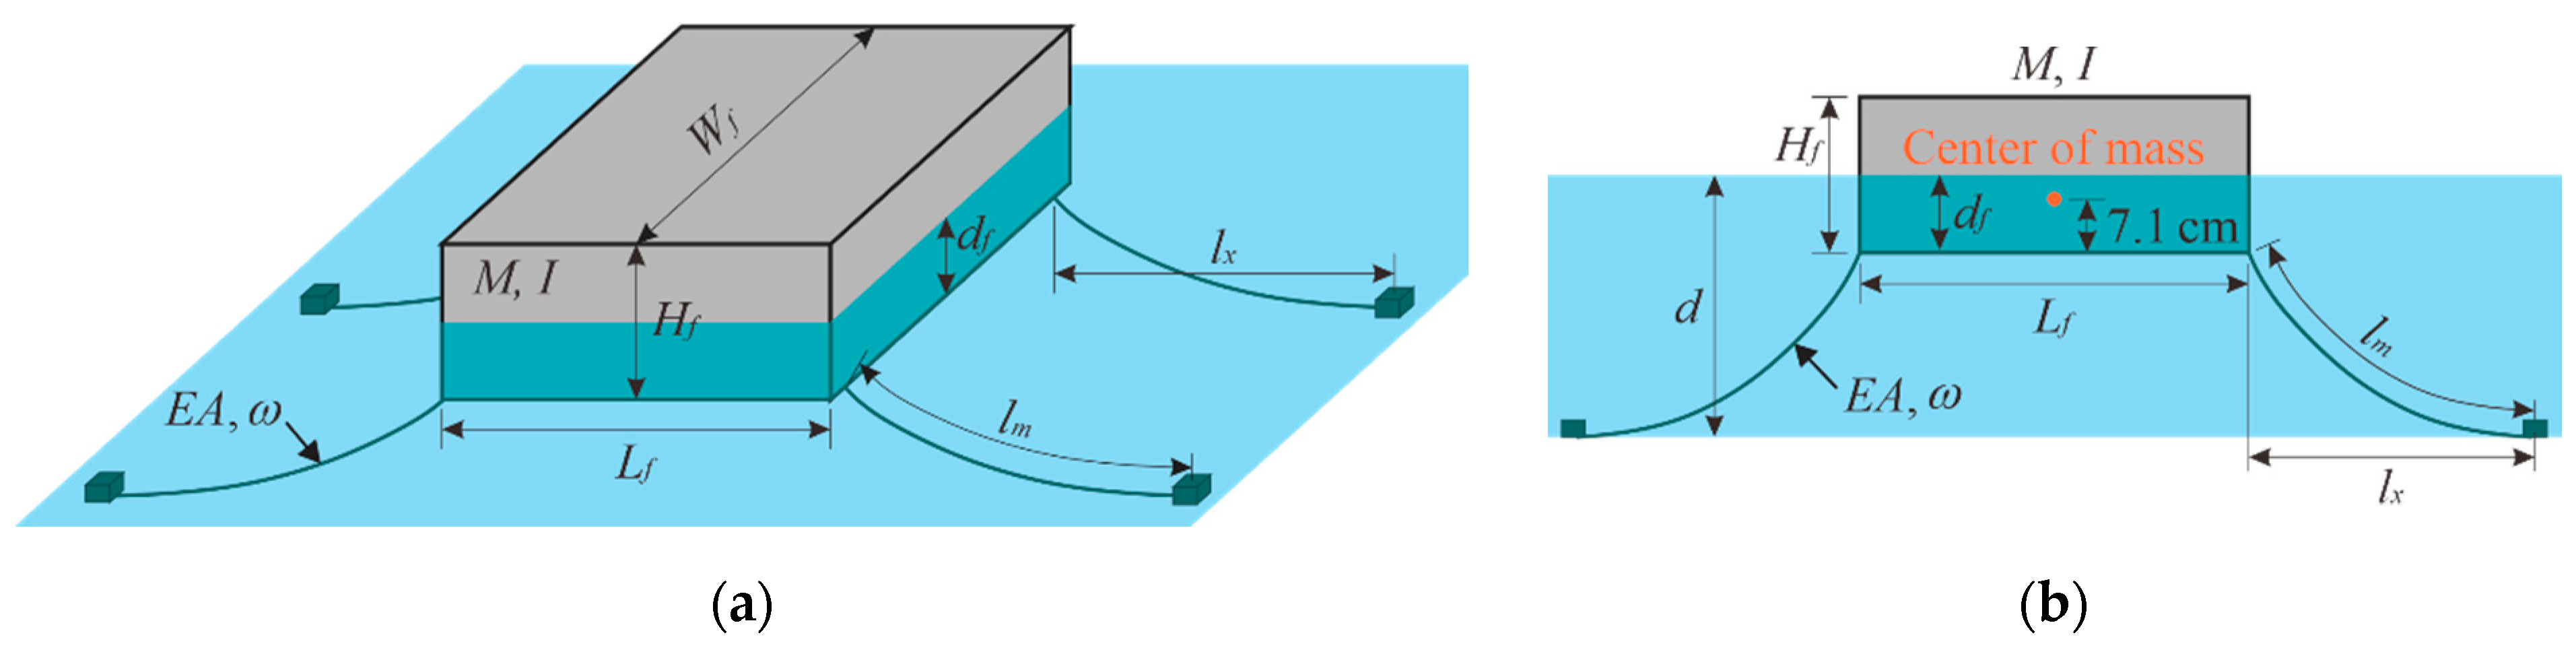
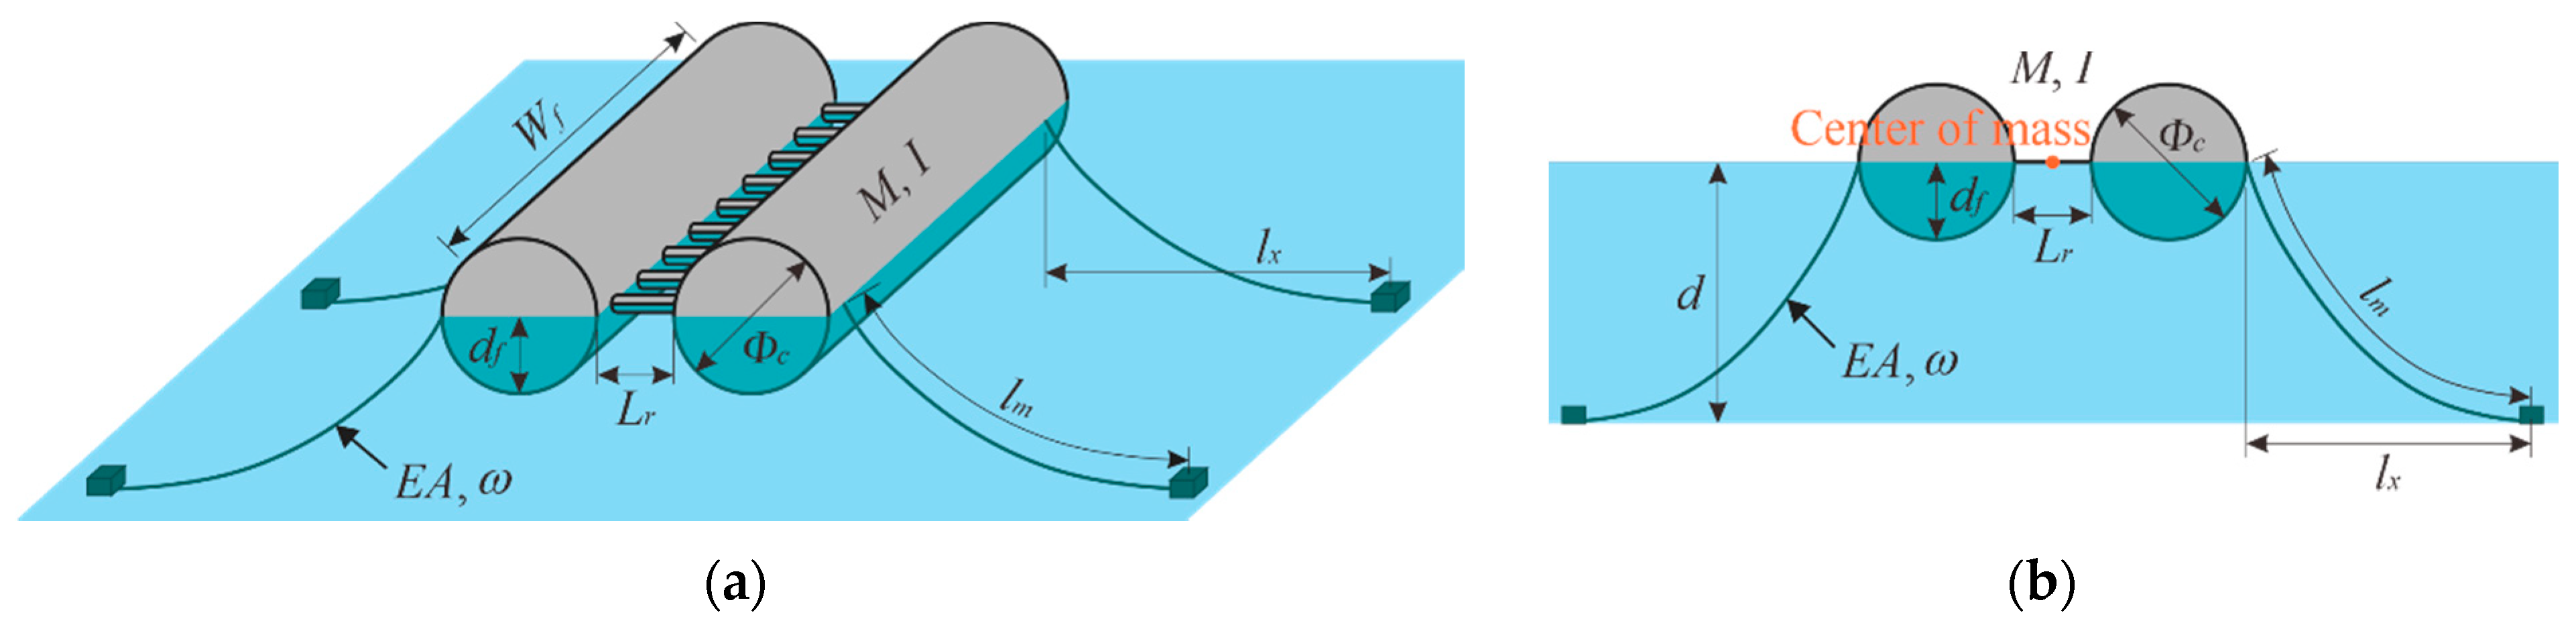
3.2.1. Setup of Physical and Numerical Models
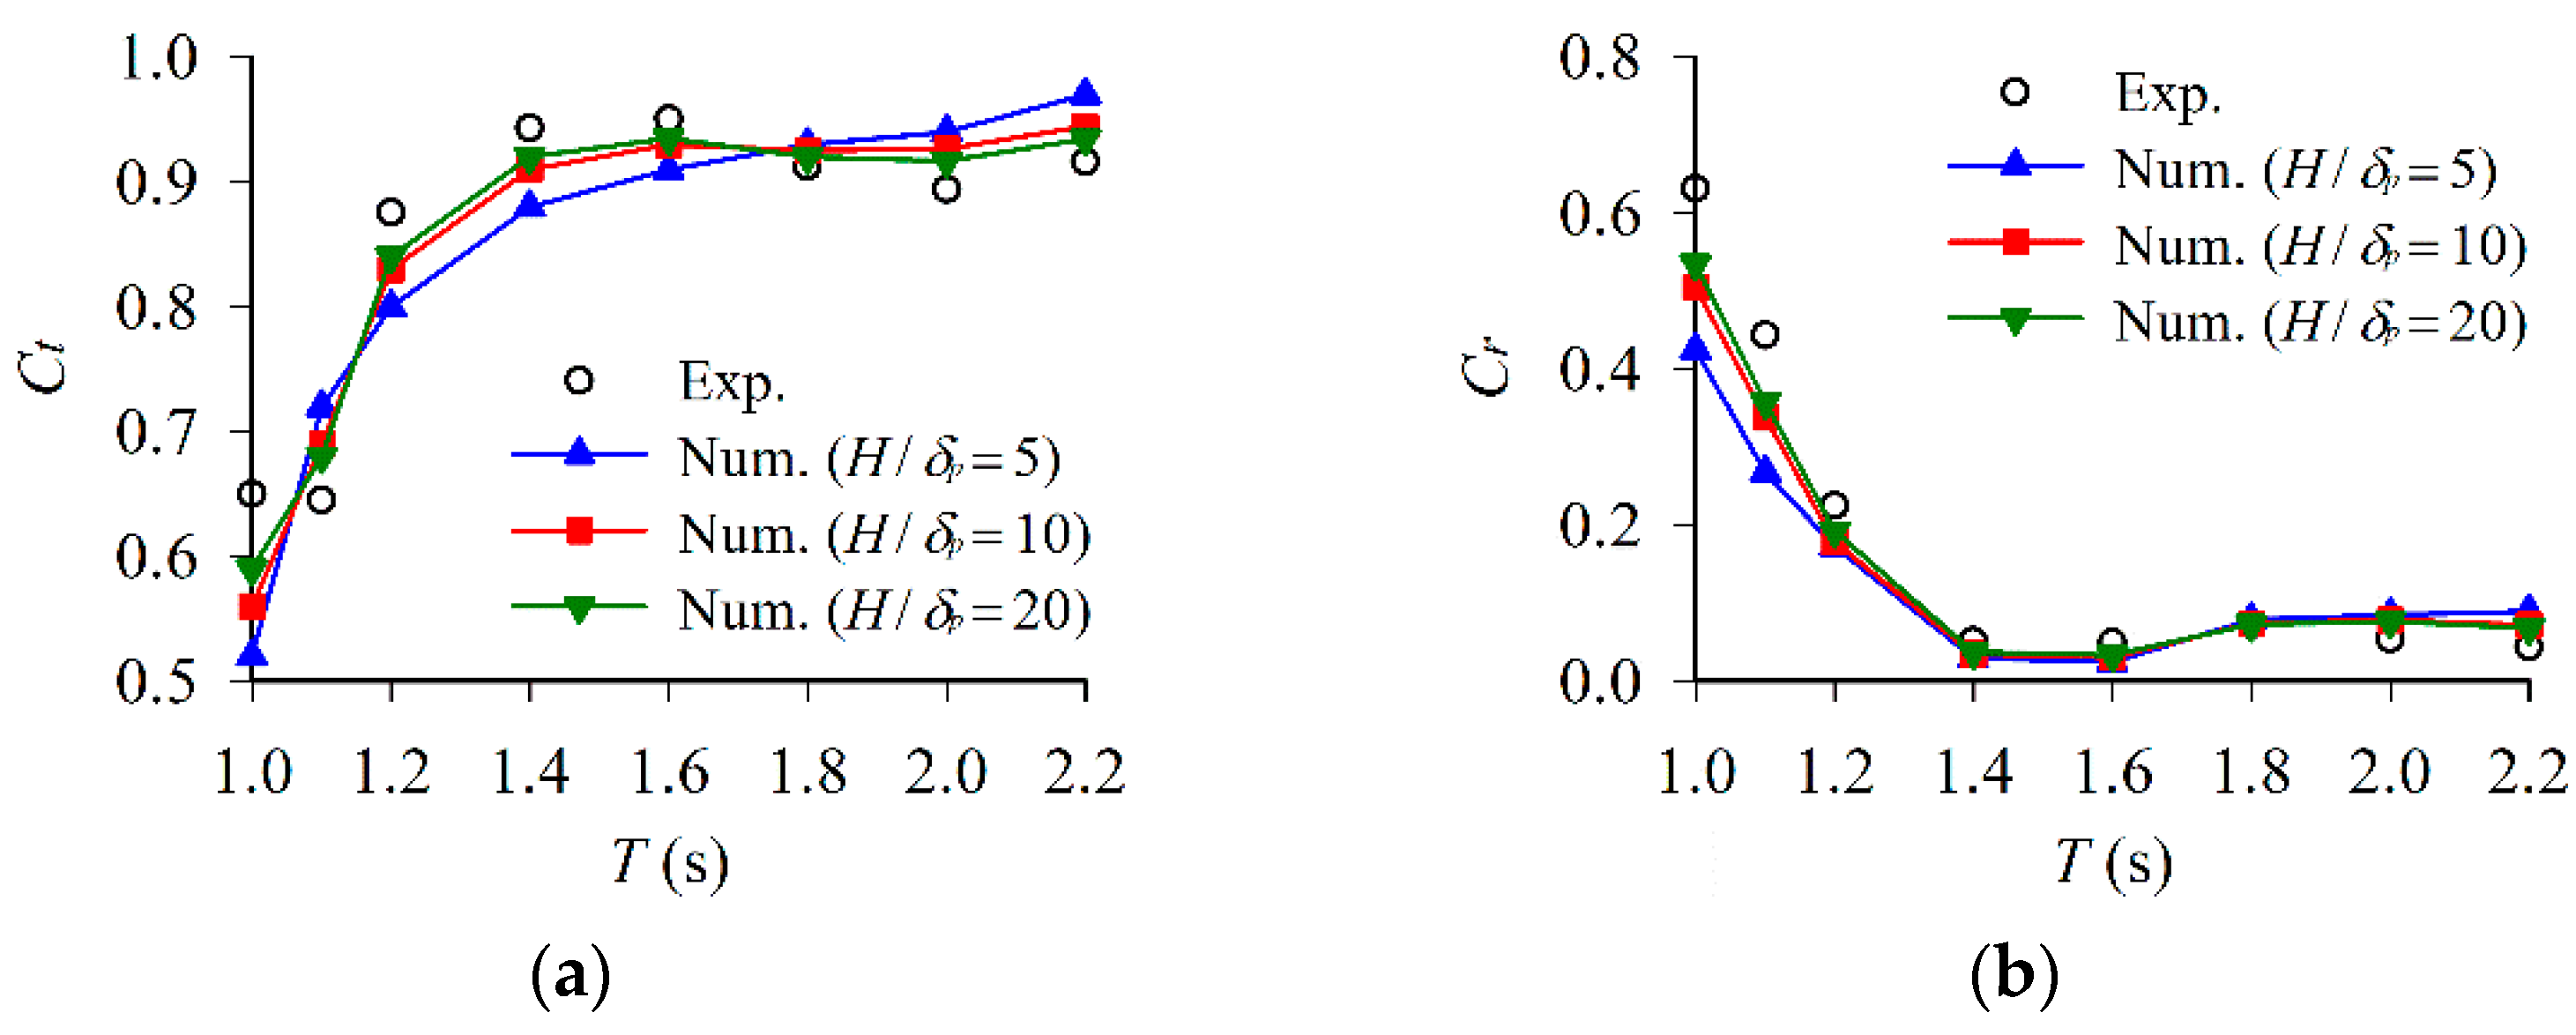
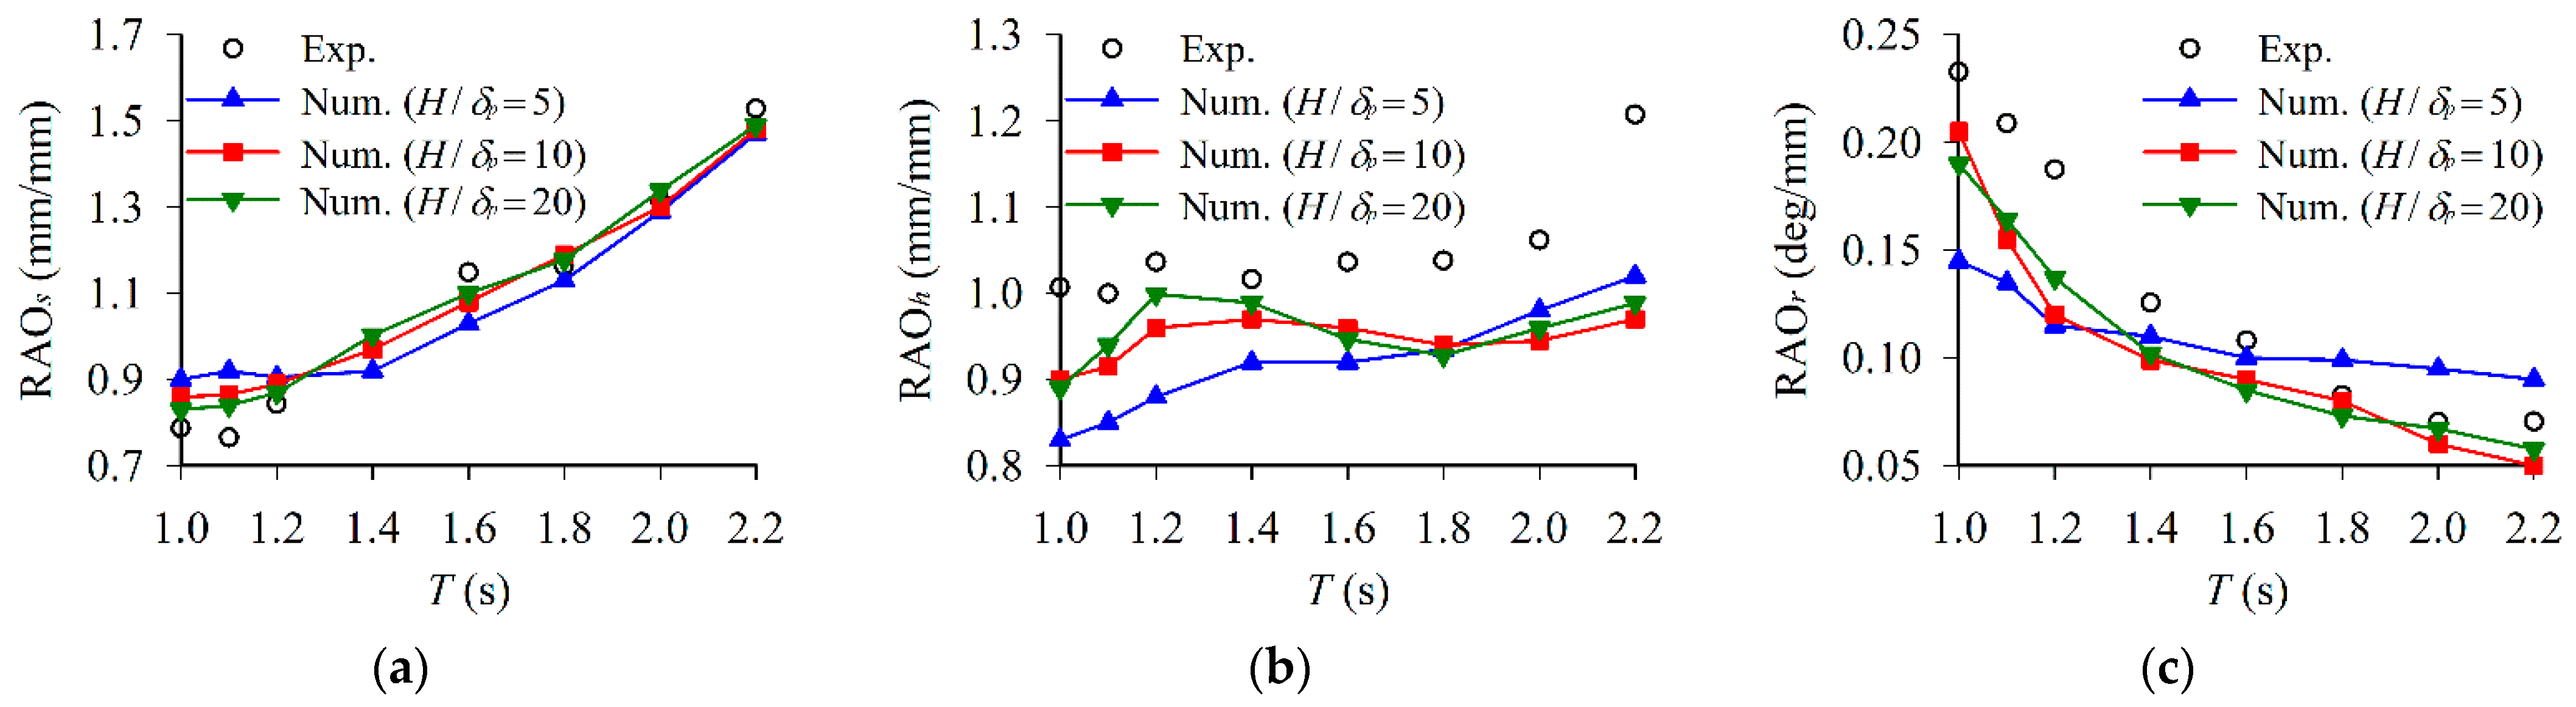
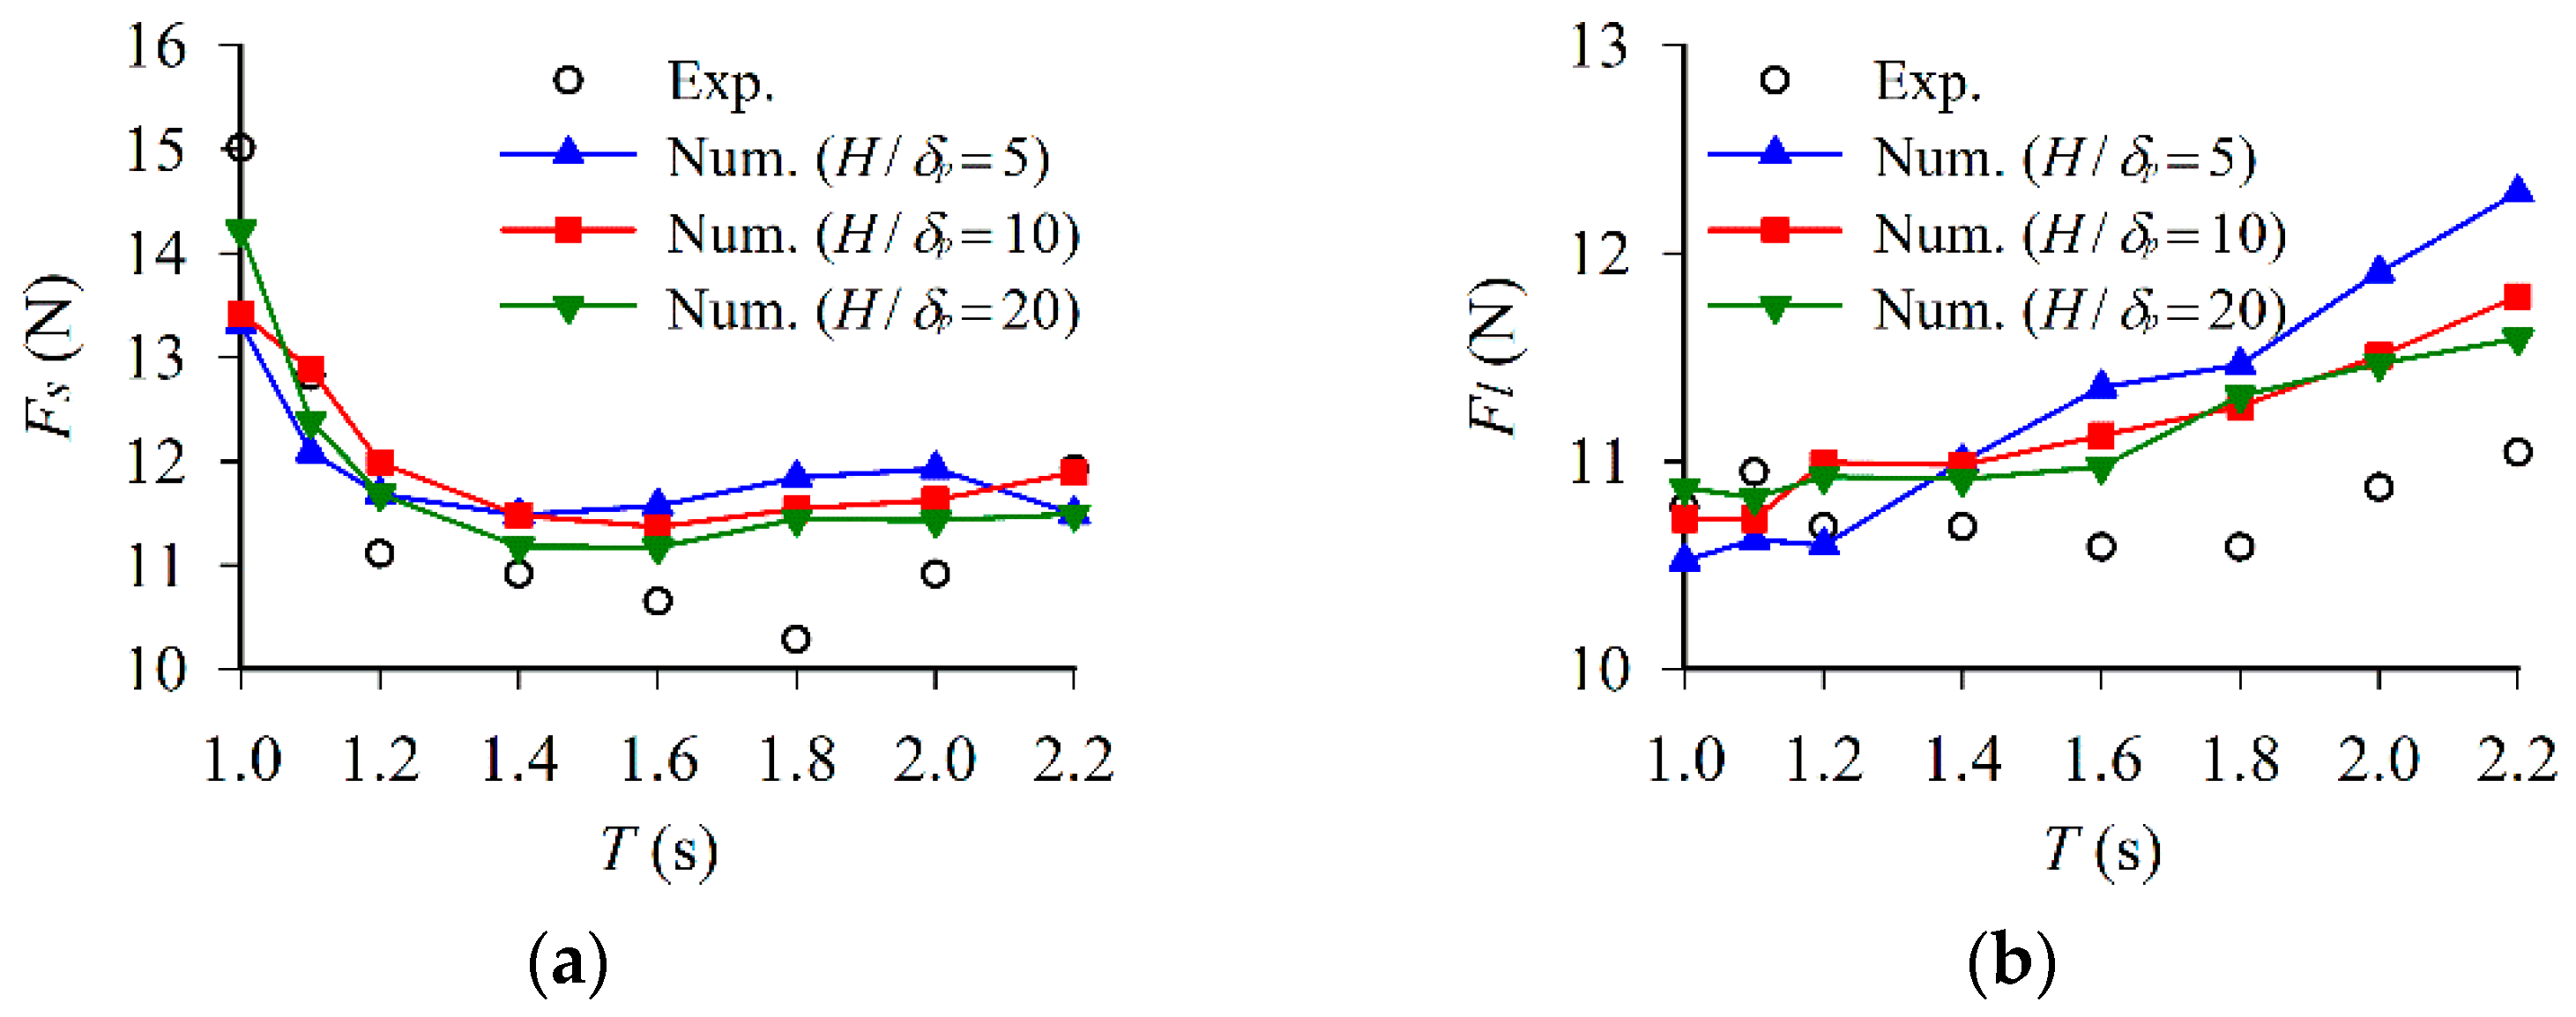
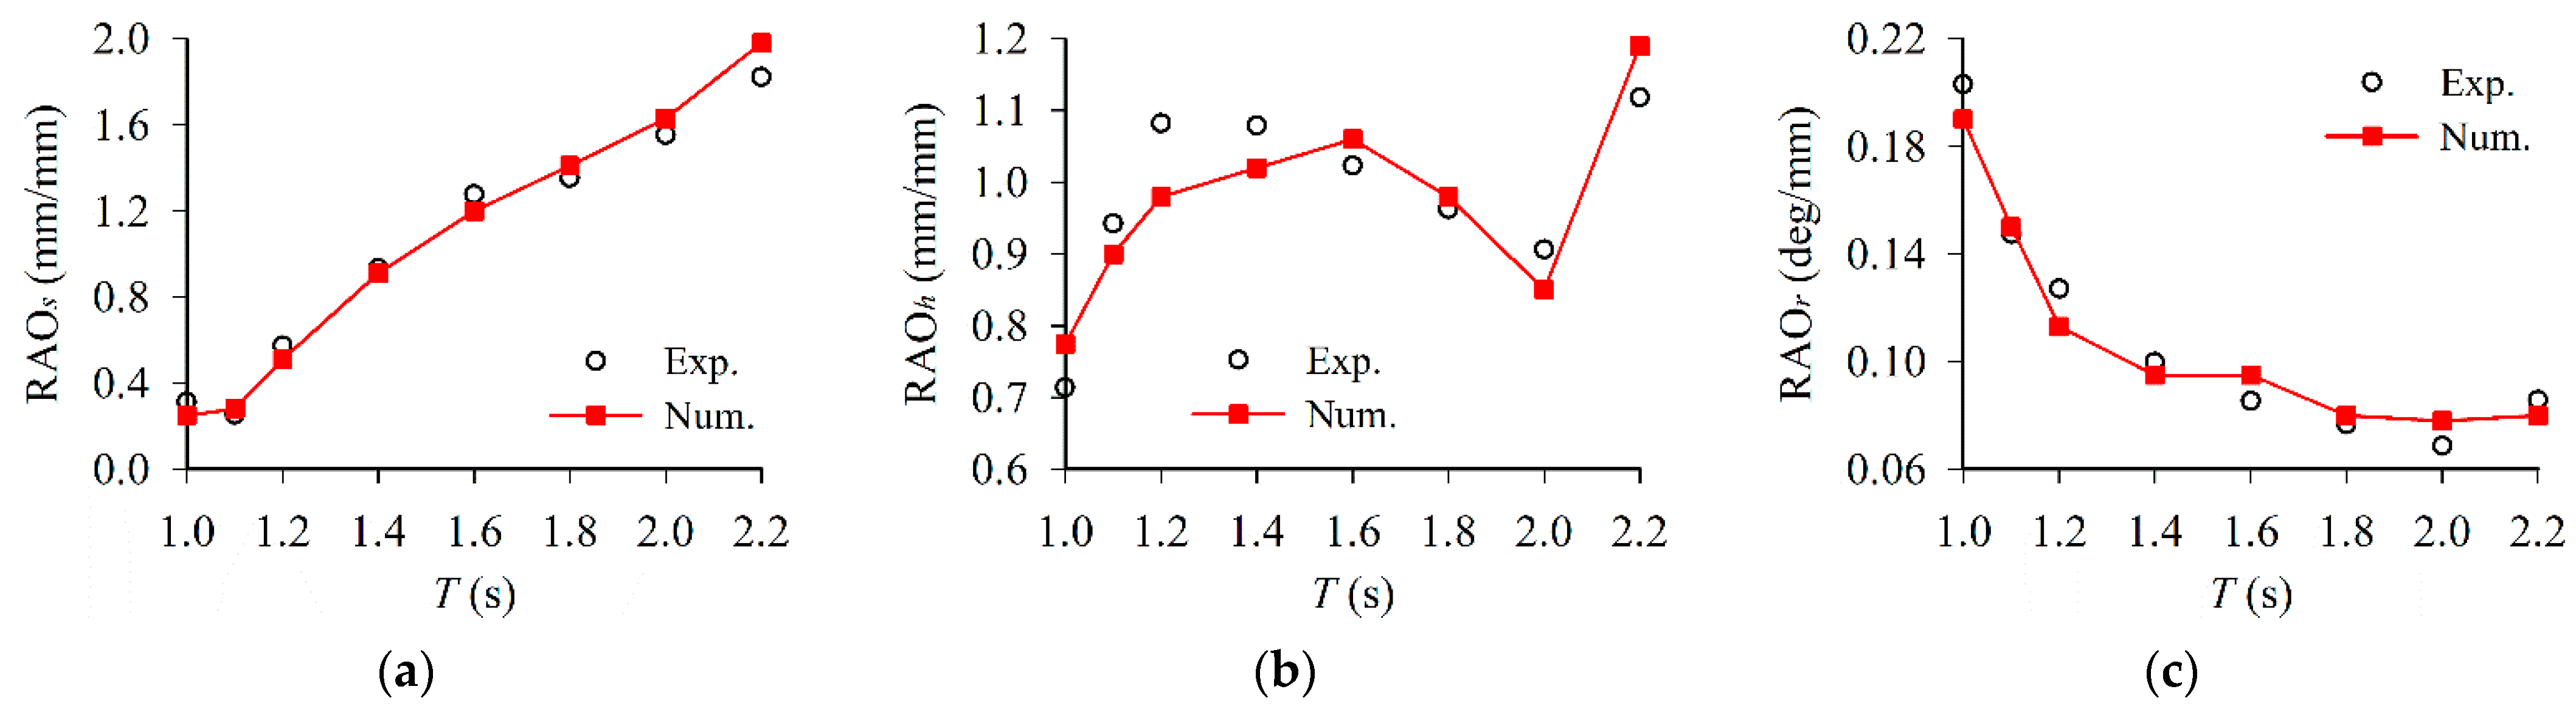
3.2.2. Comparison of Experimental and Numerical Results
3.3. Validation Case 2
3.3.1. Setup of Physical and Numerical Models
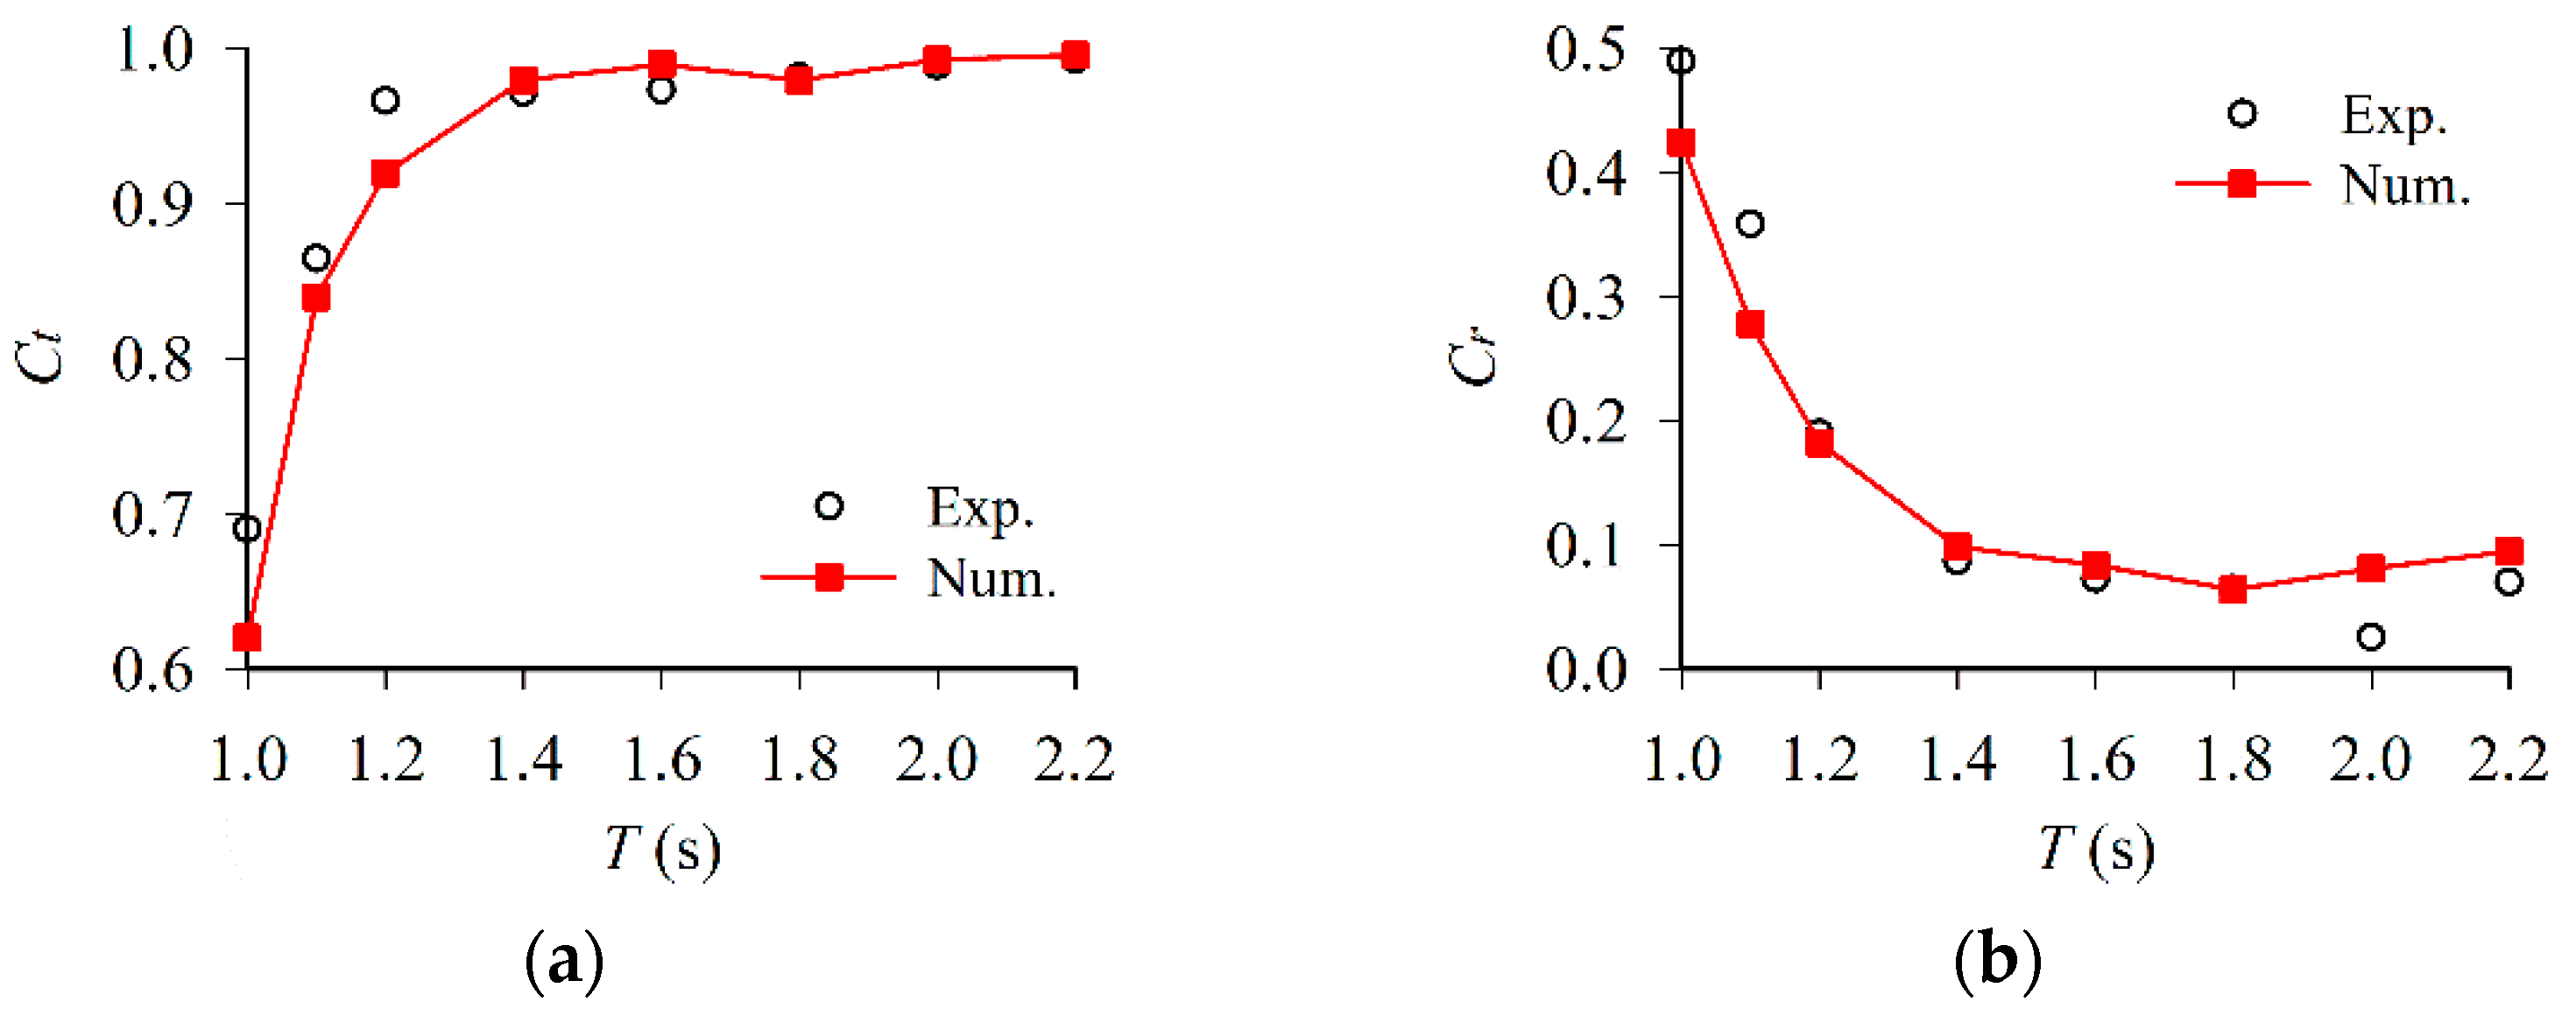
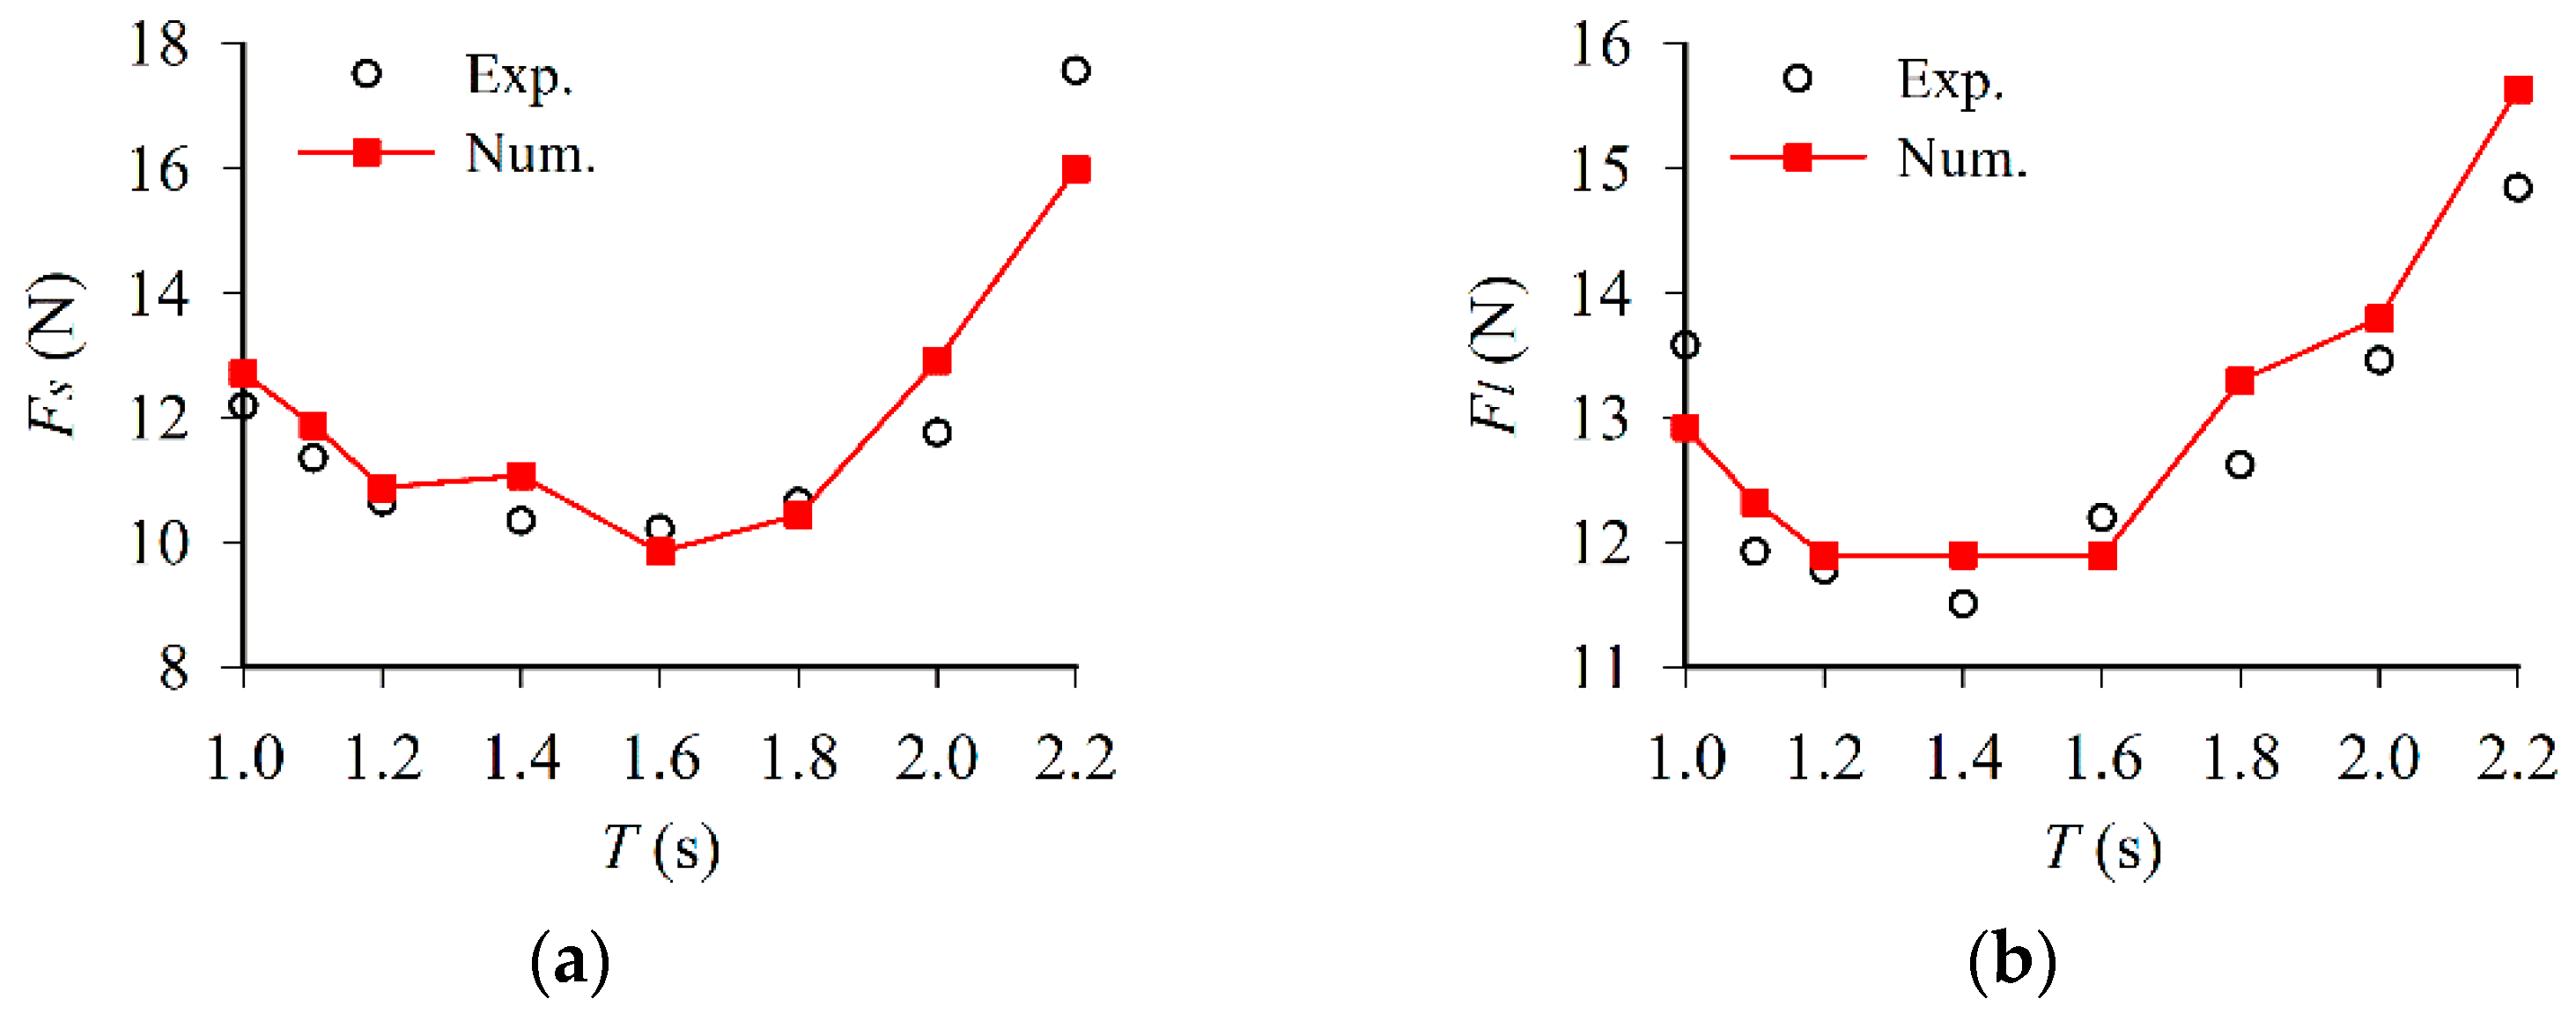
3.3.2. Comparison of Experimental and Numerical Results
4. Results and Analyses
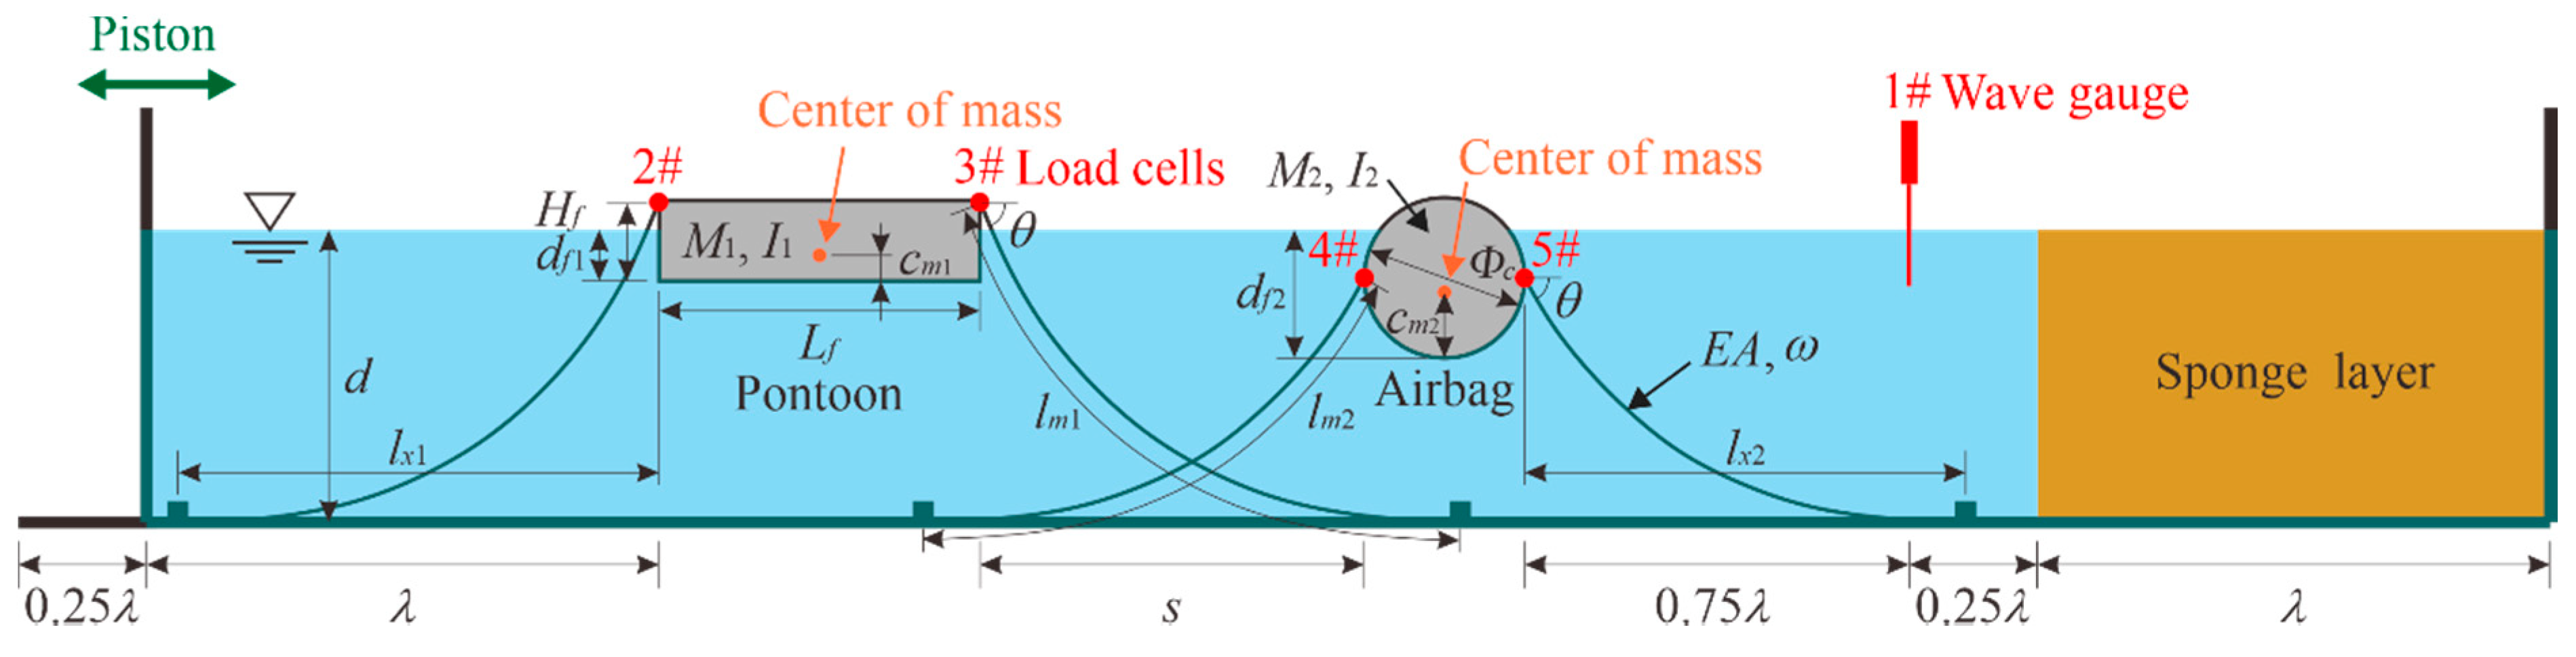
4.1. Setup of Double-Row Floating Breakwater
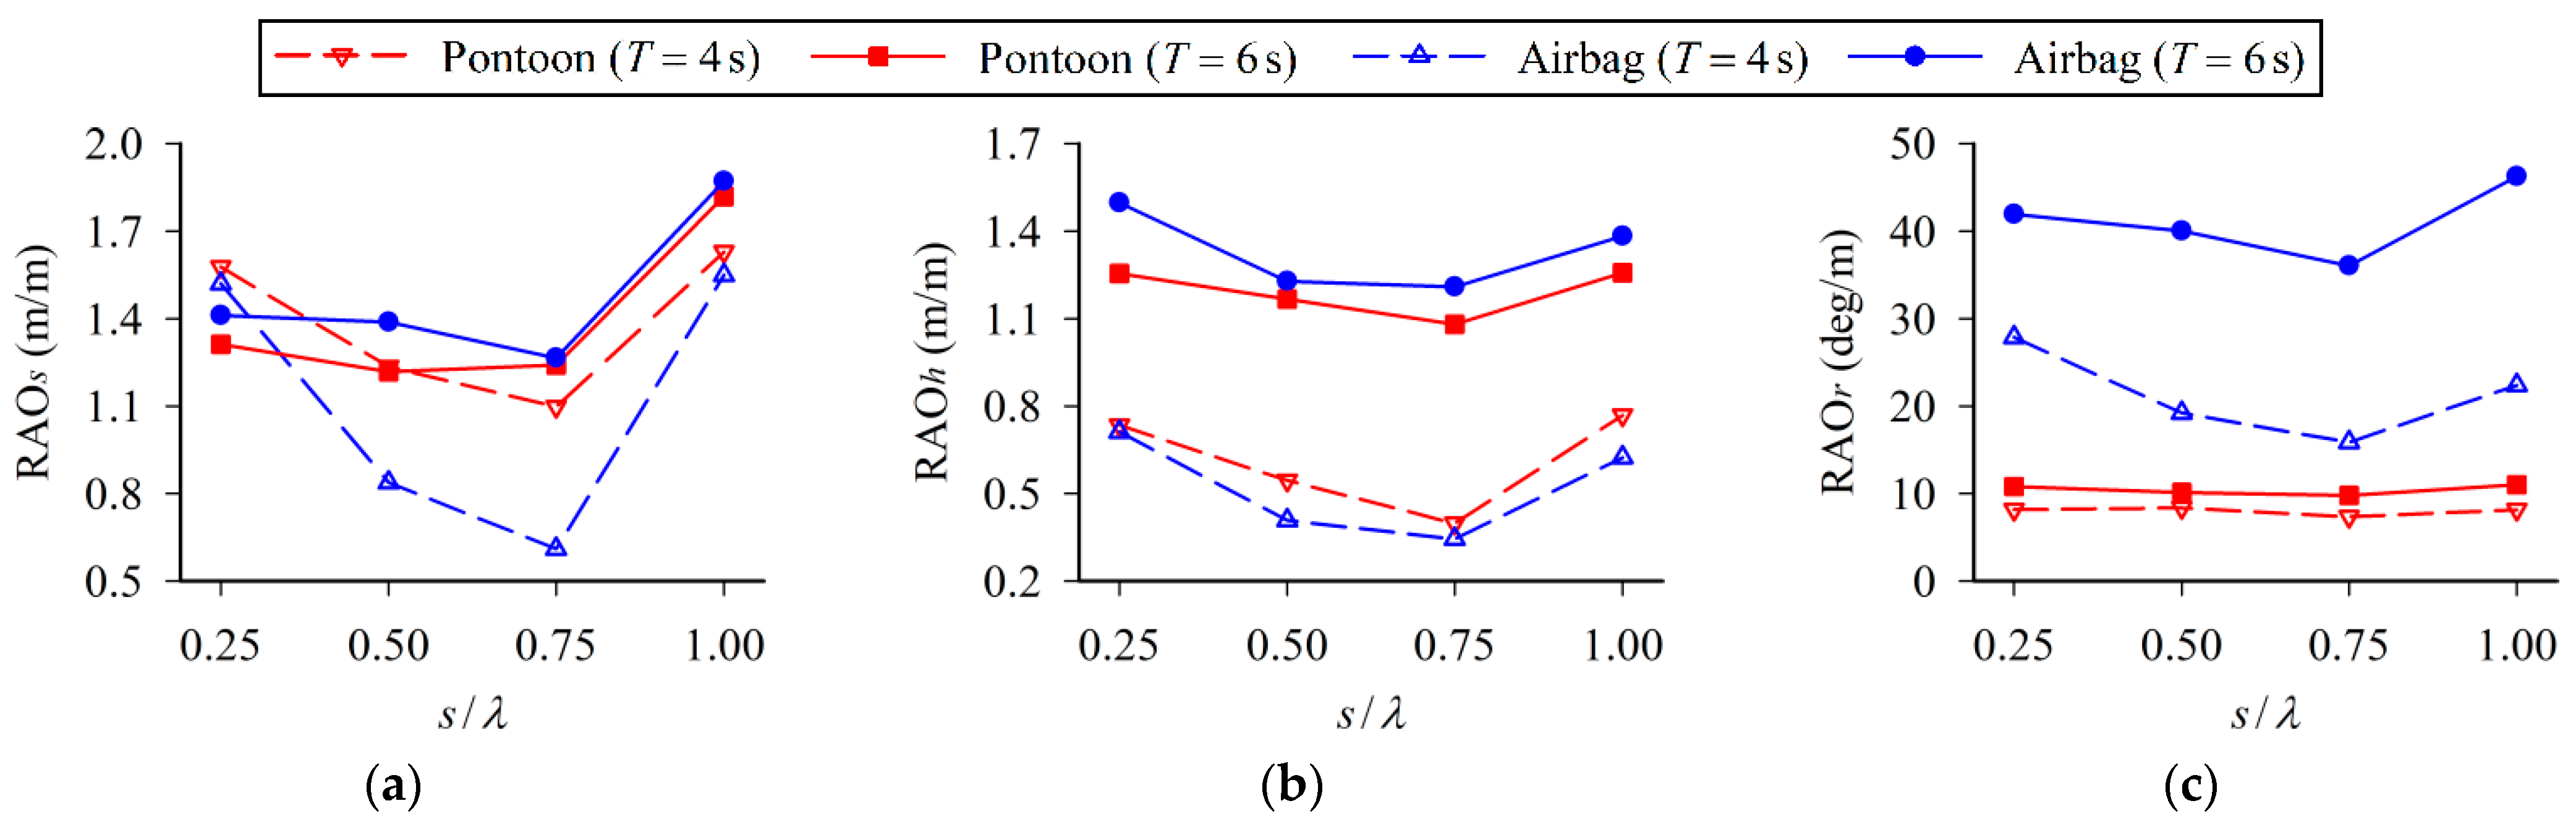
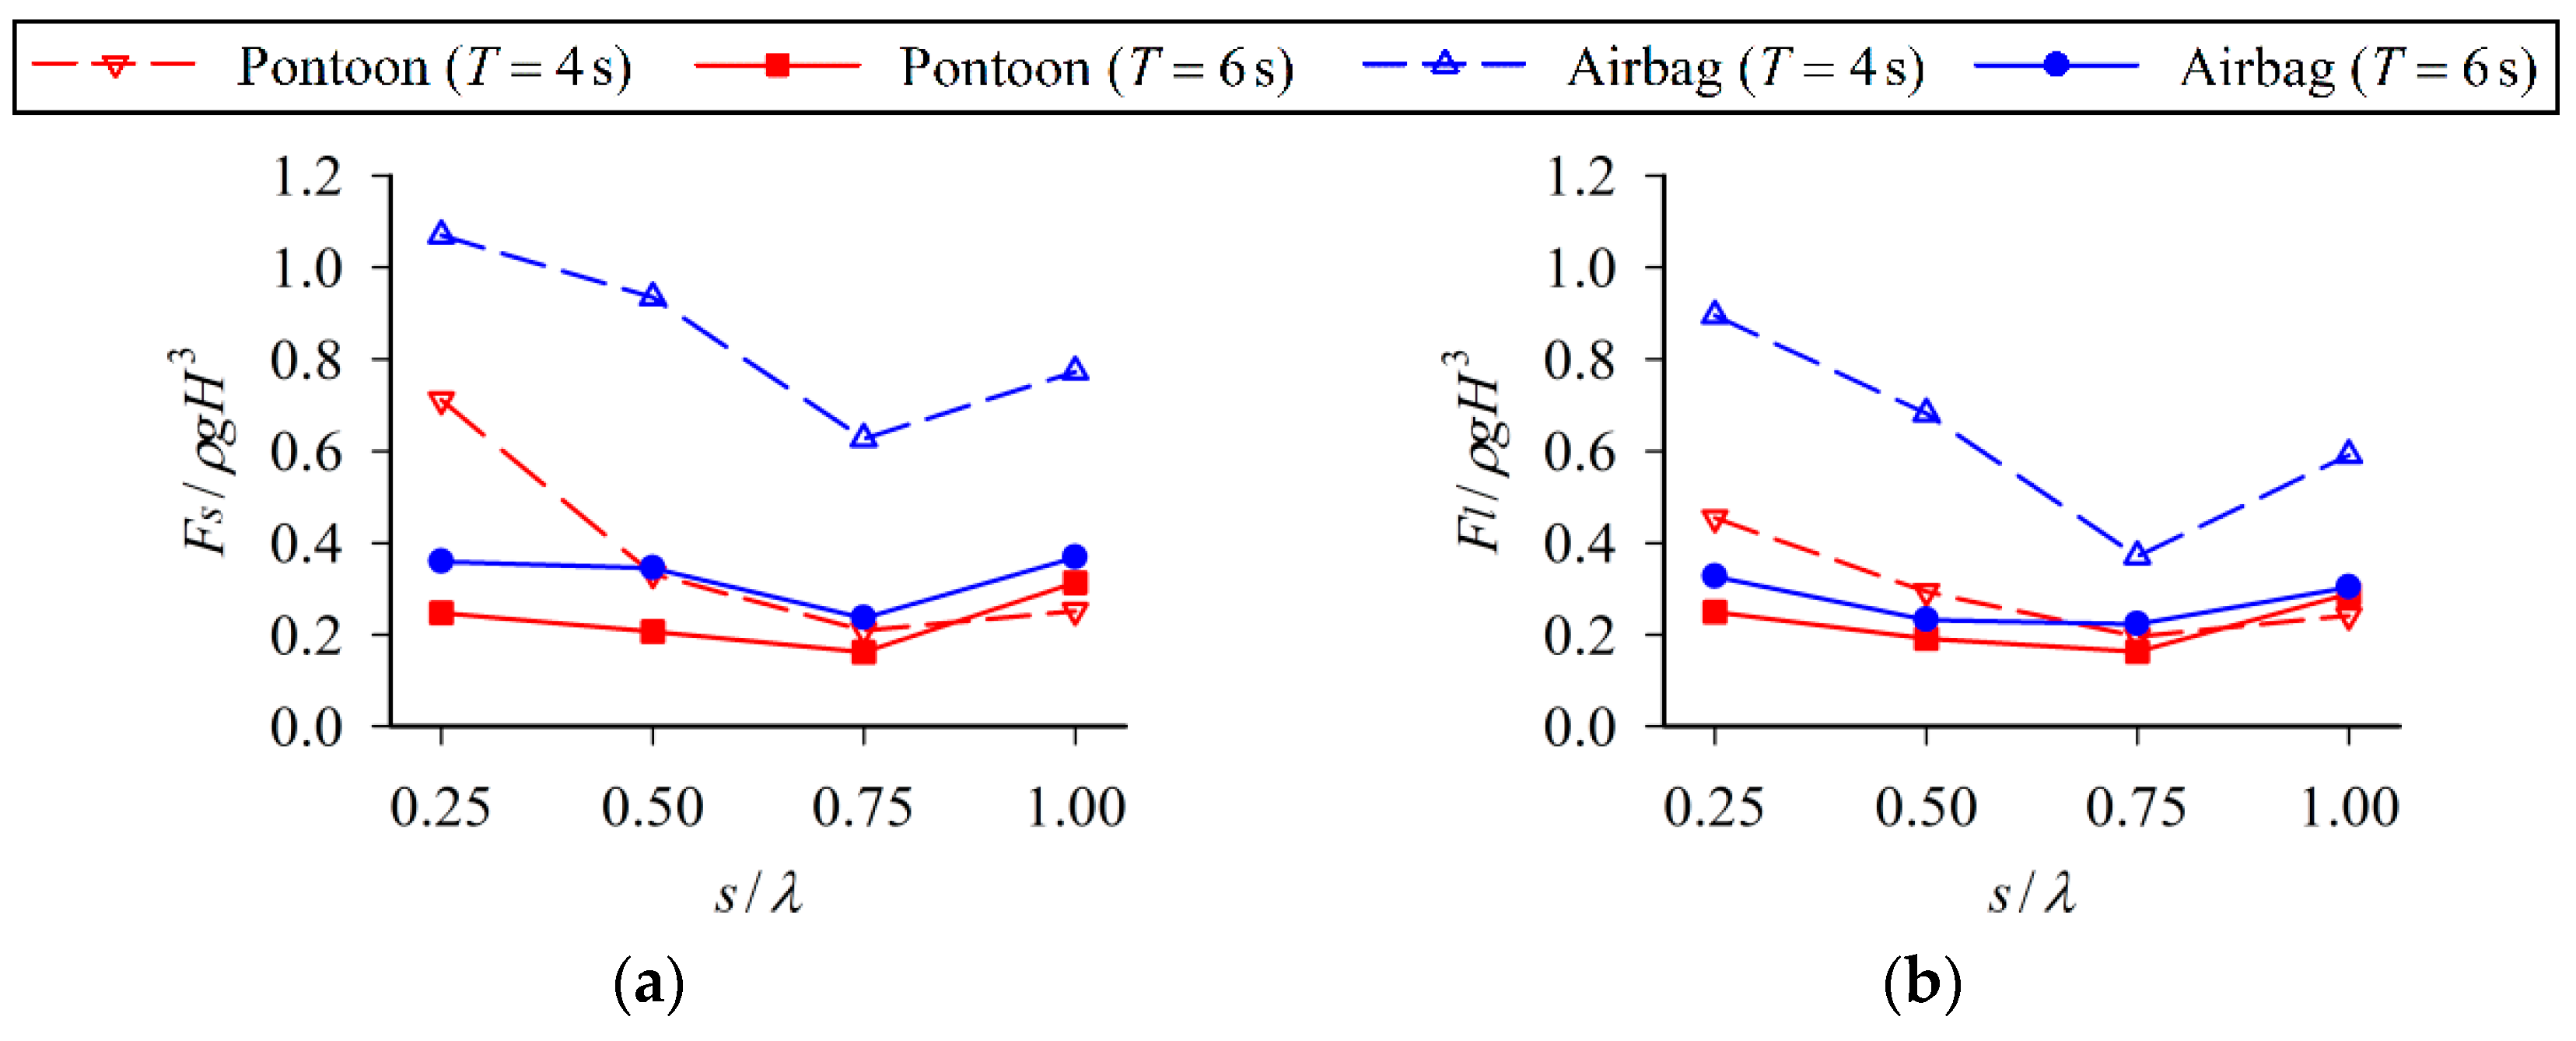
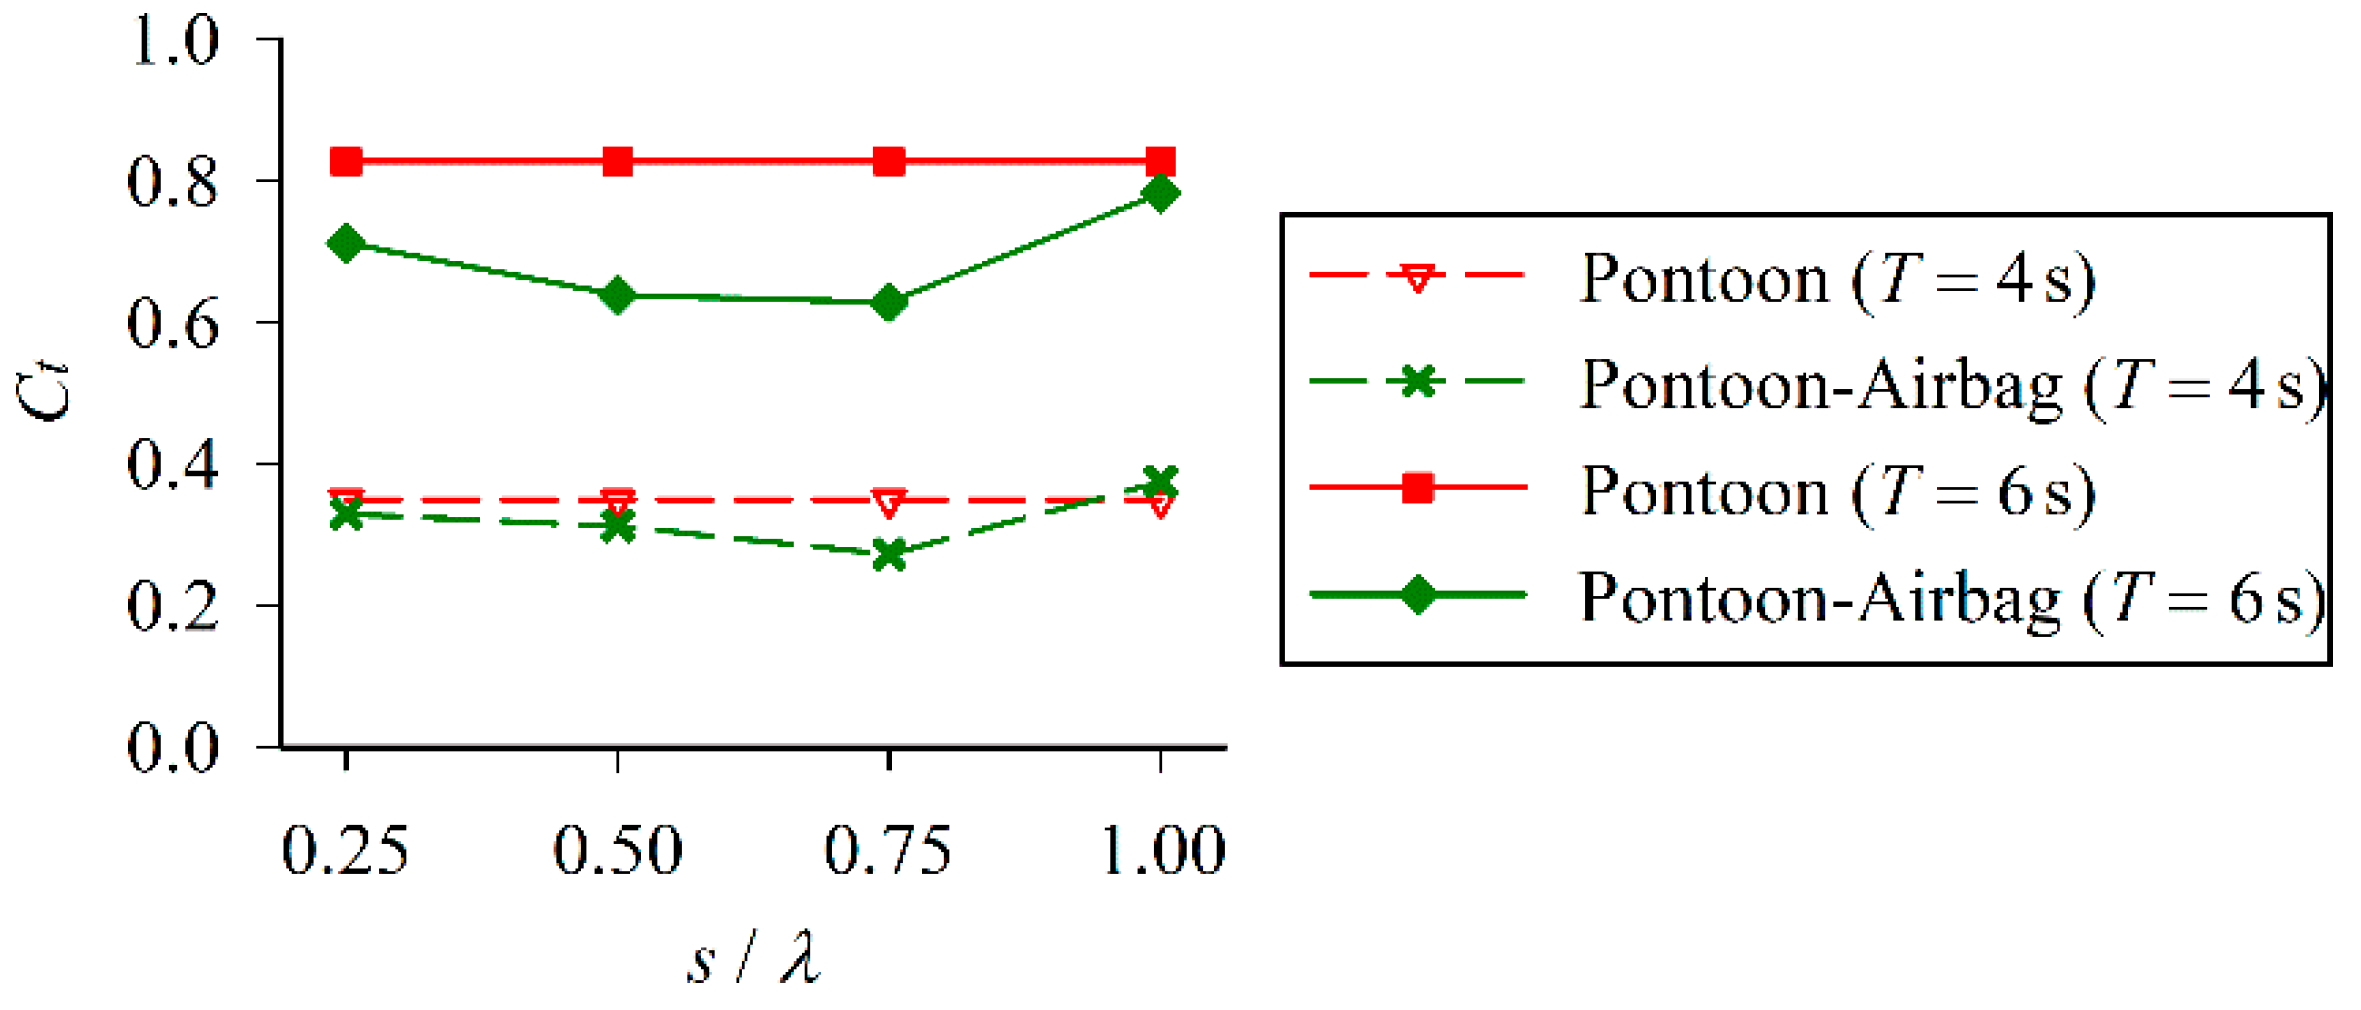
4.2. Influence of Separation Distance
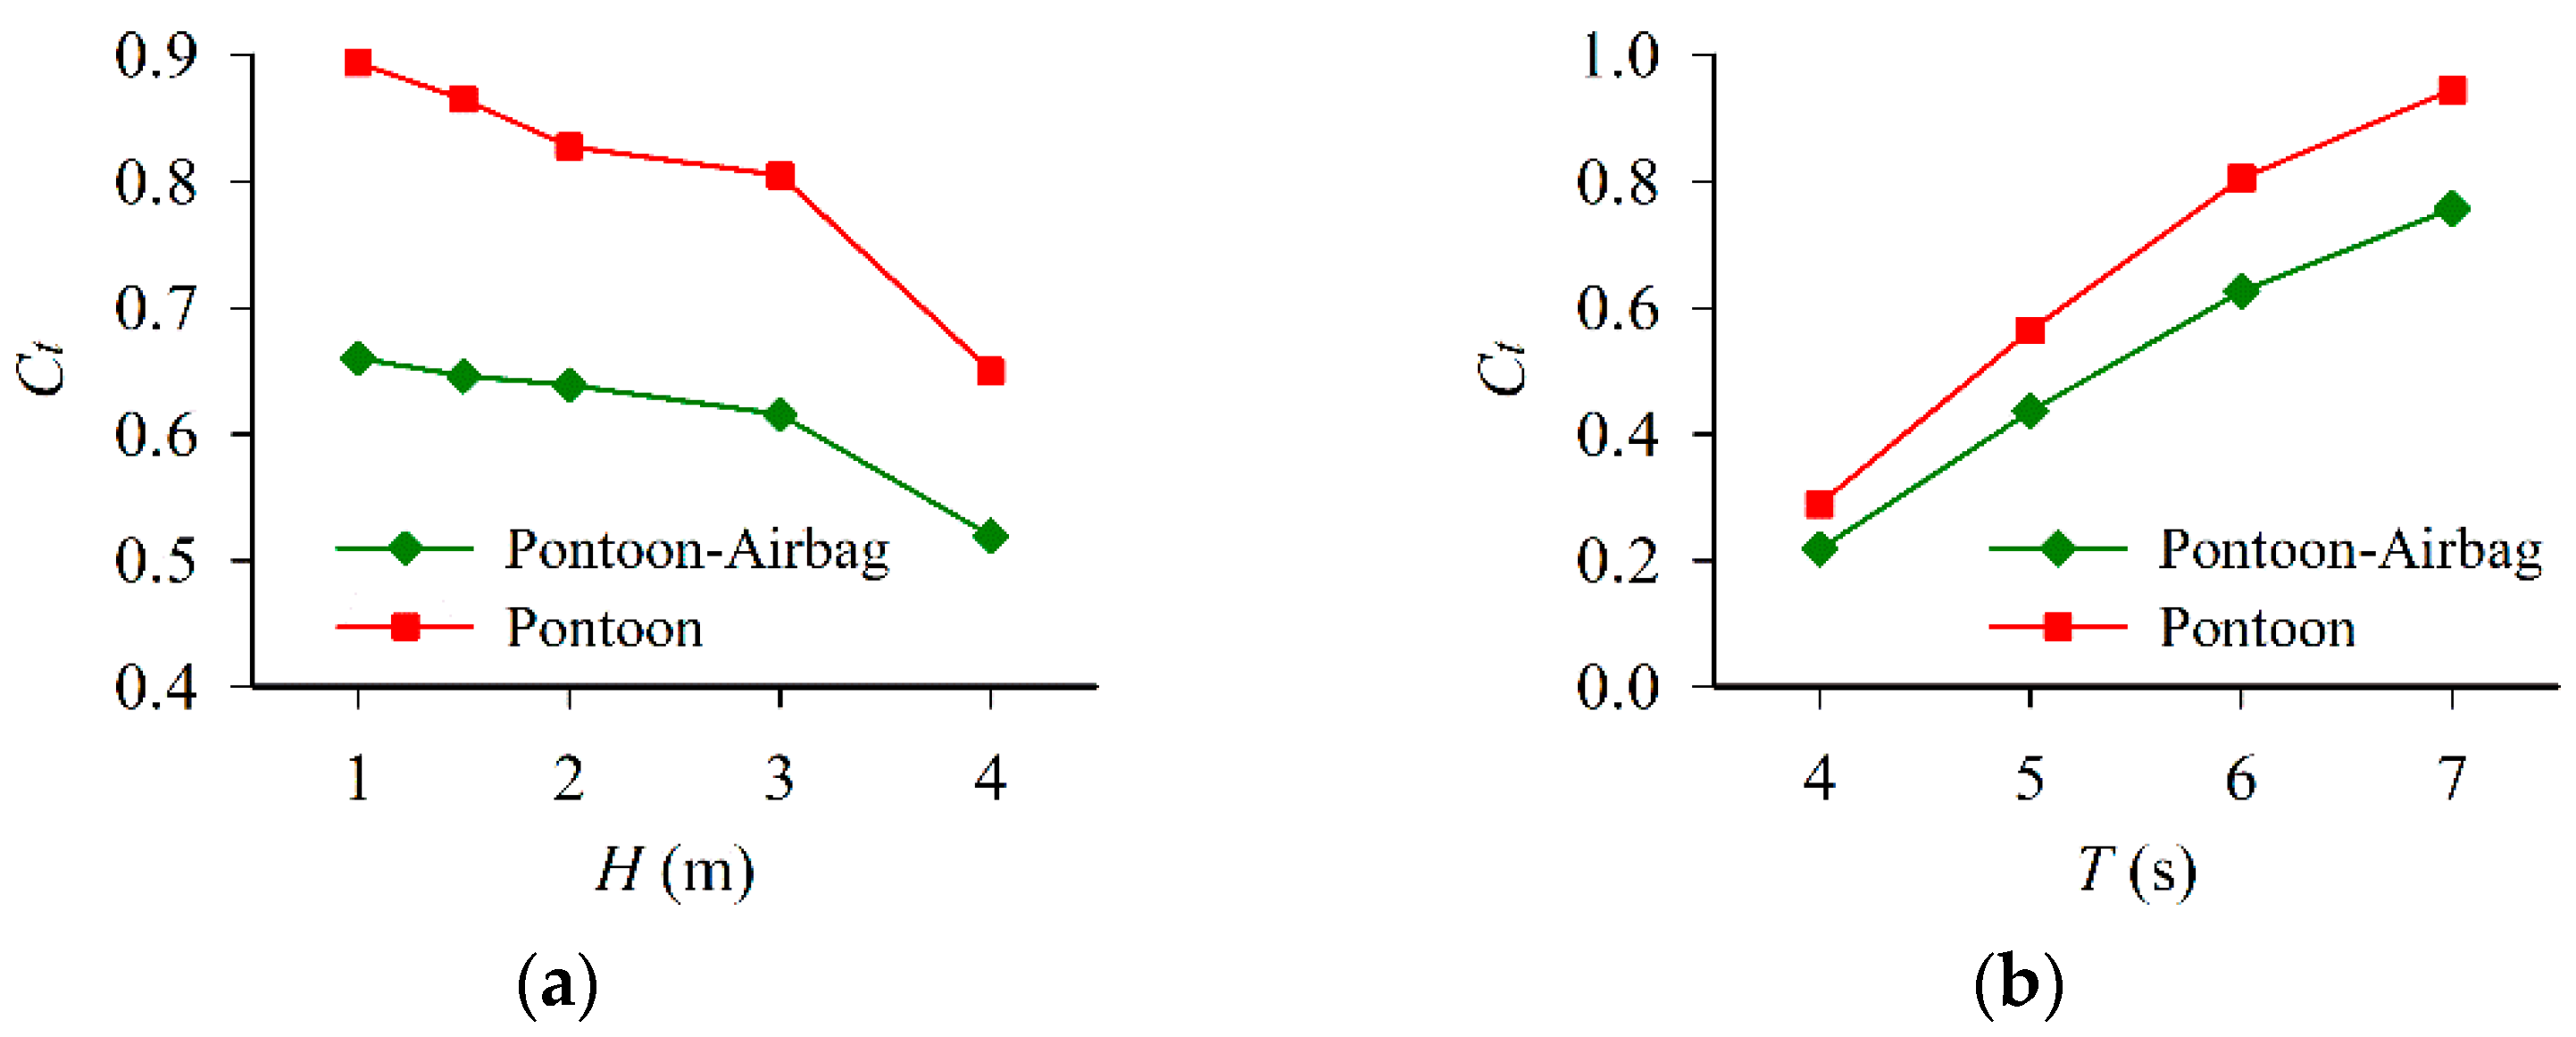
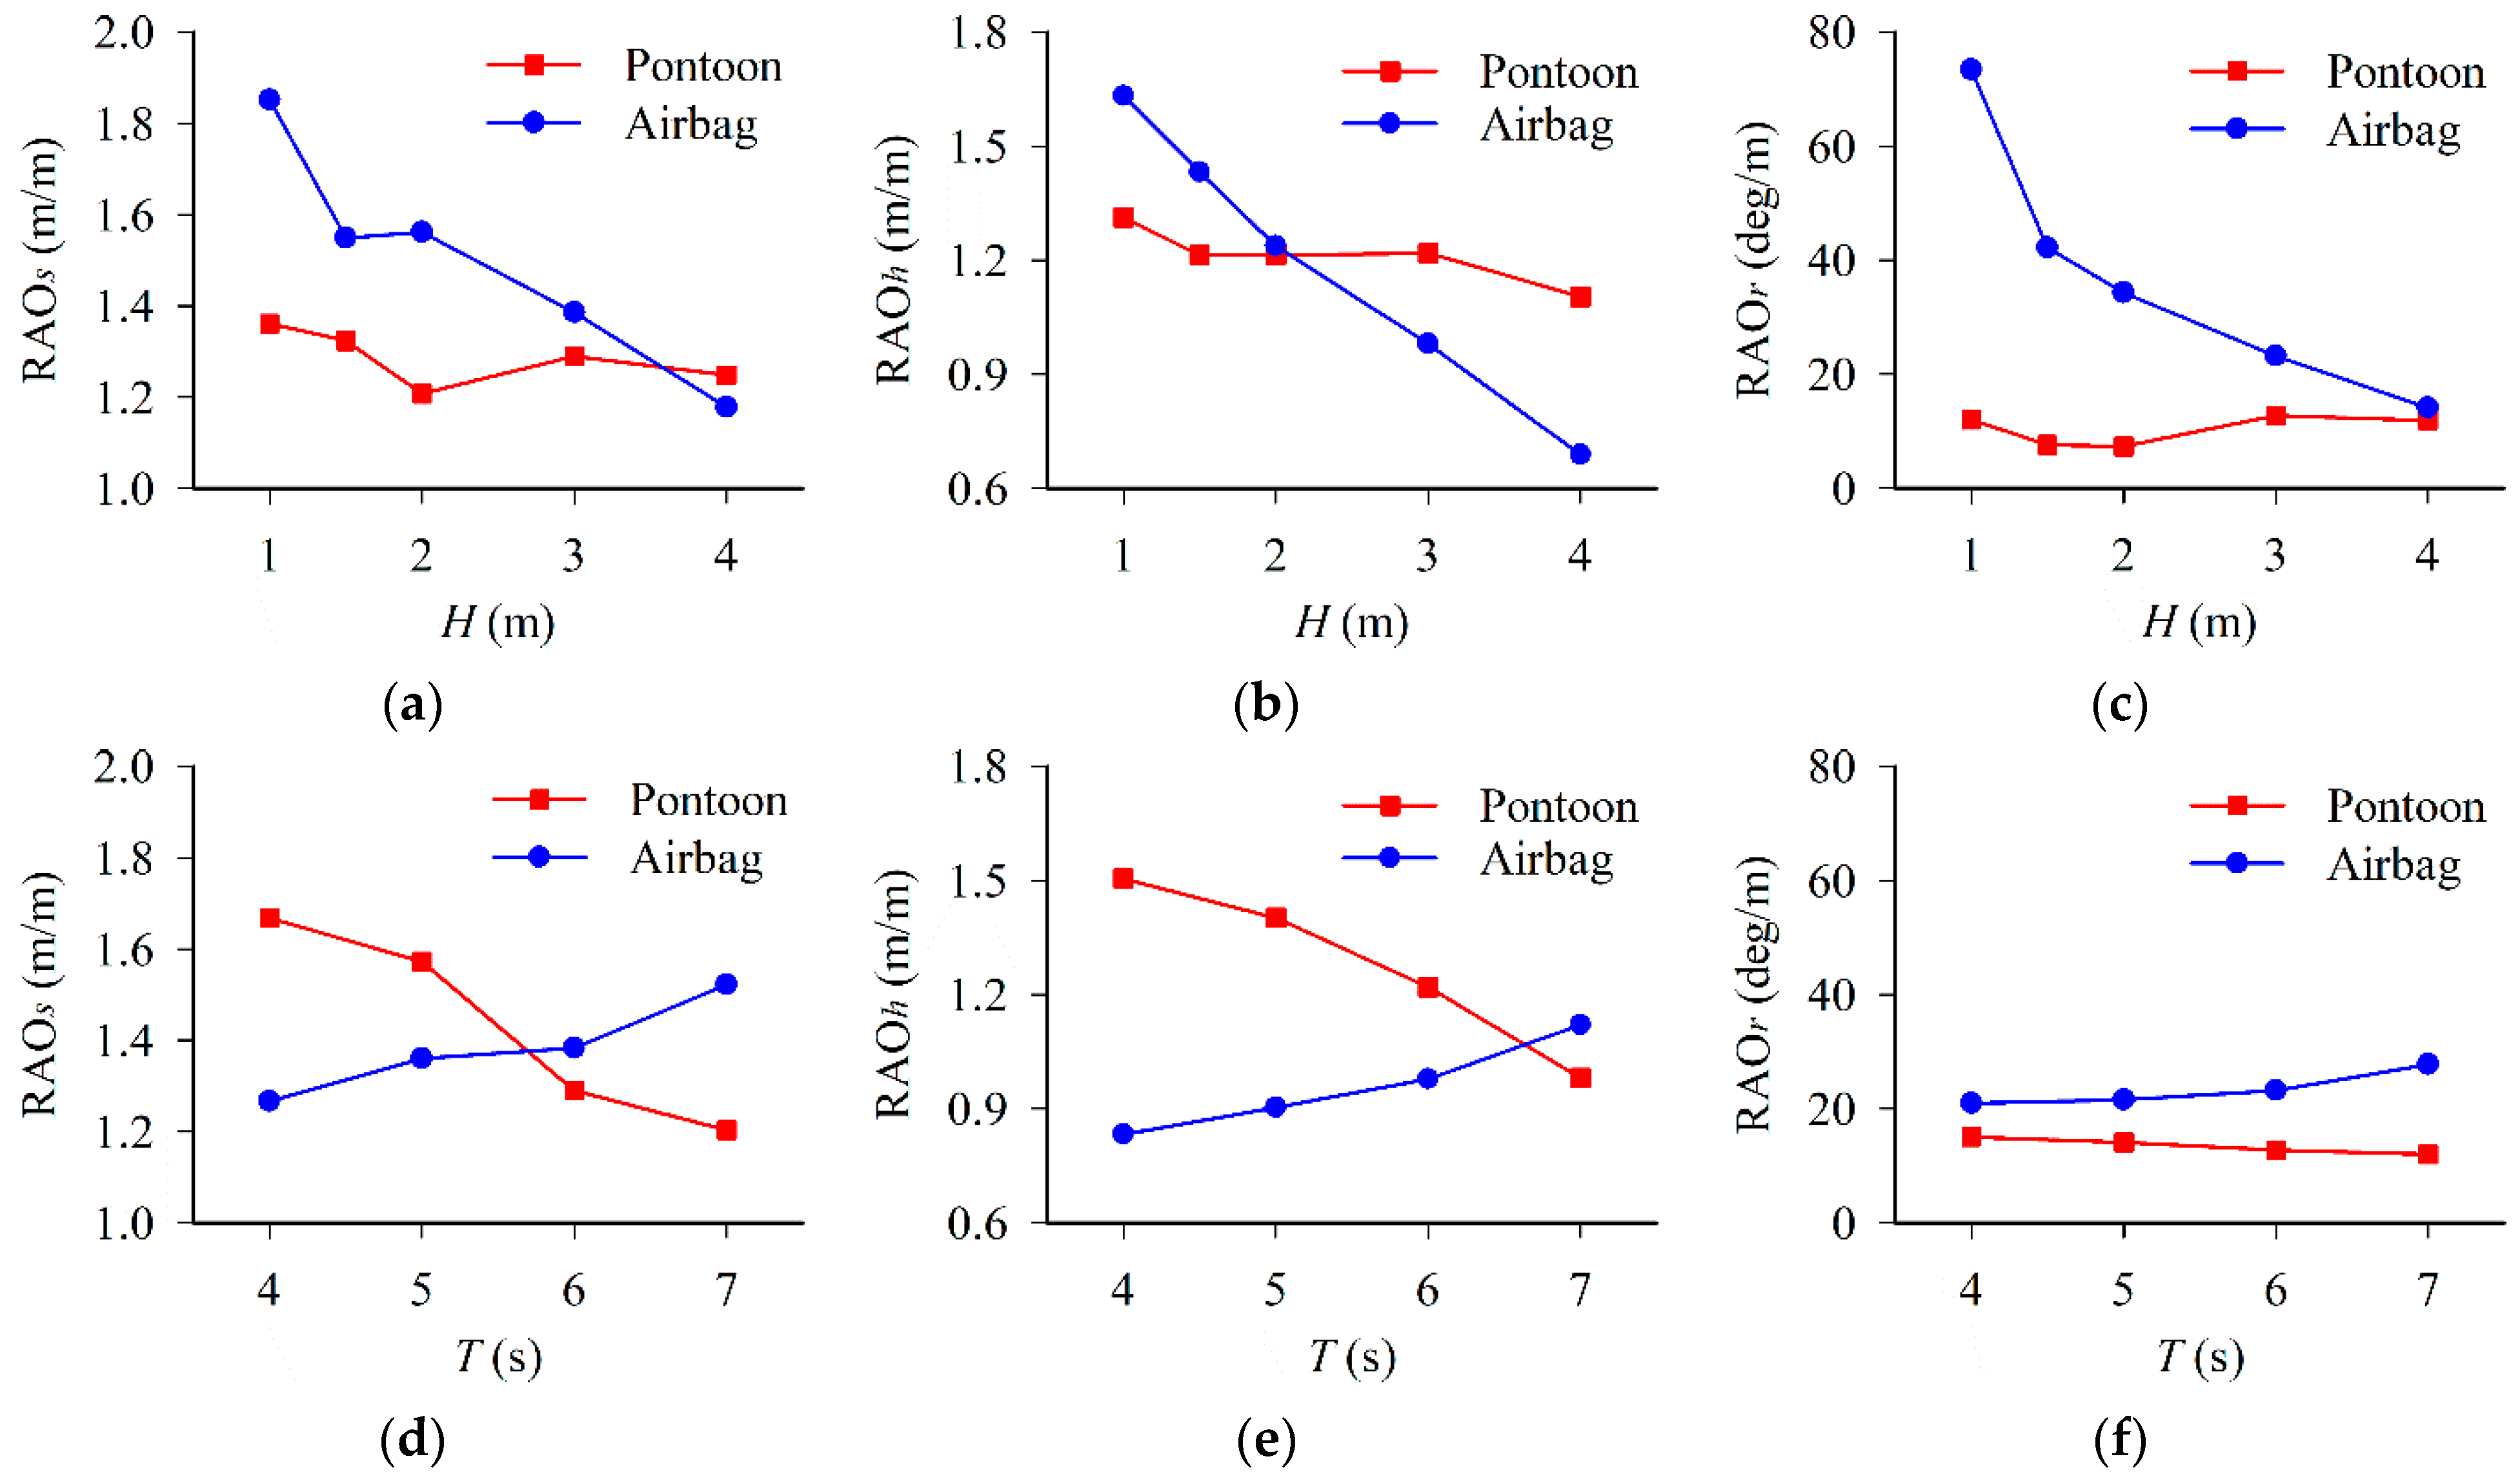
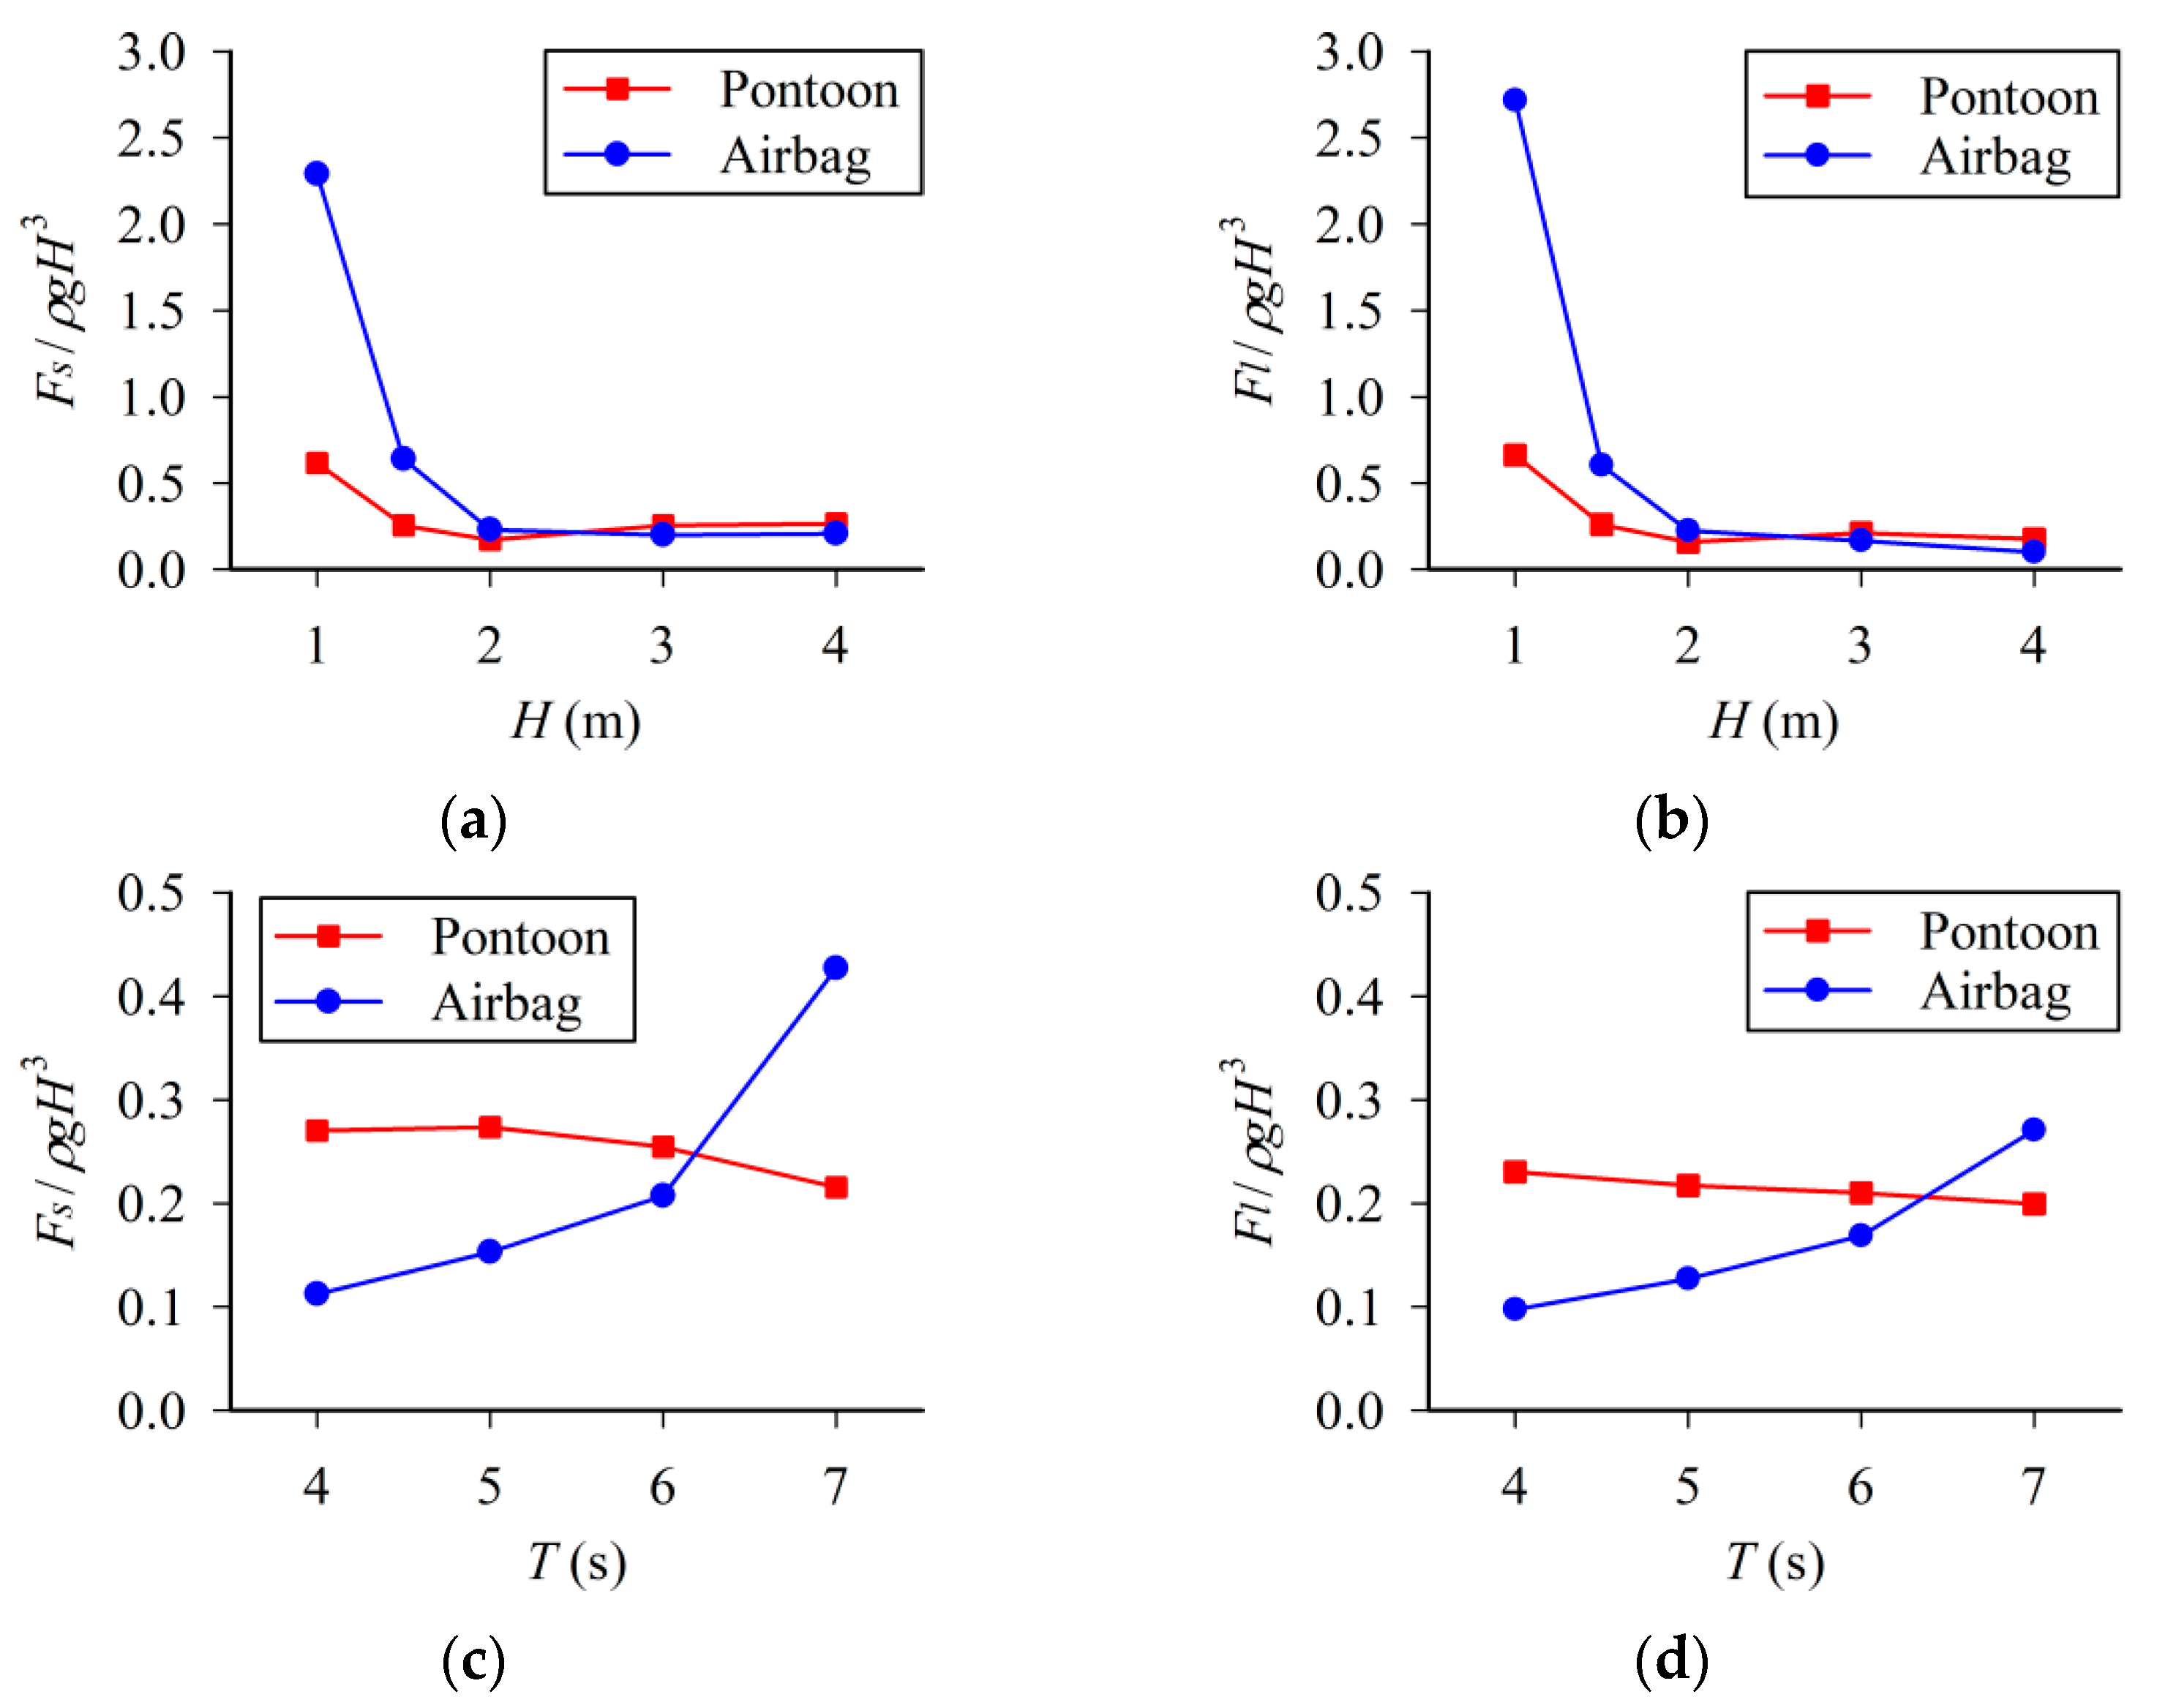
4.3. Influence of Wave Parameters
5. Conclusions and Future Perspectives
- (1)
- The wave transmission coefficient, response amplitude operators and mooring force of the double-row floating breakwater first decrease then increase with the increase of the separation distance between pontoon and airbag. The optimal separation distance is 0.75 times the wavelength.
- (2)
- At the optimal separation distance and within the concerned 1–4 m wave heights and 4–7 s wave periods, the pontoon-airbag system presents better wave attenuation performance than a single pontoon. This improvement weakens as wave height increases while strengthens as the wave period increases.
- (3)
- The wave transmission coefficient, response amplitude operators and mooring force of the double-row floating breakwater all decrease with the increase of incident wave height, which indicates its potential application in a high-wave regime.
- (4)
- The wave transmission coefficient of the pontoon-airbag system, the response amplitude operators and mooring force of the airbag increase with the increase of incident wavelength, while the response amplitude operators and mooring force of the pontoon decrease.
- (1)
- The airbag was temporarily assumed to be rigid and its mass distribution did not change with the airbag motion. To reflect its physical behavior more realistically, the external flexibility and the internal ballast water should be taken into account.
- (2)
- No turbulence model was adopted in the fluid equations, and the lumped-mass mooring model neglected the hydrodynamic, inertial, damping, and frictional contributions. To compute the hydrodynamic characteristics of floating breakwater more accurately, a suitable turbulence model and a sophisticated mooring model should be employed.
- (3)
- Only the influence of separation distance and wave parameters on the hydrodynamic characteristics of double-row floating breakwater was analyzed. To design the floating breakwater more systematically, a parametric study of the pontoon and airbag should be conducted.
Author Contributions
Funding
Institutional Review Board Statement
Informed Consent Statement
Data Availability Statement
Acknowledgments
Conflicts of Interest
References
- Dai, J.; Wang, C.M.; Utsunomiya, T.; Duan, W. Review of recent research and developments on floating breakwaters. Ocean Eng. 2018, 158, 132–151. [Google Scholar] [CrossRef]
- Mei, C.C.; Black, J.L. Scattering of surface waves by rectangular obstacles in waters of finite depth. J. Fluid Mech. 1969, 38, 499–511. [Google Scholar] [CrossRef]
- Delavari, E.; Gharabaghi, A.R.M. Simulating regular wave effects on a pile-moored floating breakwater using a modified WCSPH method. J. Waterw. Port Coast. Ocean Eng. 2017, 143, 04017021. [Google Scholar] [CrossRef]
- Gesraha, M.R. Analysis of PI shaped floating breakwater in oblique waves: I. Impervious rigid wave boards. Appl. Ocean Res. 2006, 28, 327–338. [Google Scholar] [CrossRef]
- Koraim, A.S.; Rageh, O.S. Effect of under connected plates on the hydrodynamic efficiency of the floating breakwater. China Ocean Eng. 2014, 28, 349–362. [Google Scholar] [CrossRef]
- Koo, W. Nonlinear time–domain analysis of motion-restrained pneumatic floating breakwater. Ocean Eng. 2009, 36, 723–731. [Google Scholar] [CrossRef]
- He, F.; Huang, Z.; Law, A.W.-K. Hydrodynamic performance of a rectangular floating breakwater with and without pneumatic chambers: An experimental study. Ocean Eng. 2012, 51, 16–27. [Google Scholar] [CrossRef]
- Wang, H.Y.; Sun, Z.C. Experimental study of a porous floating breakwater. Ocean Eng. 2010, 37, 520–527. [Google Scholar] [CrossRef]
- Mani, J.S. Design of Y-frame floating breakwater. J. Waterw. Port Coast. Ocean Eng. 1991, 117, 105–119. [Google Scholar] [CrossRef]
- Nasri, B.; Moghim, M.N.; Badri, M.A. Experimental study on trapezoidal pontoon-type floating breakwaters with attached porous plates. J. Ocean Eng. Mar. Energy 2021, 7, 41–57. [Google Scholar] [CrossRef]
- Dong, G.H.; Zheng, Y.N.; Li, Y.C.; Teng, B.; Guan, C.T.; Lin, D.F. Experiments on wave transmission coefficients of floating breakwaters. Ocean Eng. 2008, 35, 931–938. [Google Scholar] [CrossRef]
- Williams, A.N.; Abul-Azm, A.G. Dual pontoon floating breakwater. Ocean Eng. 1997, 24, 465–478. [Google Scholar] [CrossRef]
- Ji, C.-Y.; Chen, X.; Cui, J.; Gaidai, O.; Incecik, A. Experimental study on configuration optimization of floating breakwaters. Ocean Eng. 2016, 117, 302–310. [Google Scholar] [CrossRef] [Green Version]
- Ji, C.; Cheng, Y.; Yang, K.; Oleg, G. Numerical and experimental investigation of hydrodynamic performance of a cylindrical dual pontoon-net floating breakwater. Coast. Eng. 2017, 129, 1–16. [Google Scholar] [CrossRef]
- Syed, S.A.; Mani, J.S. Performance of rigidly interconnected multiple floating pontoons. J. Nav. Arch. Mar. Eng. 2004, 1, 3–17. [Google Scholar] [CrossRef] [Green Version]
- Williams, A.N.; Lee, H.S.; Huang, Z. Floating pontoon breakwaters. Ocean Eng. 2000, 27, 221–240. [Google Scholar] [CrossRef]
- Ji, C.; Deng, X.; Cheng, Y. An experimental study of double-row floating breakwaters. J. Mar. Sci. Technol. 2019, 24, 359–371. [Google Scholar] [CrossRef]
- Ji, C.-Y.; Zheng, R.-S.; Cui, J.; Wang, Z.-L. Experimental evaluation of wave transmission and dynamics of double-row floating breakwaters. J. Waterw. Port Coast. Ocean Eng. 2019, 145, 04019013. [Google Scholar] [CrossRef]
- Duan, W.; Xu, S.; Xu, Q.; Ertekin, R.C.; Ma, S. Performance of an F-type floating breakwater: A numerical and experimental study. Proc. Inst. Mech. Eng. Part M-J. Eng. Marit. Environ. 2017, 231, 583–599. [Google Scholar] [CrossRef]
- Vijay, K.G.; Venkateswarlu, V.; Nishad, C.S. Wave scattering by inverted trapezoidal porous boxes using dual boundary element method. Ocean Eng. 2021, 219, 108149. [Google Scholar] [CrossRef]
- Fouladi, M.Q.; Badiei, P.; Vahdani, S. A study on full interaction of water waves with moored rectangular floating breakwater by applying 2DV scaled boundary finite element method. Ocean Eng. 2021, 220, 108450. [Google Scholar] [CrossRef]
- Peng, W.; Lee, K.-H.; Shin, S.-H.; Mizutani, N. Numerical simulation of interactions between water waves and inclined-moored submerged floating breakwaters. Coast. Eng. 2013, 82, 76–87. [Google Scholar] [CrossRef]
- Qu, K.; Sun, W.Y.; Kraatz, S.; Deng, B.; Jiang, C.B. Effects of floating breakwater on hydrodynamic load of low-lying bridge deck under impact of cnoidal wave. Ocean Eng. 2020, 203, 107217. [Google Scholar] [CrossRef]
- Zhan, J.-M.; Chen, X.-B.; Gong, Y.-J.; Hu, W.-Q. Numerical investigation of the interaction between an inverse T-type fixed/floating breakwater and regular/irregular waves. Ocean Eng. 2017, 137, 110–119. [Google Scholar] [CrossRef]
- Zhang, H.; Zhou, B.; Vogel, C.; Willden, R.; Zang, J.; Zhang, L. Hydrodynamic performance of a floating breakwater as an oscillating-buoy type wave energy converter. Appl. Energy 2020, 257, 113996. [Google Scholar] [CrossRef]
- Monaghan, J.J. Smoothed particle hydrodynamics. Annu. Rev. Astron. Astrophys. 1992, 30, 543–574. [Google Scholar] [CrossRef]
- Monaghan, J.J. Smoothed particle hydrodynamics. Rep. Prog. Phys. 2005, 68, 1703–1759. [Google Scholar] [CrossRef]
- Zhang, A.-M.; Sun, P.-N.; Ming, F.-R.; Colagrossi, A. Smoothed particle hydrodynamics and its applications in fluid-structure interactions. J. Hydrodyn. 2017, 29, 187–216. [Google Scholar] [CrossRef]
- Gomez-Gesteira, M.; Rogers, B.D.; Dalrymple, R.A.; Crespo, A.J.C. State-of-the-art of classical SPH for free-surface flows. J. Hydraul. Res. 2010, 48, 6–27. [Google Scholar] [CrossRef]
- Liu, M.B.; Liu, G.R. Smoothed particle hydrodynamics (SPH): An overview and recent developments. Arch. Comput. Methods Eng. 2010, 17, 25–76. [Google Scholar] [CrossRef] [Green Version]
- Lucy, L.B. A numerical approach to the testing of the fission hypothesis. Astron. J. 1977, 82, 1013–1024. [Google Scholar] [CrossRef]
- Gingold, R.A.; Monaghan, J.J. Smoothed particle hydrodynamics: Theory and application to non-spherical stars. Mon. Not. R. Astron. Soc. 1977, 181, 375–389. [Google Scholar] [CrossRef]
- Monaghan, J.J.; Rafiee, A. A simple SPH algorithm for multi-fluid flow with high density ratios. Int. J. Numer. Methods Fluids 2013, 71, 537–561. [Google Scholar] [CrossRef]
- Monaghan, J.J. Simulating free surface flows with SPH. J. Comput. Phys. 1994, 110, 399–406. [Google Scholar] [CrossRef]
- Shao, S.; Lo, E.Y.M. Incompressible SPH method for simulating Newtonian and non-Newtonian flows with a free surface. Adv. Water Resour. 2003, 26, 787–800. [Google Scholar] [CrossRef]
- Gray, J.P.; Monaghan, J.J.; Swift, R.P. SPH elastic dynamics. Comput. Meth. Appl. Mech. Eng. 2001, 190, 6641–6662. [Google Scholar] [CrossRef]
- Bui, H.H.; Fukagawa, R.; Sako, K.; Ohno, S. Lagrangian meshfree particles method (SPH) for large deformation and failure flows of geomaterial using elastic-plastic soil constitutive model. Int. J. Numer. Anal. Methods Geomech. 2008, 32, 1537–1570. [Google Scholar] [CrossRef]
- Liu, M.B.; Liu, G.R.; Lam, K.Y.; Zong, Z. Smoothed particle hydrodynamics for numerical simulation of underwater explosion. Comput. Mech. 2003, 30, 106–118. [Google Scholar] [CrossRef]
- Alaa, G.; Francomanob, E.; Tortoricib, A.; Toscanob, E.; Violaa, F. Smoothed Particle ElectroMagnetics: A mesh-free solver for transients. J. Comput. Appl. Math. 2006, 191, 194–205. [Google Scholar] [CrossRef] [Green Version]
- Ming, F.R.; Zhang, A.M.; Cheng, H.; Sun, P.N. Numerical simulation of a damaged ship cabin flooding in transversal waves with Smoothed Particle Hydrodynamics method. Ocean Eng. 2018, 165, 336–352. [Google Scholar] [CrossRef]
- Shi, Y.; Li, S.; Chen, H.; He, M.; Shao, S. Improved SPH simulation of spilled oil contained by flexible floating boom under wave–current coupling condition. J. Fluids Struct. 2018, 76, 272–300. [Google Scholar] [CrossRef]
- Bouscasse, B.; Colagrossi, A.; Marrone, S.; Souto-Iglesias, A. SPH modelling of viscous flow past a circular cylinder interacting with a free surface. Comput. Fluids 2017, 146, 190–212. [Google Scholar] [CrossRef]
- Luo, M.; Reeve, D.E.; Shao, S.; Karunarathna, H.; Lin, P.; Cai, H. Consistent Particle Method simulation of solitary wave impinging on and overtopping a seawall. Eng. Anal. Bound. Elem. 2019, 103, 160–171. [Google Scholar] [CrossRef]
- Ren, Y.; Luo, M.; Lin, P. Consistent Particle Method simulation of solitary wave interaction with a submerged breakwater. Water 2019, 11, 261. [Google Scholar] [CrossRef] [Green Version]
- Wang, D.; Liu, P.L.-F. An ISPH with k–ε closure for simulating turbulence under solitary waves. Coast. Eng. 2020, 157, 103657. [Google Scholar] [CrossRef]
- Zheng, X.; You, Y.; Ma, Q.; Khayyer, A.; Shao, S. A comparative study on violent sloshing with complex baffles using the ISPH method. Appl. Sci. 2018, 8, 904. [Google Scholar] [CrossRef] [Green Version]
- Delorme, L.; Colagrossi, A.; Souto-Iglesias, A.; Zamora-Rodríguez, R.; Botía-Vera, E. A set of canonical problems in sloshing, Part I: Pressure field in forced roll—comparison between experimental results and SPH. Ocean Eng. 2009, 36, 168–178. [Google Scholar] [CrossRef]
- Chen, Z.; Zong, Z.; Li, H.T.; Li, J. An investigation into the pressure on solid walls in 2D sloshing using SPH method. Ocean Eng. 2013, 59, 129–141. [Google Scholar] [CrossRef]
- Gómez-Gesteira, M.; Cerqueiro, D.; Crespo, C.; Dalrymple, R. Green water overtopping analyzed with a SPH model. Ocean Eng. 2005, 32, 223–238. [Google Scholar] [CrossRef]
- He, M.; Gao, X.; Xu, W.; Ren, B.; Wang, H. Potential application of submerged horizontal plate as a wave energy breakwater: A 2D study using the WCSPH method. Ocean Eng. 2019, 185, 27–46. [Google Scholar] [CrossRef]
- Wen, H.; Ren, B.; Yu, X. An improved SPH model for turbulent hydrodynamics of a 2D oscillating water chamber. Ocean Eng. 2018, 150, 152–166. [Google Scholar] [CrossRef]
- Manenti, S.; Sibilla, S.; Gallati, M.; Agate, G.; Guandalini, R. SPH simulation of sediment flushing induced by a rapid water flow. J. Hydraul. Eng. 2012, 138, 272–284. [Google Scholar] [CrossRef]
- Shi, H.; Yu, X.; Dalrymple, R.A. Development of a two-phase SPH model for sediment laden flows. Comput. Phys. Commun. 2017, 221, 259–272. [Google Scholar] [CrossRef]
- Wang, D.; Li, S.; Arikawa, T.; Gen, H. ISPH simulation of scour behind seawall due to continuous tsunami overflow. Coast. Eng. J. 2016, 58, 1650014. [Google Scholar] [CrossRef]
- Gotoh, H.; Khayyer, A. Current achievements and future perspectives for projection-based particle methods with applications in ocean engineering. J. Ocean Eng. Mar. Energy 2016, 2, 251–278. [Google Scholar] [CrossRef] [Green Version]
- Gotoh, H.; Khayyer, A. On the state-of-the-art of particle methods for coastal and ocean engineering. Coast. Eng. J. 2018, 60, 79–103. [Google Scholar] [CrossRef]
- Luo, M.; Khayyer, A.; Lin, P. Particle methods in ocean and coastal engineering. Appl. Ocean Res. 2021, 114, 102734. [Google Scholar] [CrossRef]
- Domínguez, J.M.; Fourtakas, G.; Altomare, C.; Canelas, R.B.; Tafuni, A.; García-Feal, O.; Martínez-Estévez, I.; Mokos, A.; Vacondio, R.; Crespo, A.J.C.; et al. DualSPHysics: From fluid dynamics to multiphysics problems. Comput. Part. Mech. 2021, 1–29. [Google Scholar] [CrossRef]
- SPlisHSPlasH Library. Available online: https://github.com/InteractiveComputerGraphics/SPlisHSPlasH (accessed on 6 September 2021).
- Zhang, C.; Rezavand, M.; Zhu, Y.; Yu, Y.; Wu, D.; Zhang, W.; Wang, J.; Hu, X. SPHinXsys: An open-source multi-physics and multi-resolution library based on smoothed particle hydrodynamics. Comput. Phys. Commun. 2021, 267, 108066. [Google Scholar] [CrossRef]
- Gomez-Gesteira, M.; Rogers, B.D.; Crespo, A.J.C.; Dalrymple, R.A.; Narayanaswamy, M.; Dominguez, J.M. SPHysics—Development of a free-surface fluid solver—Part 1: Theory and formulations. Comput. Geosci. 2012, 48, 289–299. [Google Scholar] [CrossRef]
- Rogers, B.D.; Dalrymple, R.A.; Stansby, P.K. Simulation of caisson breakwater movement using 2-D SPH. J. Hydraul. Res. 2010, 48, 135–141. [Google Scholar] [CrossRef]
- Wang, Y.-Z.; Chen, N.-N.; Chi, L.-H. Numerical simulation on joint motion process of various modes of caisson breakwater under wave excitation. Commun. Numer. Methods Eng. 2006, 22, 535–545. [Google Scholar]
- Akbari, H.; Taherkhani, A. Numerical study of wave interaction with a composite breakwater located on permeable bed. Coast. Eng. 2019, 146, 1–13. [Google Scholar] [CrossRef]
- Altomare, C.; Crespo, A.J.C.; Rogers, B.D.; Dominguez, J.M.; Gironella, X.; Gómez-Gesteira, M. Numerical modelling of armour block sea breakwater with smoothed particle hydrodynamics. Comput. Struct. 2014, 130, 34–45. [Google Scholar] [CrossRef]
- Zhang, F.; Crespo, A.; Altomare, C.; Domínguez, J.; Marzeddu, A.; Shang, S.-P.; Gómez-Gesteira, M. DualSPHysics: A numerical tool to simulate real breakwaters. J. Hydrodyn. 2018, 30, 95–105. [Google Scholar] [CrossRef]
- Ren, B.; Jin, Z.; Gao, R.; Wang, Y.-X.; Xu, Z.-L. SPH-DEM modeling of the hydraulic stability of 2D blocks on a slope. J. Waterw. Port Coast. Ocean Eng. 2014, 140, 04014022. [Google Scholar] [CrossRef]
- Sarfaraz, M.; Pak, A. Numerical investigation of the stability of armour units in low-crested breakwaters using combined SPH–Polyhedral DEM method. J. Fluids Struct. 2018, 81, 14–35. [Google Scholar] [CrossRef]
- Shao, S.; Gotoh, H. Simulating coupled motion of progressive wave and floating curtain wall by SPH-LES model. Coast. Eng. J. 2004, 46, 171–202. [Google Scholar] [CrossRef]
- Ren, B.; He, M.; Li, Y.; Dong, P. Application of smoothed particle hydrodynamics for modeling the wave-moored floating breakwater interaction. Appl. Ocean Res. 2017, 67, 277–290. [Google Scholar] [CrossRef]
- Domínguez, J.M.; Crespo, A.J.C.; Hall, M.; Altomare, C.; Wu, M.; Stratigaki, V.; Troch, P.; Cappietti, L.; Gómez-Gesteira, M. SPH simulation of floating structures with moorings. Coast. Eng. 2019, 153, 103560. [Google Scholar] [CrossRef]
- Hall, M.; Goupee, A. Validation of a lumped-mass mooring line model with DeepCwind semisubmersible model test data. Ocean Eng. 2015, 104, 590–603. [Google Scholar] [CrossRef] [Green Version]
- Liu, Z.; Wang, Y. Numerical studies of submerged moored box-type floating breakwaters with different shapes of cross-sections using SPH. Coast. Eng. 2020, 158, 103687. [Google Scholar] [CrossRef]
- Cui, J.; Chen, X.; Sun, P. Numerical investigation on the hydrodynamic performance of a new designed breakwater using smoothed particle hydrodynamic method. Eng. Anal. Bound. Elem. 2021, 130, 379–403. [Google Scholar] [CrossRef]
- Masciola, M.; Jonkman, J.; Robertson, A. Implementation of a multisegmented, quasi-static cable model. In Proceedings of the 23rd International Offshore and Polar Engineering Conference, Anchorage, AK, USA, 30 June–5 July 2013; International Society of Offshore and Polar Engineers: Cupertino, CA, USA, 2013; pp. 315–322. [Google Scholar]
- Gunn, D.F.; Rudman, M.; Cohen, R.C.Z. Wave interaction with a tethered buoy: SPH simulation and experimental validation. Ocean Eng. 2018, 156, 306–317. [Google Scholar] [CrossRef]
- Pan, K.; Ijzermans, R.H.A.; Jones, B.D.; Thyagarajan, A.; Van Beest, B.W.H.; Williams, J.R. Application of the SPH method to solitary wave impact on an offshore platform. Comput. Part. Mech. 2016, 3, 155–166. [Google Scholar] [CrossRef] [Green Version]
- Rudman, M.; Cleary, P.W. The influence of mooring system in rogue wave impact on an offshore platform. Ocean Eng. 2016, 115, 168–181. [Google Scholar] [CrossRef]
- Barreiro, A.; Crespo, A.J.C.; Dominguez, J.M.; Garcia-Feal, O.; Zabala, I.; Gomez-Gesteira, M. Quasi-static mooring solver implemented in SPH. J. Ocean Eng. Mar. Energy 2016, 2, 381–396. [Google Scholar] [CrossRef] [Green Version]
- Crespo, A.J.C.; Altomare, C.; Domínguez, J.M.; González-Cao, J.; Gómez-Gesteira, M. Towards simulating floating offshore oscillating water column converters with Smoothed Particle Hydrodynamics. Coast. Eng. 2017, 126, 11–26. [Google Scholar] [CrossRef]
- Ardianti, A.; Mutsuda, H.; Kawawaki, K.; Doi, Y.; Fukuhara, T. Characteristic of tsunami force acting on shelter with mooring. Appl. Ocean Res. 2017, 64, 70–85. [Google Scholar] [CrossRef]
- Antuono, M.; Colagrossi, A.; Marrone, S.; Molteni, D. Free-surface flows solved by means of SPH schemes with numerical diffusive terms. Comput. Phys. Commun. 2010, 181, 532–549. [Google Scholar] [CrossRef]
- Antuono, M.; Colagrossi, A.; Marrone, S. Numerical diffusive terms in weakly-compressible SPH schemes. Comput. Phys. Commun. 2012, 183, 2570–2580. [Google Scholar] [CrossRef]
- Wendland, H. Piecewise polynomial, positive definite and compactly supported radial functions of minimal degree. Adv. Comput. Math. 1995, 4, 389–396. [Google Scholar] [CrossRef]
- He, M.; Khayyer, A.; Gao, X.; Xu, W.; Liu, B. Theoretical method for generating solitary waves using plunger-type wavemakers and its Smoothed Particle Hydrodynamics validation. Appl. Ocean Res. 2021, 106, 102414. [Google Scholar] [CrossRef]
- Ren, B.; He, M.; Dong, P.; Wen, H. Nonlinear simulations of wave-induced motions of a freely floating body using WCSPH method. Appl. Ocean Res. 2015, 50, 1–12. [Google Scholar] [CrossRef]
- He, M.; Xu, W.; Gao, X.; Ren, B. SPH simulation of wave scattering by a heaving submerged horizontal plate. Int. J. Ocean Coast. Eng. 2018, 1, 1840004. [Google Scholar] [CrossRef]
- Shi, Y.; Li, S.; Peng, S.; Chen, H.; He, M. Numerical modeling of flexible floating boom using a coupled SPH–FEM model. Coast. Eng. J. 2018, 60, 140–158. [Google Scholar] [CrossRef]
- Yang, C.; Weller, S.D.; Wang, Y.-X.; Ning, D.-Z.; Johanning, L. Experimental and numerical investigation on coupled motion characteristics of a tunnel element suspended from a twin-barge. Ocean Eng. 2018, 153, 201–214. [Google Scholar] [CrossRef] [Green Version]
- Hirakuchi, H.; Kajima, R.; Kawaguchi, T. Application of a piston-type absorbing wavemaker to irregular wave experiments. Coast. Eng. Jpn. 1990, 33, 11–24. [Google Scholar] [CrossRef]
- Carmigniani, R.A.; Violeau, D. Optimal sponge layer for water waves numerical models. Ocean Eng. 2018, 163, 169–182. [Google Scholar] [CrossRef]
- Goda, Y.; Suzuki, Y. Estimation of incident and reflected waves in random wave experiments. In Proceedings of the 15th Conference on Coastal Engineering, Honolulu, HI, USA, 11–17 July 1976; American Society of Civil Engineers: New York, NY, USA, 1977; pp. 828–845. [Google Scholar]
- Ji, C.; Cheng, Y.; Cui, J.; Yuan, Z.; Gaidai, O. Hydrodynamic performance of floating breakwaters in long wave regime: An experimental study. Ocean Eng. 2018, 152, 154–166. [Google Scholar] [CrossRef] [Green Version]
- Antuono, M.; Colagrossi, A.; Marrone, S.; Lugni, C. Propagation of gravity waves through an SPH scheme with numerical diffusive terms. Comput. Phys. Commun. 2011, 182, 866–877. [Google Scholar] [CrossRef]
- Altomare, C.; Domínguez, J.M.; Crespo, A.J.C.; González-Cao, J.; Suzuki, T.; Gómez-Gesteira, M.; Troch, P. Long-crested wave generation and absorption for SPH-based DualSPHysics model. Coast. Eng. 2017, 127, 37–54. [Google Scholar] [CrossRef]
- Hall, M.; Buckham, B.; Crawford, C. Evaluating the importance of mooring line model fidelity in floating offshore wind turbine simulations. Wind Energy 2014, 17, 1835–1853. [Google Scholar] [CrossRef]
- Davidson, J.; Ringwood, J.V. Mathematical modelling of mooring systems for wave energy converters—A Review. Energies 2017, 10, 666. [Google Scholar] [CrossRef] [Green Version]


| Floating Pontoon | Length Lf | Width Wf | Height Hf | Draft df | Mass M | Moment of Inertia I |
| Exp. values | 50 cm | 76 cm | 20 cm | 10 cm | 28.6 kg | 0.669 kg·m2 |
| Num. values | same | 100 cm | same | same | 28.6/76 × 100 = 37.63 kg | 0.669/76 × 100 = 0.88 kg·m2 |
| Mooring System | Tensile Stiffness EA | Wet Weight w | Bending Length lm | Horizontal Length lx | ||
| Exp. values | 3.15 kN | 6.18 N/m | 1.6 m | 1.15 m | ||
| Num. values | 3.15 × 2/76 × 100 = 8.29 kN | 6.18 × 2/76 × 100 = 16.26 N/m | same | same | ||
| Floating Pontoon | Diameter Fc | Width Wf | Interspacing Lr | Draft df | Total Mass M | Total Moment of Inertia I |
|---|---|---|---|---|---|---|
| Exp. values | 20 cm | 76 cm | 10 cm | 10 cm | 19.1 kg | 0.474 kg·m2 |
| Num. values | same | 100 cm | same | same | 19.1/76 × 100 = 25.14 kg | 0.474/76 × 100 = 0.624 kg·m2 |
Publisher’s Note: MDPI stays neutral with regard to jurisdictional claims in published maps and institutional affiliations. |
© 2021 by the authors. Licensee MDPI, Basel, Switzerland. This article is an open access article distributed under the terms and conditions of the Creative Commons Attribution (CC BY) license (https://creativecommons.org/licenses/by/4.0/).
Share and Cite
Cheng, X.; Liu, C.; Zhang, Q.; He, M.; Gao, X. Numerical Study on the Hydrodynamic Characteristics of a Double-Row Floating Breakwater Composed of a Pontoon and an Airbag. J. Mar. Sci. Eng. 2021, 9, 983. https://doi.org/10.3390/jmse9090983
Cheng X, Liu C, Zhang Q, He M, Gao X. Numerical Study on the Hydrodynamic Characteristics of a Double-Row Floating Breakwater Composed of a Pontoon and an Airbag. Journal of Marine Science and Engineering. 2021; 9(9):983. https://doi.org/10.3390/jmse9090983
Chicago/Turabian StyleCheng, Xiaofei, Chang Liu, Qilong Zhang, Ming He, and Xifeng Gao. 2021. "Numerical Study on the Hydrodynamic Characteristics of a Double-Row Floating Breakwater Composed of a Pontoon and an Airbag" Journal of Marine Science and Engineering 9, no. 9: 983. https://doi.org/10.3390/jmse9090983