Article

A Study of the Potential Impact of Dredging the Corpus Christi Ship Channel on Passive Particle Transport

1
The Oden Institute for Computational Engineering and Sciences, The University of Texas at Austin, Austin, TX 78751, USA
2
The Marine Science Institute, The University of Texas at Austin, Port Aransas, TX 78373, USA
*
Author to whom correspondence should be addressed.
J. Mar. Sci. Eng. 2021, 9(9), 935; https://doi.org/10.3390/jmse9090935
Submission received: 24 June 2021 / Revised: 9 August 2021 / Accepted: 23 August 2021 / Published: 28 August 2021
(This article belongs to the Special Issue Transport of Material near the Ocean Surface)

Abstract

:
We present a study of the potential impact of deepening the Corpus Christi Ship Channel through Aransas Pass; in particular, we study the effect on the transport of red drum fish larvae due to the change in channel depth. The study was conducted by high resolution simulation of the circulation of the seawater entering and exiting the pass for the current and proposed Ship Channel depths. The computer model incorporates tides and meteorological forcing and includes the entire Gulf of Mexico and the North American Atlantic coast. The corresponding transport of larvae modeled as passive particles due to the sea water circulation is established by releasing particles in the nearshore region outside Aransas Pass and subsequently tracking their trajectories. We compare the difference in the number of larvae that successfully reach appropriate nursery grounds inside Aransas Pass for four distinctive initial larvae positions in the nearshore region. Our results indicate that the change in channel depth does not significantly alter the number of red drum larvae that reach suitable nursery grounds, overall, across all considered scenarios, we see a net increase of 0.5%.

1. Introduction

Corpus Christi Ship Channel extends from the Gulf of Mexico to the Port of Corpus Christi (POCC) through Corpus Christi Bay and Aransas Pass Inlet [1] (visible as the darkest blue contour in Corpus Christi Bay in Figure 1). The current channel was established in 1989 and has an average depth of 14.33 m (47 ft), which is maintained through a continuous dredging operation [1]. Near the Ship Channel, there are numerous seagrass beds and regions that serve as nursery grounds for estuarine dependent fish larvae such as red drum (Sciaenops ocellatus) [2]. Red drum are one of several species of commercially or recreationally important fish or shellfish species that have life cycles where adults spawn in the coastal ocean and their planktonic larvae must be transported back to estuarine nursery grounds to feed and develop into adults.
Along with an expansion of the Port of Corpus Christi, and in an effort to accommodate larger ships, it has been proposed to deepen the channel to 21.33 m (70 ft). Such a change in bottom topography is likely to lead to changes in the flow characteristics of the water entering and exiting through Aransas Pass and may impact the transport of fish larvae [2,3].
The area of particular interest in this study is Aransas Pass and the bays directly adjacent to and behind it (Corpus Christi, Redfish, and Aransas bays). The area of interest is chosen because red drum fish spawn in the nearshore region of the Gulf of Mexico (generally inside the 18 m contour [4]) in the evenings in the vicinity of tidal inlets (e.g., the Aransas Pass) from late August to December [2,4,5]. These larvae depend on shallow seagrass habitats found inside Aransas Pass near the Corpus Christi Ship Channel to develop [6]. Hence, these larvae depend on the circulation of the coastal water to reach suitable habitats for their development. To assess potential impacts of a deeper ship channel on the transport of red drum larvae through Aransas Pass to the seagrass beds, we develop models governing the circulation of water using both existing and proposed channel depths. The circulation model is then used in a subsequent model governing the passive transport of larvae. From the circulation model, we ascertain the water surface elevation as well as the velocity components throughout the modeled region. The larvae are modeled as passive particles whose transport is a result of the water circulation only. In existing literature, some authors propose that the transport of fish larvae is also affected by swimming motion [7] but we shall only consider passive transport due to the circulation of water here.
The circulation of coastal water and the resulting transport of larvae through Aransas Pass has been modeled by multiple authors with increasing complexity over the last few decades. In [8], Smith and Stoner establish approximations of the circulation based on measurements of elevation and velocities in Aransas pass. Subsequent transport of larvae is established throughout Aransas Pass by making assumptions on diffusive and turbulent transport from saline transport [9] as well as including swimming movements of larvae. In a sequence of papers by Brown et al. [2,10,11], more sophisticated models were established based on partial differential equations (PDEs) governing the coastal circulation. The approximation of these PDEs was performed using finite element (FE) methods and implicit time stepping schemes, see [12,13] for descriptions of these models and their FE approximations. In [2,10,11], the domain considered in these papers consists of the bays behind Aransas Pass (Corpus Chisti, Redfish, Nueces, Copano, Mission, St. Charles, and Aransas bays), it extends 50 km off the coast, 50 km north of the Aransas Pass Inlet, and 125 km south. Finally, the circulation in these models is forced by winds as well as the dominant tidal constituents ( K 1 , O 1 , P 1 , M 2 ) and fish larvae modeled as passive particles are tracked using the method of Blanton [14]. Compared to previous studies of larvae transport in the focus area, the domain of the model we develop consists of the entire Gulf of Mexico and the North American Atlantic coasts (see Figure 2). This large domain is chosen to ensure accuracy of the model as the effects of meteorological forcing can significantly impact the results despite the relatively small region of interest. Second, our model considers a large portion of the red drum spawning season, i.e., 60 days, in an effort to capture the effects of both tides and winds over extended periods of time on the circulation of seawater in the focus area. In the following, we describe in detail the modeling methods used in Section 2.1 and Section 2.2. In Section 3, we present the results from our model and compare findings for the current and proposed channel depths for three cases of hydrodynamic conditions. Finally, in Section 4 we conclude this paper with remarks on the findings. The term “bathymetry” is used throughout this document and it refers to the depth of water relative to the North American Vertical Datum of 1988 (NAVD88). Here, we use the convention that the bathymetry is positive above NAVD88. In the figures we present where the bathymetry is shown, the color scale always refers to the water surface elevation above NAVD88.

2. Materials and Methods

To establish the passive transport of larvae, we first ascertain the flow characteristics of the coastal circulation (here referred to as hydrodynamics) by employing the advanced circulation (ADCIRC) model [15]. This model is well-documented and has been extensively tested and validated for a wide range of flow cases. The hydrodynamic outputs from the ADCIRC model are subsequently used as input into a Lagrangian particle transport model [16], in which larvae are considered as passive particles and their trajectories are tracked.

2.1. Hydrodynamics

The model governing the hydrodynamics of coastal waters are the shallow water equations, a set of nonlinear transient partial differential equations [17]. Except for limited cases of academic interest, it is impossible to establish closed form analytic solutions to these equations. Hence, it is a necessity to employ numerical approximation techniques to establish solutions to these partial differential equations. In this study, we employ the well established and widely used (numerical) model ADCIRC. This model employs a Galerkin finite element method to discretize space and a finite difference time stepping scheme to advance the solution through time to solve a reformulated version of the shallow water equations, and the two dimensional generalized wave continuity and momentum equations [13]. The Galerkin finite element method is very well suited for applications such as shallow water modeling as it can be used on unstructured meshes that consider the intricacies of coastal domains, and it is easily amendable to parallel processing and computations on supercomputers. To develop an ADCIRC model here, we need the following components: (i) a discrete description of the domain (i.e., a finite element mesh), including bathymetry and bottom friction information, ( i i ) information about tides, and ( i i i ) meteorological data. The latter two are the driving mechanisms of the flow.
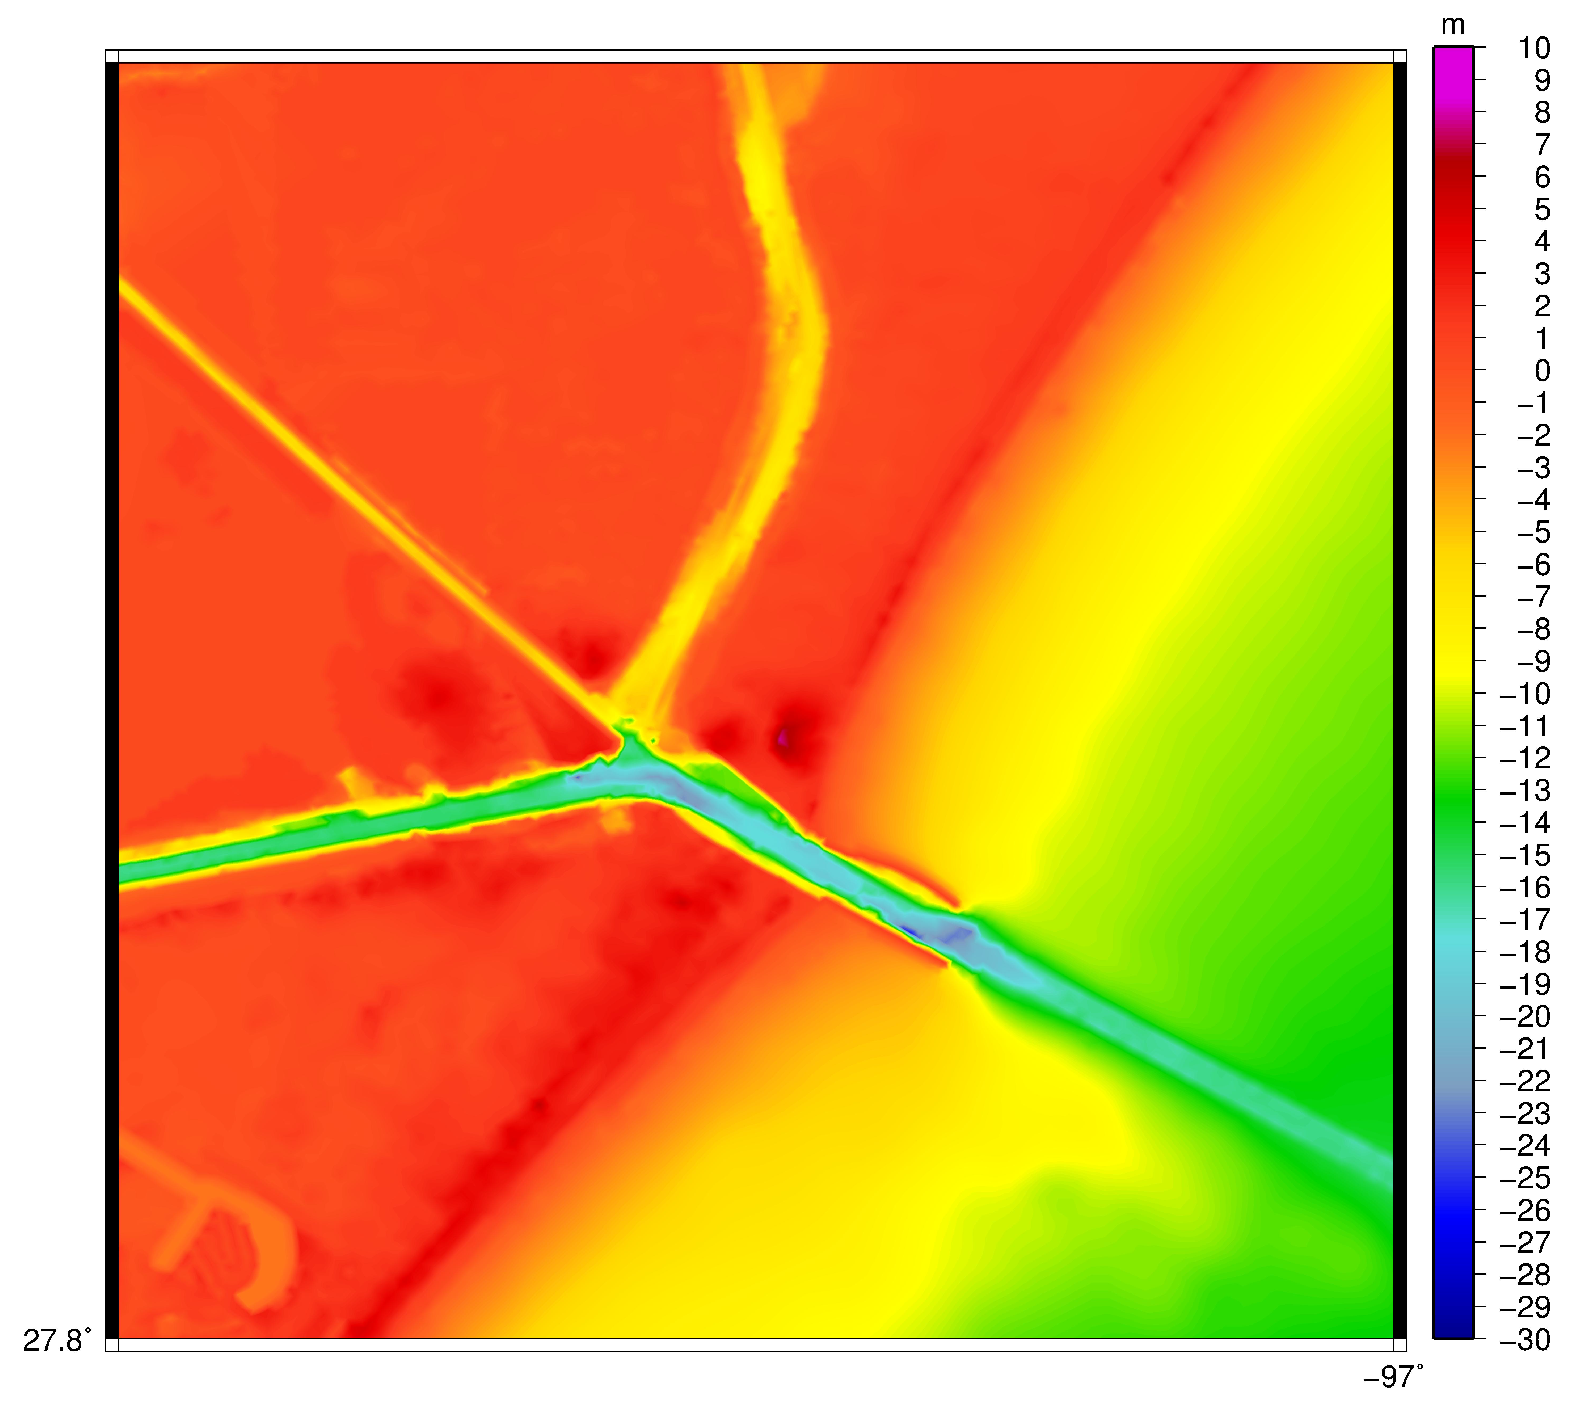
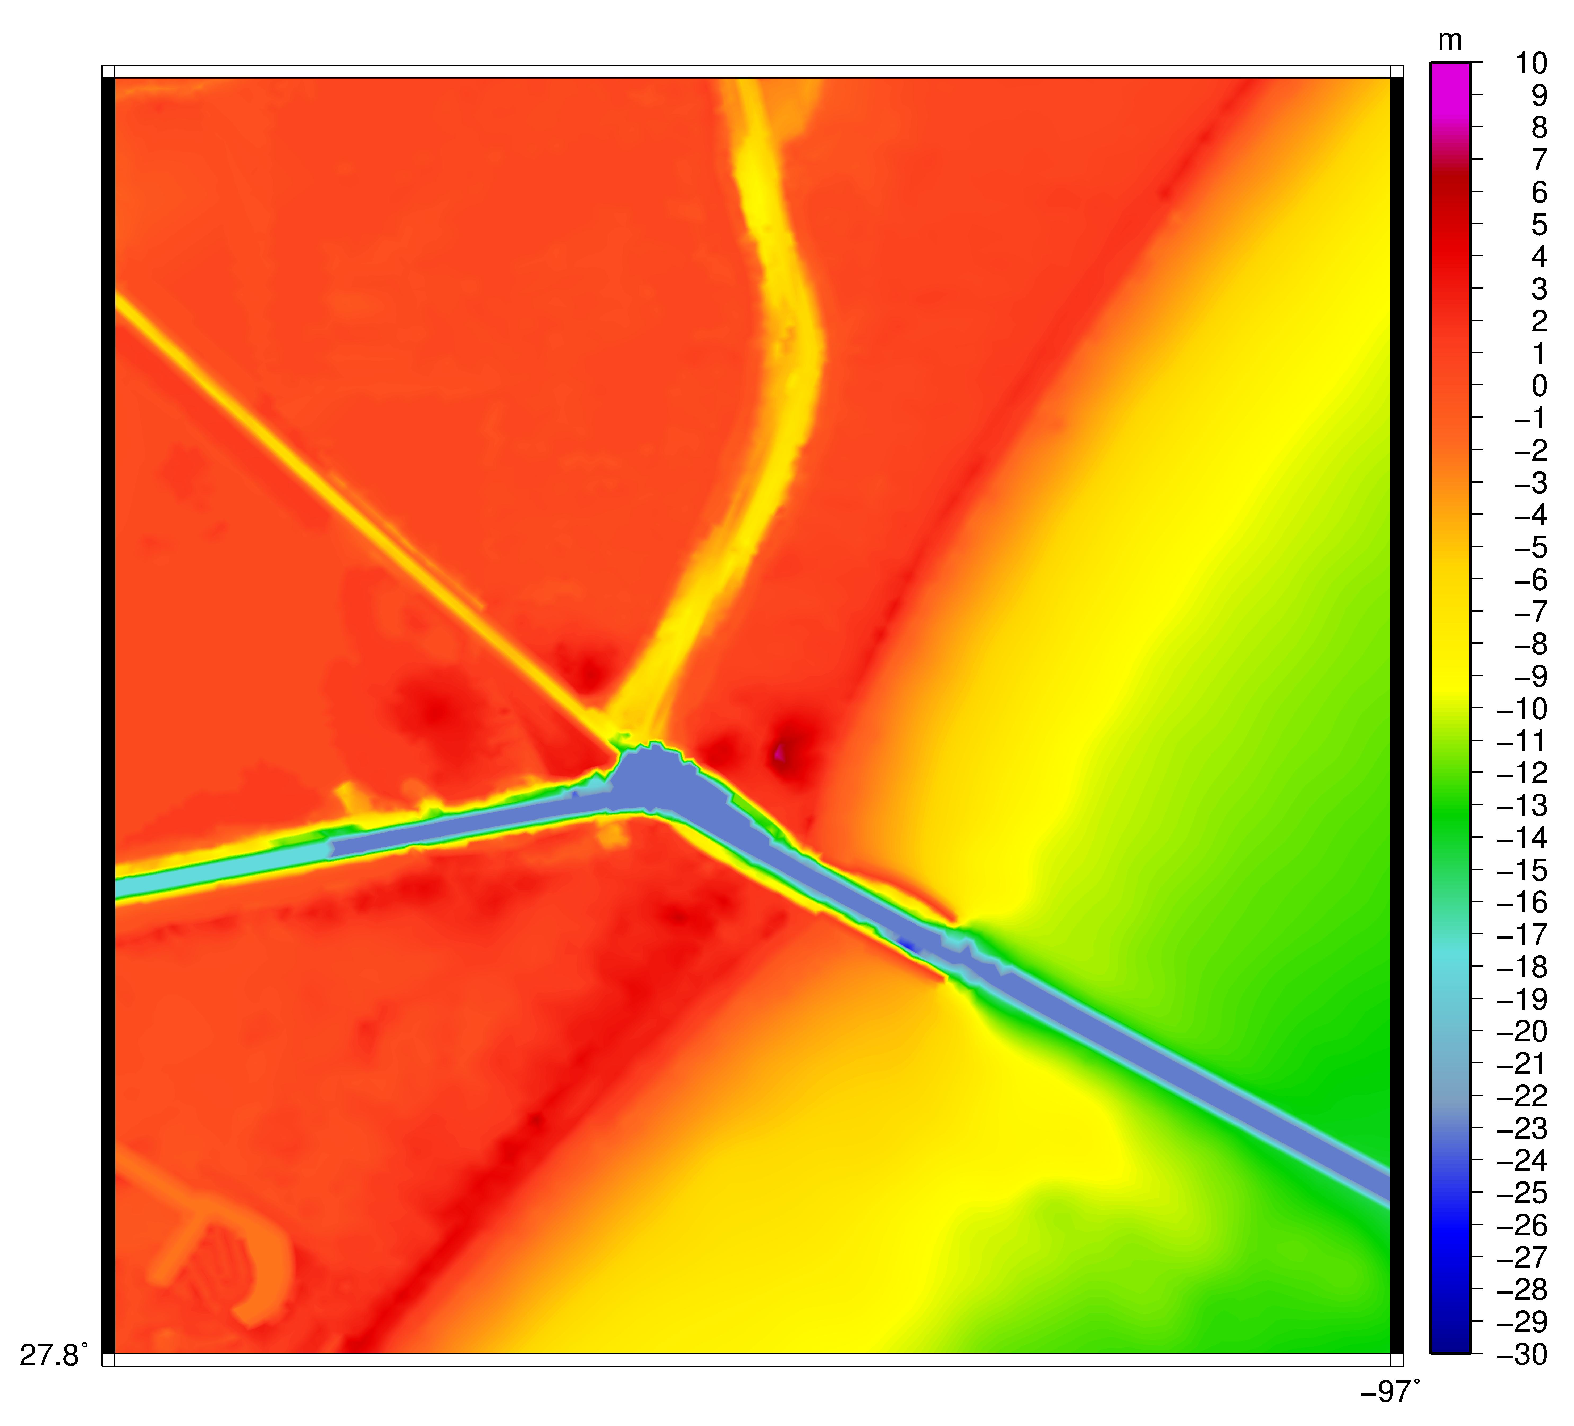
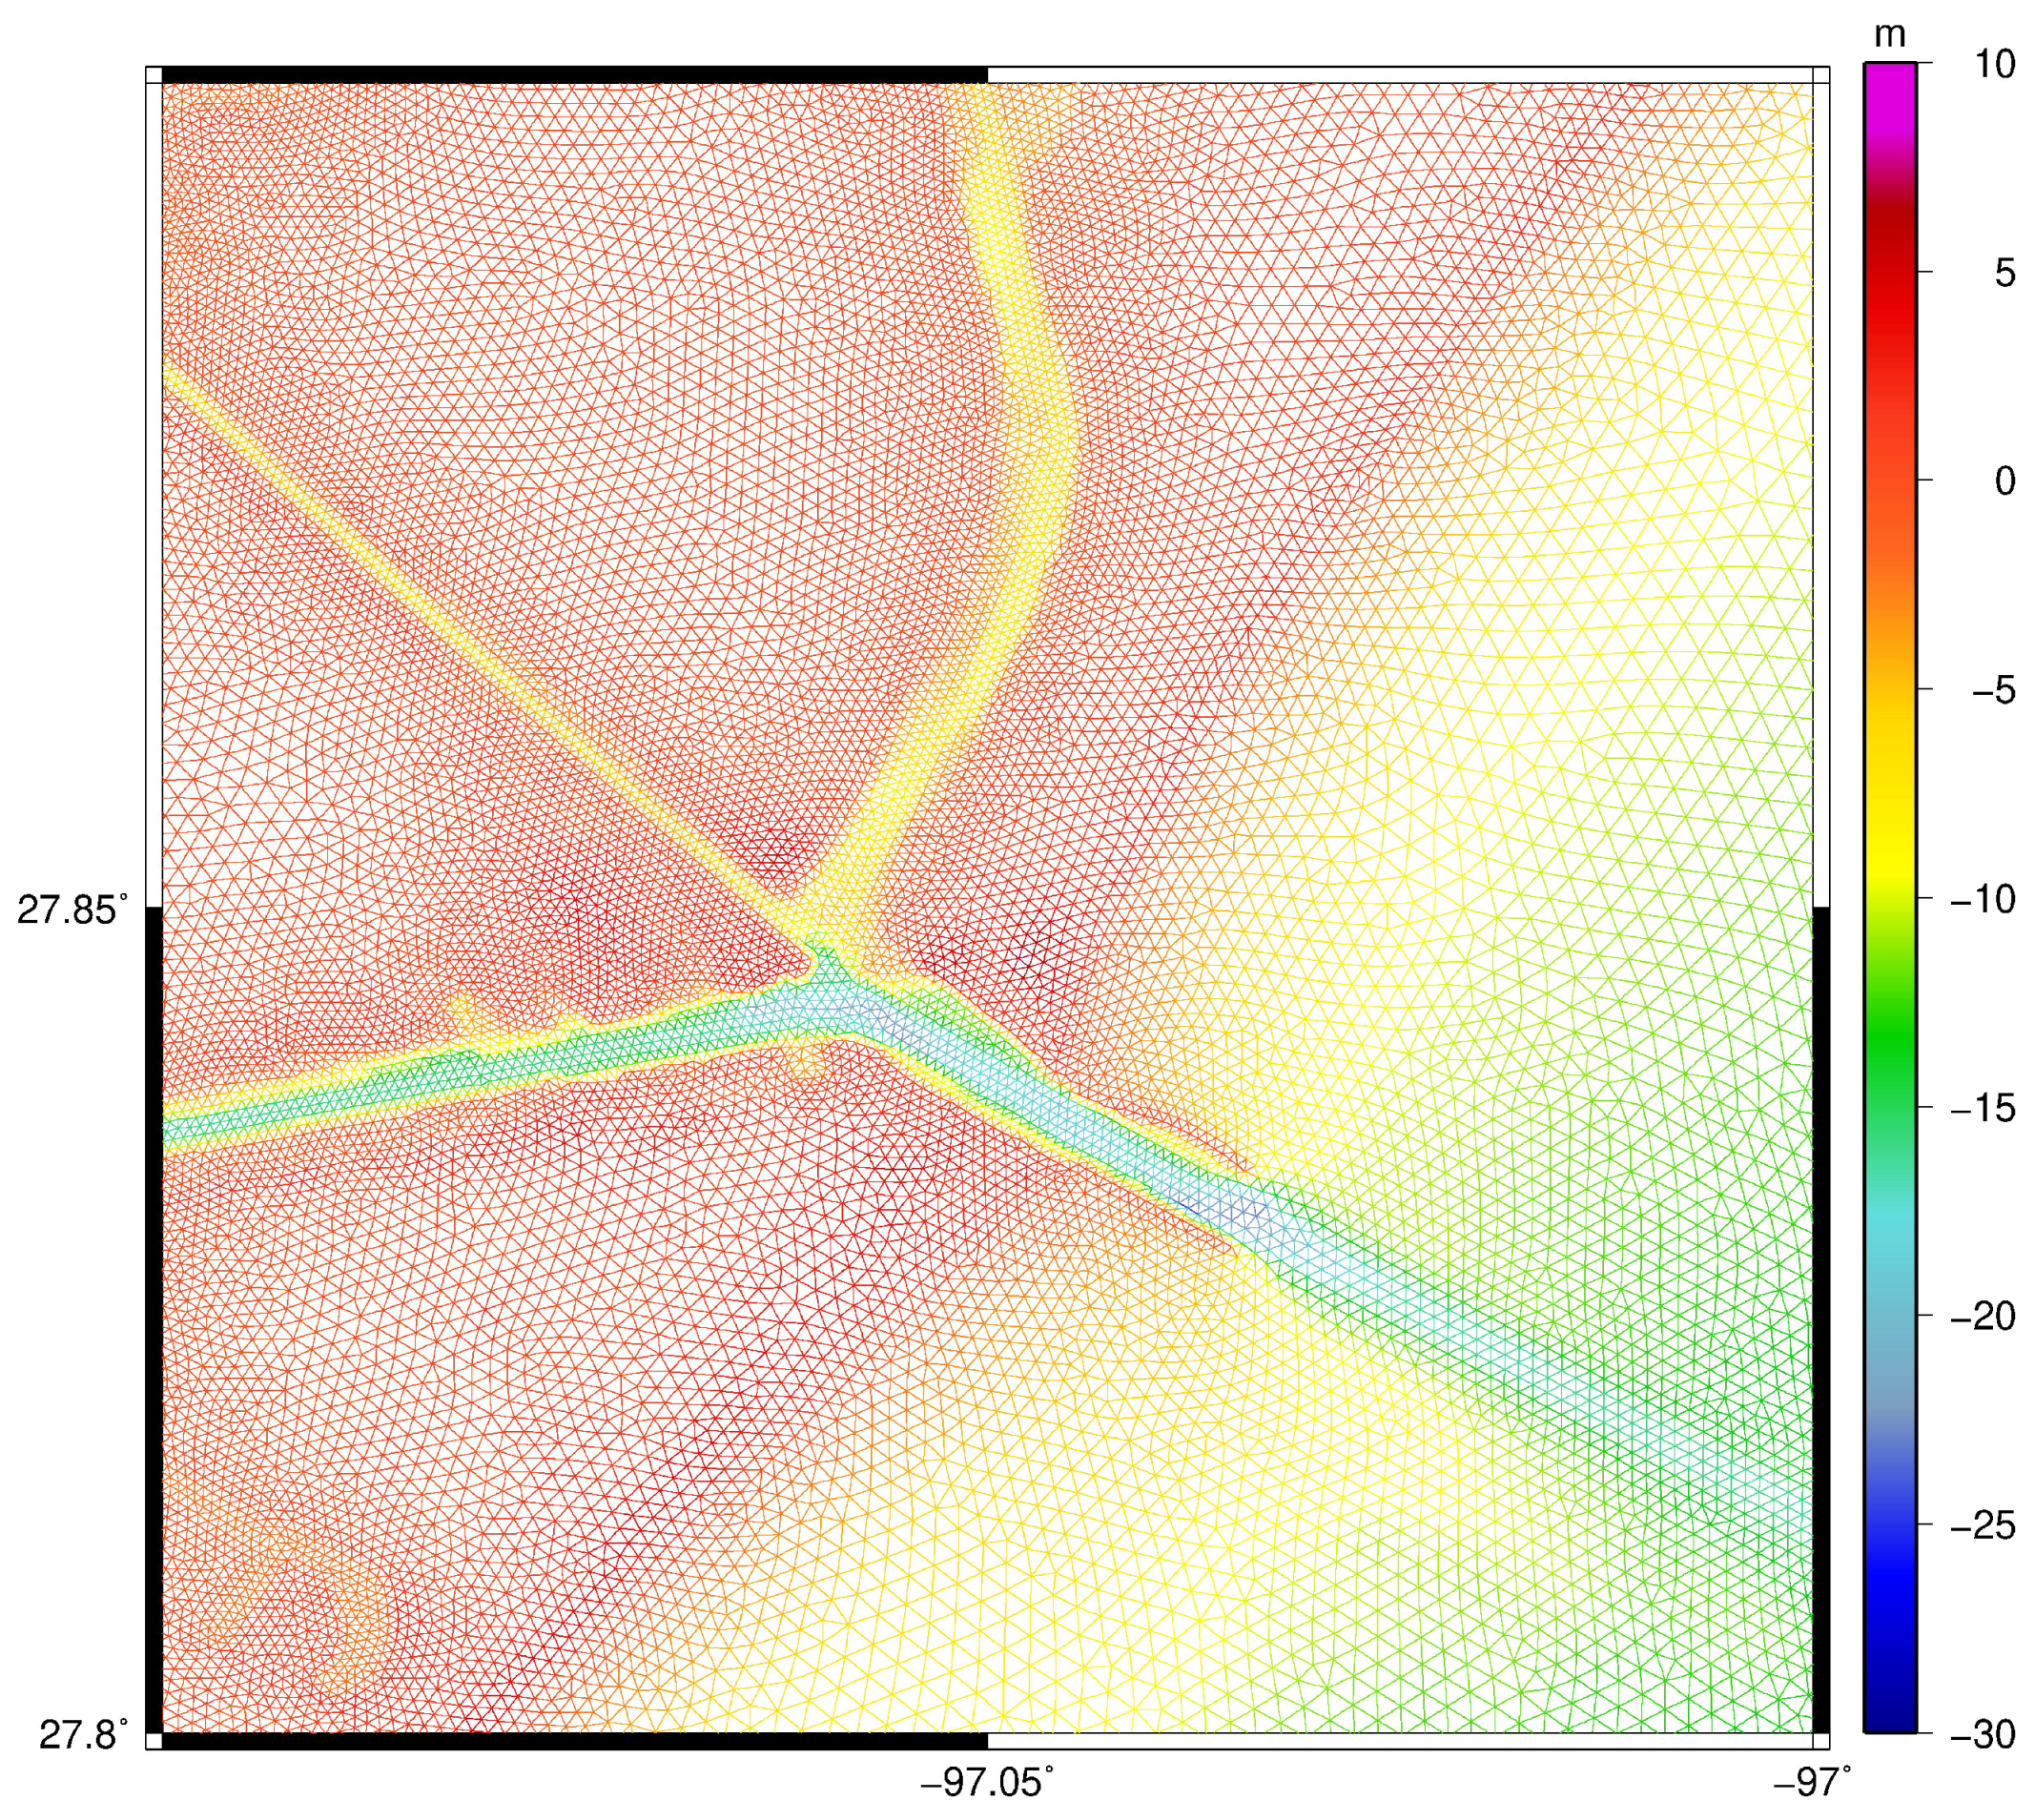
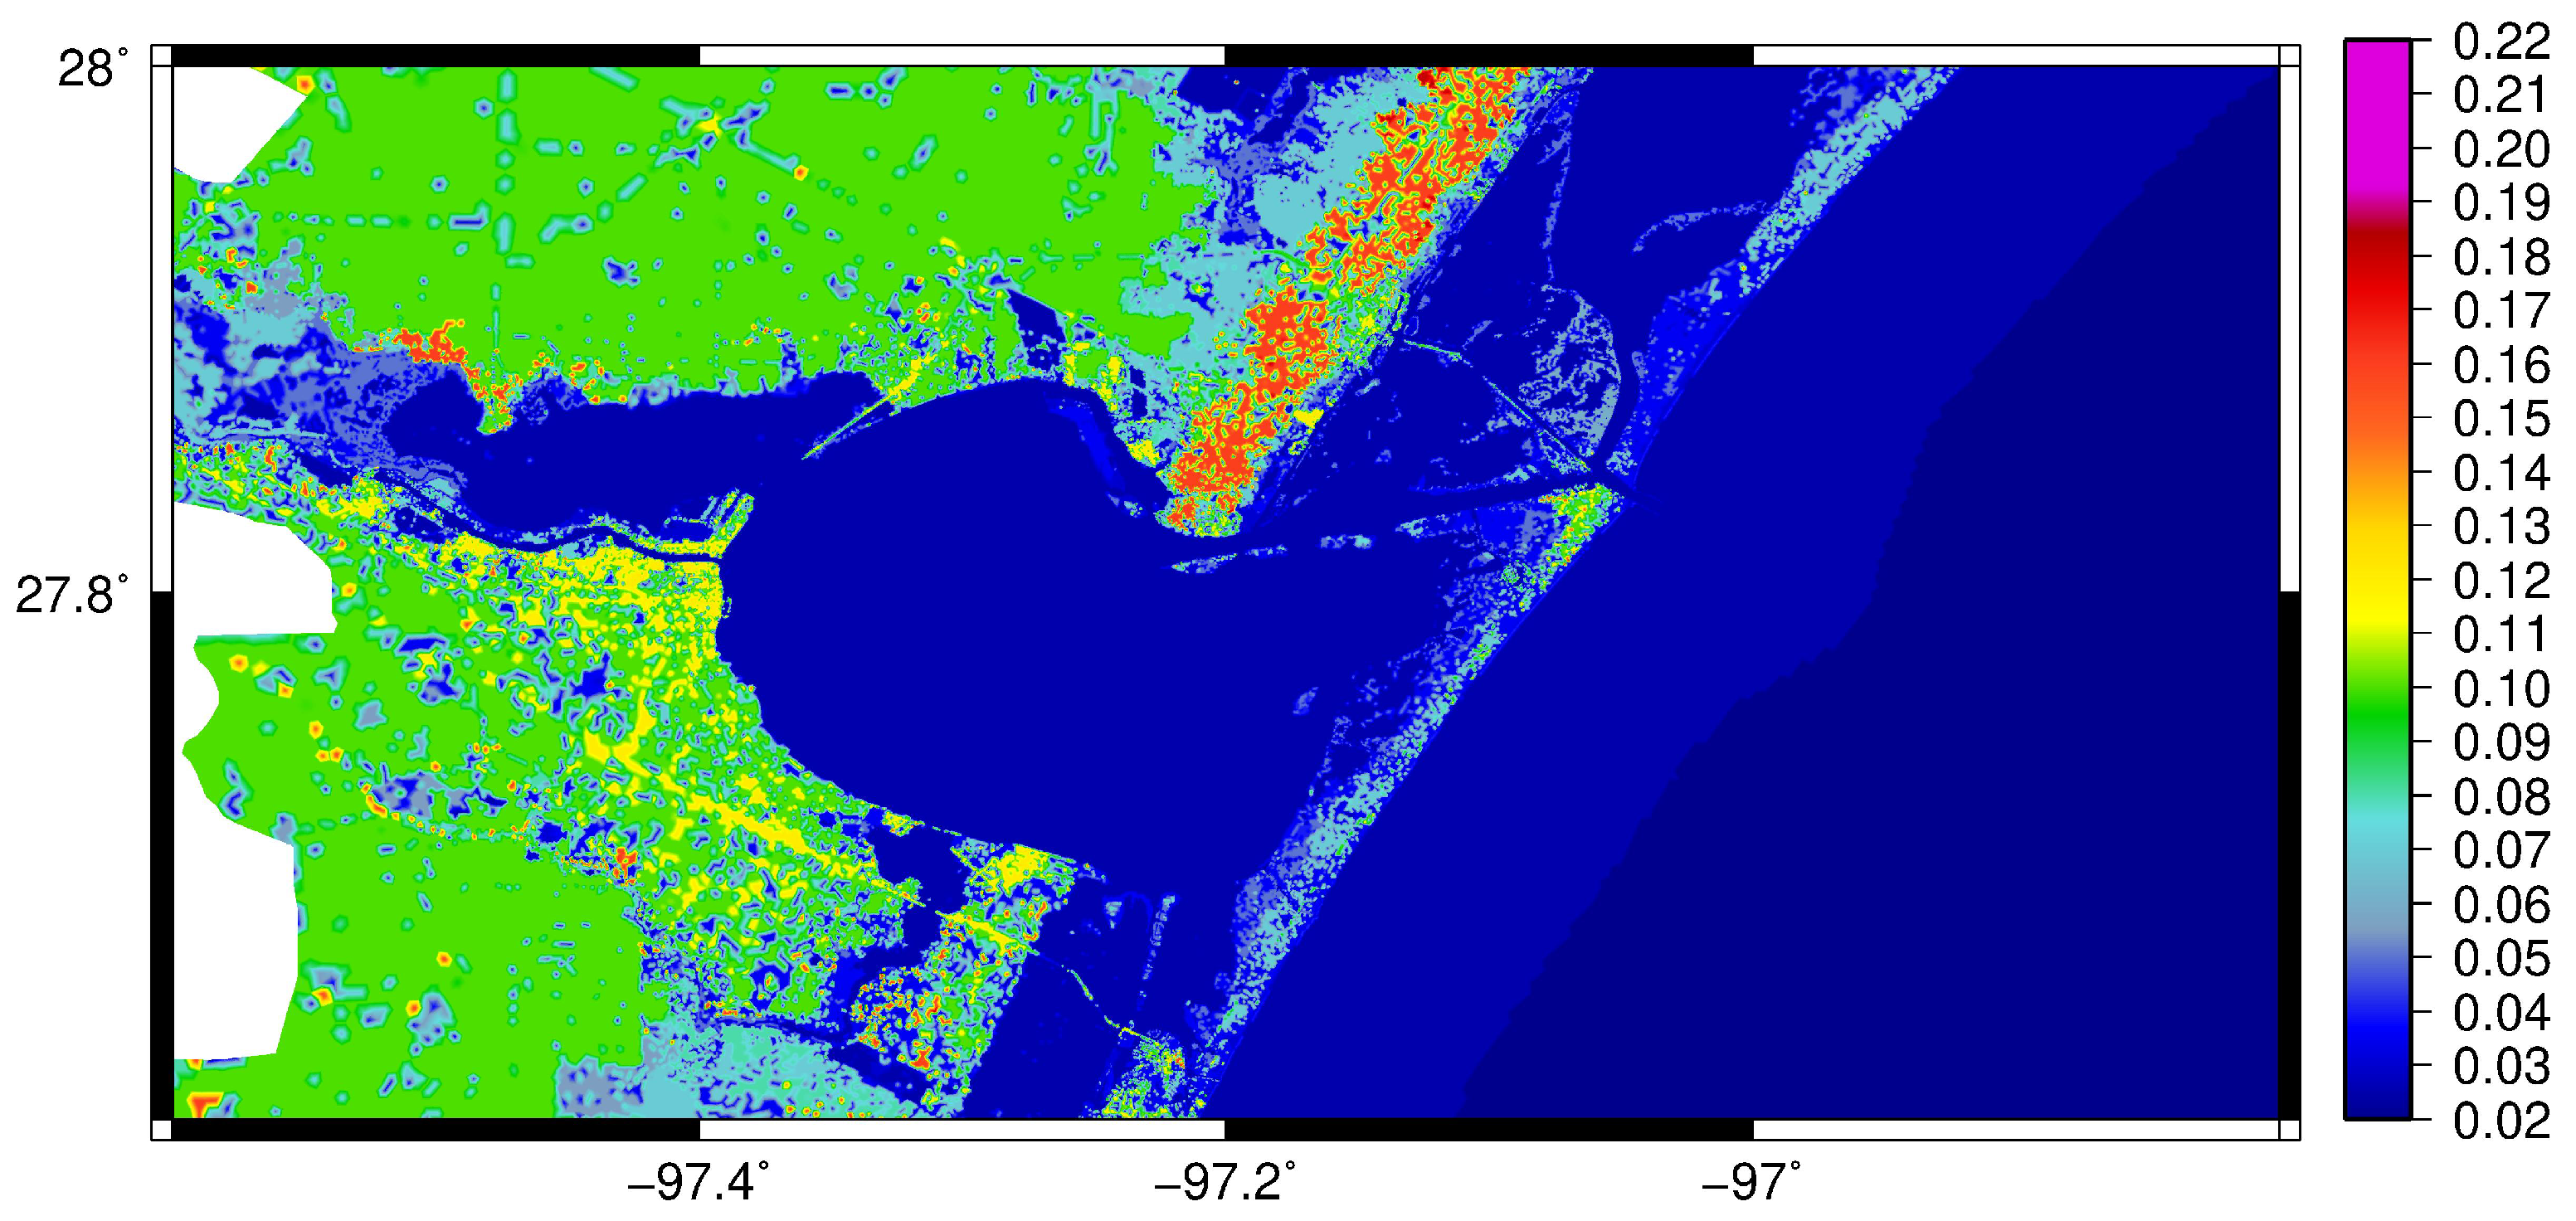
To assess the difference in hydrodynamics due to the proposed channel bathymetry, our ADCIRC model uses two meshes. First, there is a mesh with the current depth of the Corpus Christi Ship Channel and second, a mesh with the proposed deepened channel bathymetry. Other than the difference in bathymetry in the channel as shown in Figure 3 and Figure 4, the two meshes are identical. The meshes cover the entire Gulf of Mexico and North American Atlantic coast with particularly high detail along the Texas coast, see Figure 2 and Figure 5. These meshes are specially constructed for modeling the Texas coast and contain a total of 3,352,598 nodes and 6,675,517 elements with refinement along the coast with resolution near 30 m. The mesh also contains a classification of the sea floor, which is defined using a Manning’s n friction formulation [18] and is spatially varying throughout the mesh. In Figure 6, we show the varying Manning’s n used throughout the study area. Further details, including the development and validation of the model using tidal and wind forcing data (specifically for Hurricane Ike), can be found in [19]. We note that this mesh contains inland floodplains and wetting and drying is active in the model.
Since the circulation pattern of coastal waters is greatly influenced by large scale, global, meteorological trends, we consider two distinctive cases of meteorological data in an effort to consider its influence onto the hydrodynamics in our area of focus. We also consider inflow into Corpus Christi Bay from the Nueces River, located on the far western end of the bay. Our study included the years 2012, which experienced record drought https://www.ncdc.noaa.gov/sotc/national/201213 (accessed on 2 May 2021) and 2019, a normal year for riverine inflows https://www.ncdc.noaa.gov/sotc/national/201913 (accessed on 2 May 2021). Finally, to consider extreme flow conditions through Corpus Christi bay, we consider a short period coinciding with the all-time peak flow in the Nueces river established from a United States Geological Survey (USGS) stream gauge.
The meteorological forcing was obtained from the North American Mesoscale model (NAM) at https://www.ncei.noaa.gov/data/north-american-mesoscale-model (accessed on 7 October 2020) given in 6 h increments in the form of pressure and wind fields at 10m above the surface. The tidal forcing for the ADCIRC model is obtained using OceanMesh2D [20], which utilizes the tidal model described in [21], called the TPXO9 model, for tidal constituents M 2 , S 2 , N 2 , K 1 , K 2 , O 1 , Q 1 . For both years, we used our ADCIRC model to establish the hydrodynamics of both existing and proposed bathymetries. We consider the most active period of red drum spawning, i.e., our simulations cover the time span from 1 September to 31 October of each year.
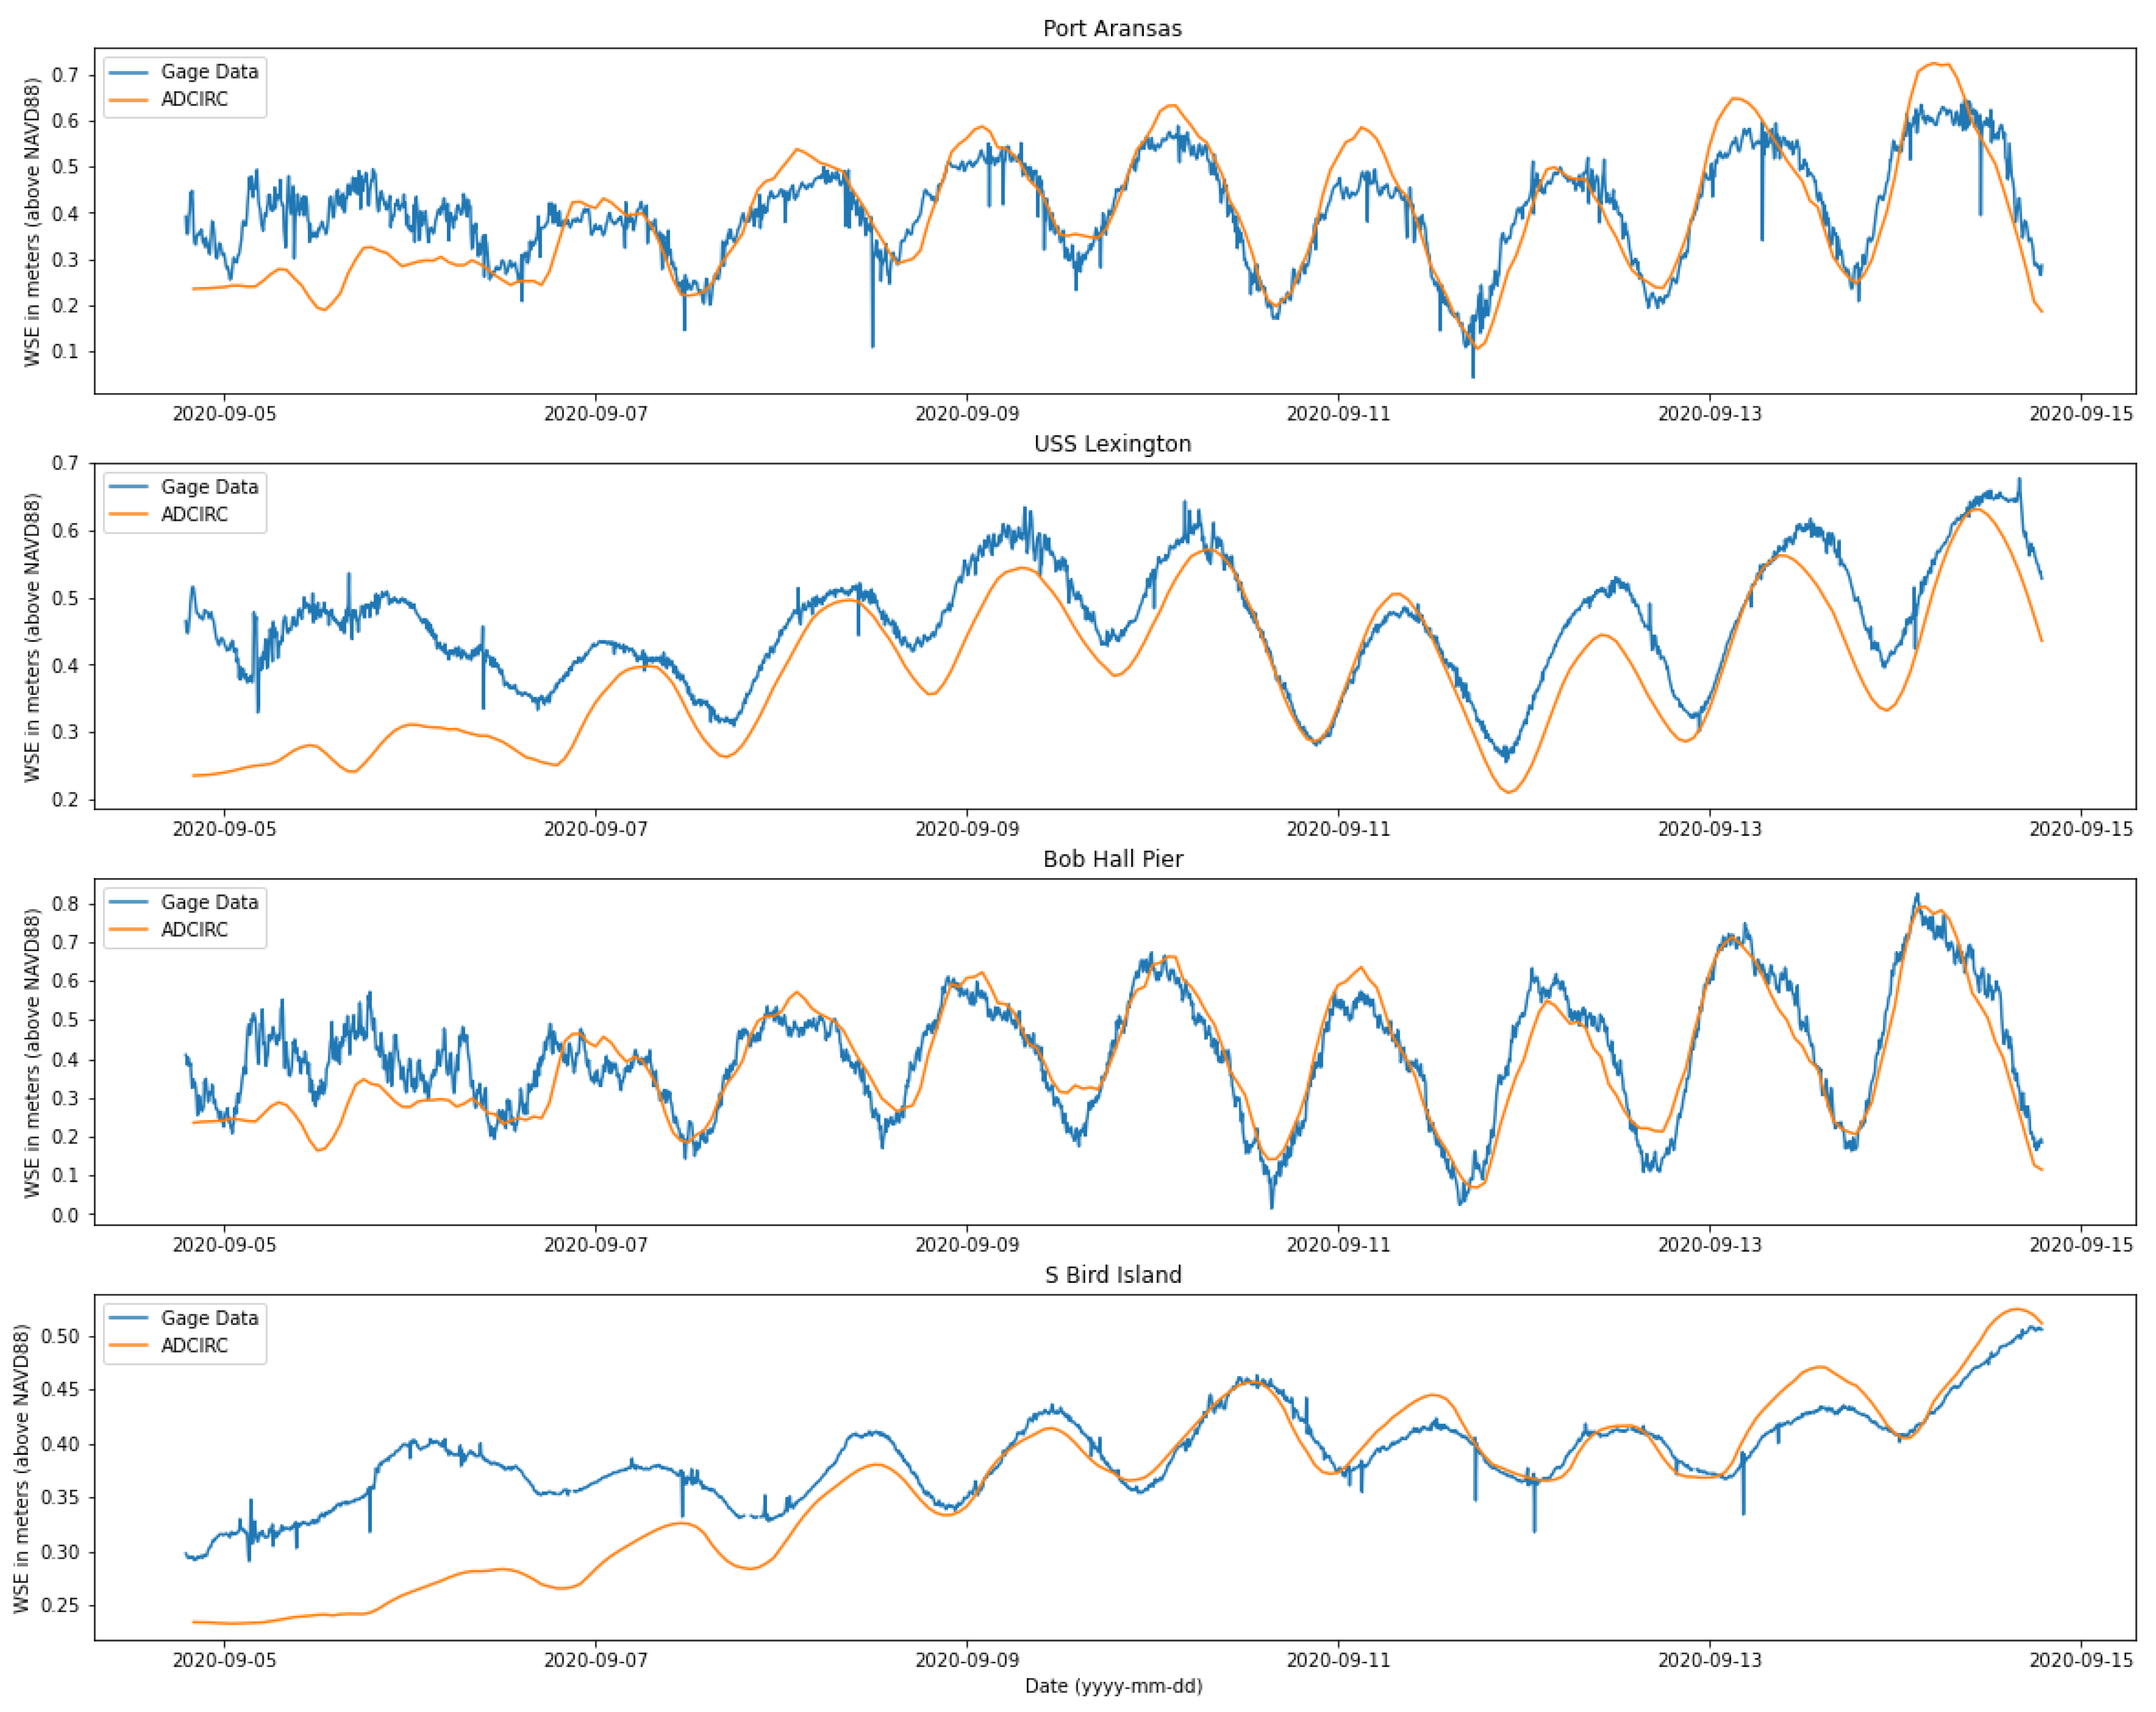
To validate the ADCIRC model for the present case, we consider the mesh with existing bathymetry and compare the elevation output data with available elevation gauge data from the National Oceanic and Atmospheric Administration (NOAA). To this end, we consider a period of 10 days starting on 5 September 2020. In particular, we consider four NOAA elevation gauges near the Corpus Christi Ship Channel: Port Aransas (ID 8775237), USS Lexington (ID 8775296), Bob Hall Pier (ID 8775870), and South Bird Island (ID 8776139). In Figure 7, we show the computed ADCIRC elevation compared to the NOAA gauges. The ADCIRC model agrees well with the gauges beyond the first two days, which is chosen as the period to ramp up the tidal forcing. This ramping period is employed to ensure numerical stability and robustness of the Galerkin finite element approximations in the ADCIRC model. Excluding the error during this ramping period, the largest discrepancy observed in these tidal gauges is 0.07 m, which corresponds to a 12.13% error. This discrepancy is observed in the Port Aransas NOAA gauge in the final peak seen in Figure 7. These errors are of comparable magnitude to reported errors for storm surge models developed in ADCRIC see, e.g., [19,22].

2.2. Particle Transport

To establish the trajectory of larvae due to the hydrodynamics, we employ a Lagrangian particle tracking algorithm and code. This particular code uses the velocity field from the ADCIRC model to compute the trajectory of particles. This particular code is described and developed in [16,23], and considers the convective transport of particles through the domain.
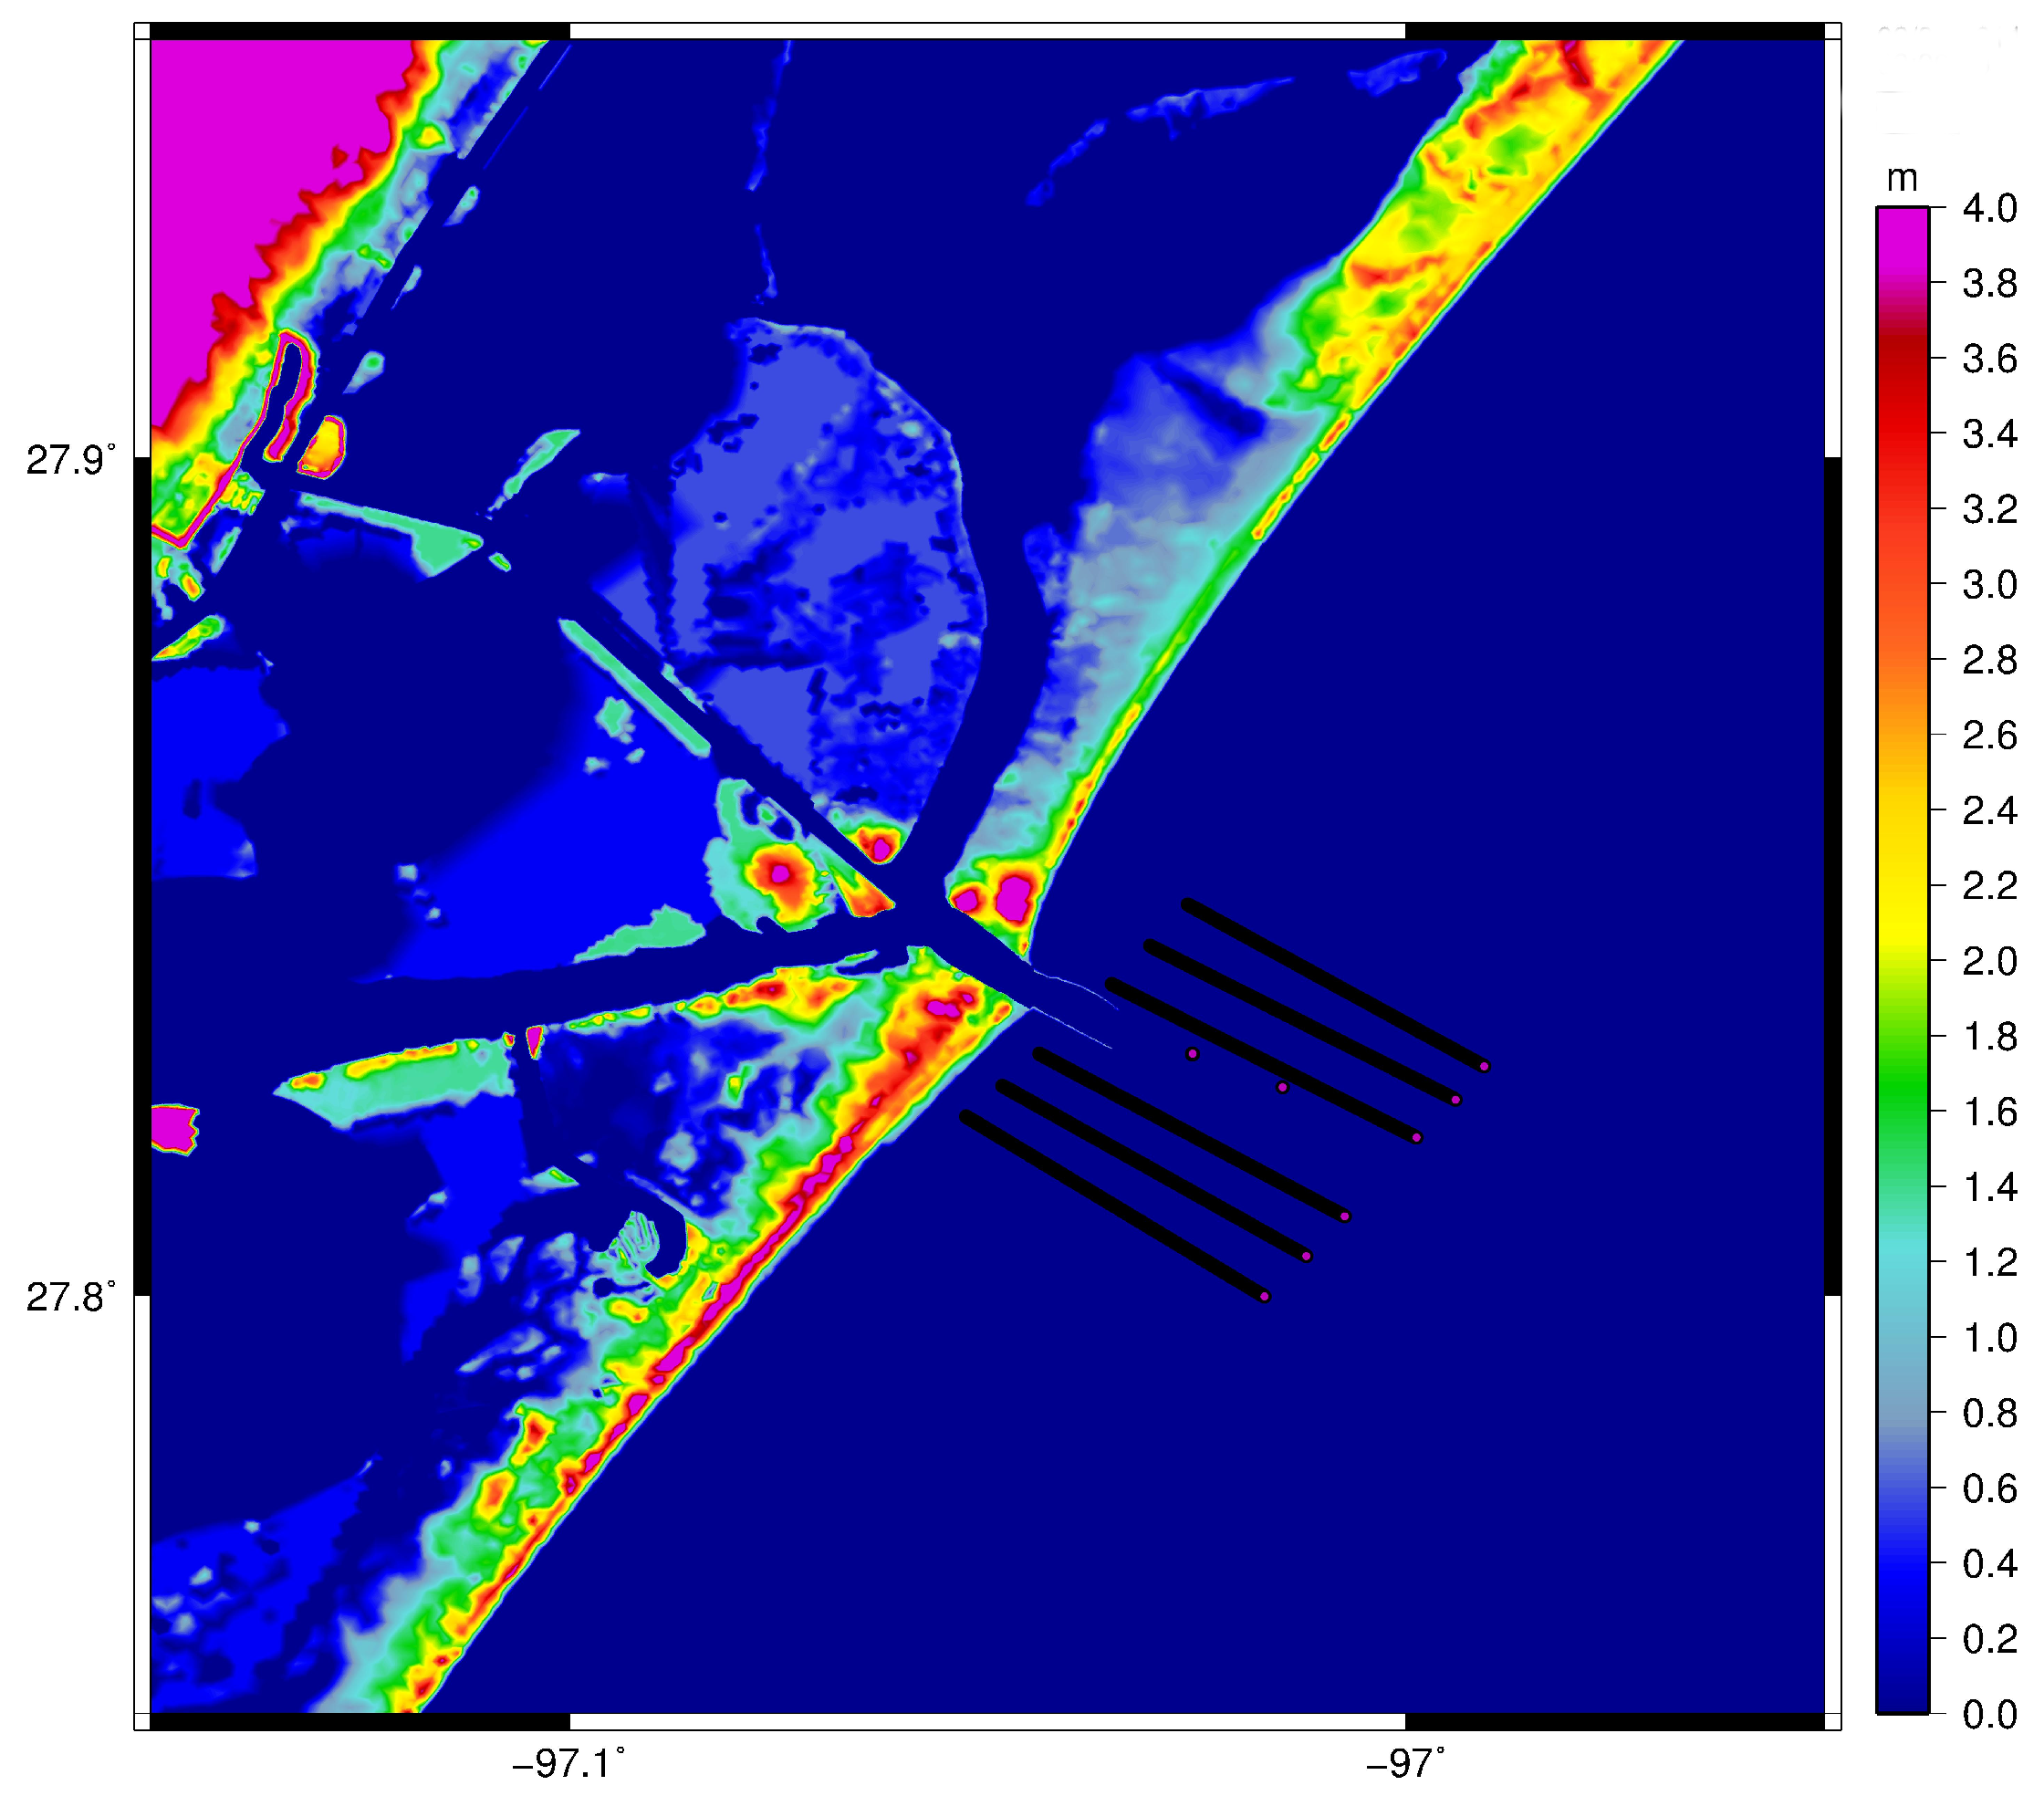
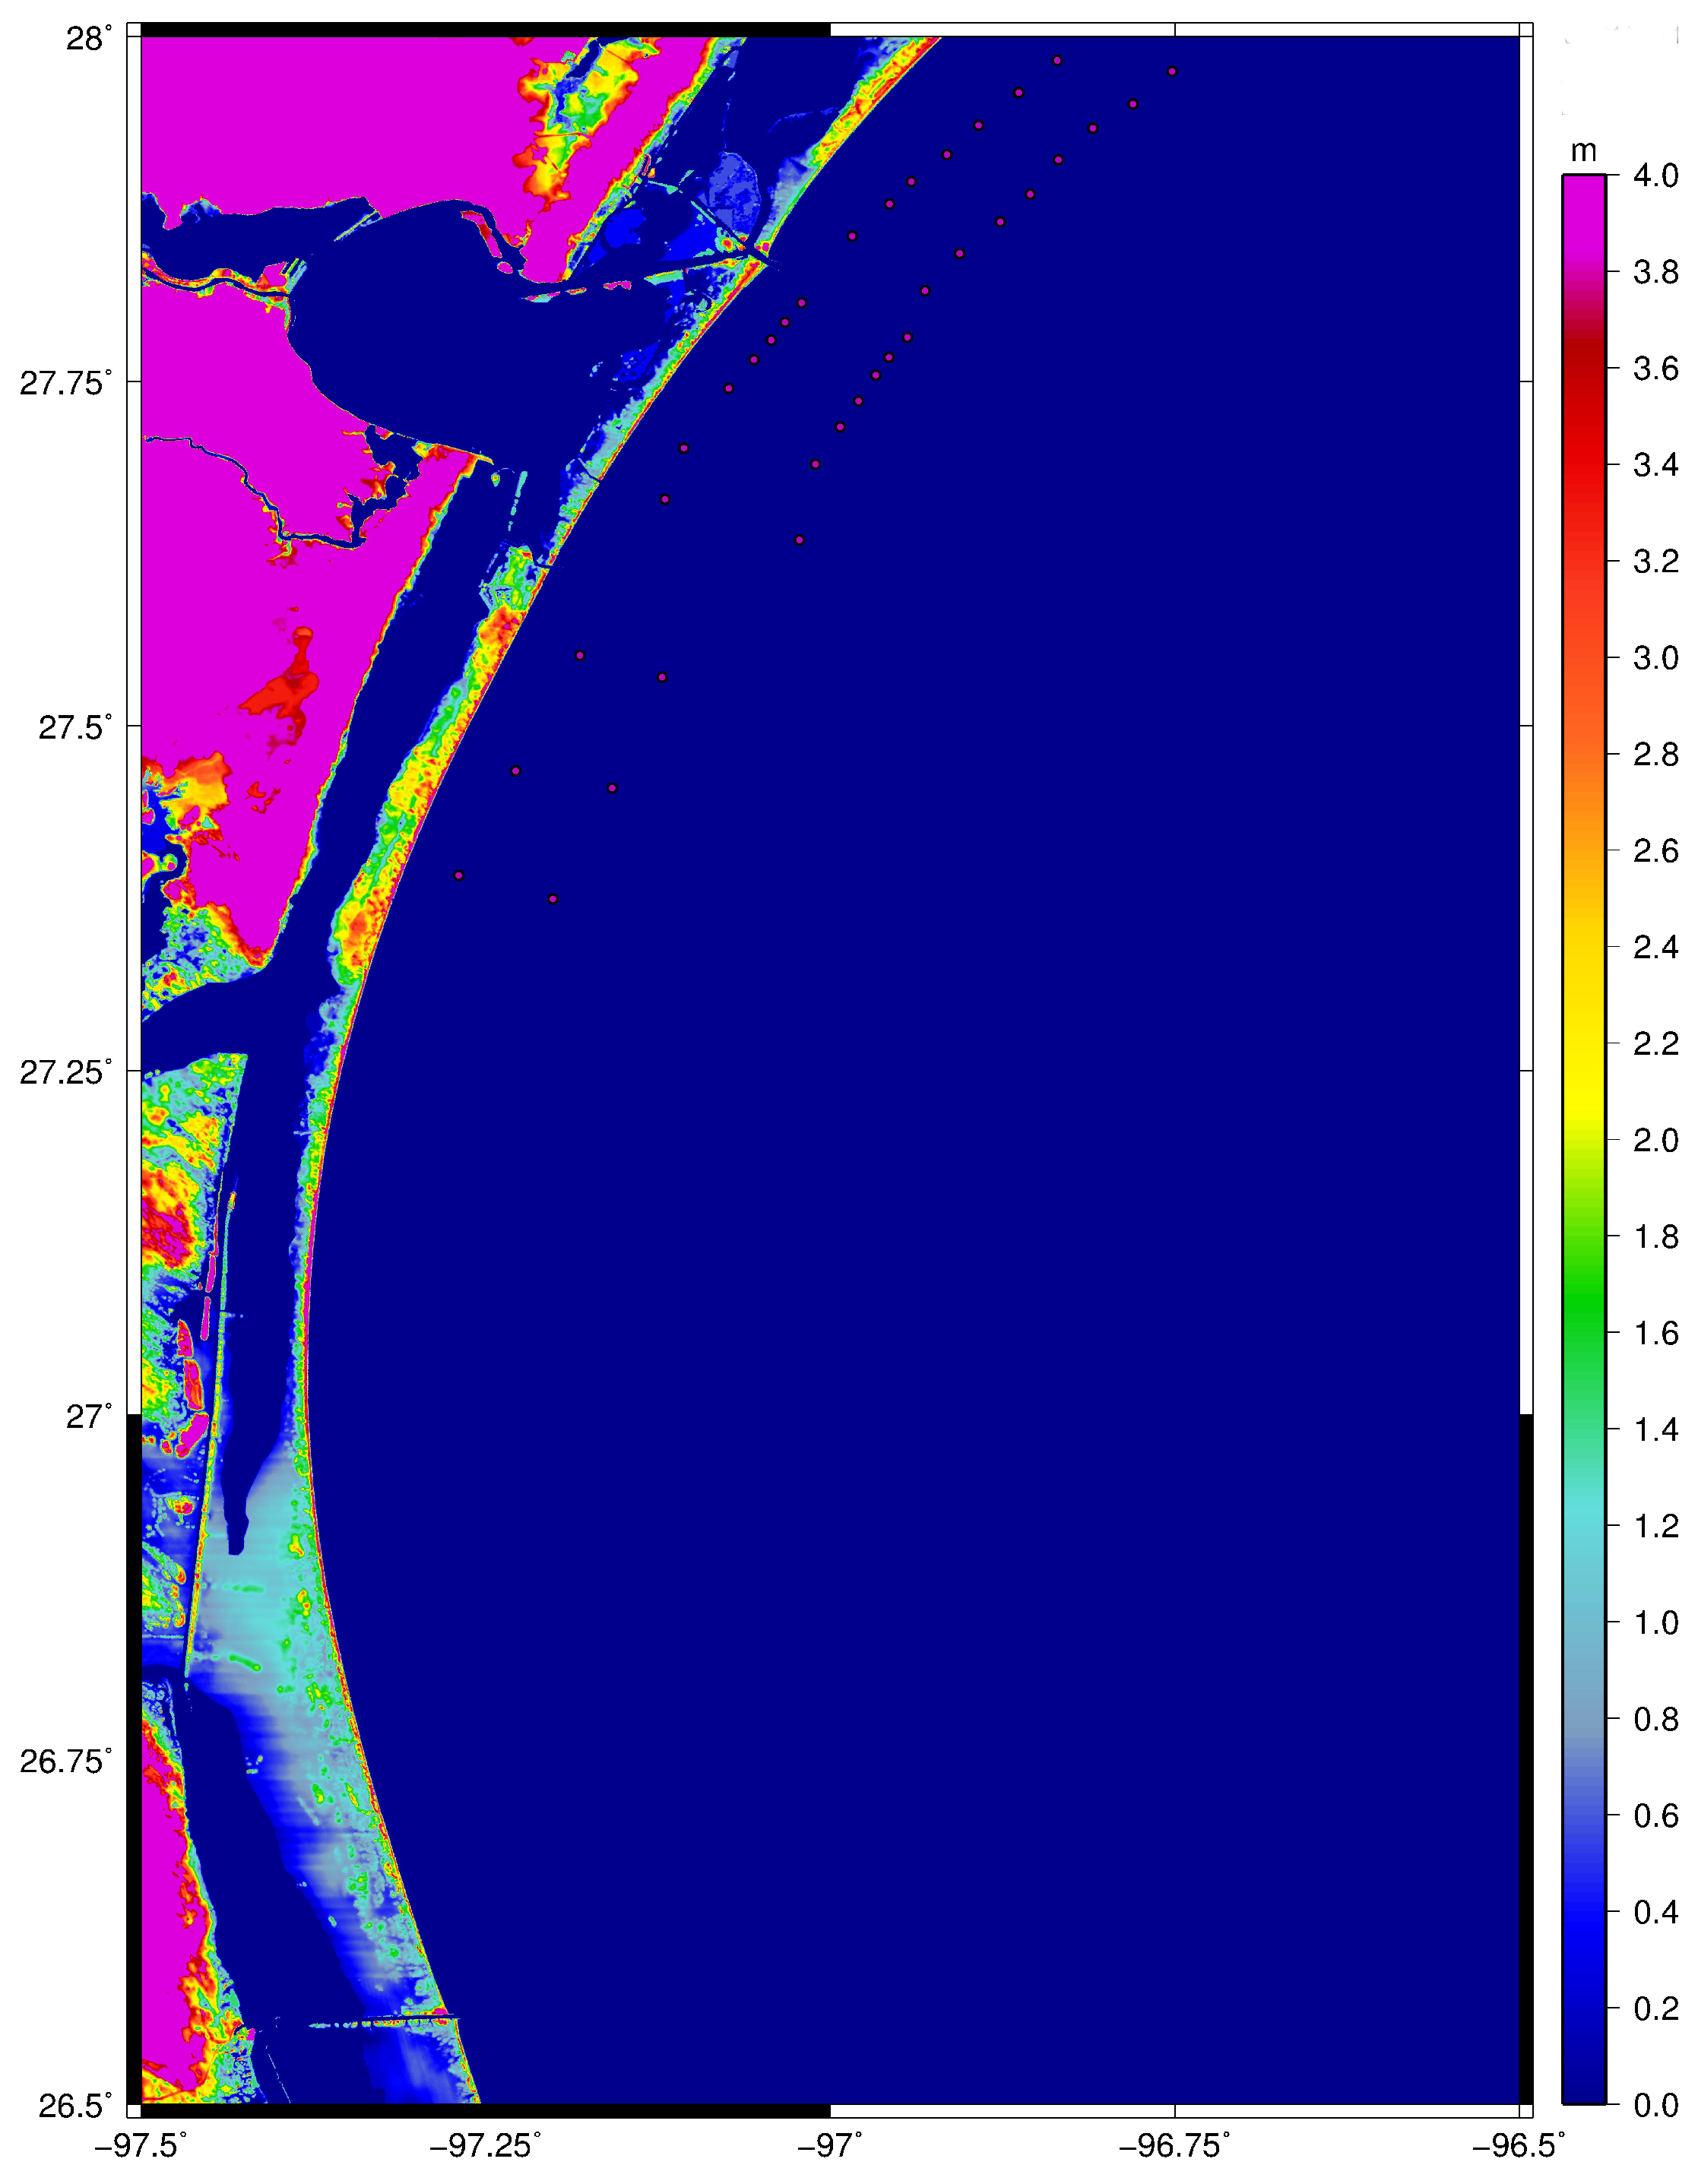
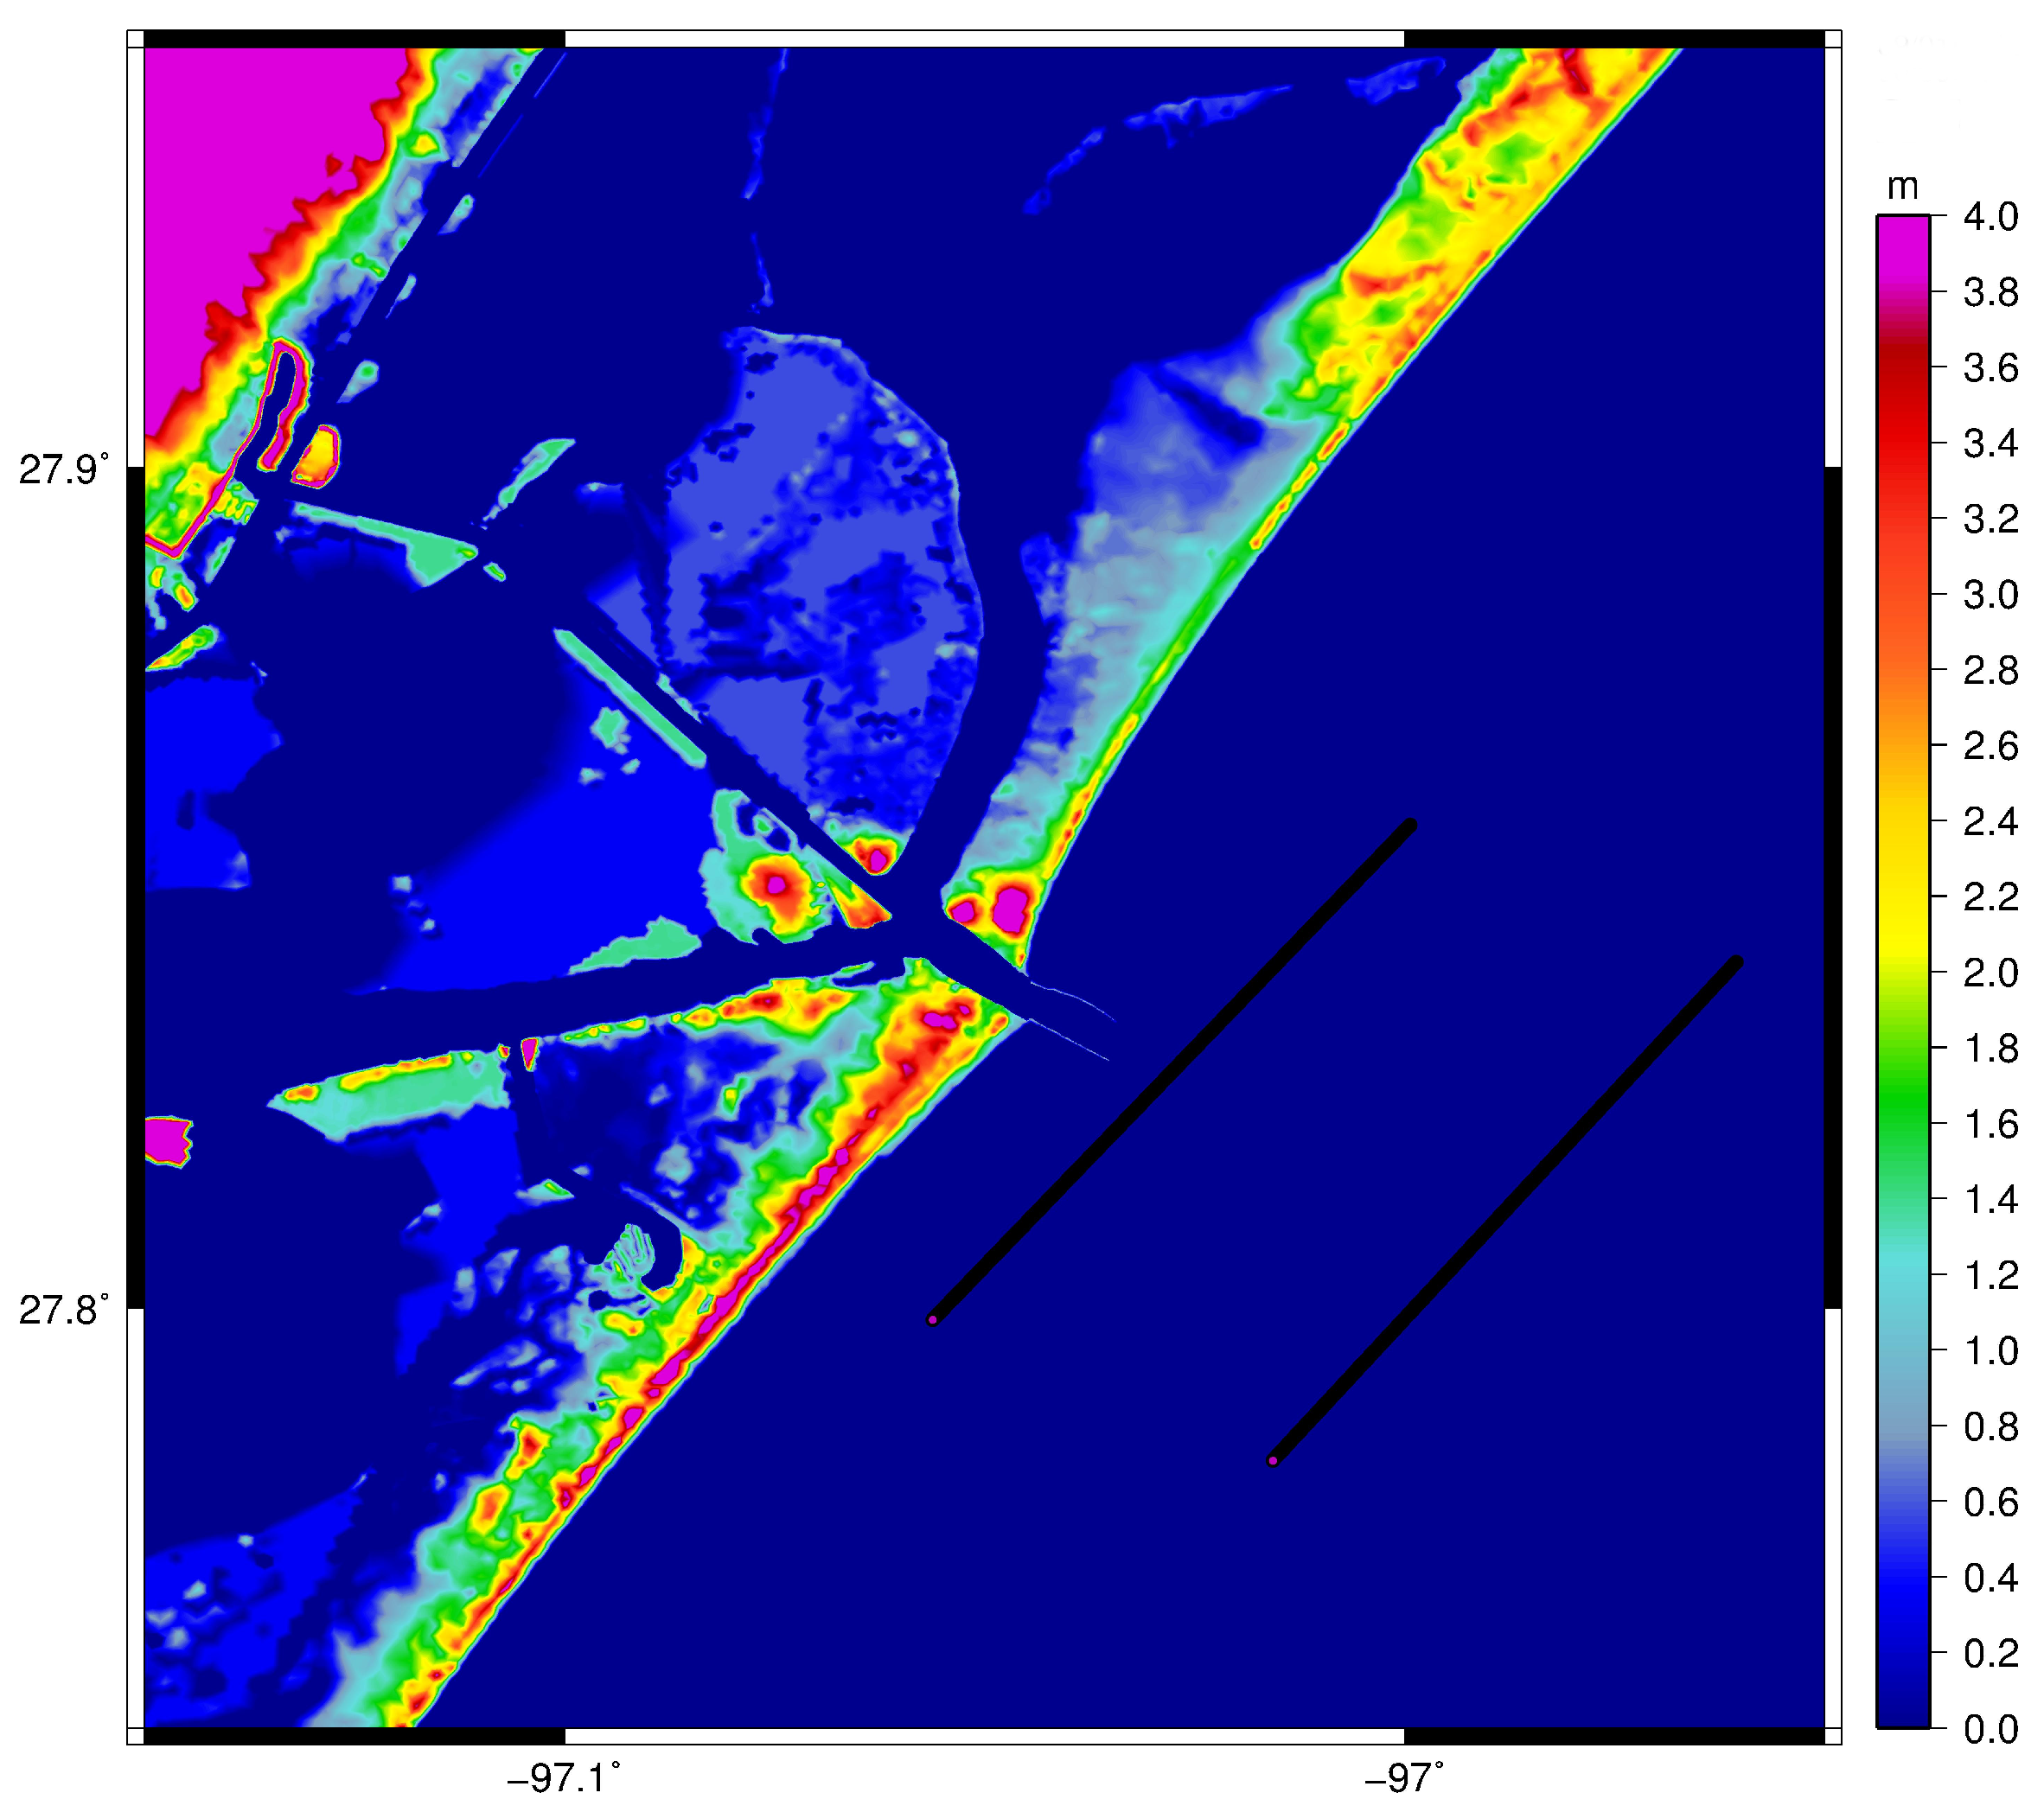
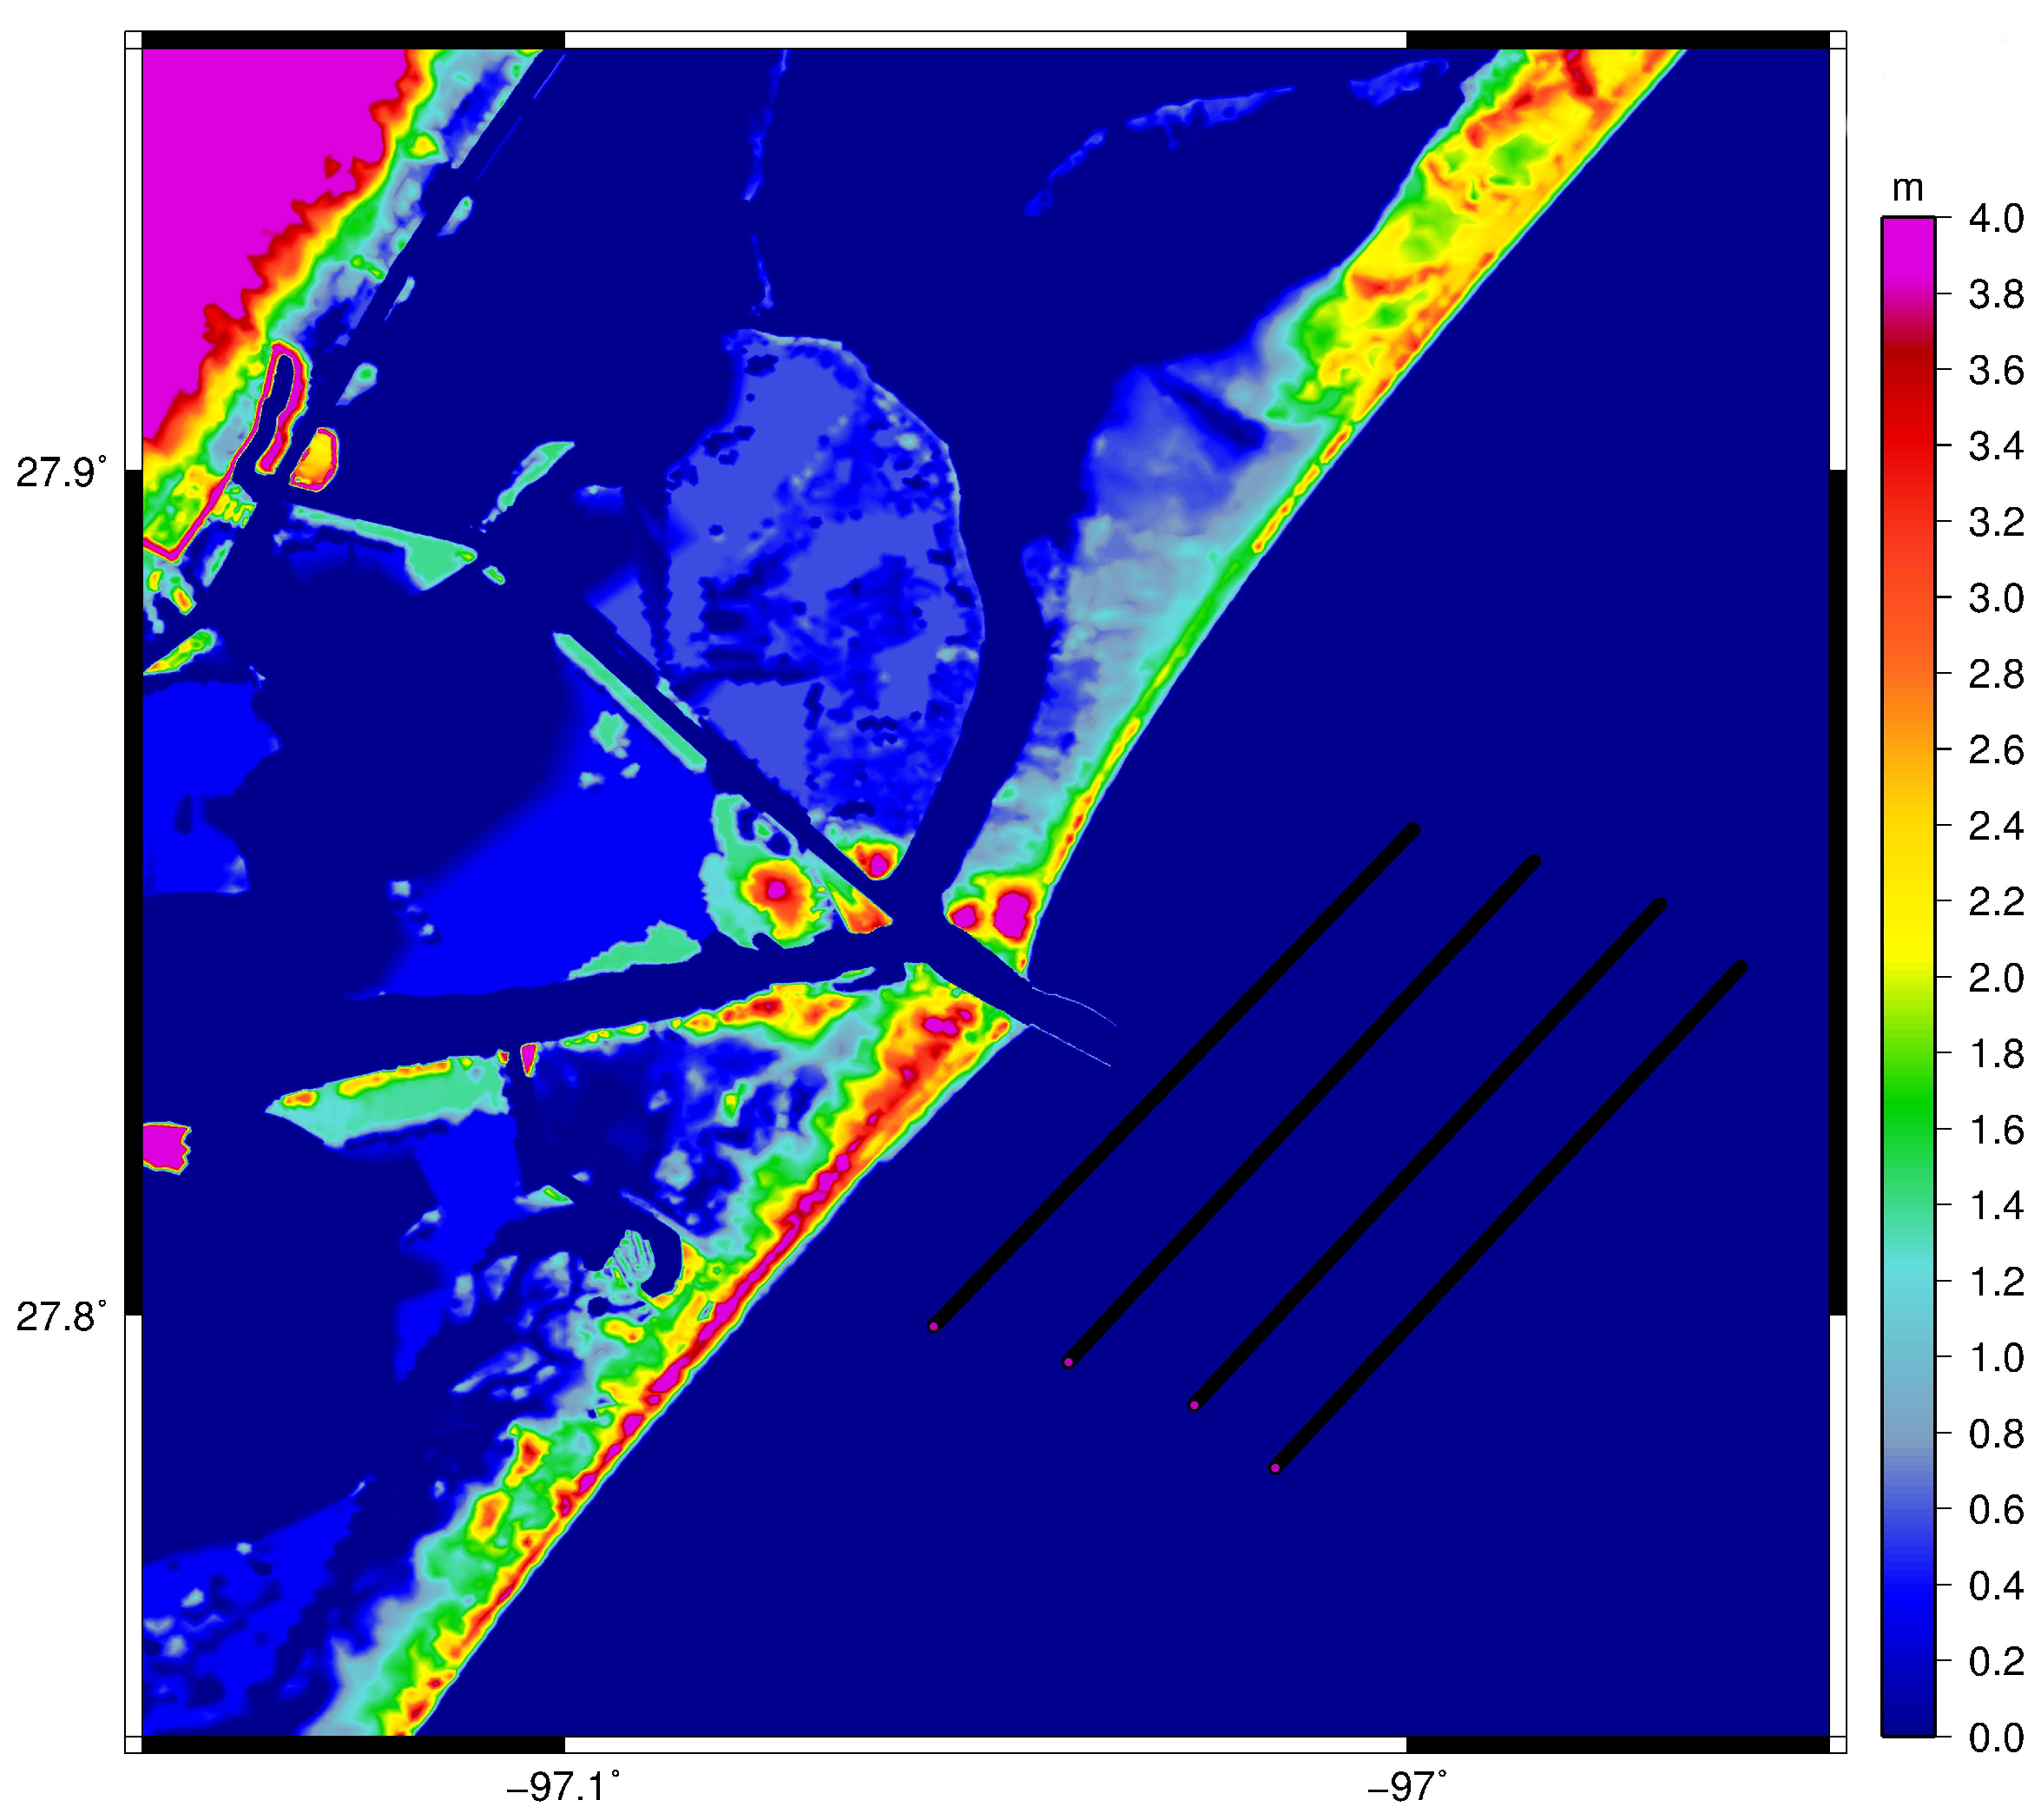
The required inputs for this particle tracking code are the ADCIRC velocity fields and the initial distribution of particles in the domain. We made choices for initial particle locations based on the work of Brown et al. [10], where the particles are released in the nearshore region outside the Aransas Pass. In total, we consider four initial conditions with different distribution and densities of particles. In the work of Brown et al. [2,10,11], particles were released on fixed time intervals to simulate the spawning patterns of the red drum. Since the goal of this study was to assess the effects of changing the bathymetry of the Corpus Christi Ship Channel, we consider only the transport of particles that are released at fixed locations at the start of each simulation. We consider four distinctive cases of initial particle locations in the nearshore region, these are shown in Figure 8, Figure 9, Figure 10 and Figure 11. The particles in the initial conditions in Figure 8, Figure 10, and Figure 11 appear as black lines, whereas in Figure 9, each purple dot along the coast signify 49 particles.
Cases I and II are adapted from [10], and cases III and IV are chosen to compare the effect of increased particle release near Aransas Pass inlet.
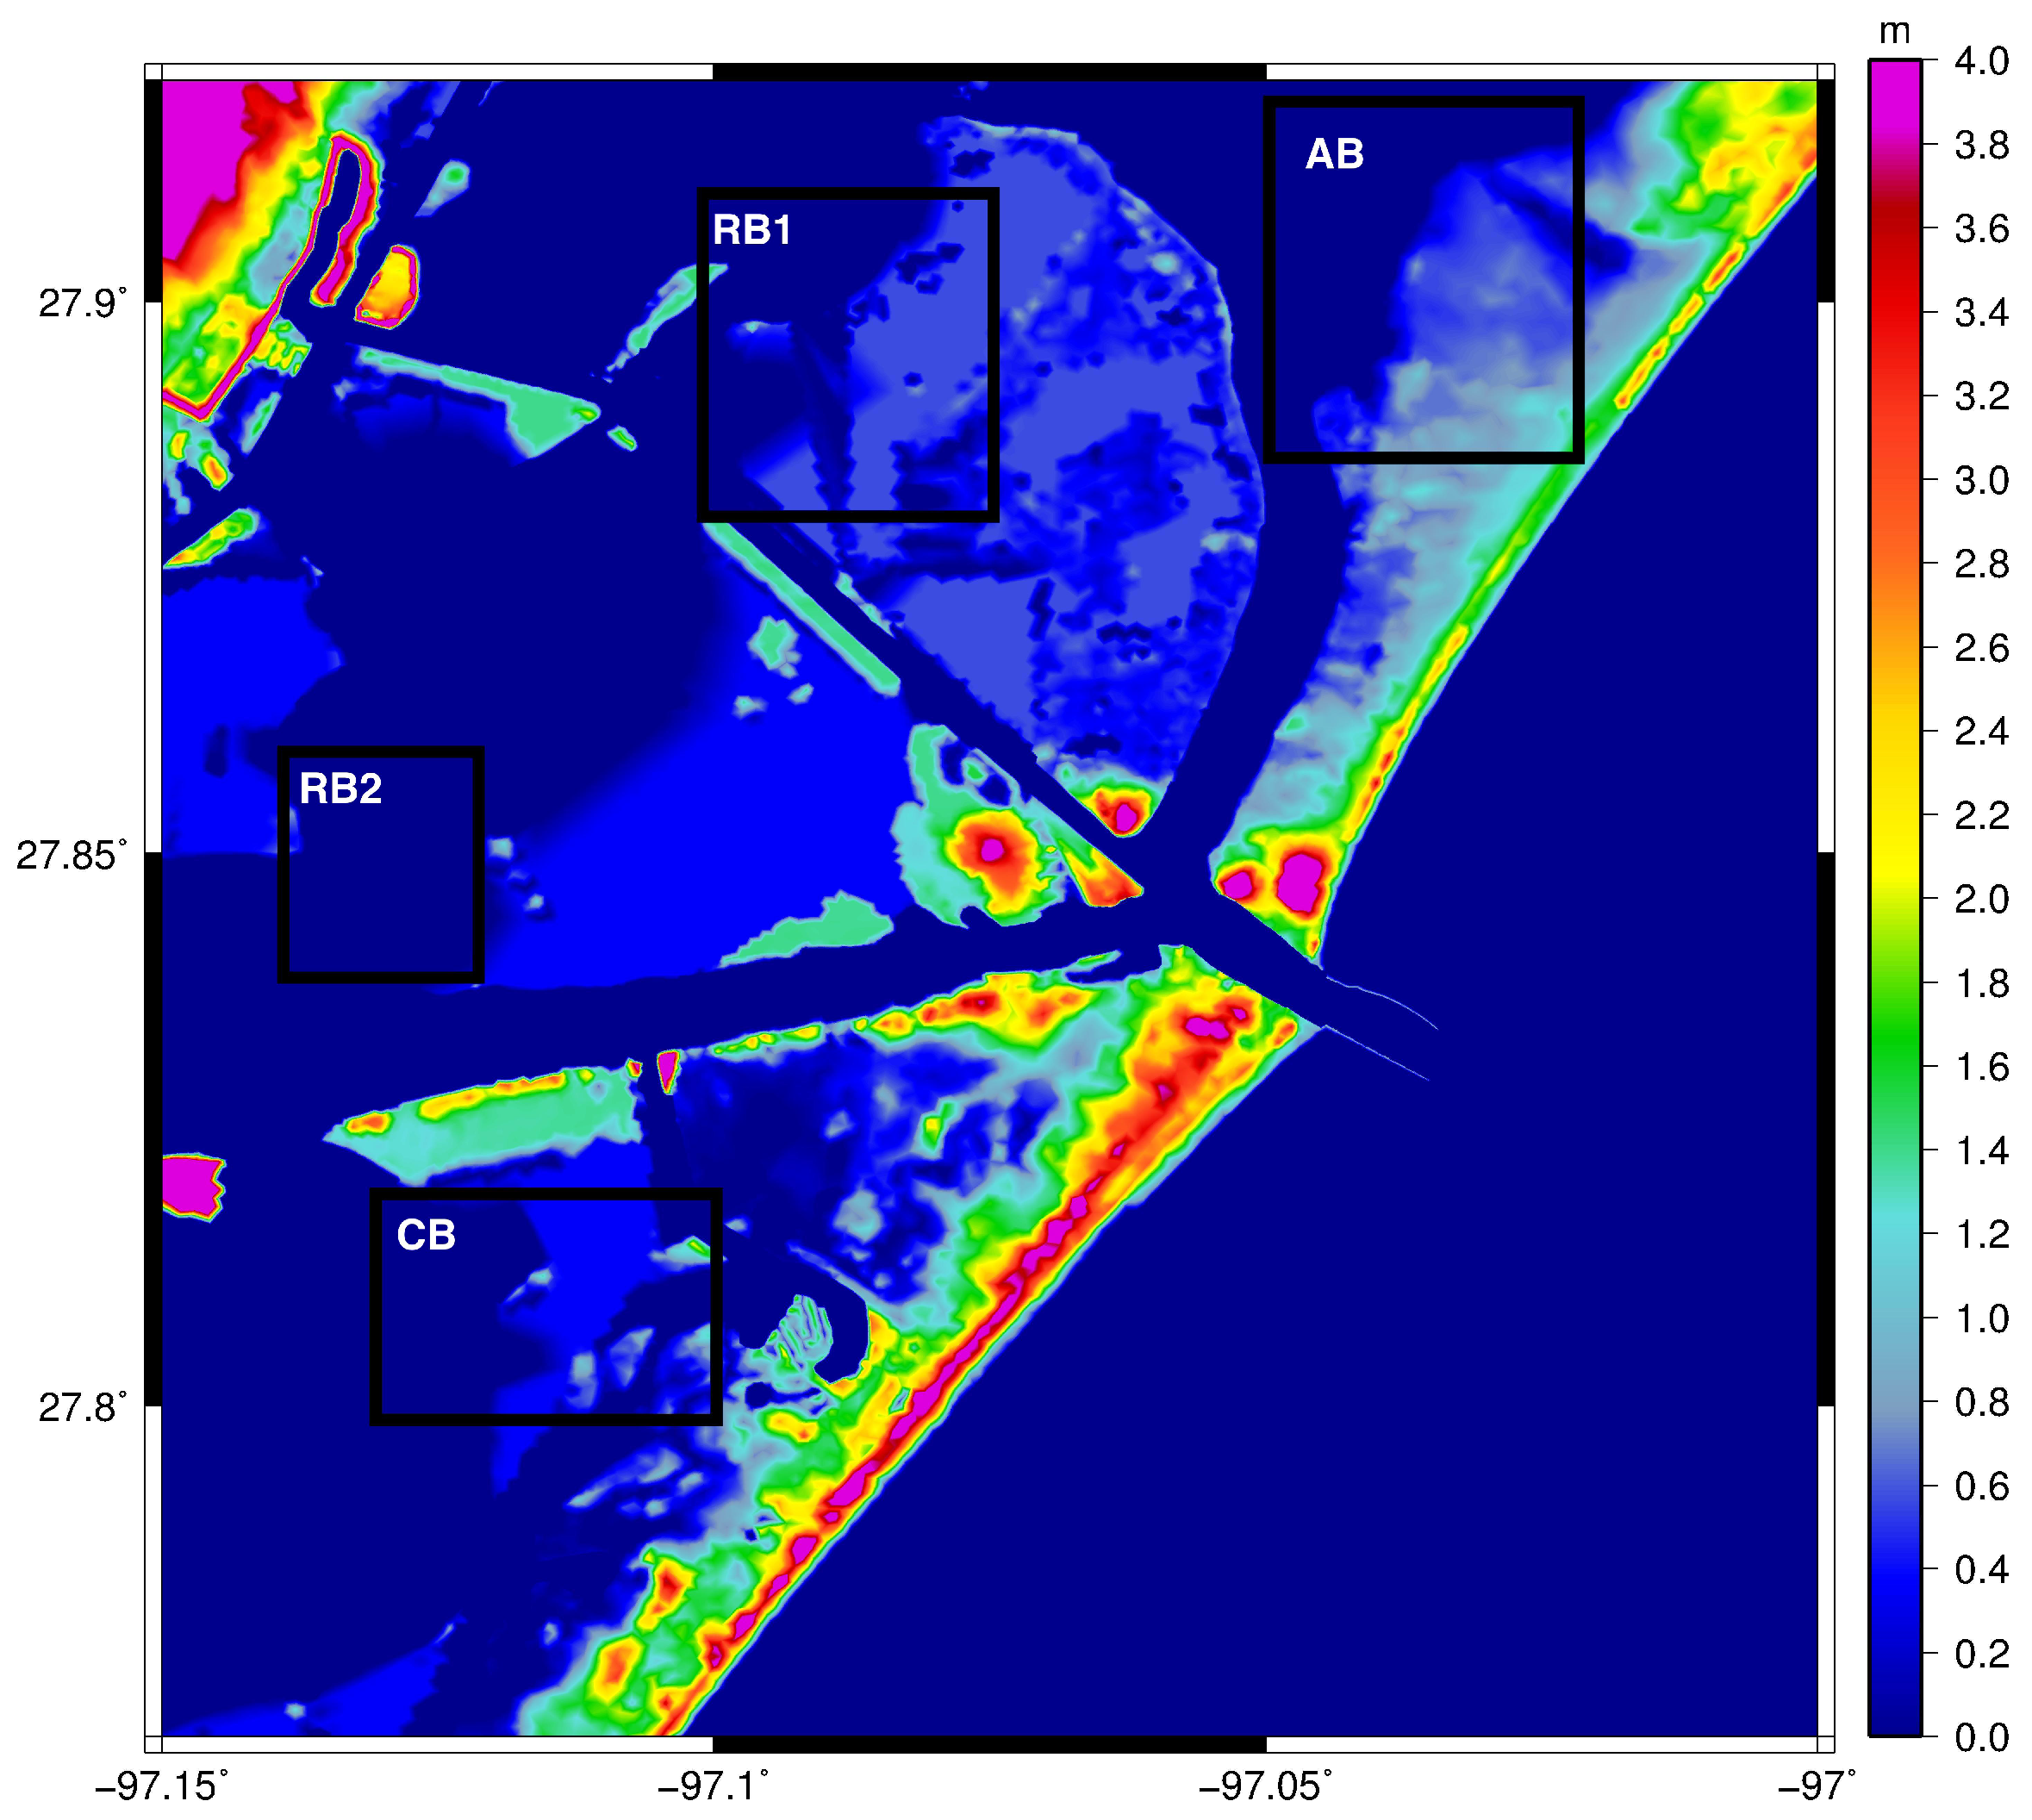
To assess the number of larvae that reach the seagrass beds inside Aransas Pass, we consider four predetermined locations in which we monitor and count the particles. The areas we consider are based on the monitoring locations from [10] in the Aransas, Redfish, and Corpus Christi bays. In Figure 12, we show the four locations in which we monitor the accumulation of particles and have used the same abbreviated designations as [10] for these locations: AB (Aransas Bay), CB (Corpus Christi Bay), and RB (Redfish Bay) 1 and 2.
To analyze the data from the particle tracking algorithm, we monitored the particle location throughout the simulation. Once a particle reaches a suitable habitat, its velocity is set to zero and we consider it to be a successfully recruited larvae. This is a rather simplistic approach; however, it is appropriate here as our goal to ascertain if the number of larvae that reach the seagrass beds is impacted by the changed channel bathymetry.

3. Results

3.1. Velocity in the Aransas Pass

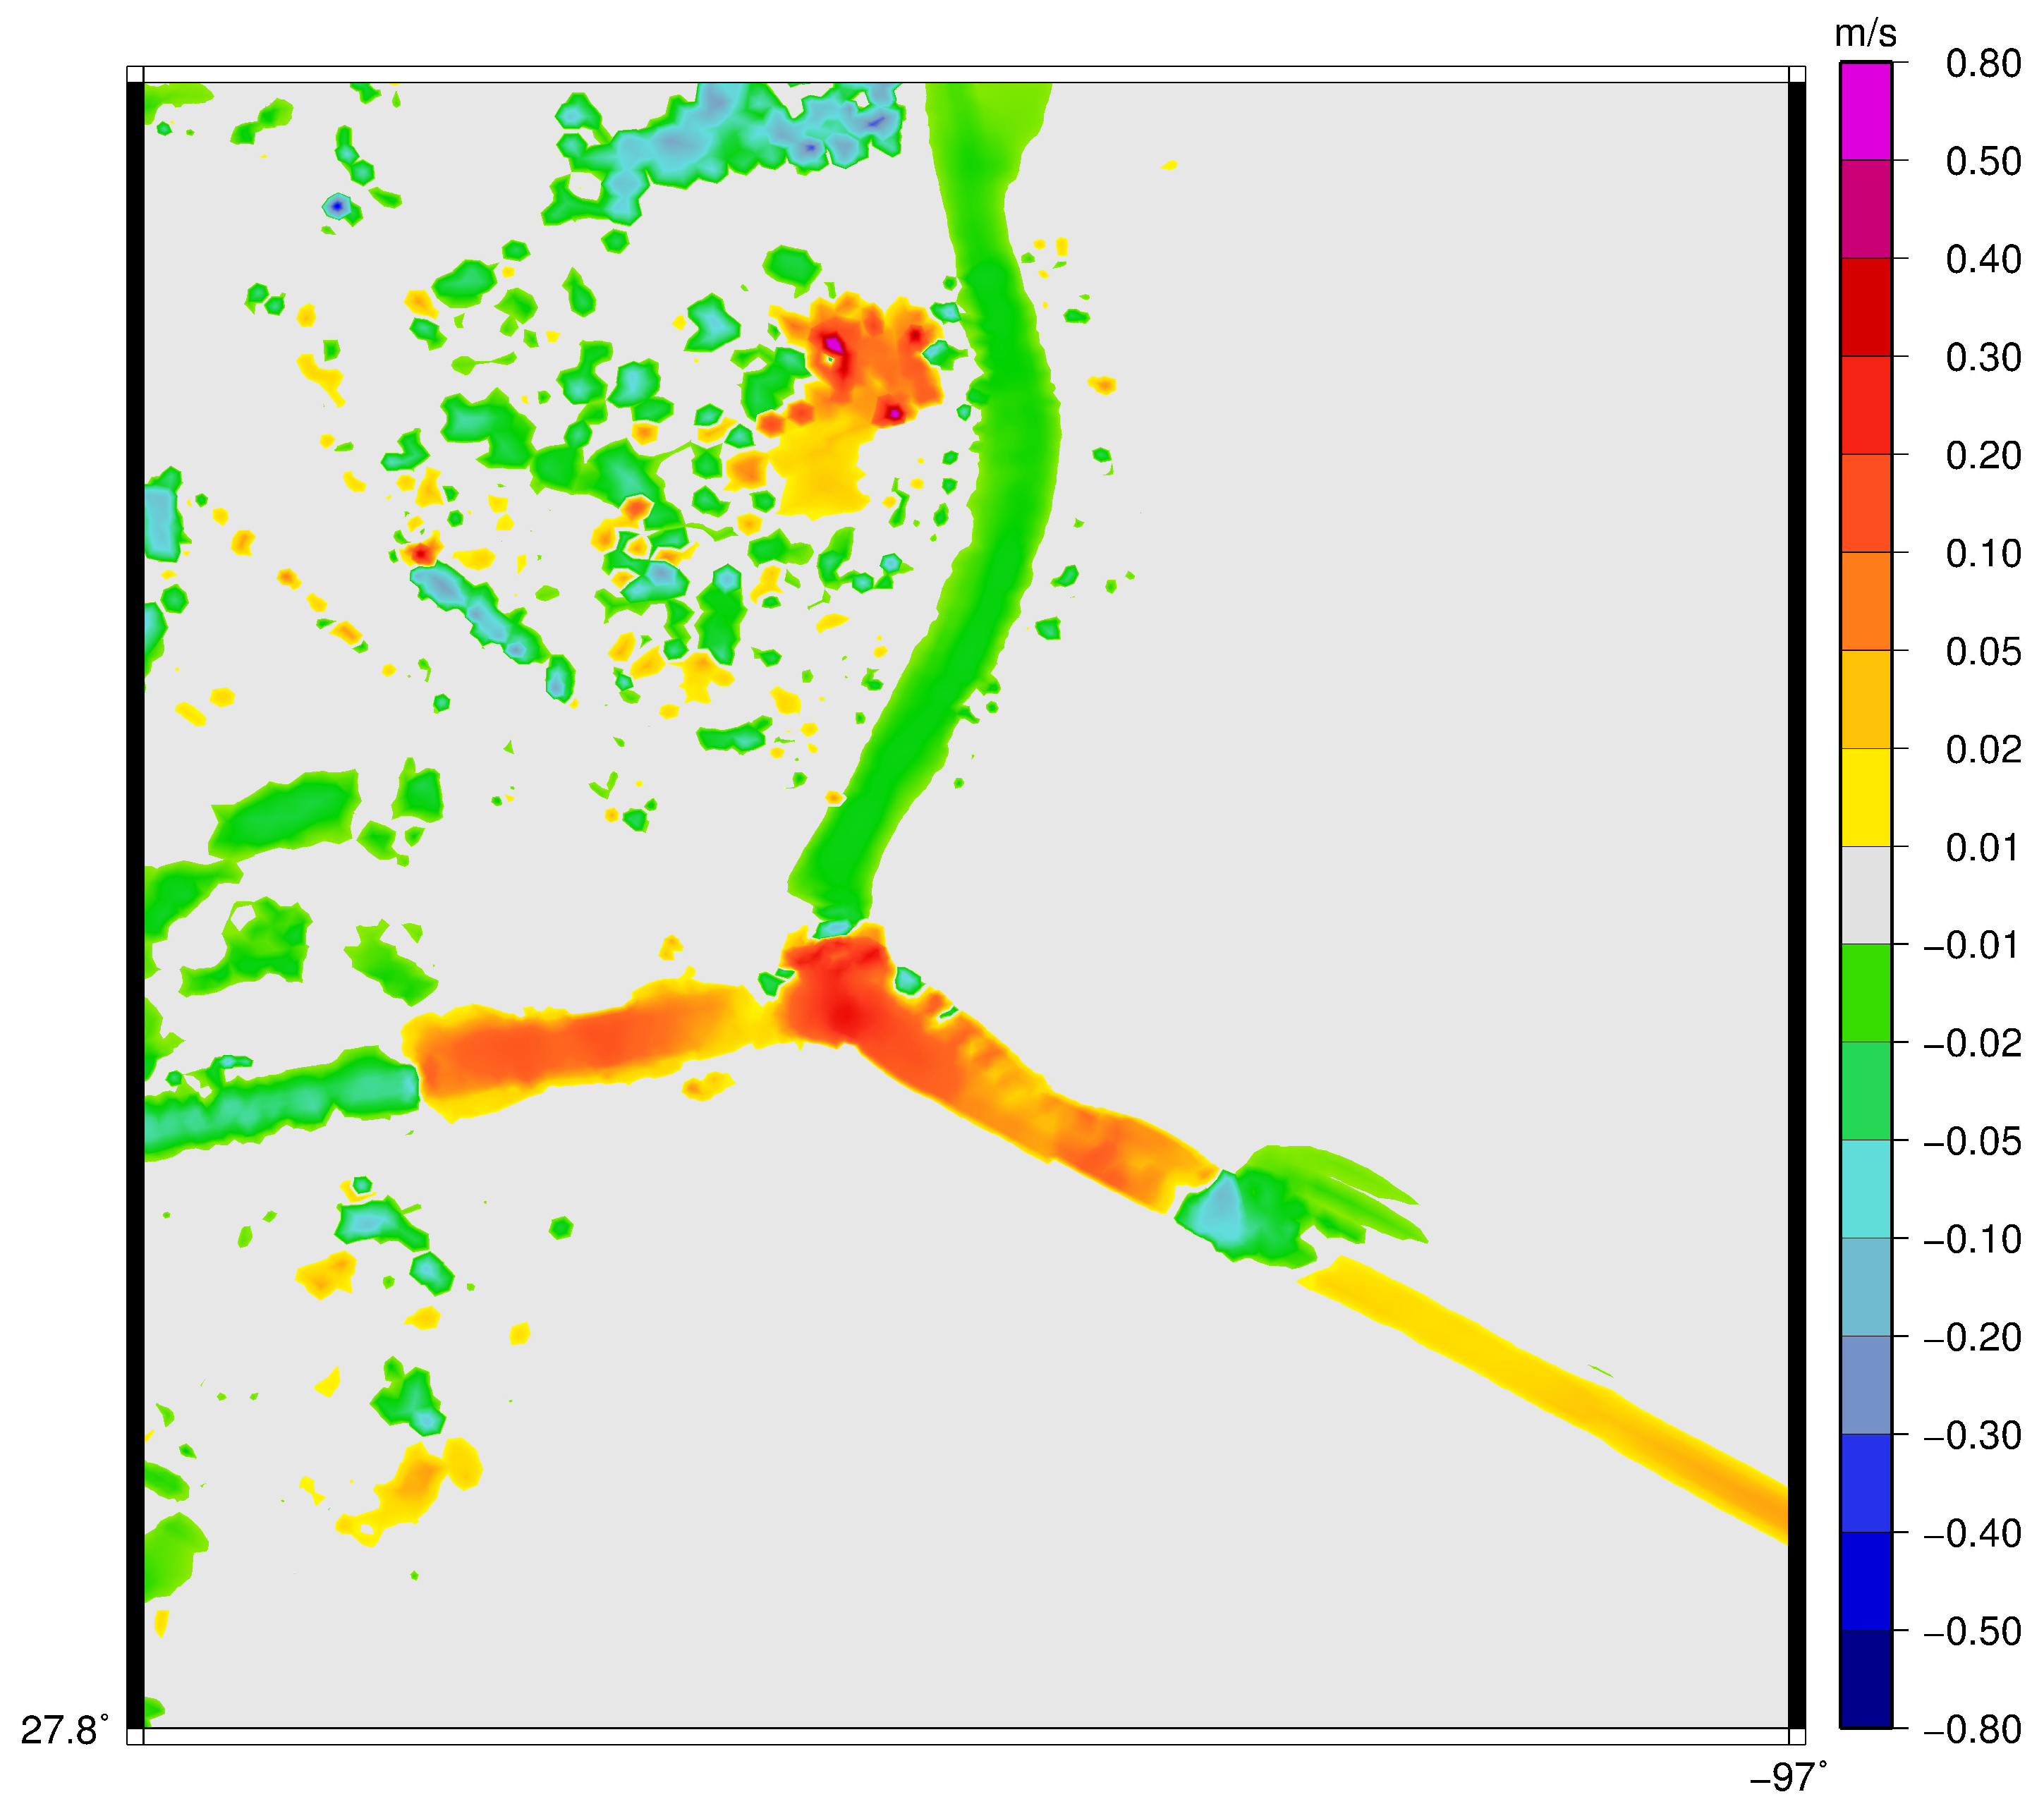
As a first investigation, we consider the changes in flow characteristics in the Aransas pass. Since larvae must enter Aransas Pass to reach the seagrass beds, this is a natural choice. To assess the difference in the velocities, we consider the maximum velocity established from the ADCIRC model for the considered years. In Figure 13, we present the difference in the 2012 maximum velocities. Inspection of this figure reveals a slight change in the maximum velocity, likely due to the deepened Ship Channel as the tidal and meteorological forcing used are identical; however, the change is rather small and the maximum velocity remains largely unaffected in most of this area.

3.2. Particle Tracking

Here, we report the results from the particle tracking code for each year considered for both current and proposed bathymetries. We compute the total number of successfully recruited larvae in the four monitoring areas shown in Figure 12. Since the change in bathymetry can lead to a change in how the water is distributed among the bays inside Aransas Pass, we also report the number of larvae in each individual area to ascertain the differences in larvae distribution.
In Table 1 and Table 2, the results for the total number of successfully recruited larvae are presented for 2012 and 2019, respectively.
From these tables, it is evident that the number of larvae that successfully reach the seagrass beds is highly dependent on the chosen initial conditions as well as the meteorological conditions (e.g., dry versus normal). Comparison of the total number of larvae that reach the predetermined monitoring locations for the current and future bathymetries show that the effect of changes to the channel depth is small. Comparison of the results for initial conditions III and IV reveals that doubling the number of initial larvae leads to roughly four times more successfully recruited larvae in the monitoring locations. Hence, the initial number of particles have a significant impact on the total number that reaches the beds. For both years, we actually see a slight increase in the number of larvae that reach the nursery grounds, which indicates that the slight reduction in velocity in the Aransas Pass may allow more larvae to successfully enter the inlet.
To provide further insight into the changes in successful larvae, we present the detailed data for each monitoring location in Table 3 and Table 4. For both current and future channel depths we see that the largest portion of the larvae reach location AB for 2012 and location CB for 2019. Overall, the two locations along the southern split past the Aransas Pass, the Corpus Christi Ship Channel, see a slight increase of 88 successful larvae, whereas the two along northern split, the Lydia Ann channel, see a negligibly small increase of 4.

3.3. Influence of Extreme Flow Conditions

As a final experiment, we consider a case in which we incorporate extreme inflow into the domain from the Nueces river, which enters into Corpus Christi bay from the Nueces bay in addition to the forcing from tides and winds. The Nueces River consists of multiple dams and reservoirs and the river is regulated by the Nueces River Authority. The volume of water entering Corpus Christi bay from this river is generally expected not to significantly impact the transport of larvae; however, it is possible that in extreme flooding scenarios, there will be an impact on the flow in Aransas Pass and thus on the transport of larvae.
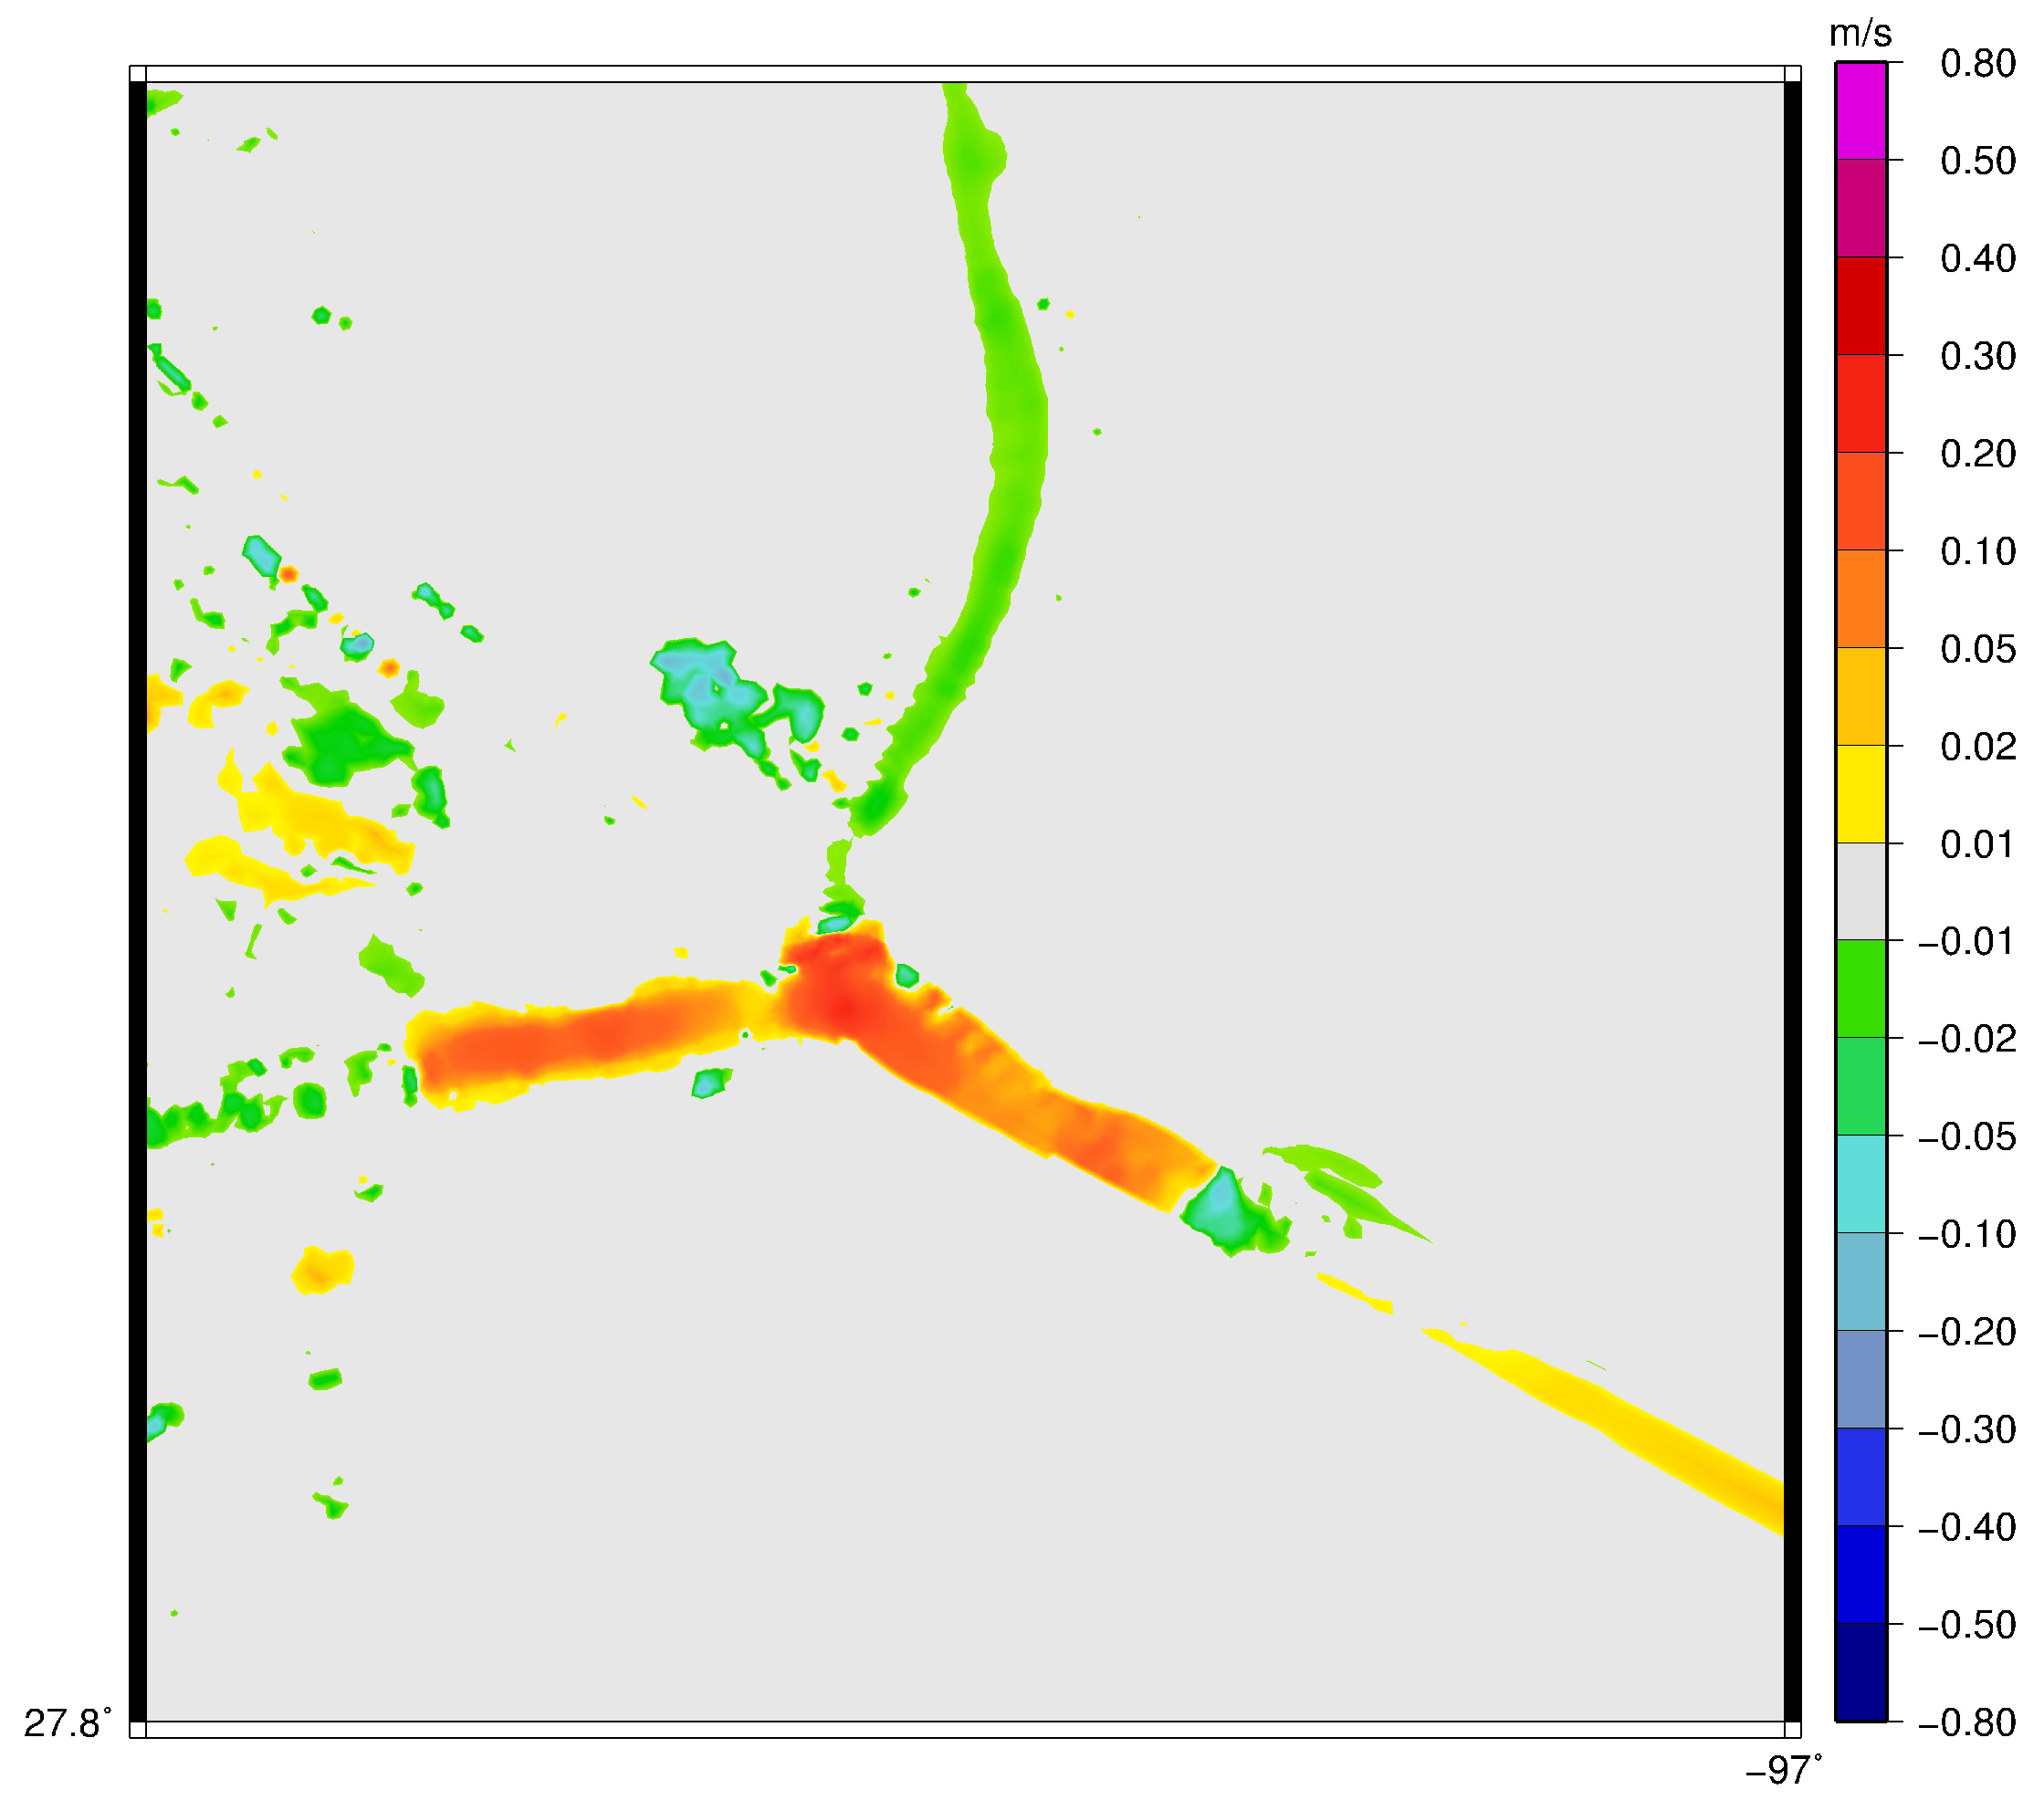
To model such an extreme case, we consider the all-time peak flow in the Nueces river established from a USGS stream gauge (USGS 08211500 Nueces Rv at Calallen). The observed peak flow of 49 , 000 cubic feet per second (cfs) was on 16 September 2002. As these events are isolated extremes, we consider a time span of ten days, five before and five after the peak flow. While this time span is too short to ensure accumulation of a similar number of particles as in Section 3.2, it allows us to compare accumulation for the current and proposed bathymetries in an extreme riverine inflow case. In Figure 14, the difference in maximum velocity established from the ADCIRC model for the existing and proposed bathymetries are shown. For this extreme case, the difference between the maximum velocities is small, in the same fashion observed in, e.g., Figure 13. It should also be noted that the change in maximum velocity near the channel appears to be unaffected by the very high inflow from the Nueces River.
In Table 5, the results for the total number of successfully recruited larvae are presented for the extreme scenario. While the number of successful particles is lower than for the past experiment due to the shorter time span, the effect of a deeper channel is small on the number of successfully recruited larvae. Comparison of Table 1 and Table 5 reveals a similar trend across all four initial conditions.

4. Discussion

Coastal regions are characterized by uncertainty over feedbacks between linked human–natural systems, and sometimes infrastructure development decisions are made without complete information about the risks to these linked systems. More information was needed about the possible environmental impacts of plans to significantly increase the depth of the Aransas Ship Channel at Port Aransas, Texas to accommodate very large crude oil tankers. This channel is the only connection between local bays and estuaries and the coastal ocean for tens of miles in either direction. One major potential impact of proposed anthropogenic changes in hydrology of the ship channel is an alteration in the recruitment of estuarine dependent larvae [2]. Several species of shellfish and finfish of commercial or recreational importance in this region possess life history patterns that are dependent upon estuaries. Juvenile members of these species live and mature in these estuary “nurseries”, then migrate to coastal ocean as reproductive adults, releasing their eggs. The planktonic larvae hatch and are dispersed by currents along the coast, but must return to estuaries to complete their life cycle. These planktonic larvae are too small and weakly swimming to migrate directly back into the estuaries under their own power, so they must depend on hydrodynamic processes to recruit back to the estuaries and develop into reproductive adults.
To study the impacts of the proposed deepening of the Corpus Chisti Ship Channel, we have created mathematical models governing the transport of passive particles (red drum larvae) from the nearshore region outside Aransas Pass near Corpus Christi. The models consider identical time spans from 1 September to 31 October and employ tidal and meteorological forcing from 2012 and 2019 to establish the flow velocity and elevation throughout the domain of interest (the ADCIRC model). In the report [24] (Supplementary Materials), we also consider another year that is neither normal or dry, however, the conclusions of the report are identical to this work. Red drum larvae modeled as passive particles are released in multiple locations 1 September and are tracked throughout the following 60 days based on the established flow from the ADCIRC model. The ADCIRC and particle tracking models consider both the current bathymetric conditions for the Corpus Christi Ship Channel as well as the proposed future bathymetric conditions of a dredged channel.
We compare the changes in the transport of larvae through the Aransas Pass by counting the number of larvae that reach predetermined monitoring locations in the areas behind the pass. The established results indicate that the changes in channel bathymetry do not significantly change the number of successfully recruited red drum larvae in these locations; however, as evident from the results in Table 1, Table 2, Table 3 and Table 4, the number of particles and their initial locations have significant impact onto the transport of particles. While several other initial larvae distributions could be considered, we selected four cases that are close to past studies [2,10,11] of larvae transport in the studied region. In future works, the effect of these conditions should be studied further along with cases of continuous generation of larvae in line with the spawning patters of red drum fish. It should also be noted that we do not account for the transport of larvae near the water surface due to wind (wind is part of the ADCIRC model forcing), a potentially significant source of transport as noted by [2]. Fortunately, this type of larvae transport is likely to be unaffected by a change in channel bathymetry. Finally, to assess the impacts of extreme inflow from rivers entering into Corpus Christi bay, we also consider the effect of the all time record flow in the Nueces river. To isolate these effects, we consider only a 10 day span covering this peak flow. In Table 5, the results for this case show that the number of successfully recruited larvae remain largely unaffected by the changes in channel bathymetry.
Despite the slight decrease in velocity as shown in Section 3.1, the total flux of water into the bay (i.e., velocity times water depth) may actually be increased due to the deeper channel. Another uncertainty relates to treating the red drum fish larvae as purely passive particles. These small, recently hatched larvae have weak swimming capabilities (a few mm/s [25]), compared to tidal currents of greater than a meter per second in the ship channel; however, there is some evidence for selective tidal stream transport in some estuarine dependent larvae [26], which may allow them to use environmental information to adjust their vertical positions in the water column to move up toward the faster surface currents on flood tides and descend to greater depths with slower currents on ebb tides to increase their chances of retention in favorable habitats for recruitment. It is not known if red drum larvae perform selective tidal stream transport behavior, but for species that employ this behavior, the increase in channel depth could have a greater impact on recruitment if it interfered with their ability to alter vertical position enough to increase estuarine retention. Further analyses and model development in these particular areas are a potential future research thrust that is beyond the scope of the present study.

Supplementary Materials

This article has a corresponding report that is available from the University of Texas at Austin Marine Science institute library https://utmsi.utexas.edu/ accessed on 20 June 2021).

Author Contributions

Conceptualization, E.J.B. and C.D.; validation, M.D.L.; investigation, E.V., M.D.L. and C.D.; resources, C.D.; data curation, E.V. and M.D.L.; writing—original draft preparation, E.V.; writing—review and editing, E.V., M.D.L., C.D. and E.J.B.; visualization, E.V. and M.D.L.; supervision, C.D.; project administration, C.D.; funding acquisition, E.J.B. All authors have read and agreed to the published version of the manuscript.

Funding

The present study was conceived of and initiated by scientists at the University of Texas Marine Science Institute and carried out by faculty and staff from the Oden Institute for Computational Engineering and Sciences of the University of Texas at Austin. Funding provided by the Marine Science Institute included generous contributions made by members of the University of Texas Marine Science Advisory Council, in response to a special request for funds.

Institutional Review Board Statement

Not applicable.

Informed Consent Statement

Not applicable.

Data Availability Statement

The data presented in this study are available on request from the corresponding author. The data are not publicly available as it can be recreated using the openly available software used in this work.

Acknowledgments

This project gratefully acknowledges the use of supercomputing resources at the Texas Advanced Computing Center through the allocation entitled “ADCIRC”.

Conflicts of Interest

The authors declare no conflict of interest.

References

  1. Hamilton, P.; Wood, E.; Lin, L.; Campbell, T.; Olson, L.; Jones, S.; Howard, S.; Skalbeck, K. Alternatives to Manage Sediment at the Intersection of the Gulf Intracoastal Waterway (GIWW) and the Corpus Christi Ship Channel (CCSC); Technical Report; Engineer Research and Development Center Vicksburg: Vicksbourg, MS, USA, 2018. [Google Scholar]
  2. Brown, C.; Holt, S.; Jackson, G.; Brooks, D.; Holt, G. Simulating larval supply to estuarine nursery areas: How important are physical processes to the supply of larvae to the Aransas Pass Inlet? Fish. Oceanogr. 2004, 13, 181–196. [Google Scholar] [CrossRef]
  3. Jenkins, G.P.; Black, K.P.; Wheatley, M.J.; Hatton, D.N. Temporal and spatial variability in recruitment of a temperate, seagrass-associated fish is largely determined by physical processes in the pre-and post-settlement phases. Mar. Ecol. Prog. Ser. 1997, 148, 23–35. [Google Scholar] [CrossRef]
  4. Matlock, G.C. The life history of the red drum. In Manual of Red Drum Aquaculture; Chamberlain, G.W., Miget, R.J., Haby, M.G., Eds.; Texas Agricultural Extension Service and Sea Grant College Program; Texas A&M University: College Station, TX, USA, 1987; pp. 1–47. [Google Scholar]
  5. Holt, G.J.; Holt, S.A.; Arnold, C.R. Diel periodicity of spawning in sciaenids. Mar. Ecol. Prog. Ser. 1985, 27, 7. [Google Scholar] [CrossRef]
  6. Holt, S.A.; Kitting, C.L.; Arnold, C.R. Distribution of young red drums among different sea-grass meadows. Trans. Am. Fish. Soc. 1983, 112, 267–271. [Google Scholar] [CrossRef]
  7. Leis, J.M.; Carson-Ewart, B.M. Orientation of pelagic larvae of coral-reef fishes in the ocean. Mar. Ecol. Prog. Ser. 2003, 252, 239–253. [Google Scholar] [CrossRef]
  8. Smith, N.P.; Stoner, A.W. Computer simulation of larval transport through tidal channels: Role of vertical migration. Estuar. Coast. Shelf Sci. 1993, 37, 43–58. [Google Scholar] [CrossRef]
  9. Bowden, K.; Hamilton, P. Some experiments with a numerical model of circulation and mixing in a tidal estuary. Estuar. Coast. Mar. Sci. 1975, 3, 281–301. [Google Scholar] [CrossRef]
  10. Brown, C.; Jackson, G.; Holt, S.; Holt, G. Spatial and temporal patterns in modeled particle transport to estuarine habitat with comparisons to larval fish settlement patterns. Estuar. Coast. Shelf Sci. 2005, 64, 33–46. [Google Scholar] [CrossRef]
  11. Brown, C.A.; Jackson, G.A.; Brooks, D.A. Particle transport through a narrow tidal inlet due to tidal forcing and implications for larval transport. J. Geophys. Res. Ocean. 2000, 105, 24141–24156. [Google Scholar] [CrossRef] [Green Version]
  12. Lynch, D.R.; Ip, J.T.; Naimie, C.E.; Werner, F.E. Comprehensive coastal circulation model with application to the Gulf of Maine. Cont. Shelf Res. 1996, 16, 875–906. [Google Scholar] [CrossRef]
  13. Lynch, D.R.; Gray, W.G. A wave equation model for finite element tidal computations. Comput. Fluids 1979, 7, 207–228. [Google Scholar] [CrossRef]
  14. Blanton, B. DROG3D: User’s Manual for 3-Dimensional Drogue Tracking on a Finite Element Grid with Linear Finite Elements; Program in Marine Sciences; University of North Carolina: Chapel Hill, NC, USA, 1995. [Google Scholar]
  15. Luettich, R.A.; Westerink, J.J.; Scheffner, N.W. ADCIRC: An Advanced Three-Dimensional Circulation Model for Shelves, Coasts, and Estuaries. Report 1, Theory and Methodology of ADCIRC-2DD1 and ADCIRC-3DL; Technical Report; Engineer Research and Development Center Vicksburg: Vicksbourg, MS, USA, 1992. [Google Scholar]
  16. Dietrich, J.; Trahan, C.; Howard, M.; Fleming, J.; Weaver, R.; Tanaka, S.; Yu, L.; Luettich, R., Jr.; Dawson, C.; Westerink, J.; et al. Surface trajectories of oil transport along the Northern Coastline of the Gulf of Mexico. Cont. Shelf Res. 2012, 41, 17–47. [Google Scholar] [CrossRef]
  17. Tan, W.Y. Shallow Water Hydrodynamics: Mathematical Theory and Numerical Solution for a Two-Dimensional System of Shallow-Water Equations; Elsevier: Amsterdam, The Netherlands, 1992. [Google Scholar]
  18. Manning, R.; Griffith, J.P.; Pigot, T.; Vernon-Harcourt, L.F. On the Flow of Water in Open Channels and Pipes; Transaction of the Institution of Civil Engineers of Ireland: Dublin, Ireland, 1890; Volume 20. [Google Scholar]
  19. Hope, M.E.; Westerink, J.J.; Kennedy, A.B.; Kerr, P.; Dietrich, J.C.; Dawson, C.; Bender, C.J.; Smith, J.; Jensen, R.E.; Zijlema, M.; et al. Hindcast and validation of Hurricane Ike (2008) waves, forerunner, and storm surge. J. Geophys. Res. Ocean. 2013, 118, 4424–4460. [Google Scholar] [CrossRef] [Green Version]
  20. Pringle, W. Oceanmesh2d: User Guide—Precise Distance-Based Two-Dimensional Automated Mesh Generation Toolbox Intended for Coastal Ocean/Shallow Water. 2018. Available online: https://www3.nd.edu/coast/reports_papers/2018-oceanmesh2d-user-guide.pdf (accessed on 7 October 2020).
  21. Egbert, E. Efficient inverse modeling of barotropic ocean tides. J. Atmos. Ocean. Technol. 2002, 19, 183–204. [Google Scholar] [CrossRef] [Green Version]
  22. Blain, C.A.; Rogers, W.E. Coastal Tide Prediction Using the adcirc-2ddi Hydrodynamic Finite Element Model: Model Validation and Sensitivity Analyses in the Southern North Sea/English Channel; Technical Report; Naval Research Lab Stennis Space Center MS Coastal and Semi-Enclosed Seas Section: Hancock County, MS, USA, 1998. [Google Scholar]
  23. Cyriac, R.; Dietrich, J.; Blain, C.; Dawson, C.; Dresback, K.; Fathi, A.; Bilskie, M.; Graber, H.; Hagen, S.; Kolar, R. Wind and tide effects on the Choctawhatchee Bay plume and implications for surface transport at Destin Inlet. Reg. Stud. Mar. Sci. 2020, 35, 101131. [Google Scholar] [CrossRef]
  24. Dawson, C.; Loveland, M.; Valseth, E. Potential Effects of Deepening of the Aransas Ship Channel on Particle Transport: Implications for Recruitment of Estuarine Dependent Larvae. 2021. Available online: https://utmsi.utexas.edu/images/MSI/Blog_Research/OdenInstitute_PotentialEffectsofDeepeningoftheAransasShipChannelonParticleTransport.pdf (accessed on 20 June 2021).
  25. Fuiman, L.; Smith, M.; Malley, V. Ontogeny of routine swimming speed and startle responses in red drum, with a comparison of responses to acoustic and visual stimuli. J. Fish Biol. 1999, 55, 215–226. [Google Scholar] [CrossRef]
  26. Forward, R.B.; Tankersley, R.A.; Welch, J.M. Selective tidal-stream transport of the blue crab Callinectes sapidus: An overview. Bull. Mar. Sci. 2003, 72, 347–365. [Google Scholar]
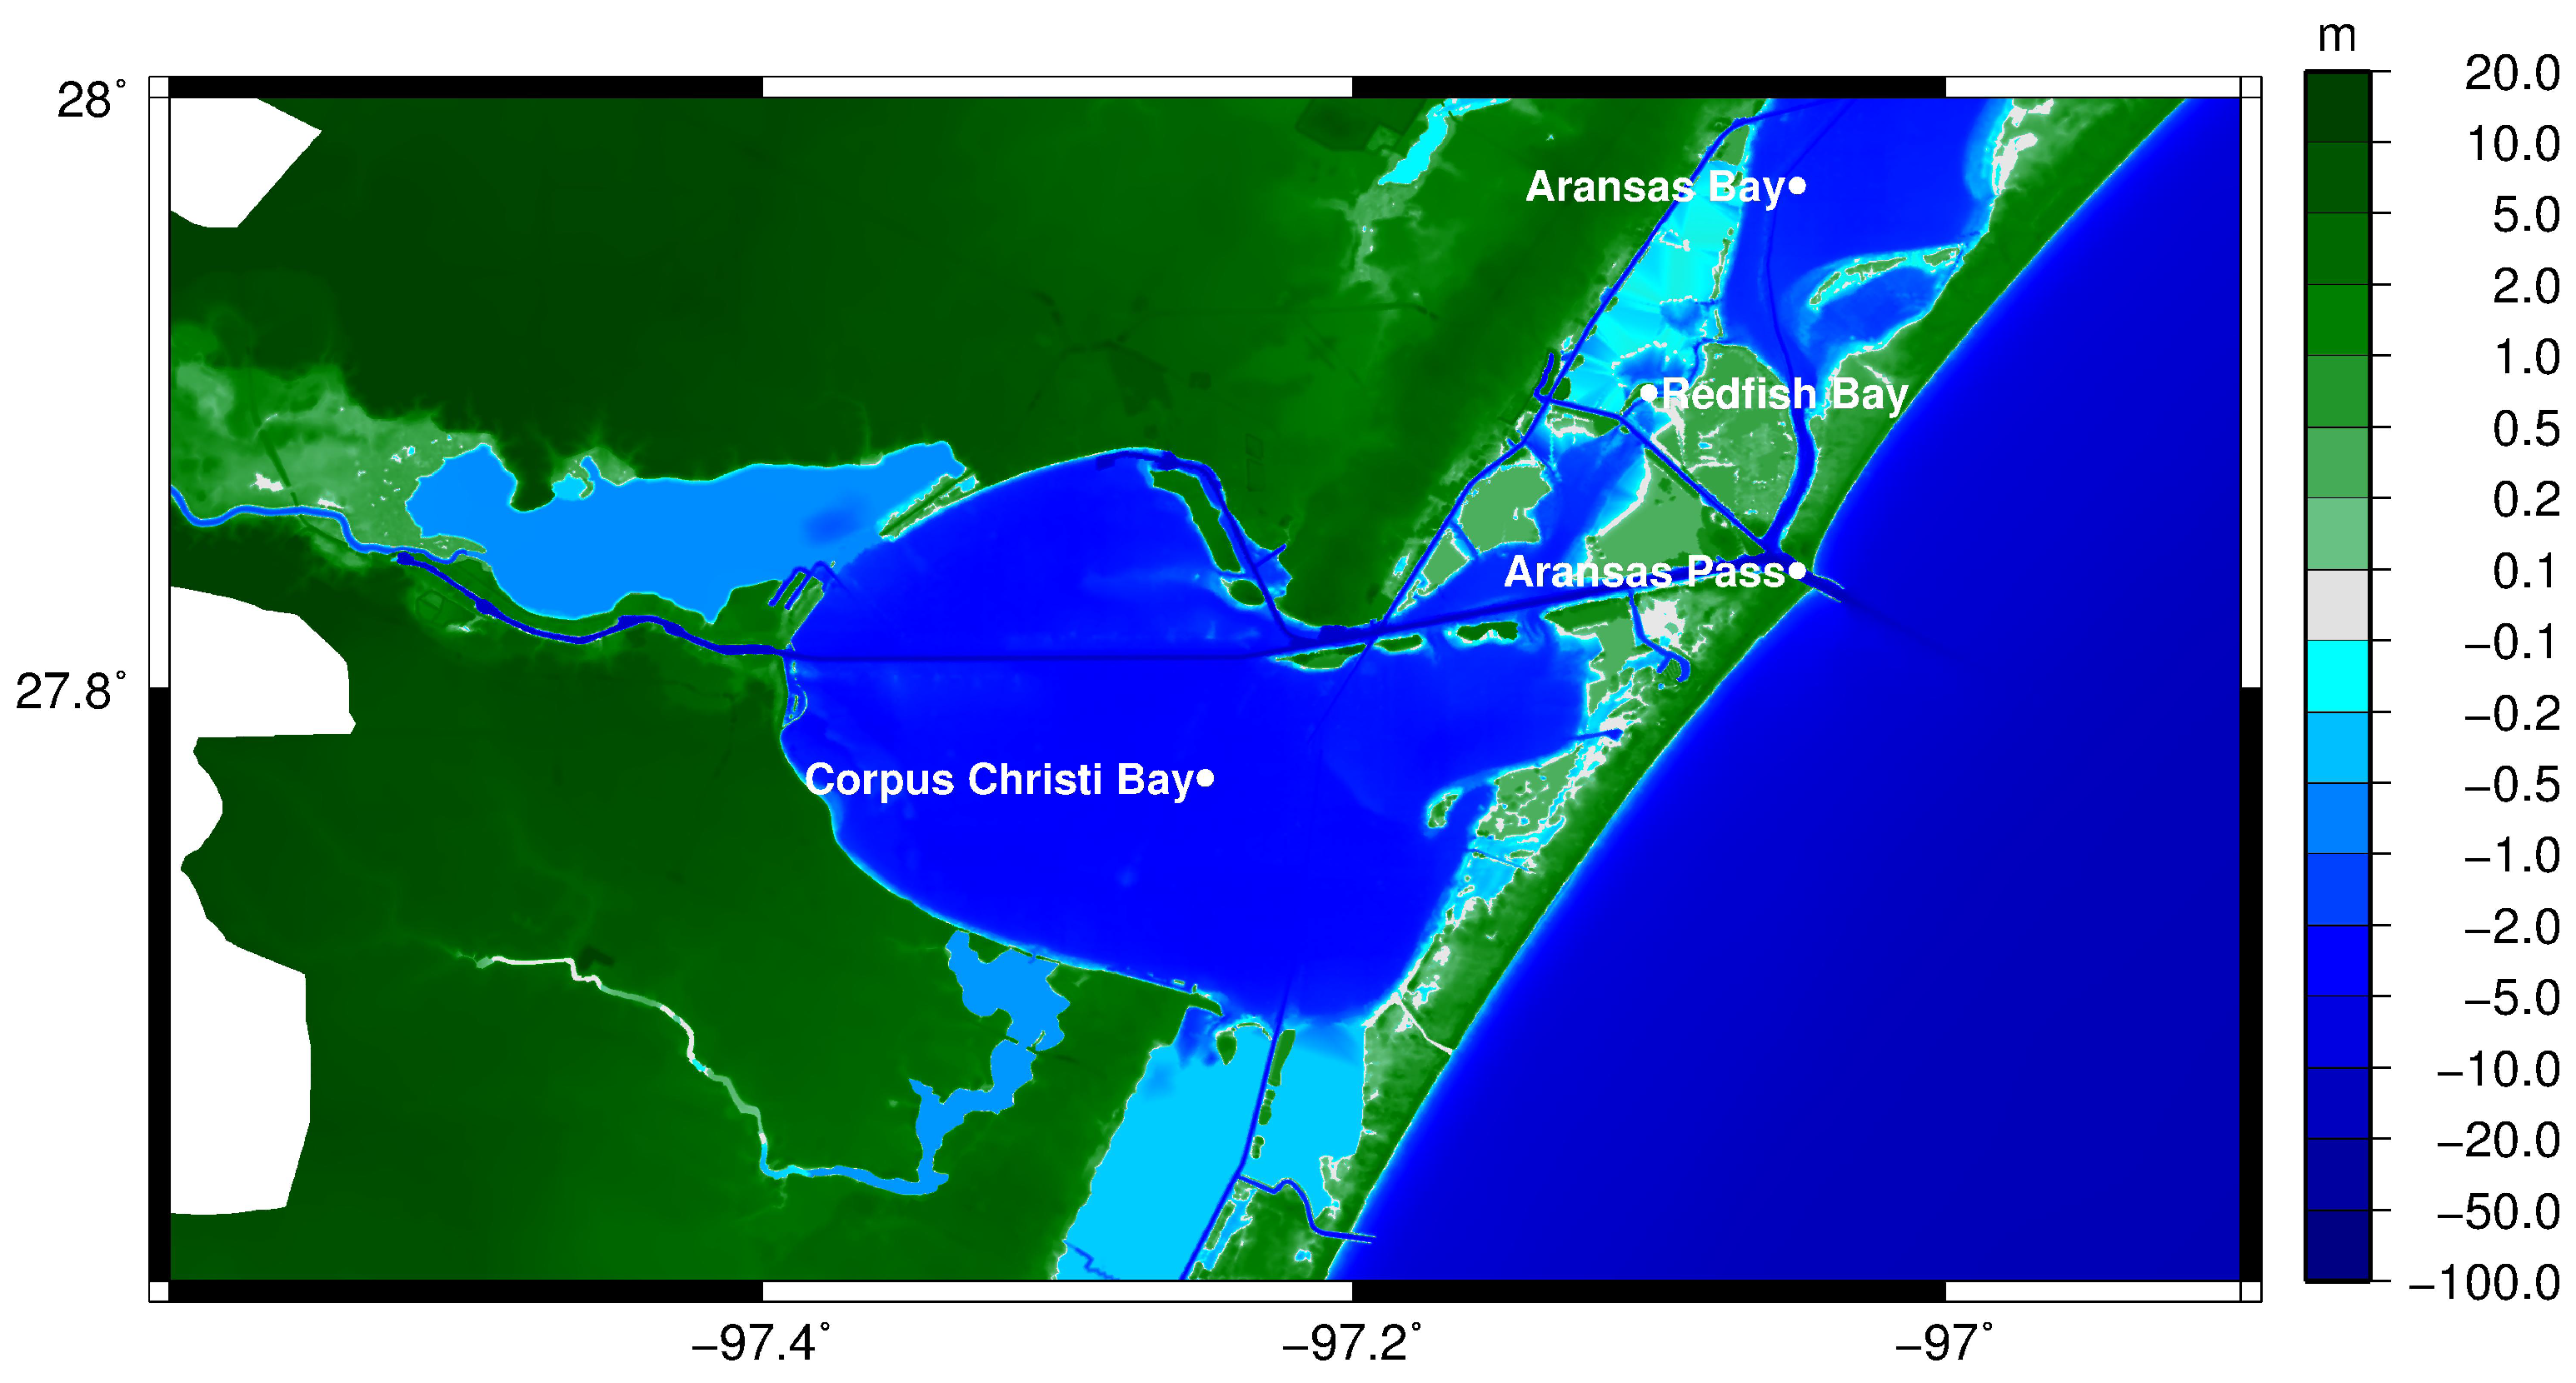
Figure 1. Focus area of present study.
Jmse 09 00935 g001
Figure 2. Extent of ADCIRC meshes, the color bar denotes bathymetric depth (cut off at 100 m for the sake of presentation).
Jmse 09 00935 g002
Figure 3. Current bathymetry.
Jmse 09 00935 g003
Figure 4. Proposed bathymetry.
Jmse 09 00935 g004
Figure 5. Mesh resolution in the Aransas Pass, the color bar denotes bathymetric depth of the exiting channel.
Jmse 09 00935 g005
Figure 6. Manning’s n in the study area.
Jmse 09 00935 g006
Figure 7. Water surface elevations in ADCIRC compared to nearby NOAA gauges during September 2020 for validation.
Jmse 09 00935 g007
Figure 8. Initial condition I-1964 particles outside the Aransas Pass inlet.
Jmse 09 00935 g008
Figure 9. Initial condition II-48 locations along the coast with 49 particles each.
Jmse 09 00935 g009
Figure 10. Initial condition III-2386 particles uniformly distributed outside Aransas Pass inlet.
Jmse 09 00935 g010
Figure 11. Initial condition IV-4772 particles uniformly distributed outside Aransas Pass inlet.
Jmse 09 00935 g011
Figure 12. Monitoring locations for particles.
Jmse 09 00935 g012
Figure 13. Difference in maximum velocity component with 2012 forcing.
Jmse 09 00935 g013
Figure 14. Difference in maximum velocity component for the extreme inflow scenario.
Jmse 09 00935 g014
Table 1. Successful larvae count for 2012 conditions.
Initial ConditionCurrent BathymetryProposed Bathymetry% Difference
I442410−7.24
II144106−26.39
III3513818.55
IV126513426.09
Total220222391.54
Table 2. Successful larvae count for 2019 conditions.
Initial ConditionCurrent BathymetryProposed Bathymetry% Difference
I2852942.81
II3827−28.95
III2092163.35
IV9599660.73
Total149115030.80
Table 3. Larvae counting location data for 2012 conditions.
Monitoring LocationCurrent BathymetryProposed BathymetryDifference
Initial condition I
AB375333−42
CB3540+5
RB12026+6
RB21211−1
Initial condition II
AB10370−33
CB2822−6
RB1106−4
RB238+5
Initial condition III
AB278301+23
CB3948+9
RB11924+5
RB2158+7
Initial condition IV
AB918997+79
CB194188−6
RB19887+9
RB25570+15
Table 4. Larvae counting location data for 2019 conditions.
Monitoring LocationCurrent BathymetryProposed BathymetryDifference
Initial condition I
AB4962+13
CB135149+14
RB13334+1
RB26848−20
Initial condition II
AB158−7
CB1812−6
RB124+2
RB233-
Initial condition III
AB5050-
CB8291+9
RB13929−10
RB23846+8
Initial condition IV
AB270257−13
CB378407+29
RB1157122−25
RB2154180+26
Table 5. Extreme river inflow condition successful larvae count.
Initial ConditionCurrent BathymetryProposed Bathymetry% Difference
I166161−3.0
II2320−13.0
III12514415.2
IV4995102.2
Publisher’s Note: MDPI stays neutral with regard to jurisdictional claims in published maps and institutional affiliations.