Article

Sound Propagation with Undulating Bottom in Shallow Water

1
State Key Laboratory of Acoustics, Institute of Acoustics, Chinese Academy of Sciences, Beijing 100190, China
2
College of Physical Sciences, University of Chinese Academy of Sciences, Beijing 100049, China
*
Author to whom correspondence should be addressed.
J. Mar. Sci. Eng. 2021, 9(9), 1010; https://doi.org/10.3390/jmse9091010
Submission received: 26 July 2021 / Revised: 19 August 2021 / Accepted: 13 September 2021 / Published: 15 September 2021

Abstract

:
An undulating bottom in shallow water has a significant effect on sound propagation. An acoustic propagation experiment was carried out in the East China Sea in 2020. Measurements along two separate propagation tracks with flat and undulating bottoms were obtained. Abnormal transmission losses (TLs) were observed along the track with the undulating bottom. By using the parabolic equation model RAM and ray theory, these abnormal TLs and the distribution of the sound field energy were analyzed. Numerical simulations indicate that under the shallow water condition with a negative thermocline and for a high frequency (1000 Hz), the incidence and reflection angles of sound rays on the sea bottom are changed due to the undulating sea bottom. The larger the inclination angle of the undulating bottom, the greater the grazing angle changes. These angles changes lead to different sound propagation paths for the undulating bottom and the flat bottom, resulting in the difference of TLs at a certain distance and depth. The undulating bottom will cause energy convergence in the mixed layer when the source and receiver locate above the thermocline.

1. Introduction

A sound wave is usually refracted downward in shallow water, and the sea bottom is an unavoidable boundary condition in sound propagation [1]. In the actual marine environment, the sea bottom is generally rough and uneven. Sound propagation from an uneven sea bottom has long been recognized in underwater acoustics, and there are many essential works [2,3,4,5,6,7,8,9,10,11].
As early as 1968, Northrop et al. [2] found in an acoustic propagation experiment that the transmission loss (TL) at the SOFAR (sound fixing and ranging channel) depth would be reduced compared to the TL with the flat seafloor due to the sloping bottom. The variations of peak amplitude were 15 dB. In 1978, Carlson [3] pointed out irregular topography was associated with submarine slides and slumps. Rousseau et al. [4] investigated in 1985 the effects of a sloping bottom on acoustic transmissions by using ray theory. He pointed out that the sloping bottom would change the travel time and induces significant changes in TL of each ray through bottom loss effects. The TL was shown to be greater in upslope propagation than in downslope propagation. In 2002, Li [5] studied the environmental mismatch problem caused by rough sea bottom in matched-field source localization and concluded that rough sea bottom would decrease the correlation value of the main lobe and increase the side lobes. Reference [6] showed that the subaqueous dunes on the upper continental slope of the northern South China Sea were expected to cause errors in the measurement of normal incidence reflection. The main reason that contributed to unusual variations in the reflection coefficient was the curvature of the dunes. In 2016, by analyzing an acoustic propagation experiment phenomenon, Hu et al. [7] found that the TL above the slope decreases by about 5 dB due to the reflection of the bottom and a high-intensity region appearing below the sea surface. In 2019, Han et al. [8] simulated the seismic wavefield records in the undulating seafloor with two different topography changes. The results showed that the change of seafloor topography has substantial effects on both the migration profile and wavefield records. Liu et al. [9] observed a notable difference in TL, about 35 dB, as sound crossed different geodesic paths in an acoustic propagation experiment. The simulation suggested some small-scale features of horizontal refraction effect caused by irregular topography, and the topography mainly controls the TL variation pattern along the different azimuth. In 2021, Liu et al. [10] reported that the undulating sea bottom could influence sound pulse propagation, mainly reflected in the energy conversion within sound rays with different angles. The energy attenuation of some large-angle sound rays increases, and the multipath structure decreases. In addition, the incidence and reflection angles of the sound rays on the sea bottom are also changed due to the undulating sea bottom. The work presented in [11] showed that the influence of the seafloor dip angle on the horizontal correlation should be considered, and that the horizontal correlation is affected significantly by the propagation effects of the sloping seafloor.
Generally, most of the research has focused on the impact of the deep-water, large-scale undulations on sound propagation, such as seamounts and sloping bottom. There are few studies on the influence of small-scale undulations in shallow water on sound propagation, such as small subaqueous dunes or continuous undulating bottom. However, the changes in bottom topography of shallow water are typically one or two orders of magnitude smaller in size. Sound propagation in shallow water is not the same as that in deep water. Underwater acoustic applications depend critically on the prediction of sound propagation. In shallow water, since repeated surface–bottom interactions occur, these effects will be more significant. Thus, it is vital to study the principle of sound propagation related to an undulating bottom in shallow water. In this paper, based on the sound field data of an acoustic propagation experiment conducted in the East China Sea in 2020, we analyze the variation of TLs and the distribution of the sound field energy under the undulating sea bottom condition with a negative thermocline. The mechanism of abnormal sound propagation caused by the undulating sea bottom topography is explained using ray theory.

2. Methods and Experiment Introduction

2.1. RAM-PE Model

The parabolic equation (PE) method [12] is the most popular technique to solve range-dependent ocean acoustics propagation problems. This paper uses the RAM-PE (range-dependent acoustic model) model [13] to perform simulations and analyze experimental data. RAM is a wide-angle PE algorithm based on the split-step Padé solution [14,15], which was proposed by M.D. Collins.
In cylindrical coordinates, we assume that the sound field is symmetrical about the azimuth. We remove the spreading factor r 1 / 2 from the complex pressure p . Then, p satisfies the far-field equation (Equation (1)) in each range-independent region [16]:
2 p r 2 + ρ z ( 1 ρ p z ) + k 2 p = 0 ,
where ρ is the density, k = ( 1 + i η β ) ω / c is the wave number, ω is the angular frequency, c is the sound speed, and β is the attenuation in d B / λ , η = ( 40 π log 10 e ) 1 . Factoring the operator in Equation (1), we obtain
( r + i k 0 ( 1 + X ) 1 2 ) ( r i k 0 ( 1 + X ) 1 2 ) p = 0
and
X = k 0 2 ( ρ z 1 ρ z + k 2 k 0 2 ) ,
where k 0 = ω / c 0   and c 0 is a reference speed. Assuming that outgoing energy dominates back-scattered energy, Equation (2) reduces to the outgoing wave equation:
p r = i k 0 ( 1 + X ) 1 / 2 p .
Split-step solutions of Equation (4) are based on the formal solution:
p ( r + Δ r , z ) = e x p ( i k 0 Δ r ( 1 + X ) 1 / 2 ) p ( r , z ) ,
where Δ r is the range step. Appling an n-term rational function to approximate the exponential function, we obtain
p ( r + Δ r , z ) = e x p ( i k 0 Δ r ) ( 1 + j = 1 n α j , n X 1 + β j , n X ) p ( r , z ) ,
where the complex coefficients α j , n and β j , n are selected to provide accuracy and stability.
We can obtain sound intensity I ( r , z ) = p 2 ( r , z ) / Z ω after obtaining sound pressure p ( r , z ) , where Z ω is the acoustic impedance. By using the sound intensity of N frequency points for narrow-band averaging, we obtain
I ¯ ( r , z ) = 1 N n = 1 N I ( f n ; r , z ) .
Finally, we obtain TL,
T L ( r , z ) = 10 l o g I ¯ ( r , z ) I ( r = 1 ) .
where I ( r = 1 ) is the value of the source intensity. The detailed steps of obtaining this value are described in Section 2.2.

2.2. Experiment Descriptions

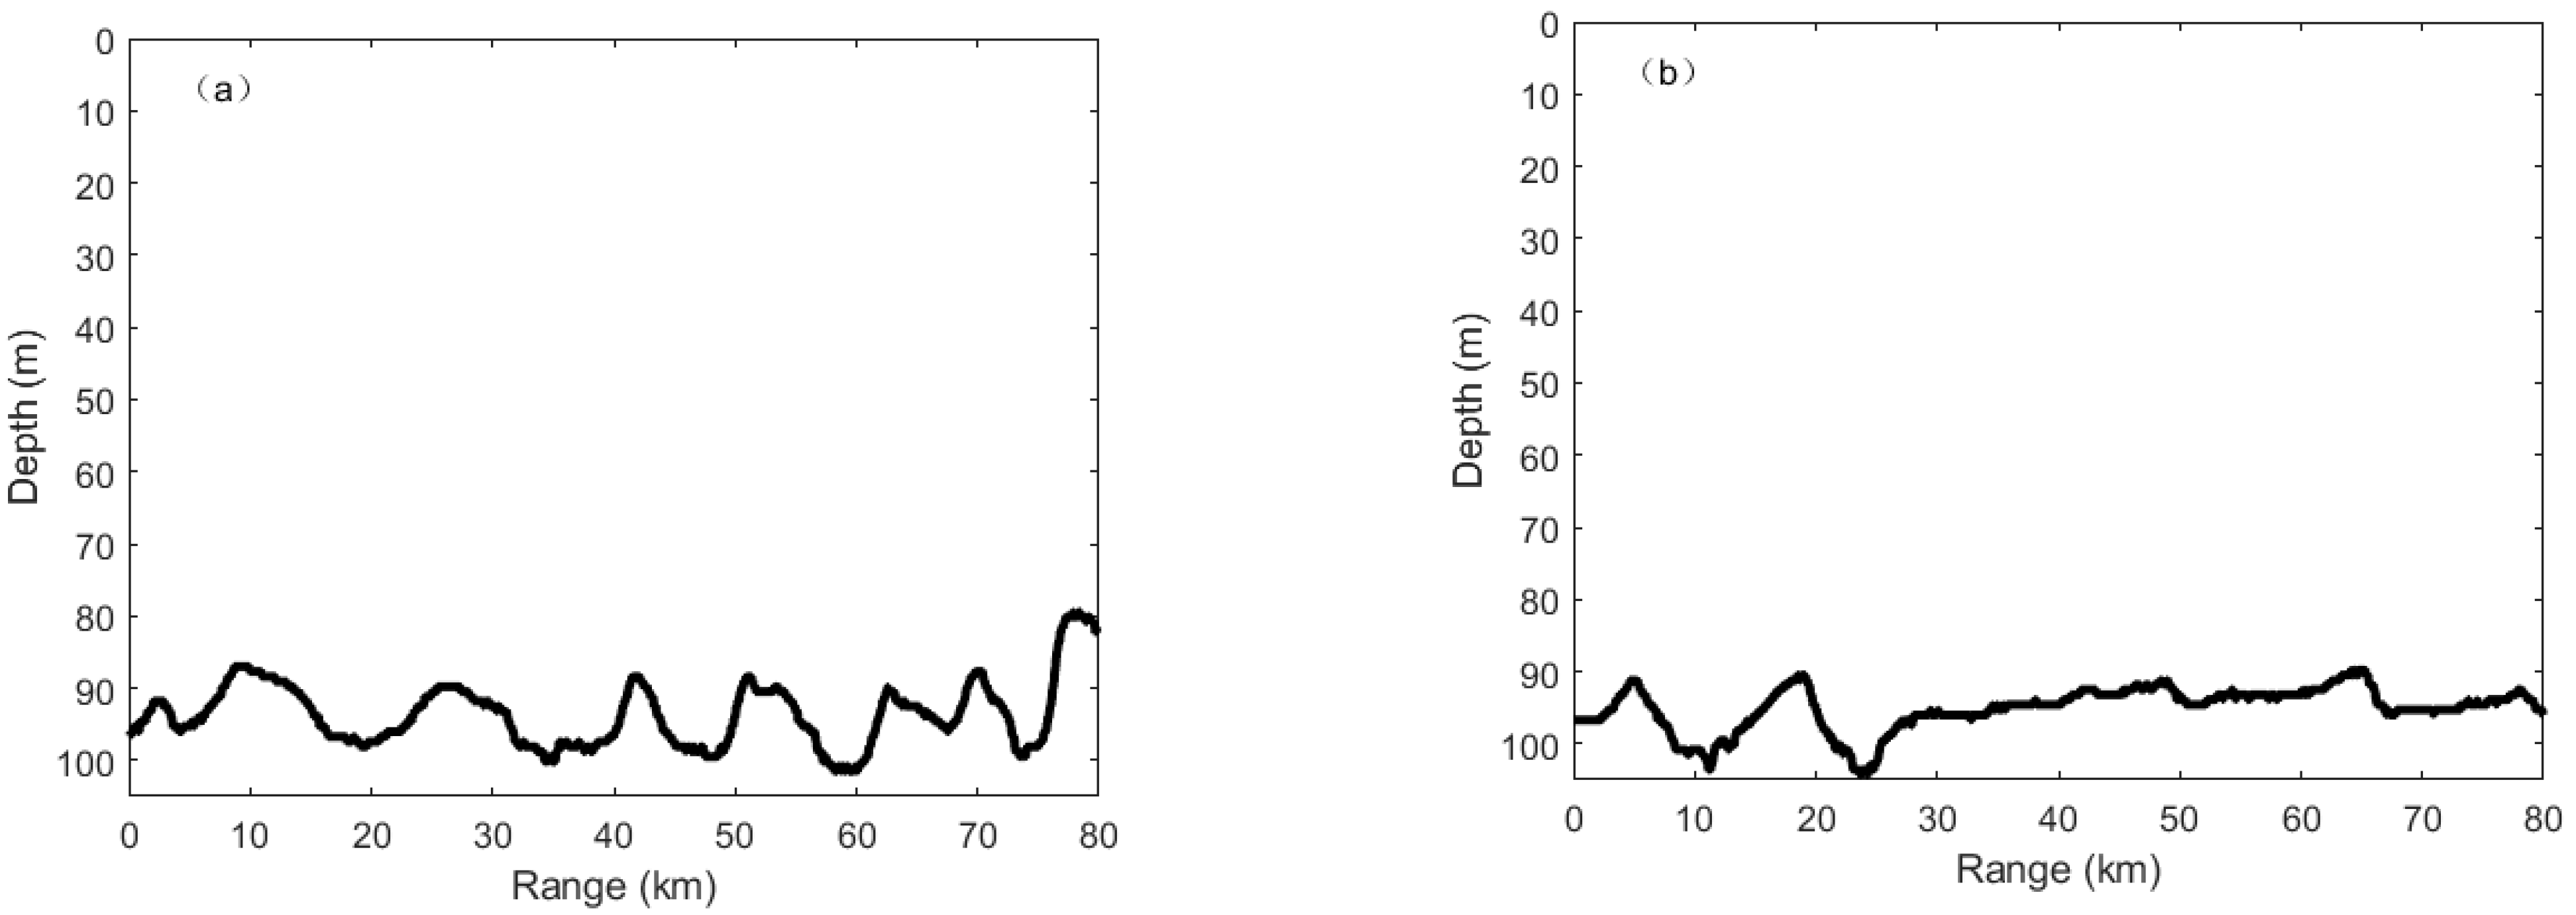
In September 2020, an acoustic propagation experiment was carried out in the East China Sea. The configuration of the experiment is shown in Figure 1. The wideband signals (WBS) were generated by 100 g TNT explosive charges dropped from the ship “SHIYAN1” along two tracks at range intervals of about 1.1 km. The explosion depth was designed to be 7 m. The signals were received by a vertical linear array (VLA) composed of 16 hydrophones spreading from 11 to 90 m with unequal distance in depth. The sensitivity of the hydrophones was −170 dB, and the sampling rate was 16 kHz. The bathymetry along two propagation tracks with undulating bottom T1O and T3O is given in Figure 2. The azimuth angles of T1O and T3O were 222° and 48°. Point O is the origin of coordinates and also the position where the VLA is located. It can be seen that the range of 0–40 km of T1O and T3O are both undulating bottom, and the inclination angle is small. After 40 km, the fluctuation of T3O tends to be flat, while the fluctuation of T1O is more significant than that of the former 40 km, and the inclination angle is larger. The sound speed profile (SSP) during the experiment is shown in Figure 3. These gray curves were measured by expendable bathythermograph (XBT), which was dropped from the ship “SHIYAN1” along the track. The red curve was measured by sound velocimeter at Point O. Considering the close similarity between these data collected at different ranges and the higher accuracy of sound velocimeter, we assume that the SSP in the experimental area was range-independent. Therefore, the SSP measured by sound velocimeter was used in subsequent acoustic modeling. As shown in Figure 3, the depth of the isothermal surface layer was 45 m.
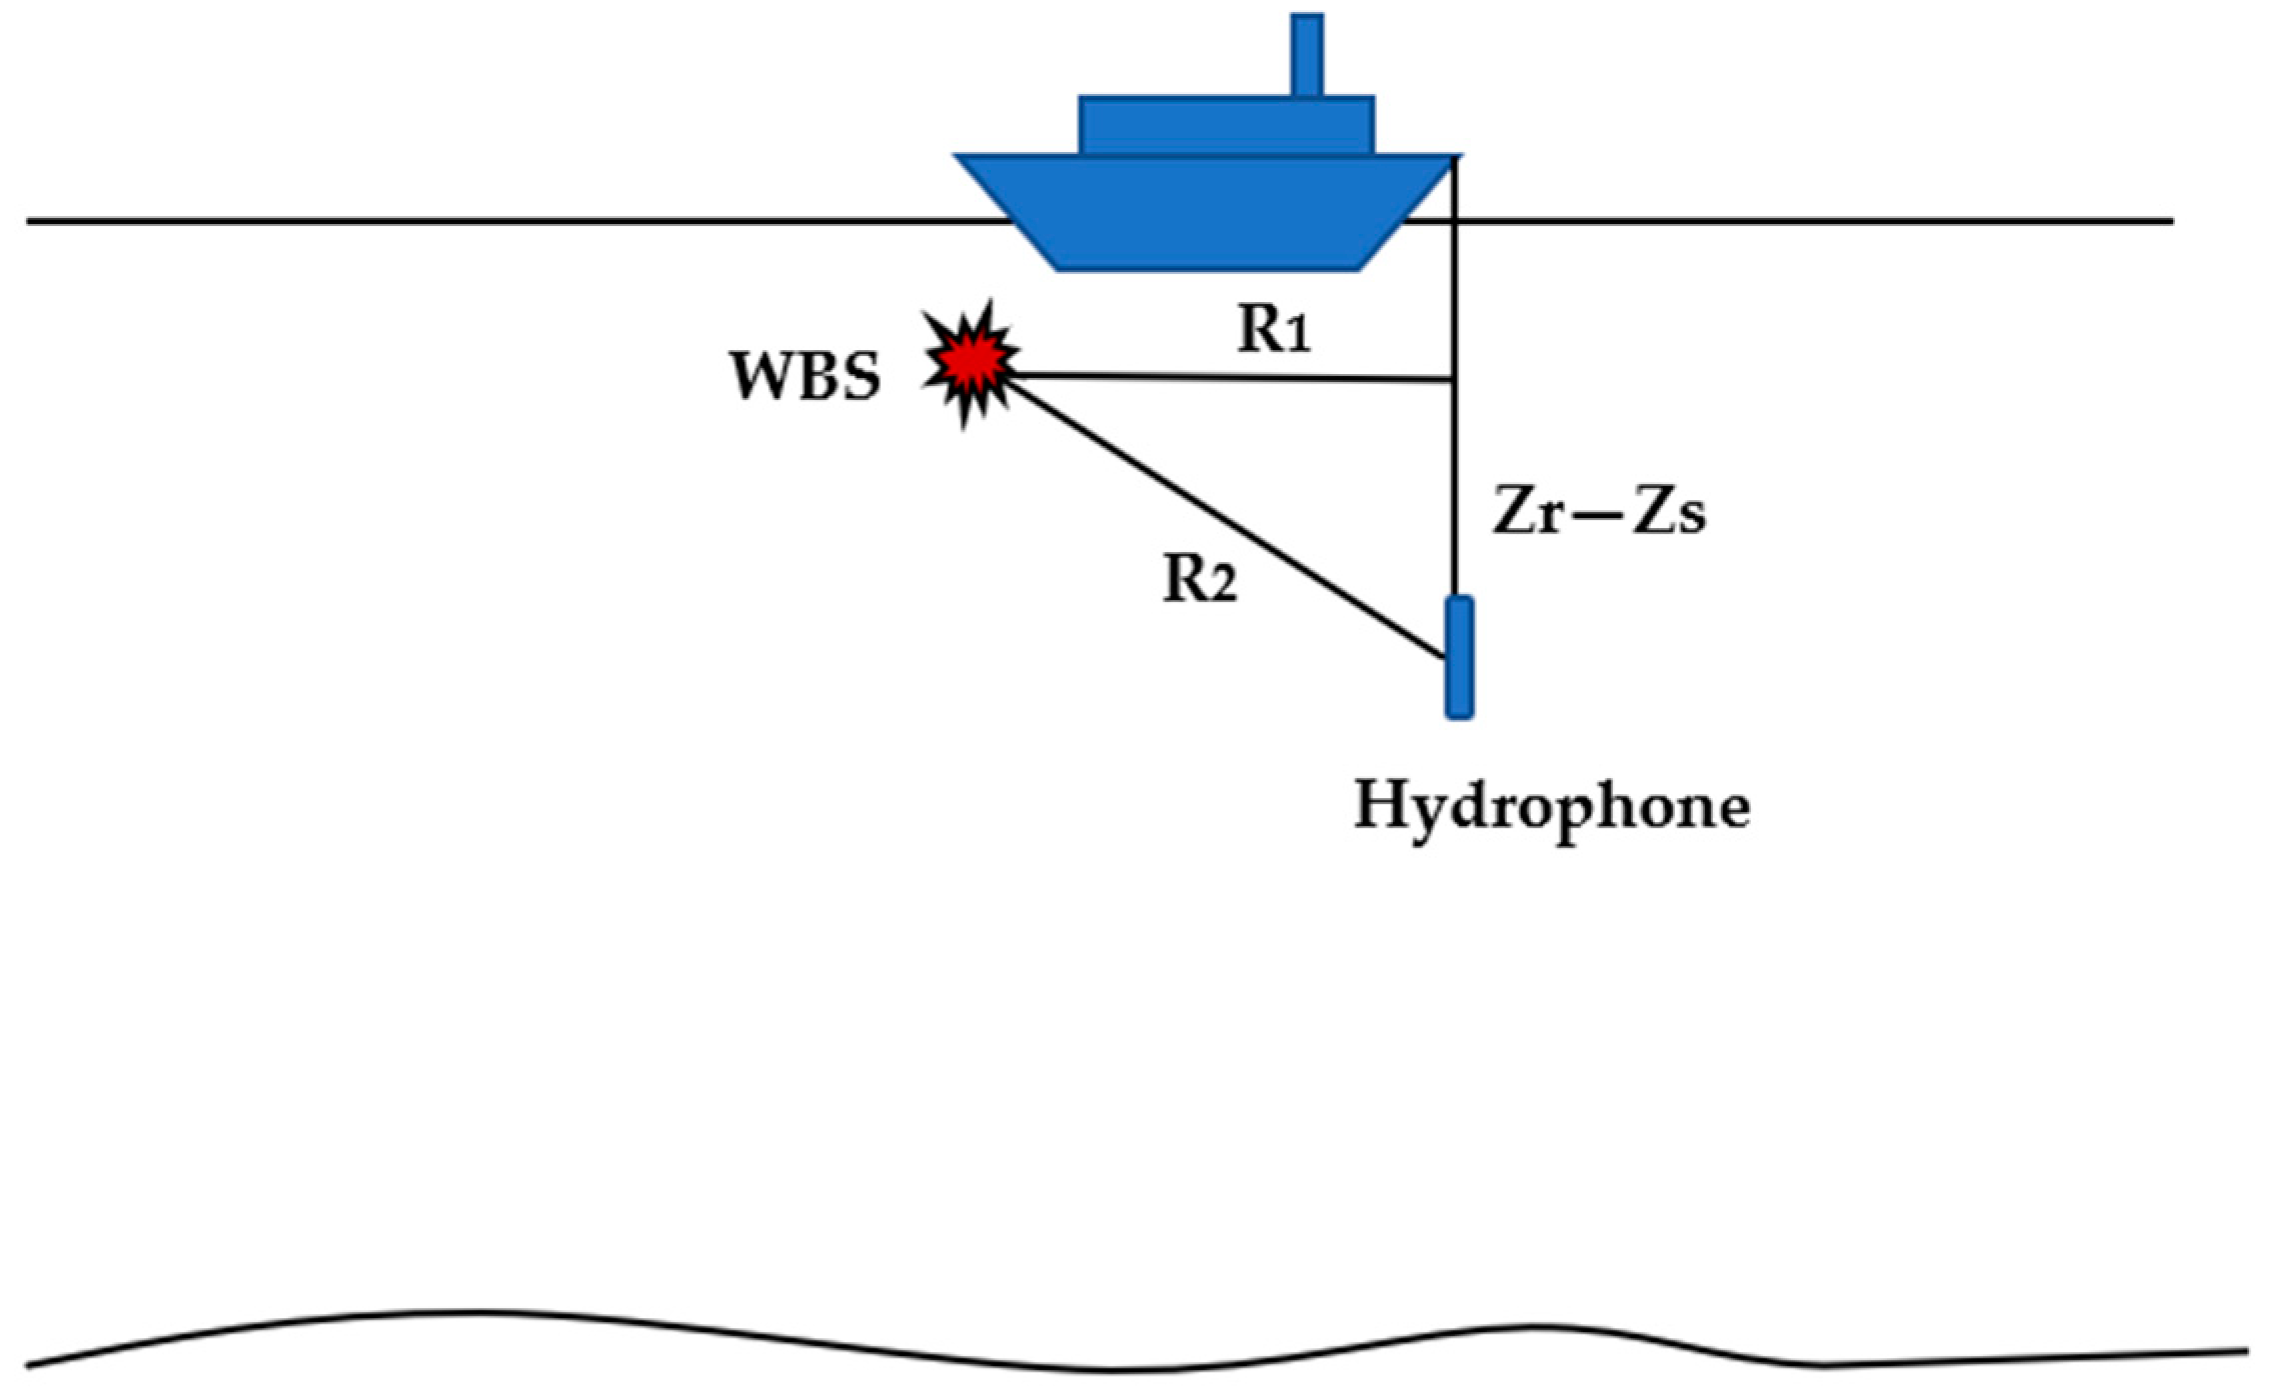
The source level we need to estimate for calculating the TLs was measured in the previous experiment in the Pacific Ocean. The sources are the same as this experiment. The configuration of source level calibration is shown in Figure 4. Wideband signals were dropped at the bow with an explosion depth ( Z s ) of 7 m. One hydrophone with the sensitivity of −220 dB was placed at the depth ( Z r ) of 1000 m to avoid overload of the recorder. The horizontal distance (R1) between the source and the hydrophone was 75 m. According to the Pythagorean theorem, the propagation distance of signal R 2 = R 1 2 + ( Z r Z s ) 2 and the spreading loss is 20 l g R 2 . Denoting the direct arrival signal received by the hydrophone as x ( t ) , and the Fourier transform of x ( t ) as X i , then we obtain acoustic energy with the bandwidth of Δ f :
E ( Δ f ) = 2 N i = n f 1 n f 2 | X i | 2 / F s 2 ,
where N is the frequency points in Δ f , F s is the sampling rate, n f 1 and n f 2 represent the frequency point positions corresponding to the upper and lower frequency, respectively.
Then, we obtain the source level (SL):
S L ( Δ f ) = 10 l g ( E ( Δ f ) ) + 20 l g R 2 M ,
where M is the sensitivity of hydrophones. In this experiment, the bandwidth was one-third octave for the central frequencies below 1000 and 200 Hz for the central frequencies above (or equal to) 1000 Hz. The source level for the central frequency of 100–2000 Hz (interval 100 Hz) is shown in Figure 5. The red curve was the average value, which was also the value we used.

3. Experimental Results and Numerical Simulations

3.1. Experimental Results

The experimental TLs at all receivers for T1O and T3O at the central frequency of 1000 Hz with a bandwidth of 200 Hz and source depth of 7 m are shown in Figure 6. It is clear that the sound energy of the receiver located above the thermocline is greater than that below the thermocline. Comparing Figure 6a,b, it can be seen that after the range of 40 km, the energy is concentrated in the mixed layer above the thermocline, and the sound energy in the mixed layer of T1O is higher than that of T3O.
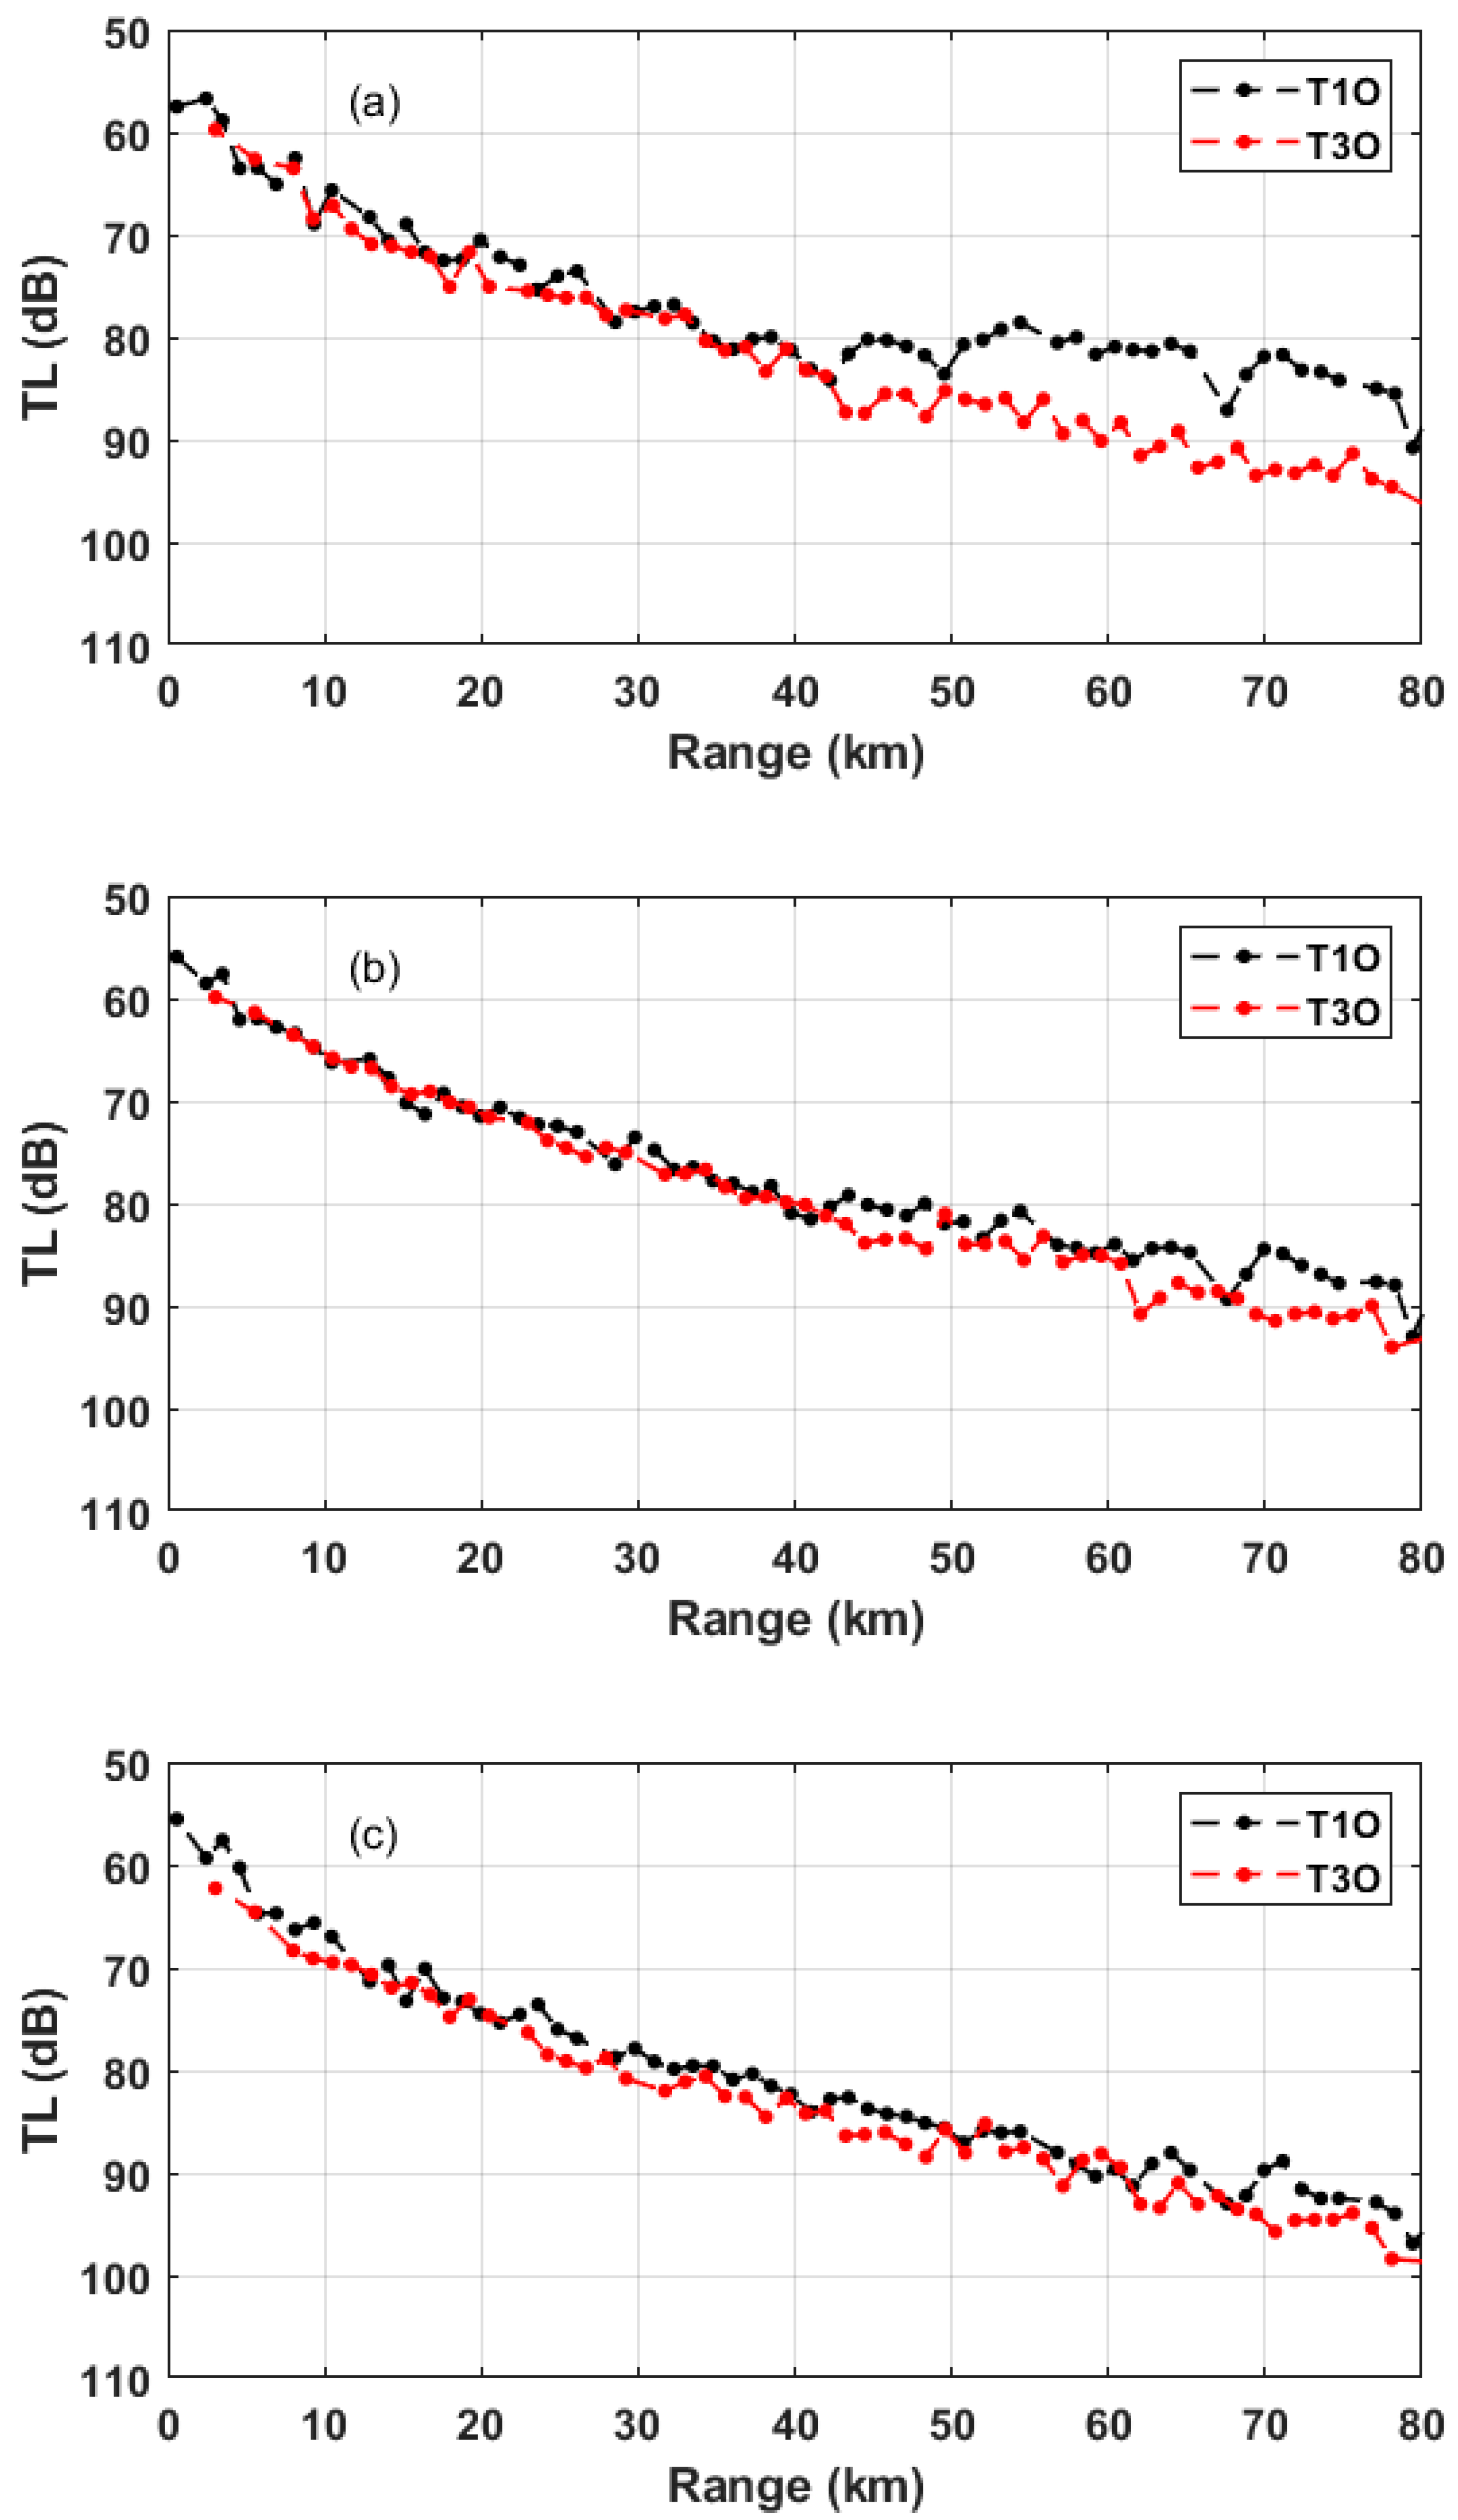
As shown in Figure 6a, energy converges in the mixed layer within the depth of 0–40 m above the thermocline. Thus, we select two hydrophones with the depths of 11 m and 37 m and a hydrophone with 71 m below the thermocline to compare the experimental TLs. The experimental TL comparison results of T1O and T3O at different receiver depths for a central frequency of 1000 Hz with a bandwidth of 200 Hz and the source depth of 7 m are shown in Figure 7. Figure 7a–c shows the TL comparison results for the receiver depth of 11, 37, and 71 m. From Figure 7, we can see that the TL differences of the two tracks are not apparent within 0–40 km. However, after 40 km, the TLs show visible differences. It can be found that the TL along T3O gradually increases with range while the TL along T1O presents strong fluctuations. Especially in Figure 7a, the TL difference is up to about 10 dB near 69.5 km. Comparing Figure 7a–c, it can be seen that the difference gradually decreased with the increase of the receiver depth. In addition, Figure 7c shows a significant decrease of TL at the range of about 63 and 71 km of T1O.
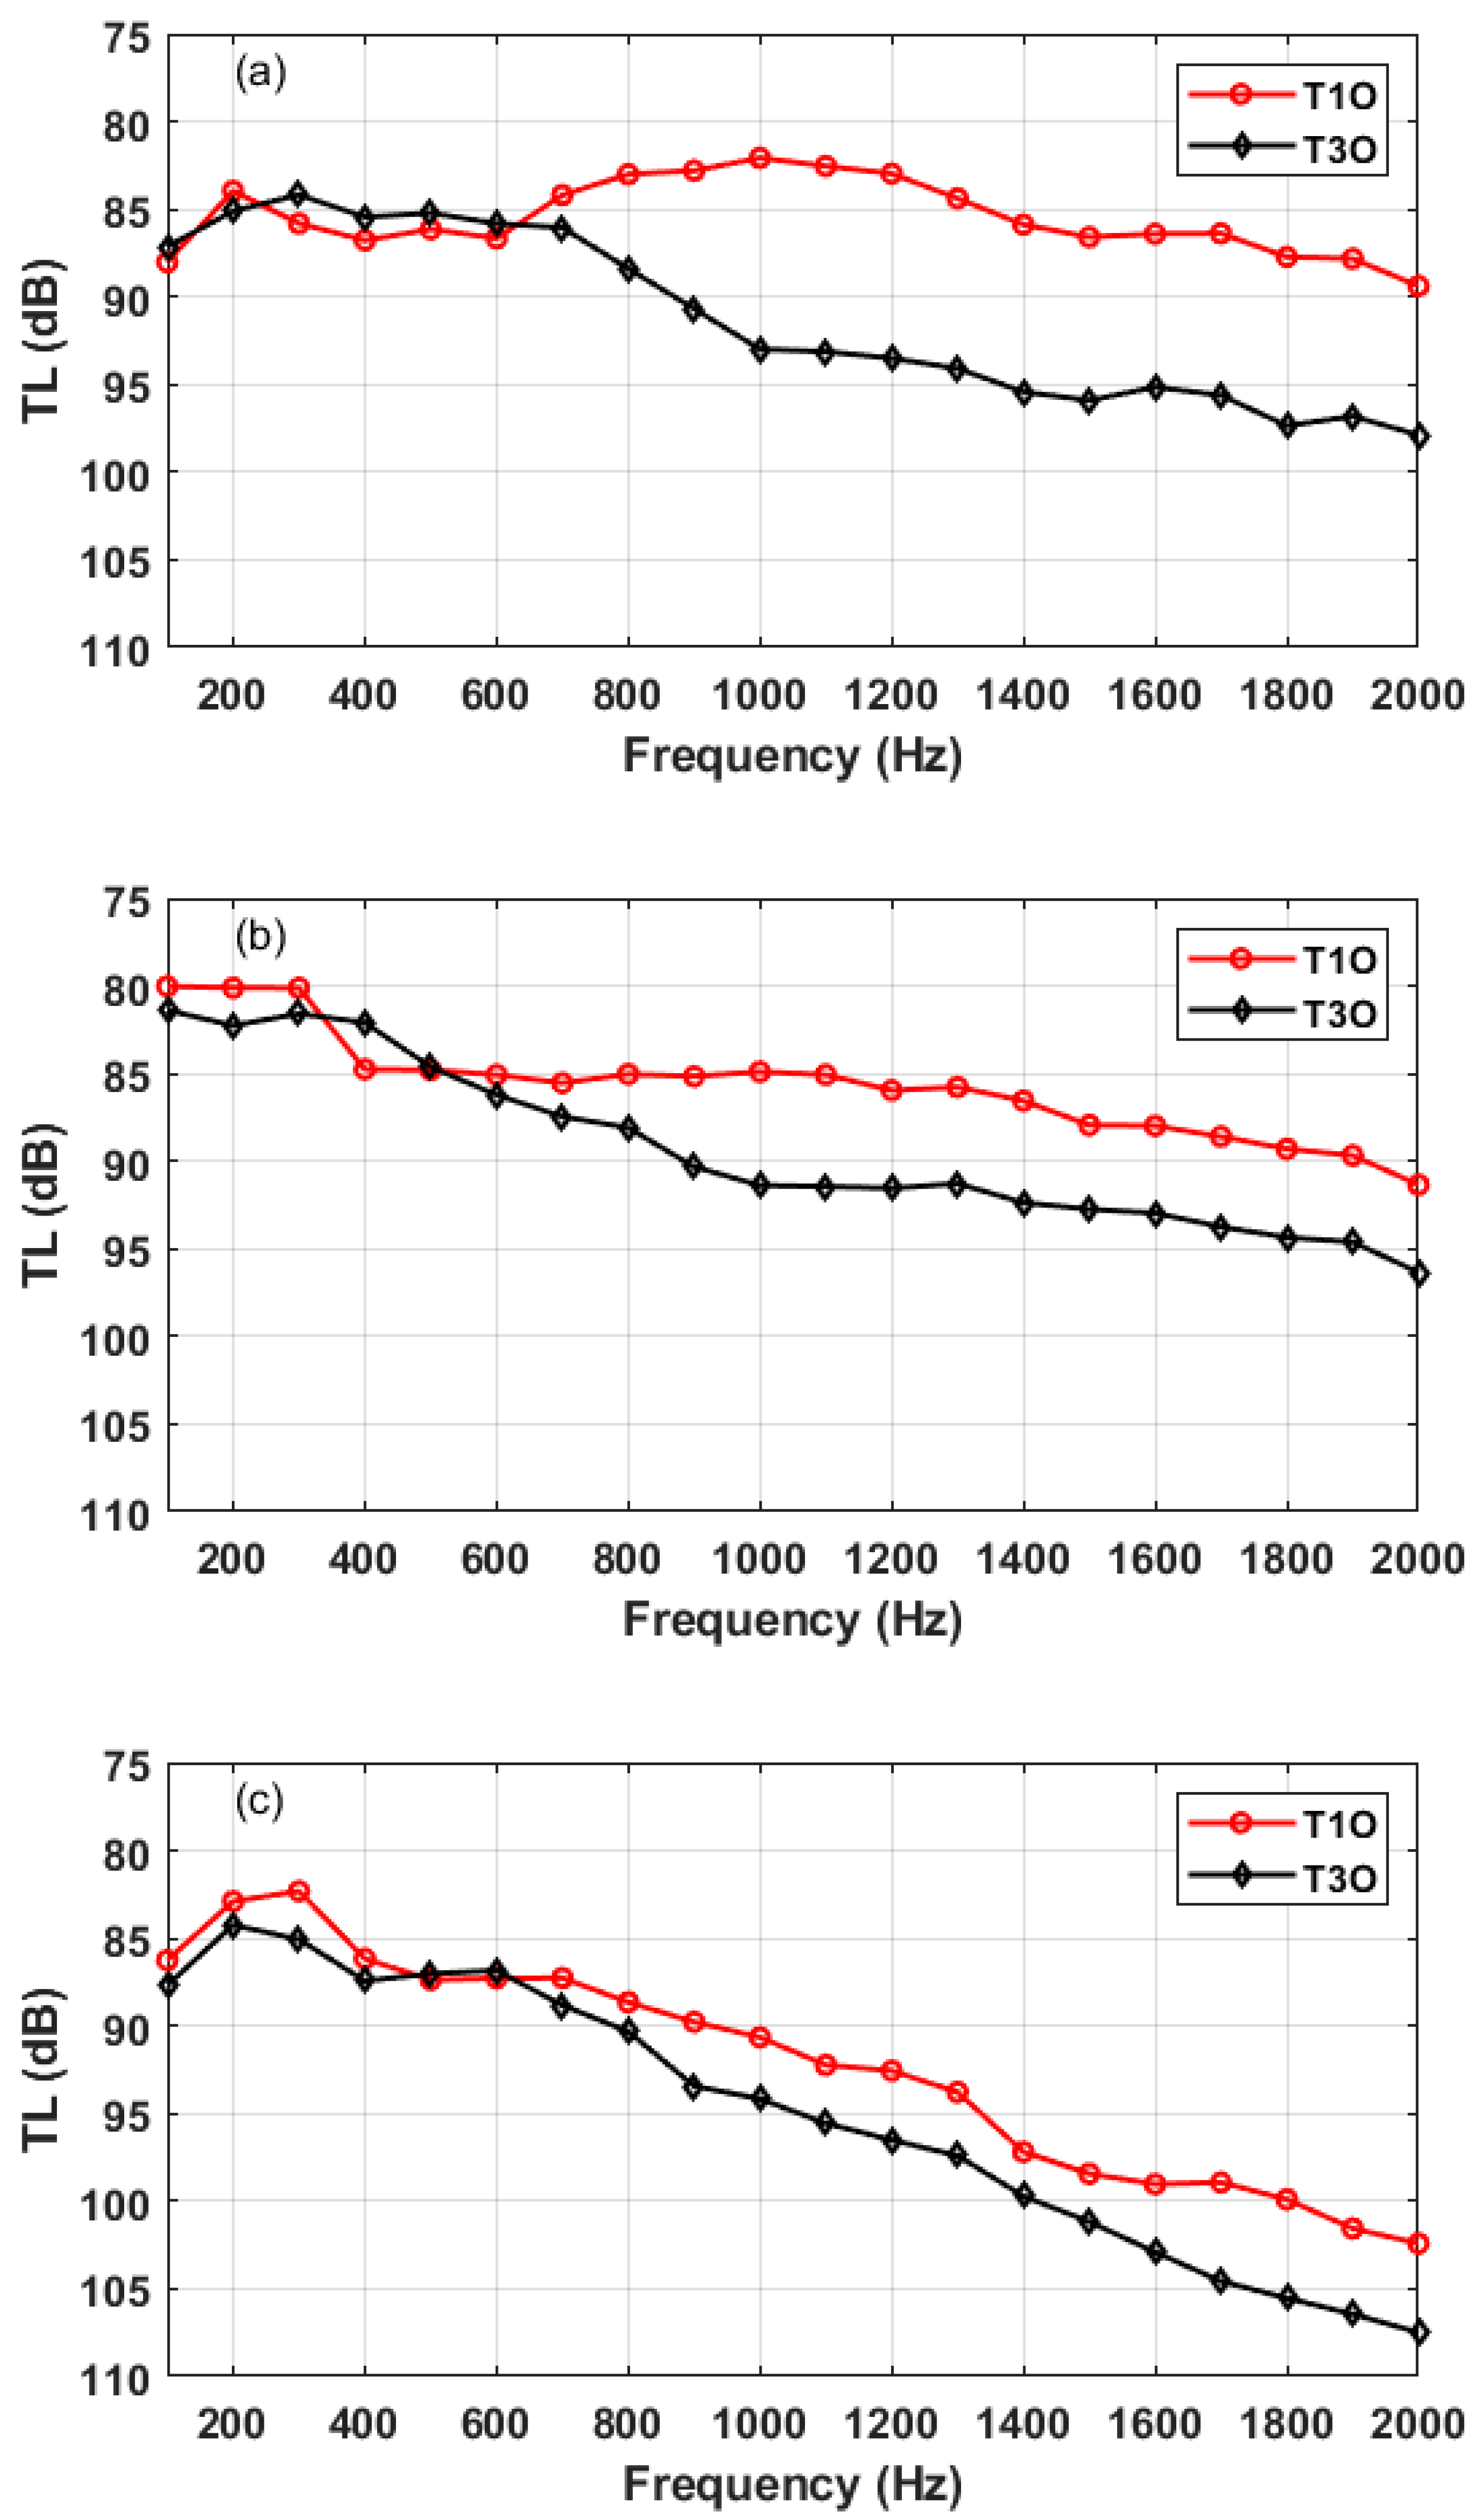
To avoid the contingency of the experimental result in Figure 6a with the TL difference near 69.5 km, we compared the experimental results of other frequencies. Figure 8 shows the TLs of the central frequency 100–2000 Hz with the same receiver depths at 69.5 km. As seen from Figure 8, when the frequency is less than 600 Hz, the undulating bottom has little influence on sound propagation. When the frequency is greater than 600 Hz, the TL difference becomes very significant.

3.2. Numerical Simulations

The types of sediment properties in the sea area where the experiment was conducted include MFS (middle fine sand), FS (fine sand), VFS (very fine sand), TS (silty sand), and YS (clayey sand) [17]. According to the continental terrace geoacoustic parameters given by Hamilton [18], the estimates of geoacoustic parameters for the five sediment types are shown in Table 1. By incorporating the topographic variations, a sediment model is created, as shown in Figure 9. It can be seen that the sediment type of T1O varies significantly with distance, and the bottom within the distance of 48–55 km is composed of middle fine sand with large sound velocity. Li et al. [19] pointed out that the variation of sediment along the propagation path significantly affected underwater sound propagation. Therefore, it is necessary to determine whether the fluctuations of TL after 40 km in Figure 7a are caused by the sediment variation along the propagation track.
Next, we perform some simulations by using RAM-PE to analyze the experimental data. In the simulations, the bathymetry and measured SSP in Figure 2 and Figure 3 are used. The bottom is considered as a fluid half-space with the parameters of the sediment in Table 1. The attenuation coefficient is taken as 0.33 dB/λ (for frequency 1000 Hz) by using the empirical equation given by Zhou et al. [20]. The numerical TLs are calculated at the central frequency of 1000 Hz and averaged at ten frequency points within the bandwidth of 200 Hz.
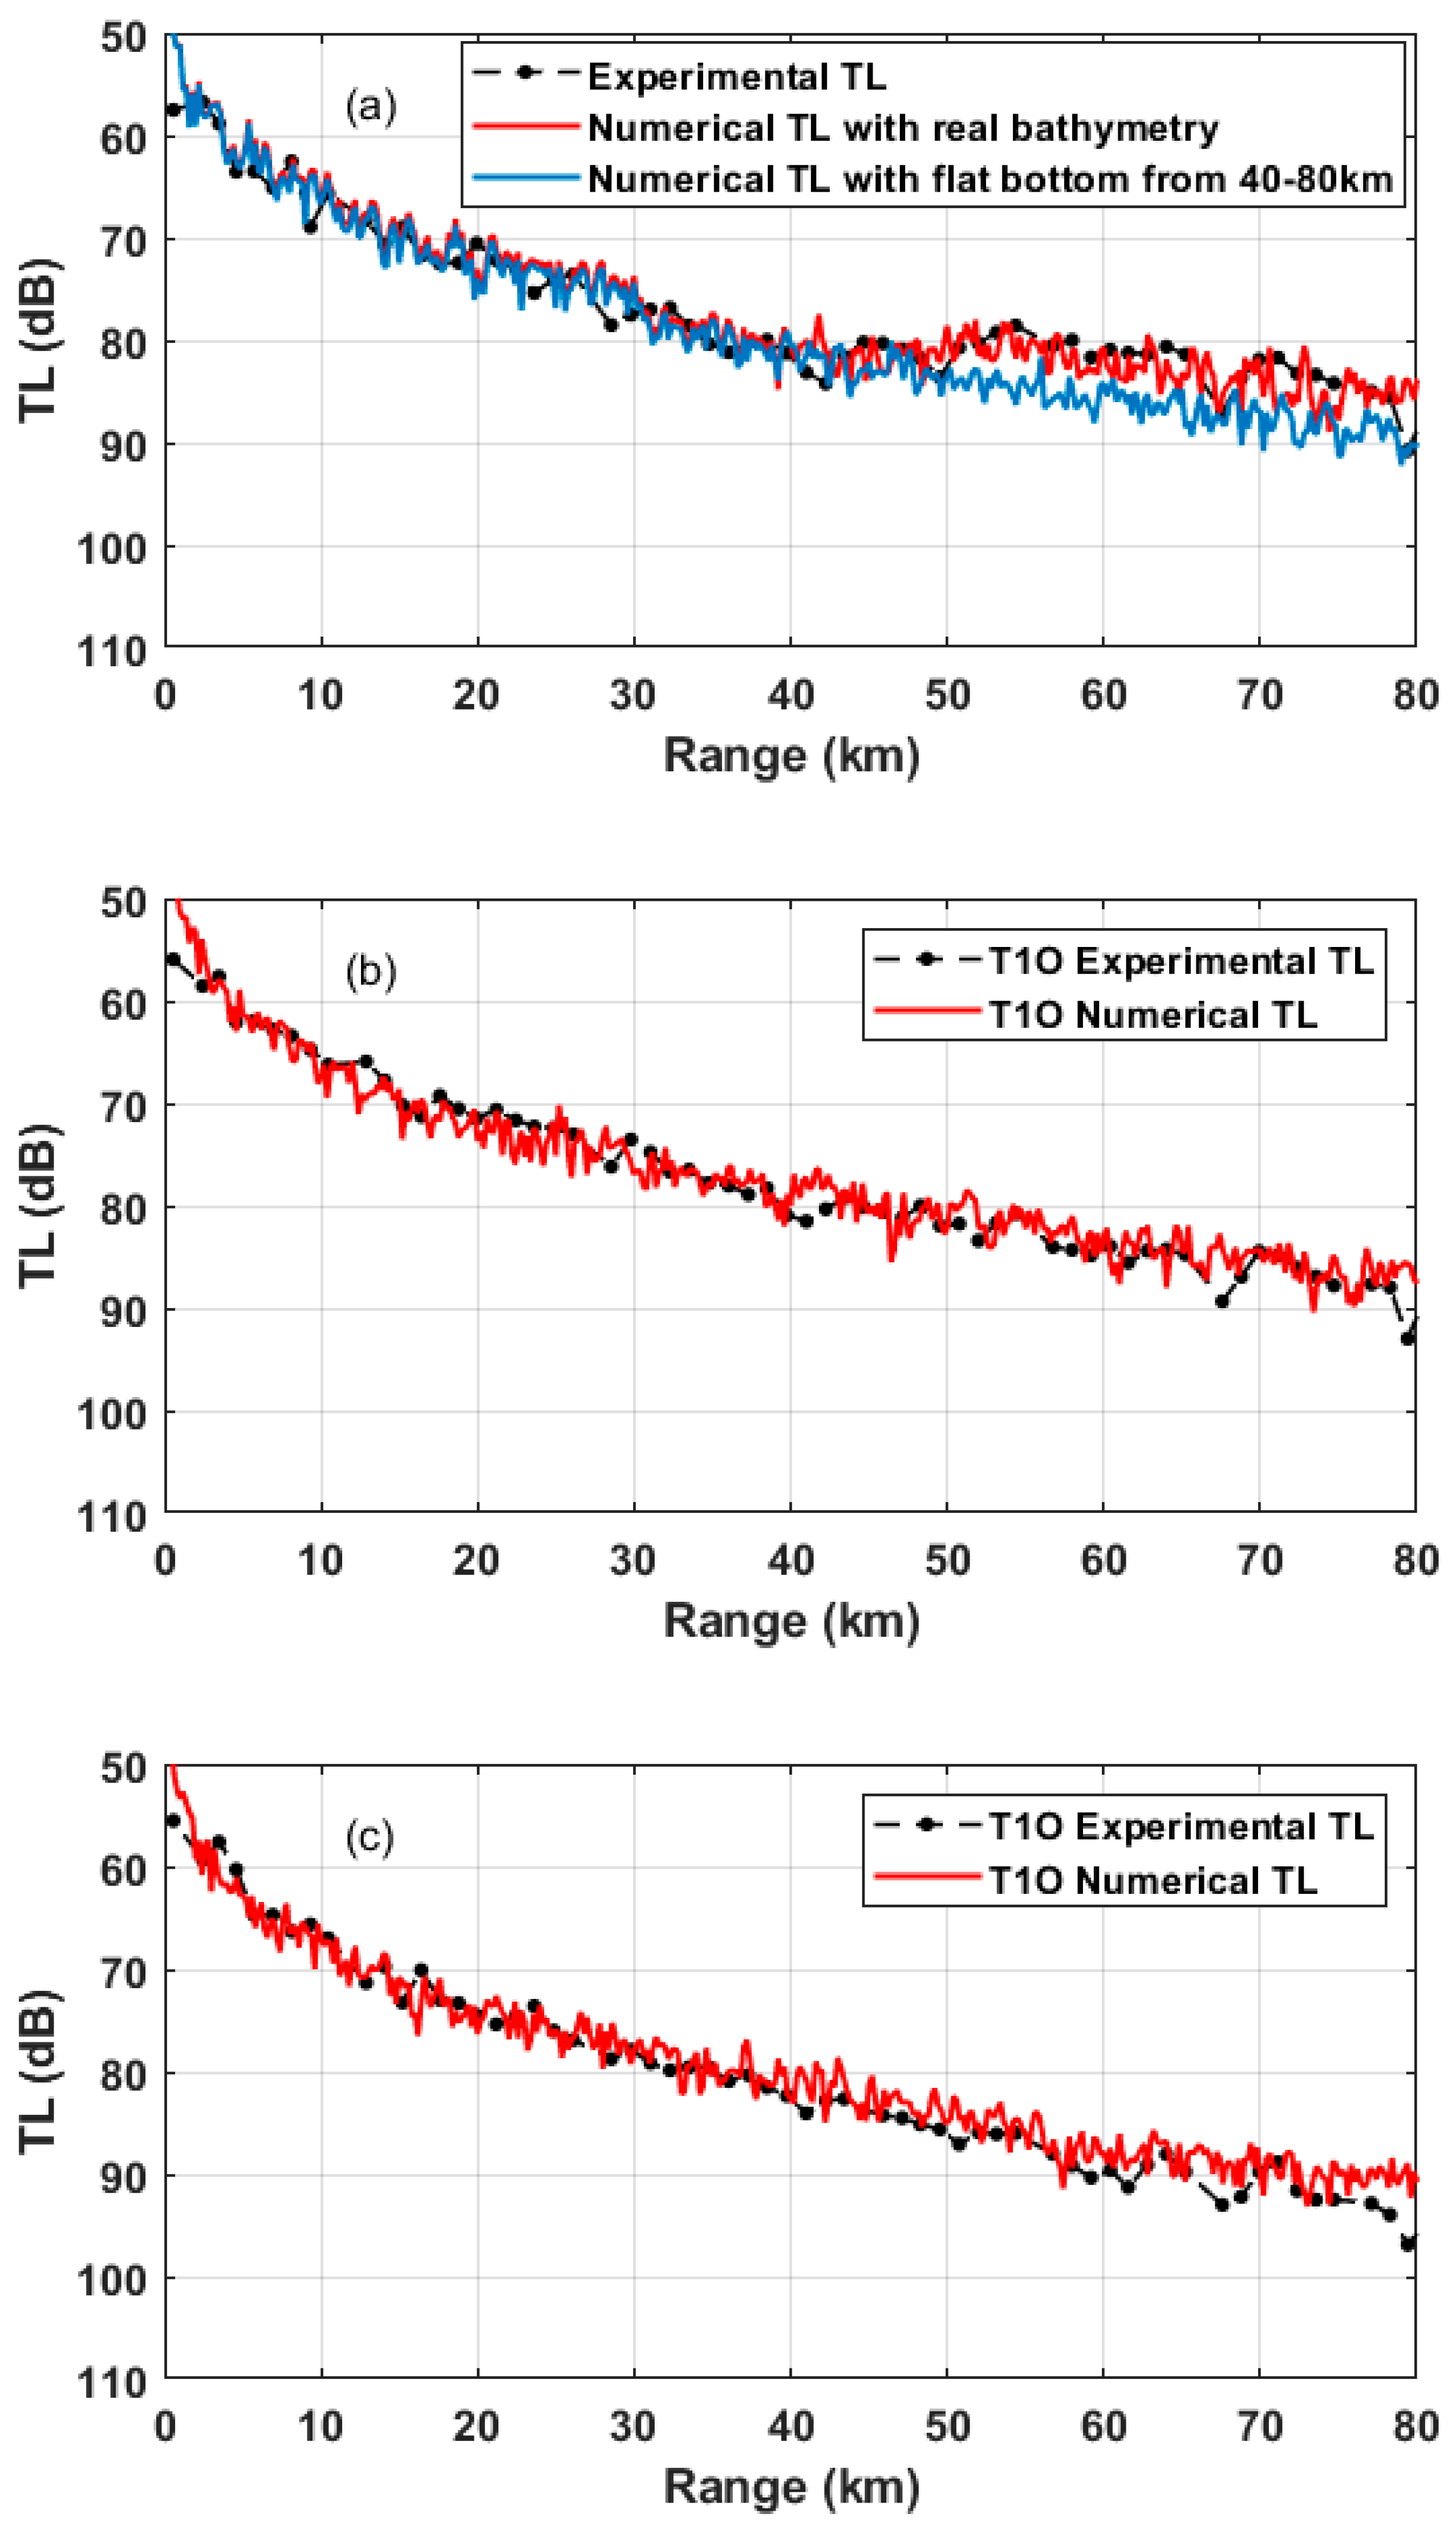
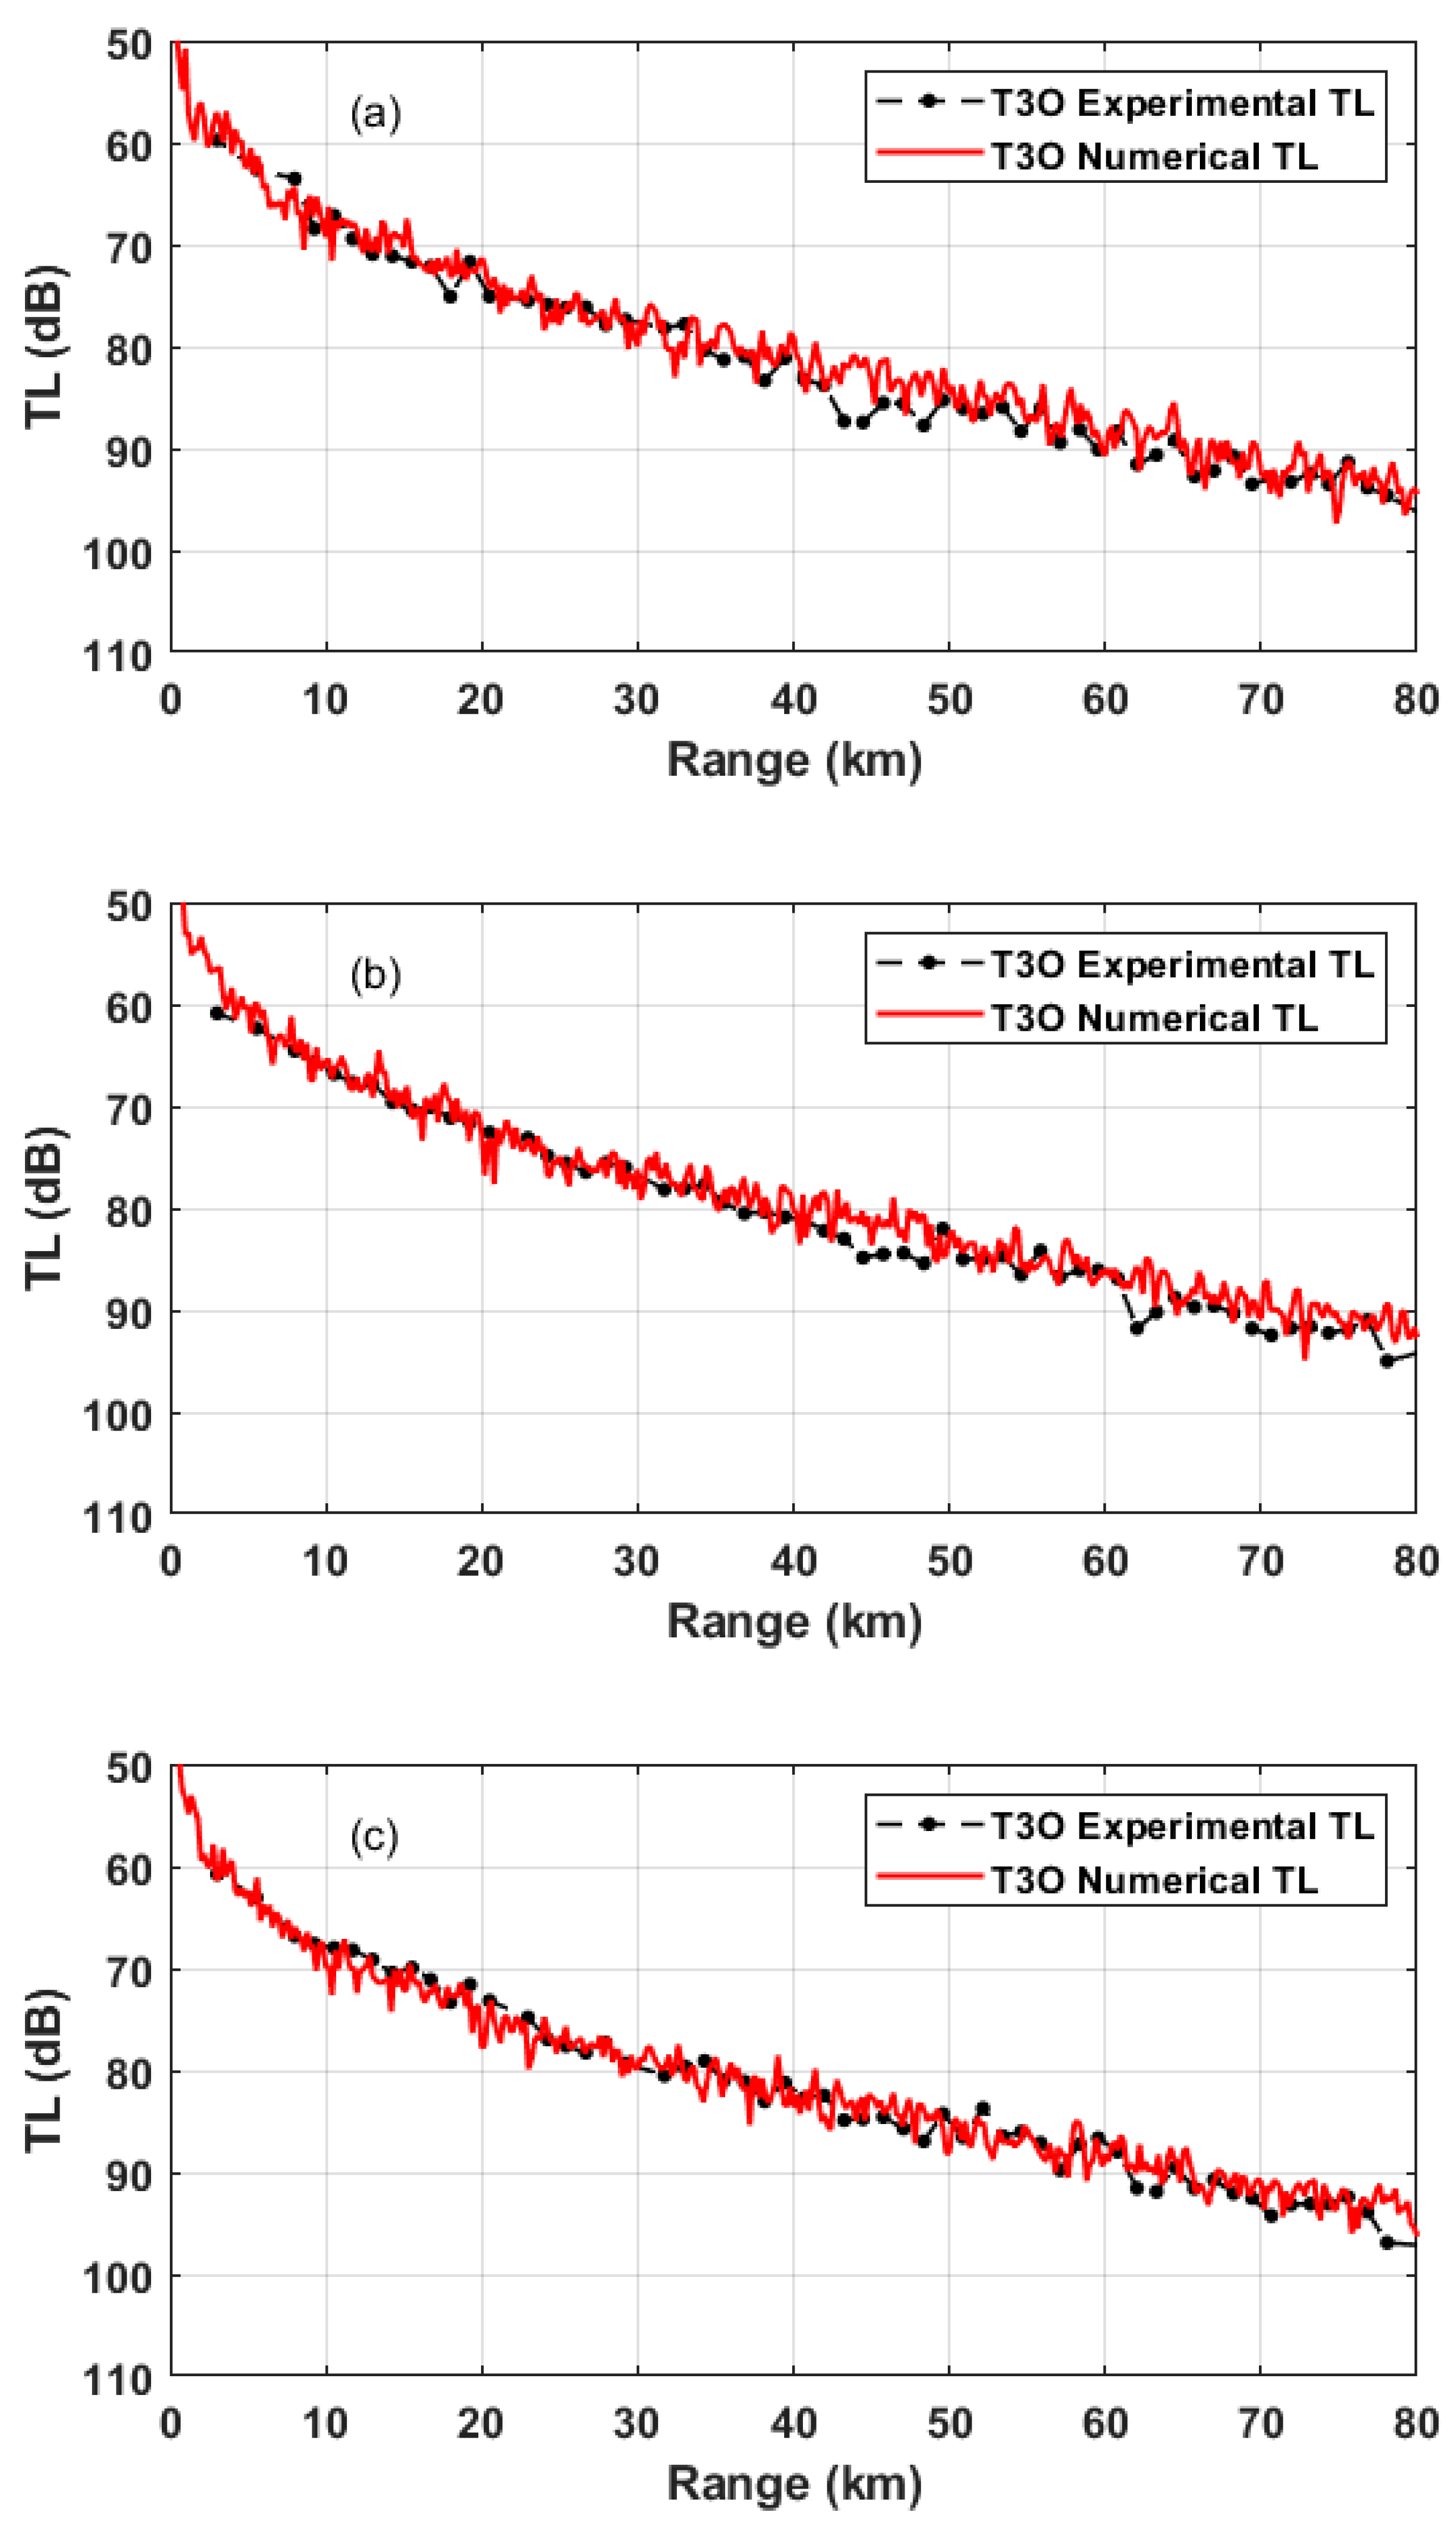
Figure 10 and Figure 11 show the comparisons of experimental and numerical TLs of T1O and T3O with different receiver depths (11, 37, and 71 m), respectively. Figure 10a shows the comparisons of experimental (black line) and numerical TLs (red line and blue line) of T1O with different bottoms for the source depth 7 m and the receiver depth 11 m. The blue line is the numerical result for a flat bottom with a depth of 98 m from 40–80 km. It can be seen that the variation of sediment parameters does not cause a significant decrease of TL at the range of 40 km. Therefore, it is concluded that the change of bottom sediment types is not the main reason for the abnormal TLs. The TLs present strong fluctuations from about 40–80 km compared with the other two receiver depths in Figure 10b,c. The TLs increase slowly and there is a significant decrease near 70 km. By contrast, Figure 11 shows that TLs along T3O gradually increase with range. We can see that the TLs calculated by the numerical model are in good agreement with the experimental data. It reflects the TLs variation amplitude and variation range caused by the undulating bottom in general. The slight differences within certain distances between experimental and numerical TLs may be caused by geoacoustic properties and bathymetry errors. Therefore, it can be concluded that the different undulating bottoms of the two tracks are the main reason for the difference in TLs within the range of 40–80 km.

4. Analysis of Physical Mechanism of Underwater Sound Propagation

To explain the different effects of undulating bottom on the sound field energy and analyze how the sound rays propagate in the two different bottoms, we use the ray model BELLHOP [21] to predict acoustic pressure fields in the underwater environment.
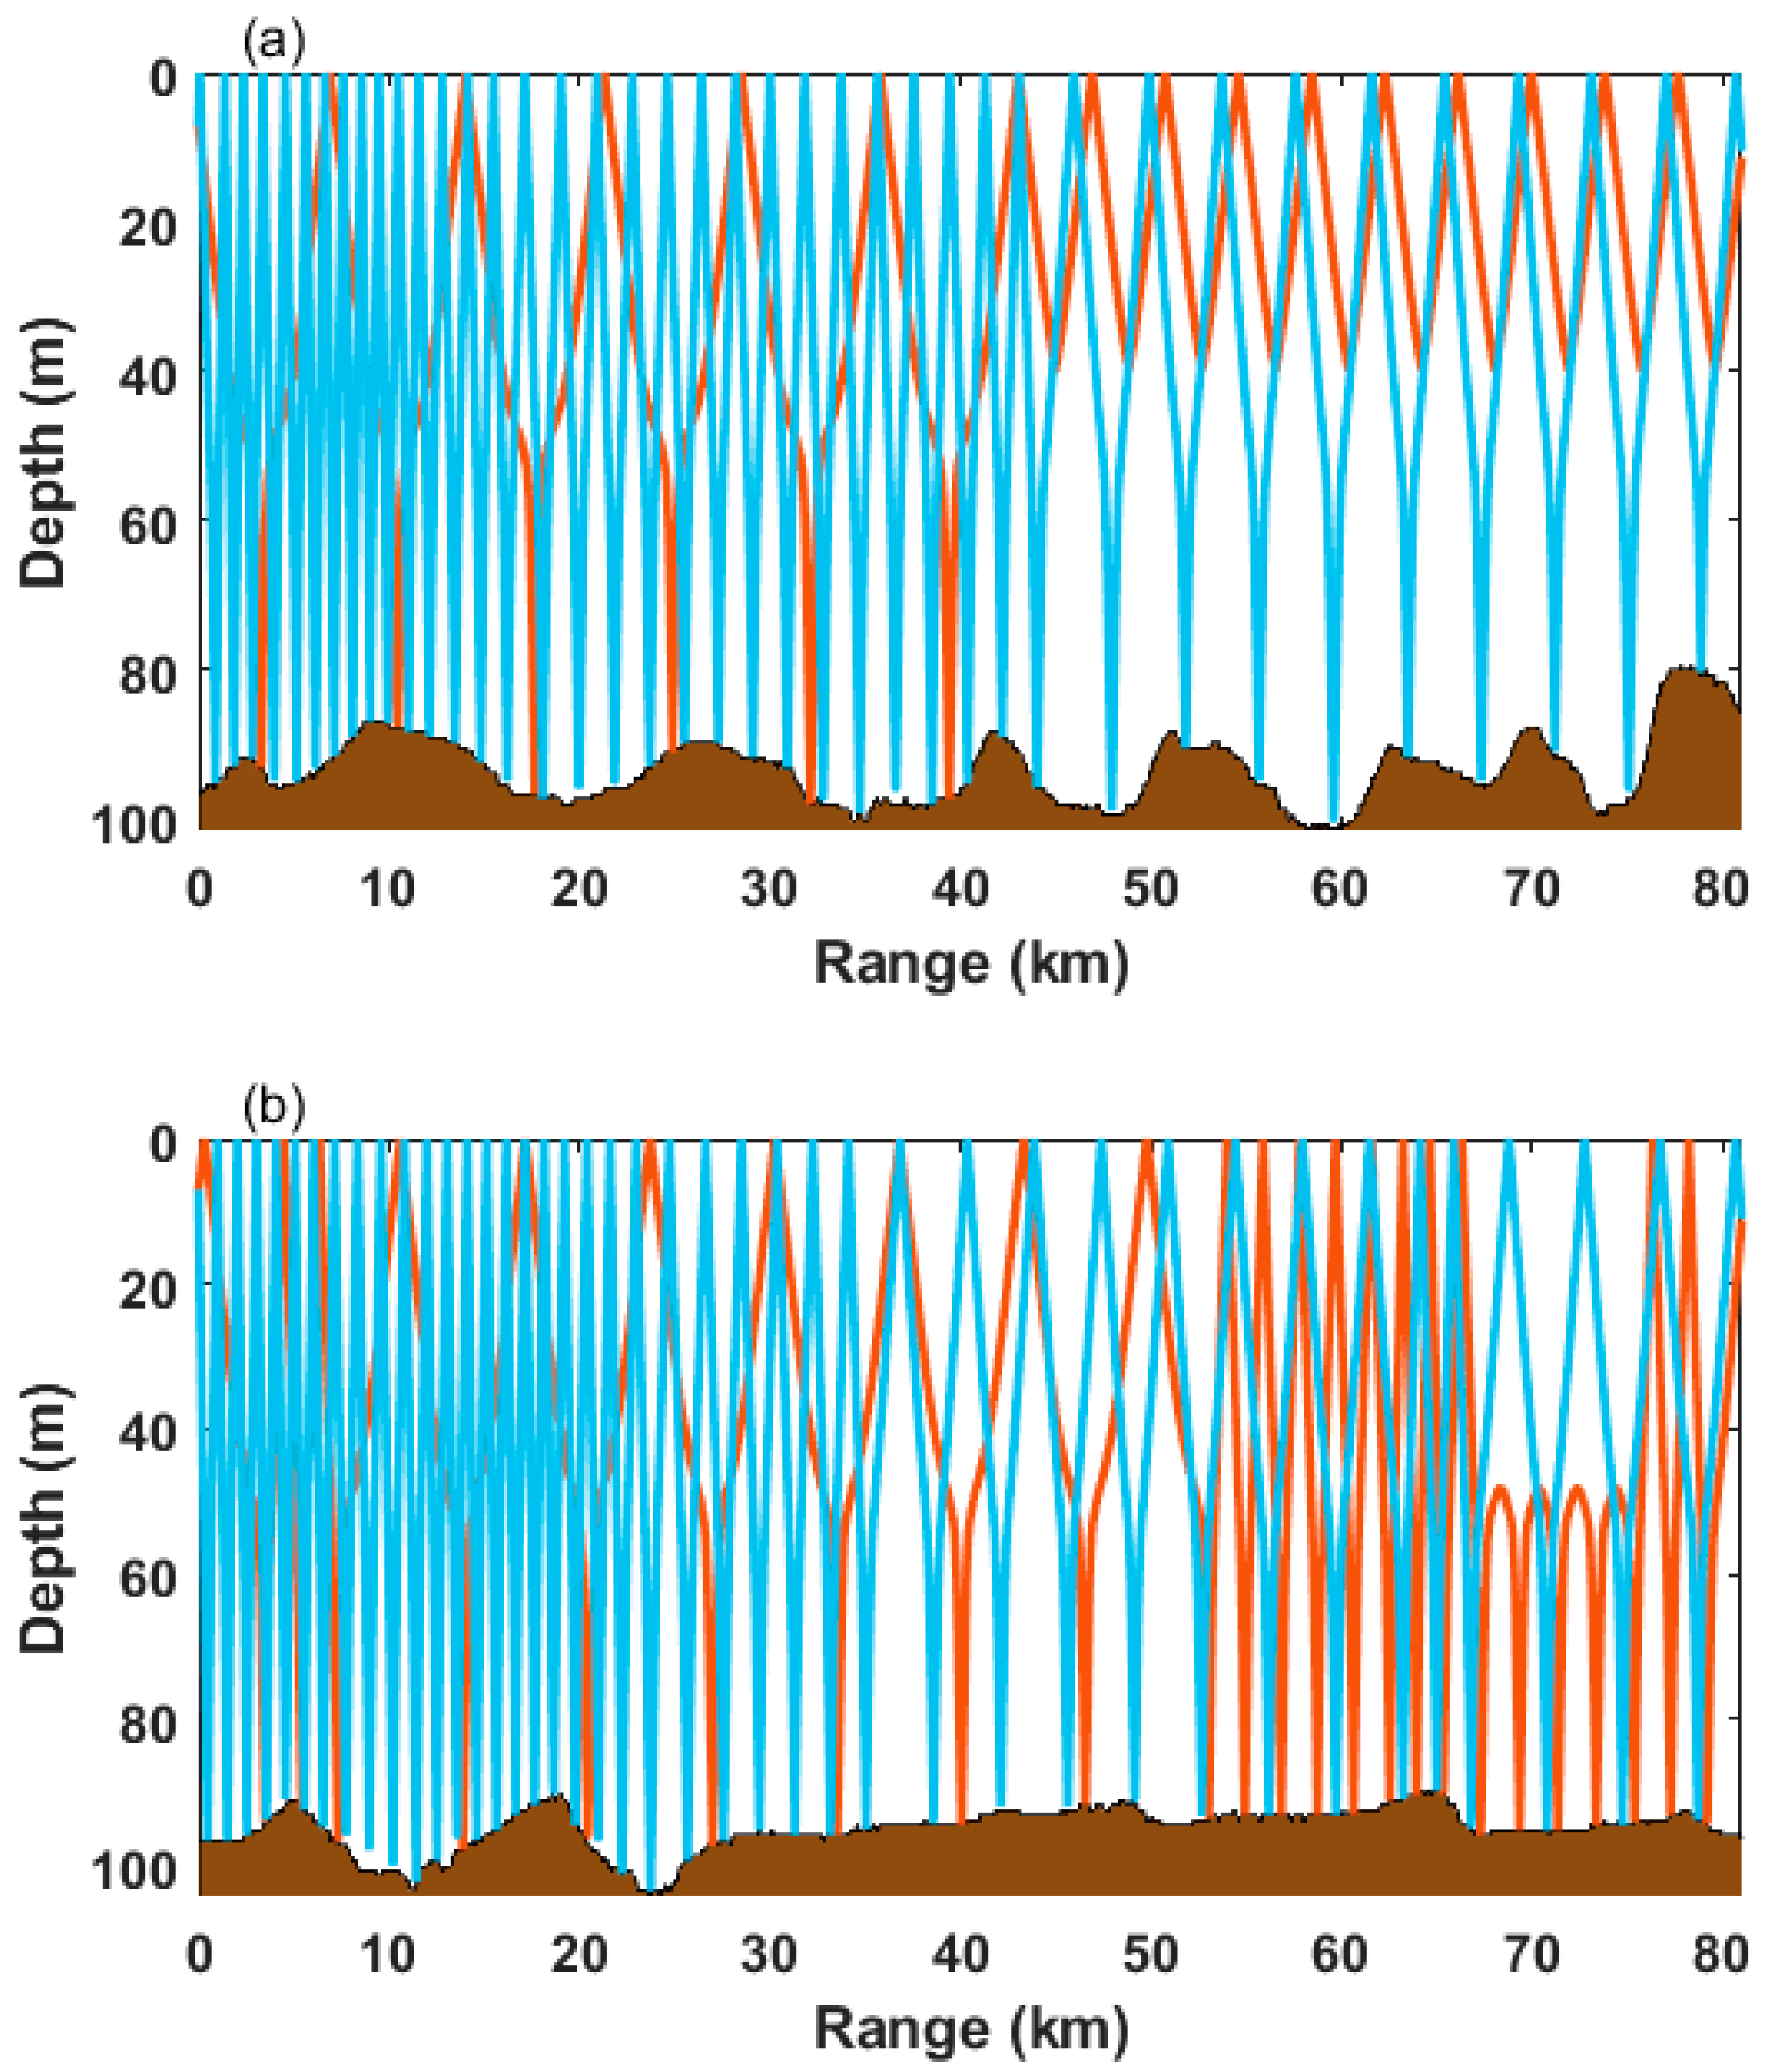
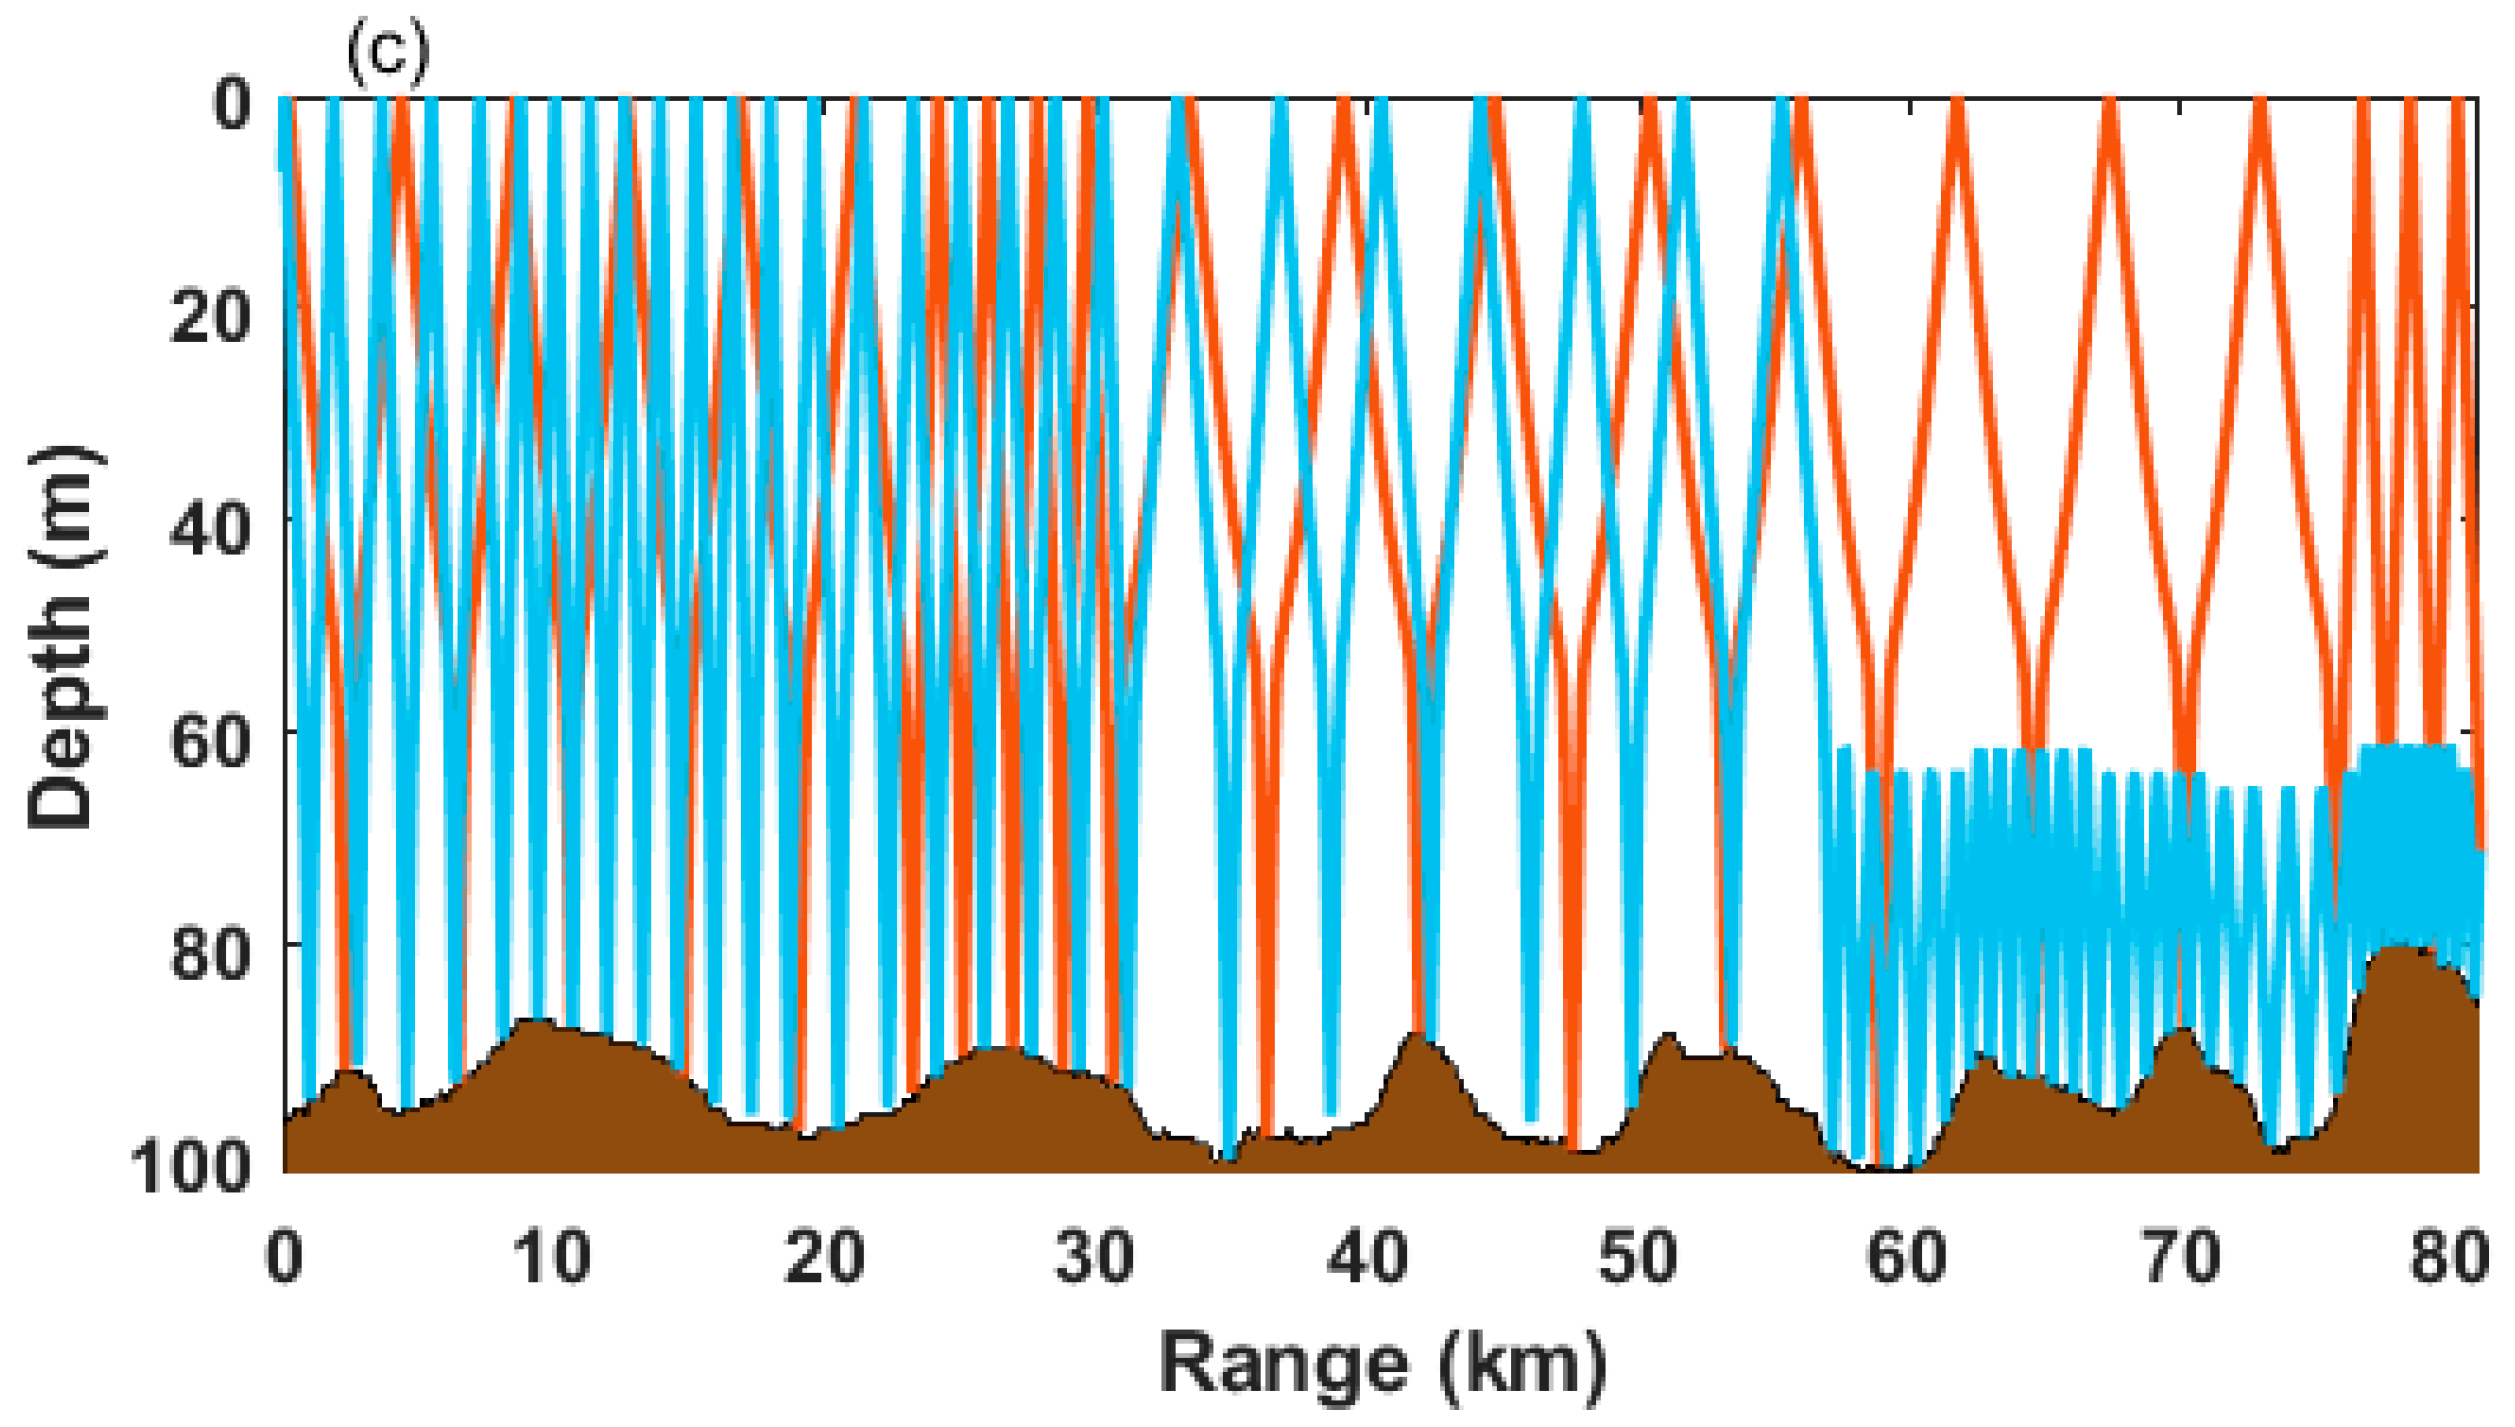
The Eigen rays diagrams of T1O and T3O with the source depth of 7 m and central frequency of 1000 Hz are displayed in Figure 12. Figure 12a shows the ray diagram of T1O with the receiver depth of 11 m, Figure 12b shows the ray diagram of T3O with the receiver depth of 11 m, and Figure 12c shows the ray diagram of T1O with the receiver depth of 71 m. For the environment shown in Figure 3, the critical grazing angle is 29.3°. The red ray (with grazing angle within 0°–±5°) and blue ray (with grazing angle within ±6°–±15°) are rays that can arrive at the receiver. In Figure 12a, the red ray is reflected by the undulating surface with a large inclination angle at 40 km and then propagates in the surface duct, only reflected by the sea surface. When it finally arrives at the receiver point of 11 m, the energy loss was minor, which explains the strong fluctuations of TLs shown in Figure 7a. In Figure 12b, the bottom of T3O after 30 km tends to be flat; the reflection angles of the sound rays are changed after the reflection off the bottom. Those rays with increased reflection angles lead to significant bottom loss [12,22] ( B L = 10 l o g | R | 2 , R is the reflection coefficient). Thus, the TLs increase when those rays arrive at the receiver point, leading to the difference of TLs of the two tracks shown in Figure 7a. In Figure 12c, the sound rays propagate in the whole depth; after several bottom and sea surface reflections, the TLs increase quickly. In addition, the blue ray is reflected by the undulating bottom at about 60 km and then propagates below the thermocline, leading to the decrease of TLs at 63 and 71 km, as shown in Figure 7c.
Figure 13 shows the Eigen rays diagram of T1O with the central frequency 600 Hz, the source depth 7 m, and the receiver depth 11 m. We can see that unlike the path of the red ray in Figure 12a, the red ray in Figure 13 still propagates in the whole depth after 40 km. For an isothermal surface layer of depth D, the approximate formula for the cutoff frequency (below which no energy can propagate in the surface duct) [12] in hertz is given by f 0 1500 / ( 0.008 D 3 / 2 ) . For the marine environment in Figure 3, the cutoff frequency is around 621 Hz for a 45 m deep surface duct. In other words, the sound ray cannot propagate in the surface duct when the central frequency is 600 Hz, which explains why the energy will not converge in the mixed layer when the frequency is less than 600 Hz.
The previous analysis concluded that the undulating bottom within 40–80 km of T1O is the reason for the TL differences along T1O and T3O. To further verify this conclusion, when the source depth is 7 m, the two-dimensional TL of the two tracks is calculated by RAM-PE, and the results are shown in Figure 14. It can be seen from Figure 14a that there is a noticeable energy convergence in the mixed layer at a depth of 10–40 m after the range of 40 km, which is consistent with Figure 6a.

5. Conclusions

An experiment was carried out in the East China Sea to investigate the properties of sound propagation. The difference of TL along two undulating bottom tracks reaches 10 dB, and there is a noticeable energy convergence in the mixed layer at the depth 10–40 m for one of the tracks. Considering the natural ocean environments, the sound field for different conditions was simulated. The experimental and numerical results show that the undulating bottom with a large inclination angle is the key factor to cause the TL differences.
Under the shallow water condition with a negative thermocline, the undulating bottom seems to have a minor influence on sound propagation for low frequencies (<600 Hz) when the source is located above the thermocline. For high frequencies (1000–2000 Hz), however, the effect is significant. Sound rays are reflected by the undulating sea bottom during their propagation. The change of reflection angles is related to the gradient of the undulating bottom. The larger the inclination angle, the greater the grazing angle changes. These angle changes lead to different sound propagation paths between the undulating bottom and the flat bottom, resulting in the difference of TLs at a certain distance and depth. In addition, some sound rays with a small grazing angle will propagate only in the surface duct after being reflected by the undulating bottom and no longer interact with the sea bottom. Thus, the TLs of these sound rays will be smaller when they arrive at the receiver point, which will cause energy convergence in the mixed layer if the receiver point is above the thermocline. Meanwhile, some sound rays propagate between the thermocline and the bottom after being reflected by the undulating bottom, which will also cause the TLs to decrease at specific depths below the thermocline.
In practical engineering applications, this research is of great significance for evaluating the detection performance of sonar in undulating bottom topography, improving the array signal processing algorithm, and guiding construction of the bathymetry database. In addition, the change of multipath characteristics in shallow water caused by the undulating bottom leads to the change of the sound field spectrum [10]. It will affect the underwater target positioning based on the matched-field processing method. In addition, the analysis of sound propagation law and physical mechanism in the shallow water condition with the undulating bottom at different frequencies will be the focus of further research.

Author Contributions

Conceptualization, Z.L.; writing—original draft preparation, D.L.; writing—review and editing, Z.L. and D.L.; organizer of the East China Sea experiment, G.W.; data curation, Y.L. All authors have read and agreed to the published version of the manuscript.

Funding

This research was funded by the National Natural Science Foundation of China (Grant No. 11874061, Grant No. 11774374 and Grant No. 12174418).

Institutional Review Board Statement

Not applicable.

Informed Consent Statement

Not applicable.

Data Availability Statement

Not applicable.

Acknowledgments

The authors thank all of the experiment participants for their great efforts to make this experiment successful in 2020.

Conflicts of Interest

The authors declare no conflict of interest.

References

  1. Katsnelson, B.; Petnikov, V.; Lynch, J. Fundamentals of Shallow Water Acoustics; Springer Science & Business Media: New York, NY, USA, 2012; pp. 1–3. [Google Scholar]
  2. Northrop, J.; Loughridge, M.S.; Werner, E.W. Effect of near-source bottom conditions on long-range sound propagation in the ocean. J. Geophys. Res. 1968, 73, 3905–3908. [Google Scholar] [CrossRef]
  3. Carlson, P.R. Holocene slump on continental shelf off Malaspina Glacier, Gulf of Alaska. Am. Assoc. Pet. Geol. Bull. 1978, 62, 2412–2426. [Google Scholar]
  4. Rousseau, T.H.; Jacobson, M.J.; Siegmann, W.L. Ray transmissions over a sloping bottom in shallow water. J. Acoust. Soc. Am. 1985, 78, 1713–1726. [Google Scholar] [CrossRef] [Green Version]
  5. Li, Z.L. The Effects of Internal Waves, Surface Fluctuation and Bottom Roughness on Matched Field Source Localization in Shallow Water. Ph.D. Thesis, Institute of Acoustics, Chinese Academy of Sciences, Beijing, China, 2002. [Google Scholar]
  6. Chiu, Y.S.; Chang, Y.Y. Normal incidence measurement in a subaqueous sand dune field in the South China Sea. J. Acoust. Soc. Am. 2014, 136, 376–382. [Google Scholar] [CrossRef] [PubMed] [Green Version]
  7. Hu, Z.G.; Li, Z.L.; Zhang, R.H.; Ren, Y.; Qin, J.X.; He, L. Sound propagation in deep water with a sloping bottom. Acta Phys. Sin. 2016, 65, 014303. [Google Scholar]
  8. Han, F.; Wang, K.; Sun, J.G. The influence of irregular seafloor topography on the seismic wave field and migration imaging. Acta. Oceanol. Sin. 2019, 38, 151–158. [Google Scholar] [CrossRef]
  9. Liu, J.; Peng, Z.H.; Li, Z.L.; Luo, W.Y.; Yang, X.S. Measurement and modeling of sound propagation over continental slope in the South China Sea. J. Acoust. Soc. Am. 2020, 147, 209–214. [Google Scholar] [CrossRef] [PubMed]
  10. Liu, D.; Li, Z.L.; Liu, R.Y. Sound propagation in shallow water with periodic rough bottom. Acta. Phys. Sin. 2021, 70, 034302. [Google Scholar]
  11. Li, N.S.; Zhang, M.H.; Gao, B. Horizontal correlation of long-range bottom reverberation in shallow sloping seabed. J. Mar. Sci. Eng. 2021, 9, 414. [Google Scholar] [CrossRef]
  12. Jensen, F.B.; Kuperman, W.A.; Porter, M.B.; Schmidt, H. Computational Ocean. In Acoustics; Springer: New York, NY, USA, 2011; pp. 38–50, 457–527. [Google Scholar]
  13. Collins, M.D.; Cederberg, R.J.; King, D.B.; Chin-Bing, S.A. Comparison of algorithms for solving parabolic wave equations. J. Acoust. Soc. Am. 1996, 100, 178–182. [Google Scholar] [CrossRef]
  14. Collins, M.D. A split-step padé solution for the parabolic equation method. J. Acoust. Soc. Am. 1993, 93, 1736–1742. [Google Scholar] [CrossRef]
  15. Collins, M.D. Generalization of the split-step Padé solution. J. Acoust. Soc. Am. 1994, 96, 382–385. [Google Scholar] [CrossRef]
  16. Collins, M.D. User’s Guide for RAM Versions 1.0 and 1.0 p; Naval Research Lab: Washington, DC, USA, 1995. [Google Scholar]
  17. Li, G.X.; Yang, Z.G.; Liu, Y. Genetic Environment Map of Sediment in the East China Sea; Science Press: Beijing, China, 2005; p. 76. [Google Scholar]
  18. Hamilton, E.L. Geoacoustic modeling of the sea floor. J. Acoust. Soc. Am. 1980, 68, 1314–1340. [Google Scholar] [CrossRef]
  19. Li, Z.L.; Zhang, R.H.; Peng, Z.H.; Li, X.L. Abnormal attenuation of sound caused by horizontal variation of seabed acoustic characteristics. Sci. Sin. Phys. Mech. Astronomica. 2004, 34, 247–256. [Google Scholar]
  20. Zhou, J.X.; Zhang, X.Z.; Rogers, P.H.; Simmen, J.A.; Dahl, P.H.; Jin, G.L.; Peng, Z.H. Reverberation vertical coherence and sea-bottom geoacoustic inversion in shallow water. IEEE J. Ocean. Eng. 2005, 29, 988–999. [Google Scholar] [CrossRef]
  21. Porter, M.B. Beam tracing for two- and three-dimensional problems in ocean acoustics. J. Acoust. Soc. Am. 2019, 146, 2016–2029. [Google Scholar] [CrossRef] [PubMed]
  22. McCammon, D.F. Fundamental relationships between geoacoustic parameters and predicted bottom loss using a thin layer model. J. Geophys. Res. 1988, 93, 2363–2369. [Google Scholar] [CrossRef]
Figure 1. Configuration of the experiment.
Jmse 09 01010 g001
Figure 2. Bathymetry along two propagation tracks, T1O (a) and T3O (b).
Jmse 09 01010 g002
Figure 3. Sound speed profile (SSP) during the experiment.
Jmse 09 01010 g003
Figure 4. Configuration of the source level calibration.
Jmse 09 01010 g004
Figure 5. The source level for the central frequency 100–2000 Hz (interval 100 Hz).
Jmse 09 01010 g005
Figure 6. The experimental TLs at all receivers for T1O (a) and T3O (b), for the central frequency 1000 Hz and the source depth 7 m.
Jmse 09 01010 g006
Figure 7. Comparison of experimental TLs of T1O and T3O for the central frequency 1000 Hz, source depth 7 m, and receiver depth 11 m (a), 37 m (b), and 71 m (c).
Jmse 09 01010 g007
Figure 8. Comparison of experimental TLs of T1O and T3O at the range of 69.5 km for the central frequency 100–2000 Hz, source depth 7 m, and receiver depth 11 m (a), 37 m (b), and 71 m (c).
Jmse 09 01010 g008
Figure 9. Sediment model in horizontal plane view along two tracks (T1O and T3O).
Jmse 09 01010 g009
Figure 10. Comparison of numerical TLs result of T1O for central frequency 1000 Hz and source depth 7 m. (a) Comparing TLs of T1O with different bottoms, receiver depth is 11 m, (b) 37 m, and (c) 71 m.
Jmse 09 01010 g010
Figure 11. Comparison of numerical TLs result of T3O for central frequency 1000 Hz, source depth 7 m, and receiver depth 11 m (a), 37 m (b), and 71 m (c).
Jmse 09 01010 g011
Figure 12. Eigen rays from the source to the receiver in the range of 80 km with central frequency 1000 Hz: (a) T1O, source depth 7 m, receiver depth 11 m; (b) T3O, source depth 7 m, receiver depth 11 m; and (c) T1O, source depth 7 m, receiver depth 71 m.
Jmse 09 01010 g012aJmse 09 01010 g012b
Figure 13. The Eigen rays diagram of T1O with central frequency 600 Hz, source depth 7 m, and receiver depth 11 m.
Jmse 09 01010 g013
Figure 14. The numerical two-dimensional TL for T1O (a) and T3O (b), for central frequency 1000 Hz and source depth 7 m.
Jmse 09 01010 g014
Table 1. Sedimentary parameters in experimental sea area.
MFSFSVFSTSYS
Sound velocity (m/s)18001749170216461630
Density (g/cm3)1.951.941.861.771.76
Publisher’s Note: MDPI stays neutral with regard to jurisdictional claims in published maps and institutional affiliations.