Article

Controlling Factors of Phytoplankton Productivity in Marshes in a Hot Climate with High Seasonal Variation

1
Department of Botany & Microbiology, College of Science, King Saud University, Riyadh 11451, Saudi Arabia
2
General Education Directorate of Wasit Province, Education Ministry, Wasit 52002, Iraq
3
Department of Biology, College of Science for Women, University of Baghdad, Baghdad 10070, Iraq
4
Department of Biological Sciences, University of Arkansas, Fayetteville, AR 72701, USA
5
Marine Science Center, University of Basra, Basra 61004, Iraq
*
Author to whom correspondence should be addressed.
J. Mar. Sci. Eng. 2021, 9(8), 811; https://doi.org/10.3390/jmse9080811
Submission received: 14 June 2021 / Revised: 14 July 2021 / Accepted: 22 July 2021 / Published: 27 July 2021
(This article belongs to the Special Issue Marine Phytoplankton and Their Evolution)

Abstract

:
In this work the Auda marsh, which is part of a system of Iraqi marshes, was sampled to assess the seasonal dynamics and controlling factors of microalgae productivity. The marshes are situated in a hot climate with high seasonal variation near the Arabian Gulf. Physicochemical and biological measurements were taken for water in three areas. Bio-optical models were constructed to describe the primary productivity and chlorophyll-a concentrations in the wet and dry seasons separately and also for the entire area of the Iraqi marshes. The models, as well as almost all measurements, showed high seasonal variation. The mean water temperature was 16 °C in the wet season and 28 °C in the dry season. An almost twofold difference was measured for turbidity and the concentrations of dissolved oxygen and chlorophyll-a for the two seasons. Chlorophyll-a appeared to be a better indicator of ecosystem conditions than primary productivity or biological oxygen demand, according to the results obtained from canonical correlation analysis. Nitrogen or phosphorous did not explain primary productivity or chlorophyll-a to an appreciable extent. Biological variables were related most strongly to water temperature and turbidity, which were the factors most important for controlling phytoplankton productivity in the marshes.

1. Introduction

Wetlands are facing rapid and unpredictable changes in response to global warming. The warming of the climate has been shown to change wetland ecosystems throughout the world, and it is also likely to affect the wetlands in areas where the climate is already hot and the conditions are extreme [1]. Warming affects the hydrological regime of the wetlands, which largely controls the organisms present [2]. Moreover, warming itself creates stressful conditions for these organisms, changing the functioning of the entire ecosystem [3].
Warming generally increases the primary productivity of aquatic ecosystems. Primary production is enhanced by high temperatures that indirectly weaken water current in tidal wetlands, thus increasing the concentrations of nutrients available to organisms such as phytoplankton [4,5,6,7]. However, the changes reported in phytoplankton biomass have been highly variable and even contrasting, depending on the area studied [8,9]. Therefore, local information on wetlands is needed.
The changes in a wetland ecosystem can be assessed by measuring, for instance, the concentrations of various nutrients, oxygen, turbidity, and primary production as the concentration of chlorophyll [4]. Measuring only single variables such as a particular nutrient or oxygen concentration does not provide enough data for large and spatio-temporally variable areas. A method offering the possibility of assessing environmental changes in large areas is the analysis of Landsat data [10]. This type of analysis has been shown to be useful in assessing water quality in areas with high seasonal variation [11,12,13].
There is an extensive tidal wetland area situated in Iraq called the Iraqi marshes or Mesopotamian marshes. The area used to be the largest wetland ecosystem in southwest Asia (20,000 km2) [8]. Large-scale desiccation took place in the marshes in the 1990s and reflooding occurred thereafter in 2003 [9]. At present, physicochemical variables such as salinity, sulfate, and nutrient concentrations are near the pre-desiccation conditions, and the area is considered to have recovered from desiccation from a physicochemical point of view [10,13]. Ecosystem functioning, in contrast, may not be totally recovered [14,15]. The Iraqi marshes are bordered by the Arabian Gulf, which is an ocean vulnerable to global warming and dependent on freshwater transport [16]. Thus, the changes in the marshes may have wider consequences for the Arabian Gulf.
More information is needed to understand the dynamics of wetlands throughout the world [17]. Herein we focus on wetlands where the climate is highly seasonal with hot, dry summers and cool, wet winters. Iraqi marshes are situated in a hot climate where seasonal variation is high; water temperature ranges from 11.9 to 33 °C in winter and summer, respectively [18]. Our objective was to understand the seasonal variation in primary productivity and the factors that control this variation in a wetland in the system of Iraqi marshes.

2. Materials and Methods
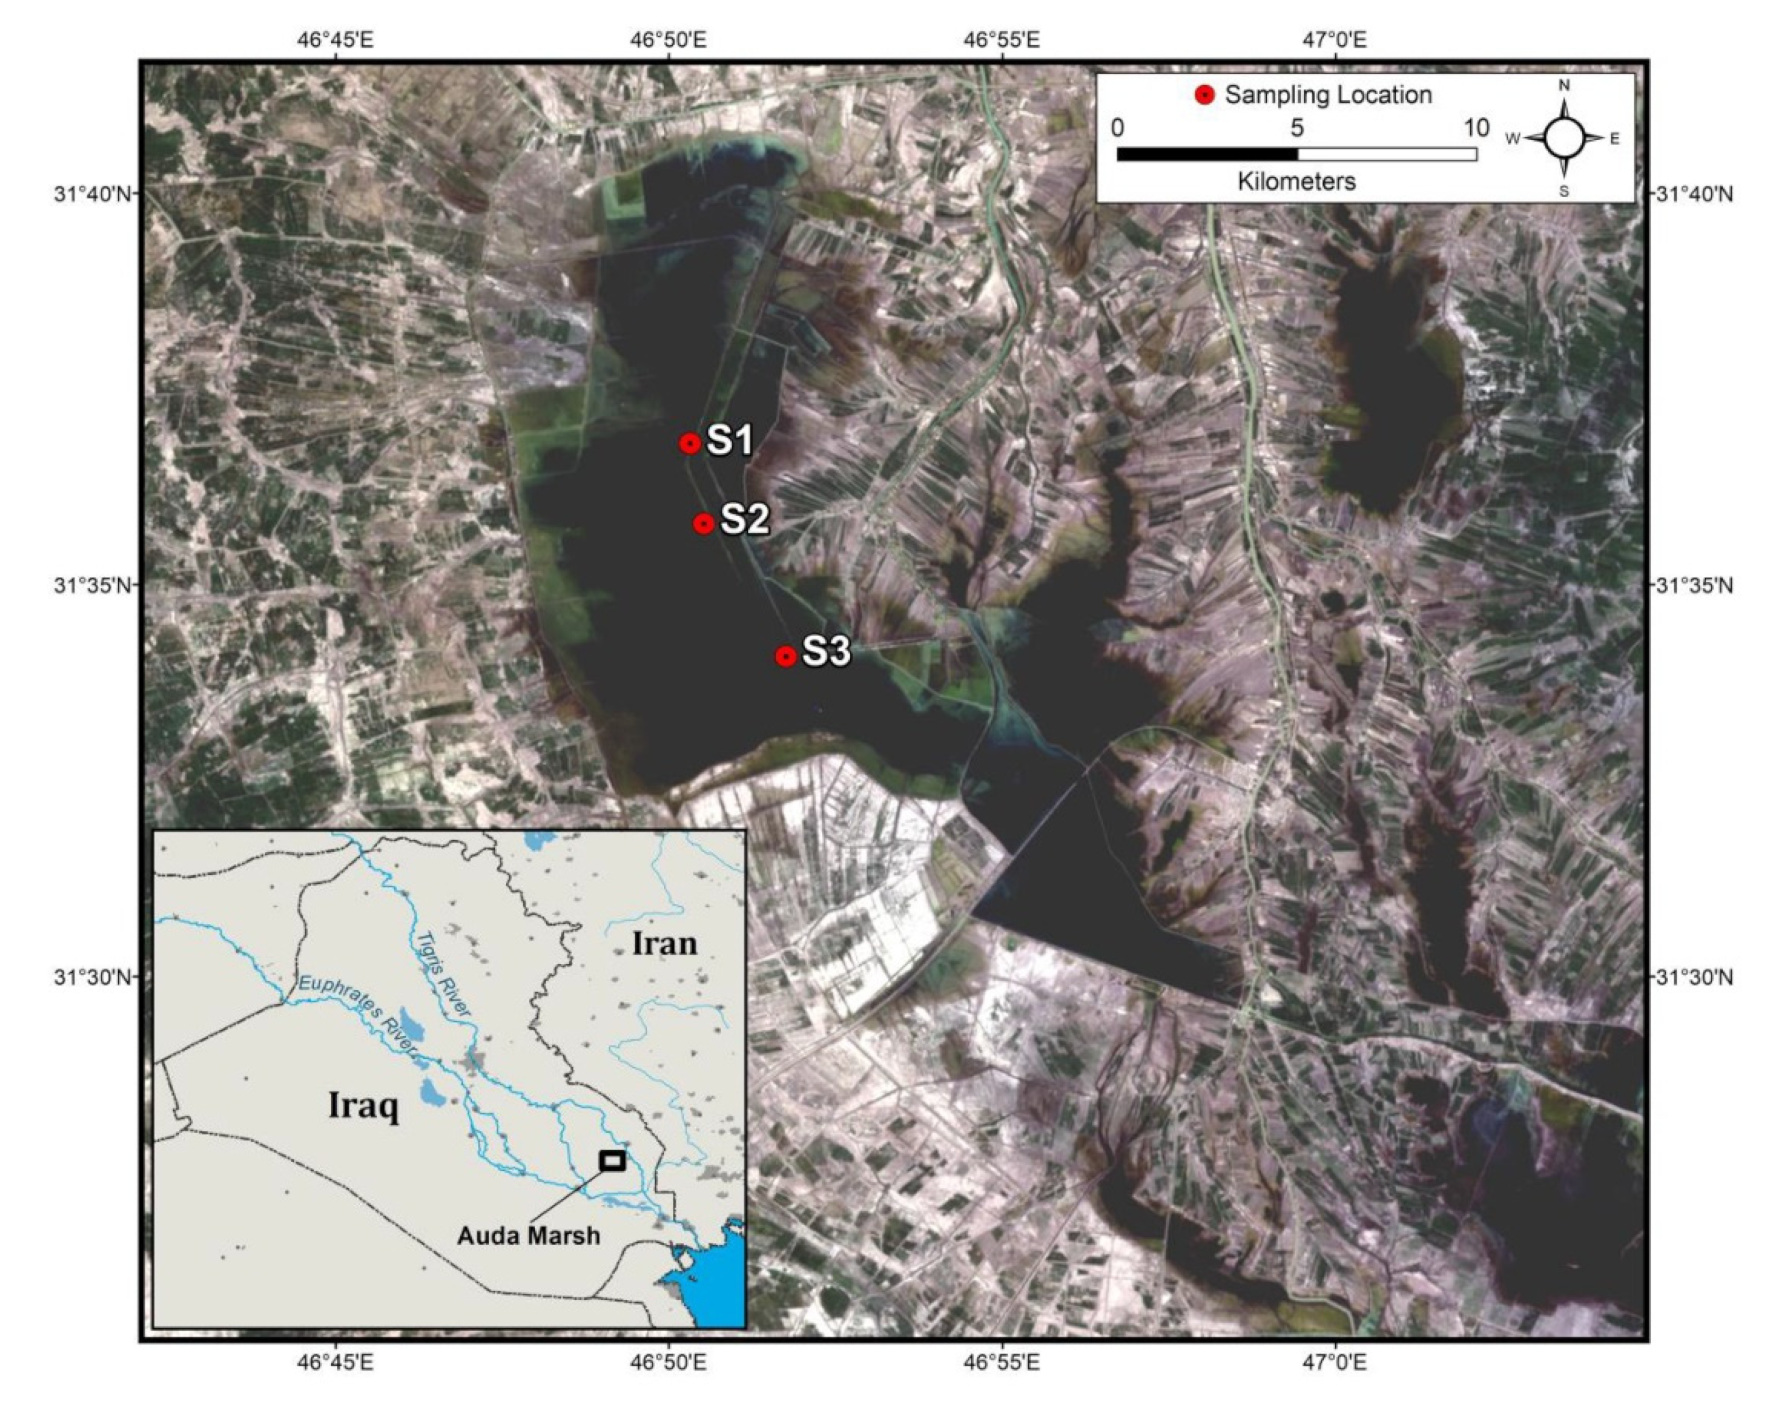
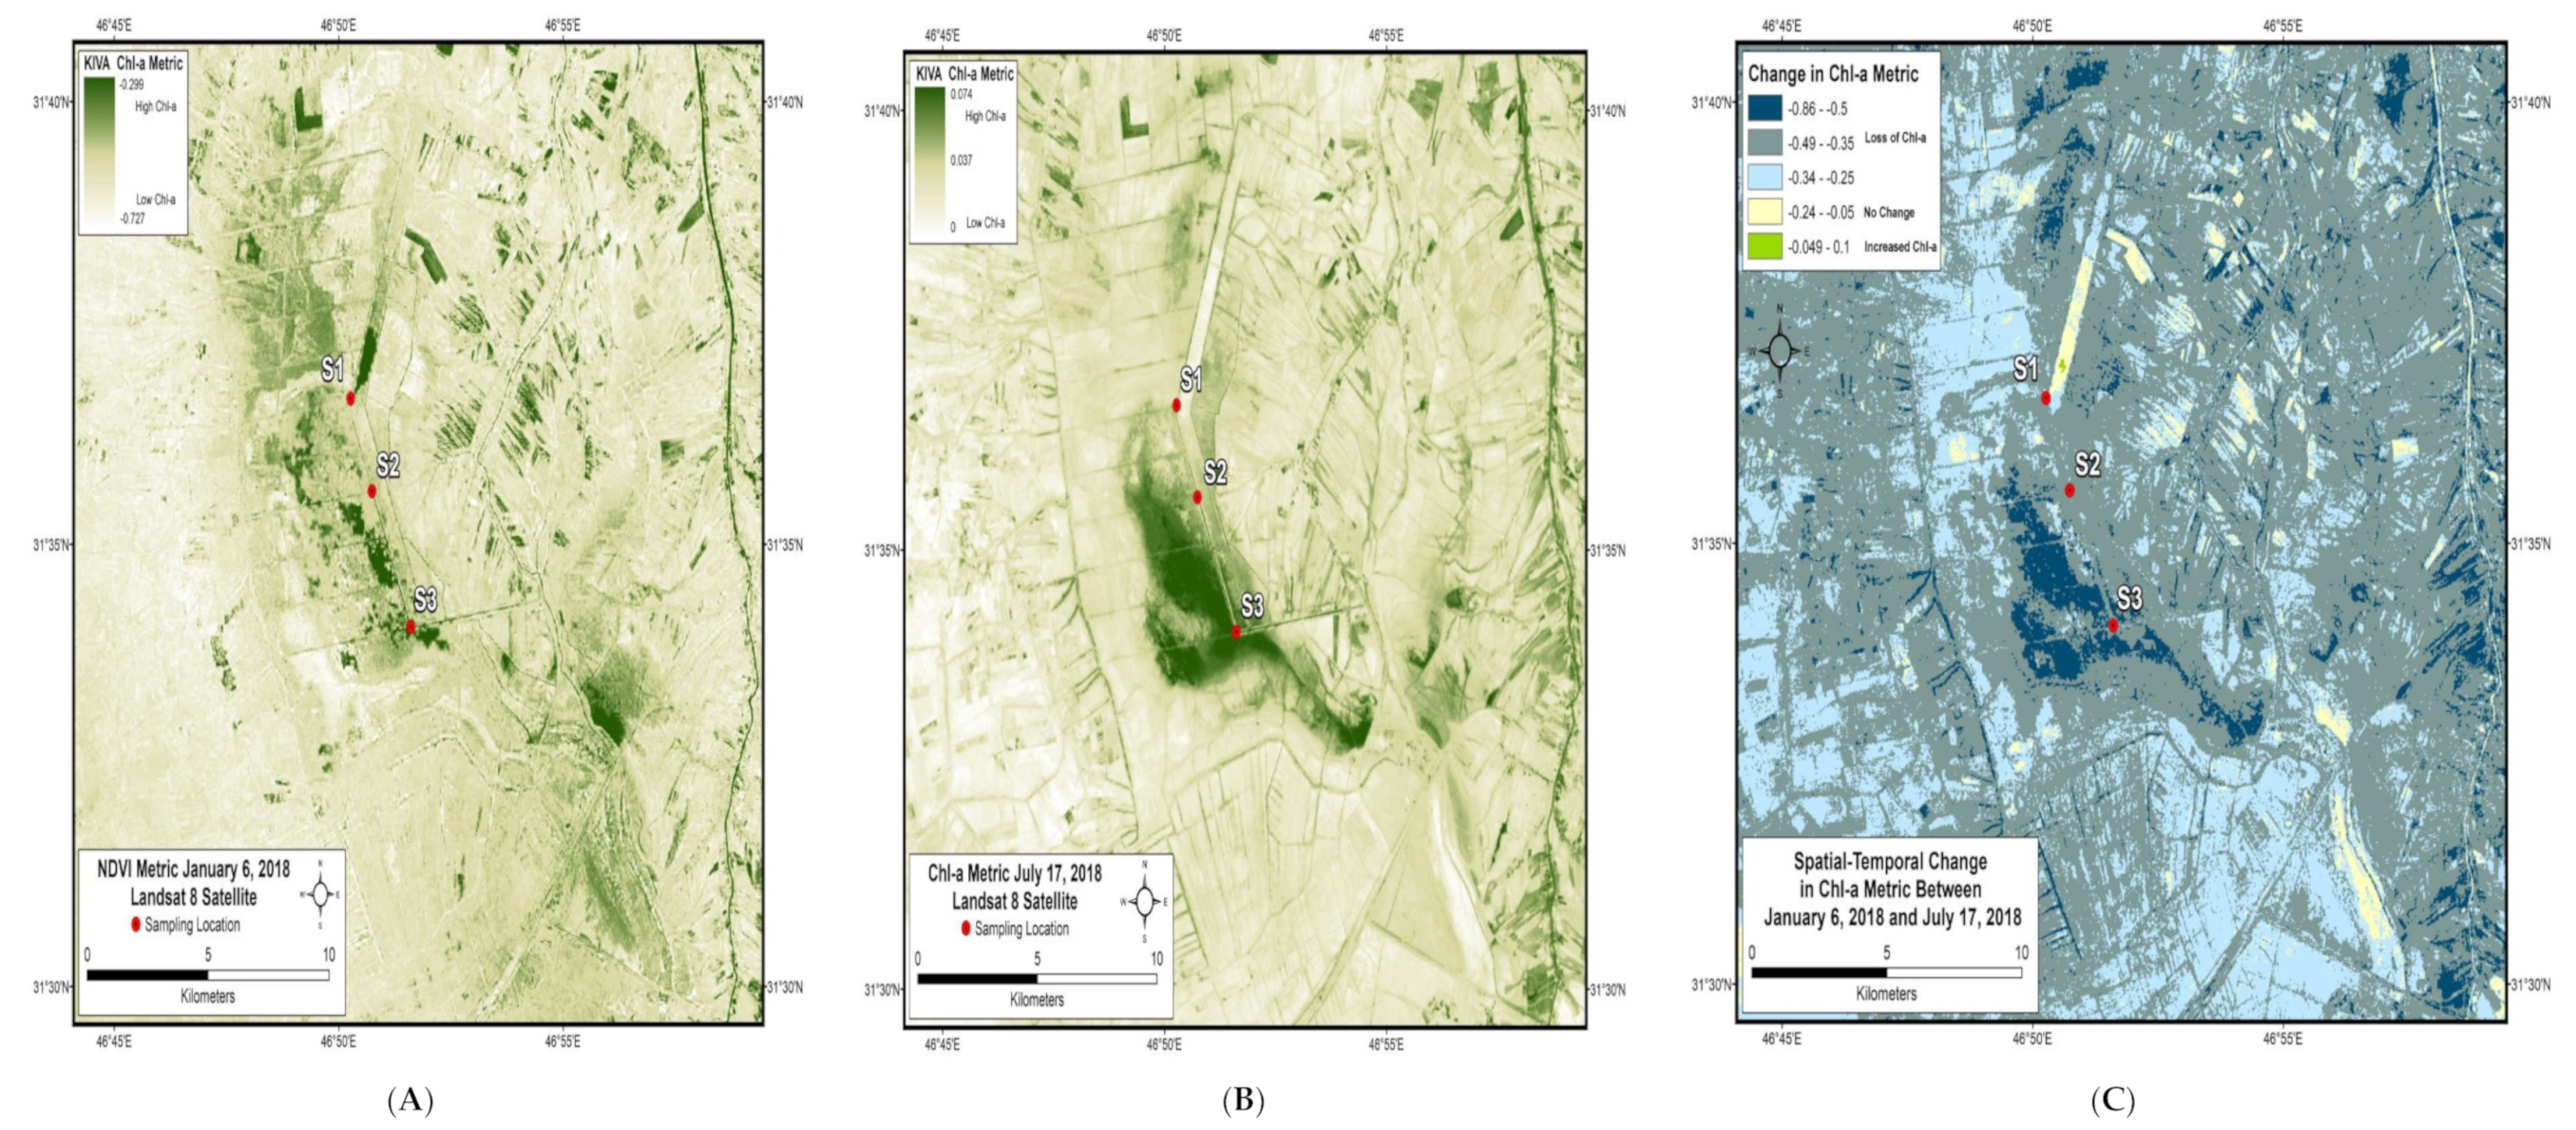
2.1. Study Area

The Auda marsh is a body of water in southern Iraq (31°33′ N; 46°51′ E) (Figure 1). The area of the marsh is ca. 7500 ha during the wet season. The water depth ranges from 1 to 4.3 m. Auda marsh was desiccated during the 1990s and reflooded naturally after 2003 [19]. This marsh is currently dominated by emergent aquatic plants such as Phragmites australis (Cav.) Trin. ex Steud and Typha domingensis Pers. Detailed characteristics of the study sites are given in Table 1. Water samples were collected into glass bottles (three stations [S1, S2, and S3] Figure 1), 13 times monthly from January 2018 to January 2019.

2.2. Chemical and Biological Analyses

Water samples were collected using a horizontal Van Dorn water sampler from the midpoint of the total depth, which was measured. Samples for chemical analysis (1 L) were transferred into polyethylene containers. The samples for chlorophyll a (Chl a) (1 L) were filtered immediately in the field using pre-weighed Whatman GF/F (0.45 µm) filters. The filters were preserved by adding 5 mL of 1% magnesium chloride and kept cold. The species of phytoplankton were identified morphologically as described by Ameen et al. [19].
The concentrations of total nitrogen (TN) and total phosphorous (TP) were measured according to Stainton et al. [20]. Turbidity was measured spectrophotometrically at 750 nm. Silicate, biological oxygen demand (BOD5), and dissolved oxygen (DO) concentrations were measured using standard methods for water analyses according to the American Public Health Association [21].
For the extraction of Chl-a, the filter was placed into a test tube with 10 mL of 90% ice-cold acetone. The tube was kept at 4 °C for 24 h, allowed to warm to room temperature, and then centrifuged for 10 min at 5000 rpm. The colorless biomass was discarded. The pigment was analyzed by comparing the sample against a blank (acetone) with 100% transmission. The concentration of chlorophyll-a in the supernatant was measured spectrophotometrically at the wavelengths of 750 and 665 nm. Samples were then acidified with HCl (1 M) and measured at the same wavelengths. The chlorophyll content was calculated as described in the literature [21].
Primary productivity was determined using the light and dark bottles method according to the literature [21]. The water samples were collected into Winkler bottles (300 mL) from a depth of 20–30 cm. Two bottles for initial (Li), light (L1 and L2), and dark (D) were incubated at the depth of 20–30 cm for four hours. The oxygen concentration was measured using the Azide method, and primary productivity (PP) was calculated as described by [22] (using the bottles).

2.3. Modeling Primary Production

Three time periods (wet, intermediate, and dry seasons) were used to assess changes in primary productivity and the chlorophyll-a metric. Dates for analysis were decided based on field sampling dates and available cloud-free satellite imagery. The wet season analysis was performed on Landsat 8 satellite imagery sourced on 6 January 2018, and the dry season analysis was based on data for 17 July 2018 data. The algorithm supplied by Brivio et al. [23] was used to analyze Landsat 8 satellite data was used.

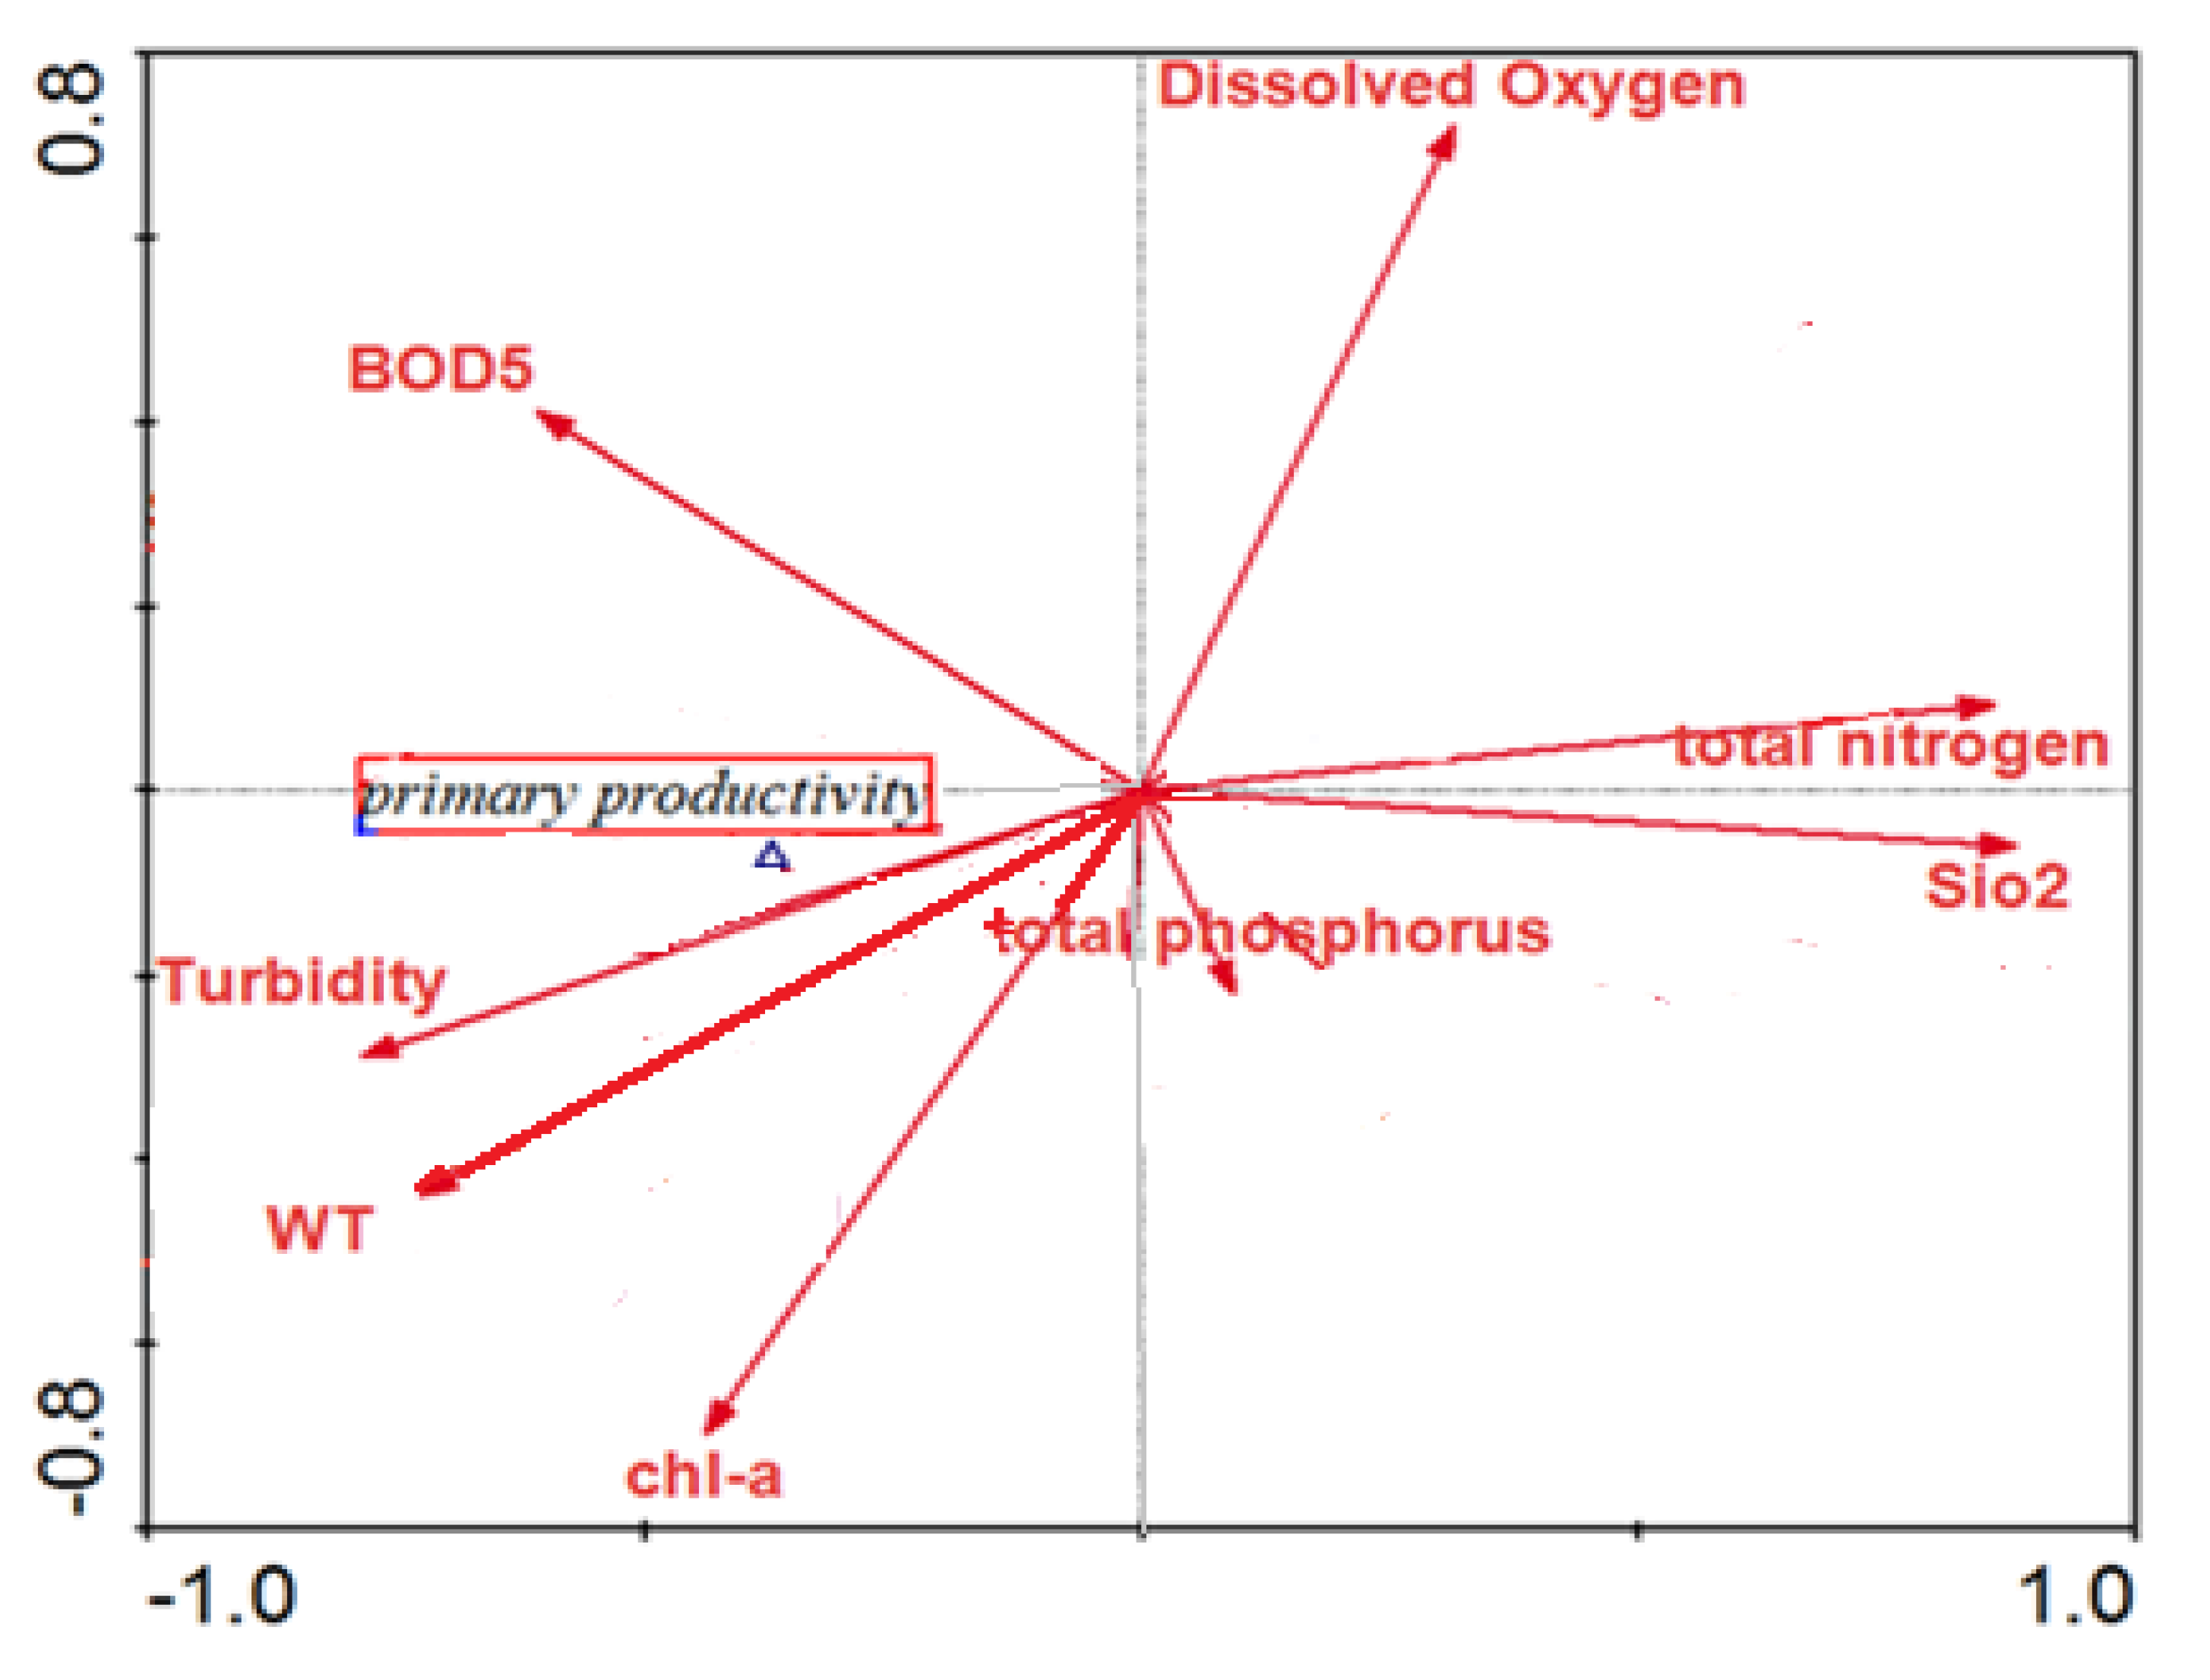
2.4. Statistical Analysis

Descriptive statistics along with the Pearson correlation were calculated and canonical correspondence analysis (CCA) was performed on the entire dataset (n = 39).

3. Results and Discussion

In total, 7 different phyla and 93 genera of phytoplankton were identified. Members of Bacillariophyta were found most frequently (56 strains) followed by the Euglenozoa (15 strains), Cyanobacteria (10 strains), and Chlorophyta (8 strains). The respective percentages were 62%, 16%, 11%, and 9% (Figure 2). Charophyta and Mioza were uncommon (1.08%). The community structure resembles that of the Iraqi Mesopotamian marshes, where more than half of the species of phytoplankton belonged to Bacillariophyceae and Chlorophyceae [19].
The air temperature in the three sites in the Aura marsh ranged between a minimum of 9.8 °C and a maximum of 46 °C. The water temperature ranged between 12 °C and 32 °C. In general, high temporal variation in the general study area was observed in almost all of the variables measured. Turbidity, TP, PP, and Chl-a were higher during the dry season, whereas DO, BOD5, Si, and, TN were higher during the wet season (Table 2). Turbidity varied between 26 NTU in the wet season and 48 NTU in the dry season. As expected, it seemed to be most closely related to phytoplankton biomass, which varied between 125 and 176 mg C m−3 h−1, respectively. However, the correlation was weak. It is well known that turbidity is positively related to the density of macrophytes and phytoplankton [20]. Phytoplankton biomass is described by Chl-a correlated strongly with turbidity (r = 0.7) (Table 3). The highest turbidity observations were recorded for the S3 site (max 130). This is probably related to low water flow, human activities, and agriculture, all of which likely increased suspended particular matter. Chl-a varied from 4.7 µg L−1 in the wet season to 9.8 µg L−1 in the dry season. Chl-a concentration did not exceed 10 µg L−1, which means the Auda marsh has a mesotrophic status [21].
DO concentration at the three sites varied between the lowest value of 0.8 mg L−1 in the dry season to the highest value of 9 mg L−1 during the wet season. The minimum concentration recommended in the literature [22] is 5.5 mg L−1, which in general was not fulfilled in the Auda marsh during the dry season. Previously, in other Iraqi marshes, some areas suffered from low oxygen, with concentrations as low as 2.5 mg L−1 (mean through an entire year) being observed [14]. In most areas, however, the DO concentration exceeded the minimum value [14]. In the Auda marsh, the situation seemed to be worse than for Iraqi marshes in general, because the mean of all DO concentration measurements during the year was 5.6 mg L−1.
Only slight spatial and temporal variations of BOD5 were observed. BOD5 varied between 1.8 mg/L in the dry season and 2.1 mg L−1 in the wet season for the three sampling sites. Relatively low BOD5 values may be due to the absence of industrial activities and low human pollution because of the few villages surrounding the Auda marsh [24]. Moreover, Al-Mosewi [25] suggested that the spread of plants and low water velocity may have contributed to the decrease in the concentration of BOD5. The BOD5 results indicate that the Auda marsh is a relatively clean to moderately polluted marsh [26].
Nutrient concentrations varied remarkably, both temporally and spatially. The reactive silica concentration was 19.3 µg L−1 in the dry season whereas the highest value of the three sampling sites (41.2 µg L−1) was observed in the wet season. Iraqi soil is generally rich in silica and it is not a limiting factor for the growth of algae [15]. SiO3−2 concentration showed high temporal and spatial variation. The lowest values during the dry season may be linked to the uptake by diatoms that consume an extensive amount of reactive silicate in building their cell walls [27].
TP for the three sites ranged from 0.10 µg/L in the wet season to 0.17 in the dry season. TN was lowest (1.02 µg/L) in the dry season and highest (3.80 µg/L) in the wet season. Molar N:P ratios varied between the wet and dry seasons. This was because of the higher TP concentration during the dry than the wet season and, in contrast, the higher TN during the wet as opposed to the dry season. In similar marshes, both TP and TN concentrations increase in the dry summer season [26]. In the Auda marsh, the molar N:P ratio was 2.7 in the dry season. In the wet season, the ratio was 7, both values being lower than the Redfield N:P ratio [28] found for marine phytoplankton. Previously, the N:P ratio was 16.7 for a never-dried natural area of marsh in other Iraqi marshes [19]. In dried Iraqi marshes, the ratio seems to be mostly lower than the Redfield ratio [18,29,30]. This and previous results show highly variable N and P concentrations, and their ratio in Iraqi marshes indicating a remarkable release of nutrients to marshes.
CCA analysis indicated that primary productivity was related to BOD5, turbidity, temperature, and Chl-a positively and to TN, silicate, and DO negatively (Figure 3). It seems that temperature was the most important physicochemical factor explaining primary productivity. Temperature is an essential factor that affects most biological activities such as metabolic activity, feeding, breeding, and respiration [31]. The appropriate temperature for phytoplankton growth is between 10 °C and 35 °C [32], meaning that temperature was not limiting productivity in general. Another variable describing phytoplankton biomass, Chl-a [33,34], seemed to be a good indicator. The loading of Chl-a in CCA (loading on the x-axis was 0.76) was high, in the same direction as temperature and the opposite direction to DO (Figure 3). DO is conversely related to temperature as shown by the CCA ordination and with a strong negative correlation (r = −0.82) (Table 3). CCA indicates that the nutrients TN, TP, or silica seemed not to explain primary productivity or Chl-a to a large extent. Primary productivity was weakly correlated to both TP and TN, as indicated by CCA (r < 0.5). This coincides with published data [35] from southern Iraqi marshes. In other Iraqi marshes, the relation of TP and Chl-a has been reported to be stronger than that for TN and Chl-a [36]. This also was the case for our results; Chl-a correlated with TP moderately well (r = 0.5), whereas the correlation with TN was weak (r < 0.5) (Table 3). As such, our interpretation is that temperature represents the most important controlling factor of phytoplankton in the Auda marsh. In contrast, nutrients were not limiting factors and thus of lower importance in explaining phytoplankton productivity. This is a remarkable observation from a climate change point of view.
The bio-optical modeling showed that primary productivity was higher in the dry season than the wet season, and highest (dark green areas) in the intermediate season (Figure 4). Flooded areas do not show productivity on the map because the NIR are absorbed by the deeper waters and they appear as white. A high level of surface productivity was observed, mainly in agricultural areas. The high level for the metric within this area is 0.457 at this date and it appears within the remaining shallow wetter areas of the marshland west of the S3 sampling location.
Similar to primary productivity, Chl-a showed higher values in the dry season than in the wet season (Figure 5). Chl-a metric (KIVU metric) shows the 6 January 2018 KIVA Chl-a metric (Figure 5A). Higher levels of Chl-a are found around wet or inundated areas as well as on productive agricultural lands. The Chl-a metric data for 17 July 2018 show higher levels in the S3 sampling site (Figure 5B). The bio-optical modeling figures altogether indicate that the Auda marsh was more productive during the dry season compared to the wet season, which supports field observations and other reports [37,38,39].
The seasonal variation of all variables except BOD5 was high (Table 2, Figure 4 and Figure 5) indicating that the season regulated the physicochemical and biological properties in the marshes. High phytoplankton biomass and productivity during the dry season can be explained by the low water table level and high residence time of water because the organisms making up the phytoplankton spend less time in the photic zone [40]. Other important factors influencing primary production are light and pH. In addition, biotic factors such as competition affect the competition dynamics of the phytoplankton community [41]. The high population density of organisms results in self-shading that declines photosynthesis capacity per unit population [42].
Raising temperature has been predicted to change the community composition and biomass of phytoplankton in different areas around the world. Changes in phytoplankton communities have been observed in different climates from cold to tropical [43,44,45]. The most important controlling factors are temperature and nutrients, as well as their complex interactions with other environmental variables such as increasing salinity and rising temperature [46]. In our study area in the Auda marsh, in a hot climate, temperature was the most important controlling factor of the phytoplankton community. However, the main driving factor may be the change in water regime due to temperature, as observed in a lake in China [47]. Water residence time was reported as the most important controlling factor of phytoplankton biomass in a California estuary and the Gulf of Mexico [13,40]. The effect of desiccation was observed previously in Iraqi marshes [19]. High temperature has been reported not only to change the community structure, but also to increase the biomass of phytoplankton in different ecosystems [48] and can be expected to also increase in the Auda marsh in the case of rising temperature.

4. Conclusions

The phytoplankton community in the Auda marsh, which was classified as mesotrophic, was found to be greatly influenced by water temperature. Winter and summer, i.e., the wet and dry seasons, differed remarkably, and the temperature appeared to be the most important regulating factor of Chl-a concentration. Nutrients, in contrast, seemed not to be limiting factors and thus of lower importance in explaining phytoplankton productivity in the Auda marsh. Temperature regulates the hydrological regime, which has several consequences to the marsh ecosystem and its receiving water body, the Arabian Gulf. Therefore, considering the effects of global warming on marshes is a crucial issue.

Author Contributions

Analysis, writing and revising, F.A.; data analysis, A.I.A.; supervising, F.M.H.; editing; revising, S.L.S.; writing and revising, A.A.Z.D. All authors contributed to data analysis, drafting, or revising the manuscript. All authors have read and agreed to the published version of the manuscript.

Funding

This research was funded by Researchers Supporting Project number (RSP-2021/364), King Saud University, Riyadh, Saudi Arabia.

Institutional Review Board Statement

Not applicable.

Informed Consent Statement

All authors have approved the final version of manuscript and have given their consent for publication.

Data Availability Statement

All data related to this manuscript is incorporated in the manuscript only.

Conflicts of Interest

The authors declare no conflict of interest.

References

  1. Erwin, K.L. Wetlands and global climate change: The role of wetland restoration in a changing world. Wetl. Ecol. Manag. 2009, 17, 71–84. [Google Scholar] [CrossRef]
  2. Kobayashi, Y.; Ralph, T.J. Gross primary productivity of phytoplankton and planktonic respiration in inland floodplain wetlands of southeast Australia: Habitat-dependent patterns and regulating processes. Ecol. Res. 2013, 28, 833–843. [Google Scholar] [CrossRef]
  3. Rojo, C.; Mercedes, M. Sustained primary production with changing phytoplankton assemblages in a semiarid wetland. Hydrobiologia 2010, 639, 55–62. [Google Scholar] [CrossRef]
  4. Mitsch, W.; Gosselink, J. Wetlands 2015. Available online: https://www.wiley.com/en-am/Wetlands%2C+5th+Edition-p-9781118676820 (accessed on 22 July 2021).
  5. Mitsch, W.J.; Gosselink, J.G.; Zhang, L.; Anderson, C.J. Wetland Ecosystems; John Wiley & Sons: Hoboken, NY, USA, 2009. [Google Scholar]
  6. Al-Zaidy, K.J.L.; Parisi, G.; Ali Abed, S.; Salim, M.A. Classification of the Key Functional Diversity of the Marshes of Southern Iraq Marshes. In Journal of Physics: Conference Series; IOP Publishing: Bristol, UK, 2019; Volume 1294, p. 072021. [Google Scholar] [CrossRef]
  7. Rodríguez, P.; Vera, M.S.; Pizarro, H. Primary production of phytoplankton and periphyton in two humic lakes of a South American wetland. Limnology 2012, 13, 281–287. [Google Scholar] [CrossRef]
  8. Waltham, N.J.; Alcott, C.; Barbeau, M.A.; Cebrian, J.; Connolly, R.M.; Deegan, L.A.; Dodds, K.; Gaines, L.A.G.; Gilby, B.L.; Henderson, C.J.; et al. Tidal marsh restoration optimism in a changing climate and urbanizing seascape. Estuaries Coasts 2021, 44, 1681–1690. [Google Scholar] [CrossRef]
  9. Burford, M.A.; Webster, I.T.; Revill, A.T.; Kenyon, R.A.; Whittle, M.; Curwen, G. Controls on phytoplankton productivity in a Wet–Dry tropical estuary. Estuar. Coast. Shelf Sci. 2012, 113, 141–151. [Google Scholar] [CrossRef] [Green Version]
  10. Molinari, B.; Stewart-Koster, B.; Malthus, T.J.; Bunn, S.E. Assessing Spatial Variation in Algal Productivity in a Tropical River Floodplain Using Satellite Remote Sensing. Remote Sens. 2021, 13, 1710. [Google Scholar] [CrossRef]
  11. Zefrehei, A.R.P.; Hedayati, A.; Pourmanafi, S.; Kashkooli, O.B.; Ghorbani, R. Monitoring spatiotemporal variability of water quality parameters Using Landsat imagery in Choghakhor International Wetland during the last 32 years. In Annales de Limnologie-International Journal of Limnology; EDP Sciences: Les Ulis, France, 2020; Volume 56, p. 6. [Google Scholar] [CrossRef]
  12. Vargas-Lopez, I.A.; Rivera-Monroy, V.H.; Day, J.W.; Whitbeck, J.; Maiti, K.; Madden, C.J.; Trasviña-Castro, A. Assessing chlorophyll a spatiotemporal patterns combining in situ continuous fluorometry measurements and Landsat 8/OLI data across the Barataria Basin (Louisiana, USA). Water 2021, 13, 512. [Google Scholar] [CrossRef]
  13. Stumpner, E.B.; Bergamaschi, B.A.; Kraus, T.E.C.; Parker, A.E.; Wilkerson, F.P.; Downing, B.D.; Dugdale, R.C.; Murrell, M.C.; Carpenter, K.D.; Orlando, J.L.; et al. Spatial variability of phytoplankton in a shallow tidal freshwater system reveals complex controls on abundance and community structure. Sci. Total Environ. 2020, 700, 134392. [Google Scholar] [CrossRef]
  14. Richardson, C.J.; Hussain, N.A. Restoring the Garden of Eden: An ecological assessment of the marshes of Iraq. AIBS Bull. 2006, 56, 477–489. [Google Scholar] [CrossRef]
  15. Hussain, N.A. Biotopes of the Iraqi Marshes; Dhifaf Publishing House: Basra, Iraq, 2014. [Google Scholar]
  16. Douabul, A.A.Z.; AlMaarofi, S.S. Restoring the Garden of Eden: Negative WSD; ACADEMIA: San Francisco, CA, USA, 2014. [Google Scholar]
  17. Colombano, D.D.; Litvin, S.Y.; Ziegler, S.L.; Alford, S.B.; Baker, R.; Barbeau, M.A.; Cebrián, J.; Connolly, R.M.; Currin, C.A.; Deegan, L.A.; et al. Climate change implications for tidal marshes and food web linkages to estuarine and coastal nekton. Estuaries Coasts 2021, 44, 1–12. [Google Scholar] [CrossRef]
  18. Almaarofi, S.S.; Douabul, A. Restoration Assessment: I-Phosphorus and Nitrogen dynamics versus phytoplankton biomass in Al-Hawizeh marshland, Iraq. Int. J. Manag. Sci. Bus. Res. 2013, 2, 31–42. [Google Scholar]
  19. Ameen, F.; AlMaarofi, S.; Talib, A.; Almansob, A.; Al-Homaidan, A.A. Phytoplankton diversity recovers slowly and cyanobacterial abundance remains high after the reflooding of drained marshes. Hydrobiologia 2019, 843, 79–92. [Google Scholar] [CrossRef]
  20. Stainton, M.; Capel, M.J.; Armstrong, F.A.J. Chemical Analysis of Fresh Water. 1977. Available online: https://waves-vagues.dfo-mpo.gc.ca/Library/110147.pdf (accessed on 22 July 2021).
  21. Karadzic, V.; Simic, G.S.; Natic, D.; Rzanicanin, A.; Iric, M.; Gacic, Z. Changes in the phytoplankton community and dominance of Cylindrospermopsis raciborskii (Wolosz.) Subba Raju in a temperate lowland river (Ponjavica, Serbia). Hydrobiologia 2013, 711, 43–60. [Google Scholar] [CrossRef]
  22. Selvaraj, G.S.D. Estimation of primary productivity (modified light and dark bottle oxygen method). CMFRI Spec. Publ. Mangrove Ecosyst. Man. Assess. Biodivers. 2005, 83, 199–200. [Google Scholar]
  23. Brivio, P.A.; Giardino, C.; Zilioli, E. Determination of chlorophyll concentration changes in Lake Garda using an image-based radiative transfer code for Landsat TM images. Int. J. Remote Sens. 2001, 22, 487–502. [Google Scholar] [CrossRef]
  24. Al-thahaibawi, B.M.H. Study of Ecological Characteristics and Biodiversity of Al-Auda Marsh in Maysan Province. Master’s Thesis, University of Baghdad, Baghdad, Iraq, 2014. [Google Scholar]
  25. Al-Mosewi, T.J.K. Water Quality of Al-Hammar Marsh South Iraq. J. Eng. 2009, 15, 3999–4008. [Google Scholar]
  26. Tahir, M.A.; Risen, A.K.; Hussain, N.A. Monthly variations in the physical and chemical properties of the restored southern Iraqi marshes. Marsh Bull. 2008, 3, 81–94. [Google Scholar]
  27. Allo, H.G.I. A Study of the Epipelic Algae in Abu-Zirig Marsh Southern Iraq. Master’s Thesis, University of Baghdad, Baghdad, Iraq, 2006. [Google Scholar]
  28. Centre of Restoration of the Iraq Marshland (CRIM). Report Shows Spaces Ratio Flooded Areas of the Iraqi Marshes; CRIM: Basrah, Iraq, 2012. [Google Scholar]
  29. Krah, M.; McCarthy, T.S.; Huntsman-Mapila, P.; Wolski, P.; Annegarn, H.; Sethebe, K. Nutrient budget in the seasonal wetland of the Okavango Delta, Botswana. Wetl. Ecol. Manag. 2006, 14, 253–267. [Google Scholar] [CrossRef]
  30. Al-Imarah, F.J.M.; Al-Shawi, I.J.M.; Issa, A.M.; Al-Badran, M. Seasonal variation for levels of nutrients in water from Southern Iraqi Marshlands after Rehabilitation 2003. Marsh Bull. 2006, 1, 82–91. [Google Scholar]
  31. Hoosier, R. Volunteer Stream Monitoring Training Manual. Indiana’s Volunteer Stream Monitoring Program; Natural Resources Education Center: Indianapolis, IN, USA, 2000; Available online: https://www3.nd.edu/~aseriann/Riverwatch_Monitoring_Manual.pdf (accessed on 22 July 2021).
  32. Al-Mayah, A.A.; Al-Hilli, M.R.; Hassan, F.M. Marsh flora of southern Iraq before desiccation. Univ. Basrah. Mar. Sci. Cent. Publ. B 2014, 195, 252–386. [Google Scholar]
  33. Felip, M.; Catalan, J. The relationship between phytoplankton biovolume and chlorophyll in a deep oligotrophic lake: Decoupling in their spatial and temporal maxima. J. Plankton Res. 2000, 22, 91–106. [Google Scholar] [CrossRef]
  34. Lau, S.S.S.; Lane, S.N. Biological and chemical factors influencing shallow lake eutrophication: A long-term study. Sci. Total Environ. 2002, 288, 167–181. [Google Scholar] [CrossRef]
  35. Hassan, F.M.; Talib, A.H.; Taylor, W.D.; Abdulah, D.S. Phytoplankton primary production in southern Iraqi marshes after restoration. Baghdad Sci. J. 2010, 8, 519–527. [Google Scholar]
  36. Mahamed, S. Phosphorus and Nitrogen in the Al-Hawizeh Marshes, Southern Iraq. 2008. Available online: https://uwspace.uwaterloo.ca/handle/10012/3880 (accessed on 22 July 2021).
  37. Frantzich, J.; Sommer, T.; Schreier, B. Physical and biological responses to flow in a tidal freshwater slough complex. San Franc. Estuary Watershed Sci. 2018, 16. [Google Scholar] [CrossRef] [Green Version]
  38. Al Azad, S.; Jinau, V.J. Spatial Distribution of Dissolved Inorganic Nutrients and Phytoplankton around Kota Kinabalu Wetland, Sabah, Malaysia. Adv. Biol. Chem. 2020, 10, 113–126. [Google Scholar] [CrossRef]
  39. Zainol, Z.; Akhir, M.F.; Abdullah, S. Hydrodynamics, nutrient concentrations, and phytoplankton biomass in a shallow and restricted coastal lagoon under different tidal and monsoonal environmental drivers. Reg. Stud. Mar. Sci. 2020, 38, 101376. [Google Scholar] [CrossRef]
  40. Roelke, D.L.; Li, H.-P.; Hayden, N.J.; Miller, C.J.; Davis, S.E.; Quigg, A.; Buyukates, Y. Co-occurring and opposing freshwater inflow effects on phytoplankton biomass, productivity and community composition of Galveston Bay, USA. Mar. Ecol. Prog. Ser. 2013, 477, 61–76. [Google Scholar] [CrossRef] [Green Version]
  41. Cardoso, S.J.; Roland, F.; Loverde-Oliveira, S.M.; de Moraes Huszar, V.L. Phytoplankton abundance, biomass and diversity within and between Pantanal wetland habitats. Limnologica 2012, 42, 235–241. [Google Scholar] [CrossRef]
  42. Aardema, H.M.; Rijkeboer, M.; Lefebvre, A.; Veen, A.; Kromkamp, J.C. High resolution in situ measurements of phytoplankton photosynthesis and abundance in the Dutch North Sea. Ocean Sci. Discuss. 2018, 15, 1267–1285. [Google Scholar] [CrossRef]
  43. Jiang, Z.; Du, P.; Liu, J.; Chen, Y.; Zhu, Y.; Shou, L.; Zeng, J.; Chen, J. Phytoplankton biomass and size structure in Xiangshan Bay, China: Current state and historical comparison under accelerated eutrophication and warming. Mar. Pollut. Bull. 2019, 142, 119–128. [Google Scholar] [CrossRef]
  44. Vernet, M.; Richardson, T.L.; Metfies, K.; Nöthig, E.-M.; Peeken, I. Models of plankton community changes during a warm water anomaly in arctic waters show altered trophic pathways with minimal changes in carbon export. Front. Mar. Sci. 2017, 4, 160. [Google Scholar] [CrossRef] [Green Version]
  45. Villafane, V.E.; Valiñas, M.S.; Cabrerizo, M.J.; Helbling, E.W. Physio-ecological responses of Patagonian coastal marine phytoplankton in a scenario of global change: Role of acidification, nutrients and solar UVR. Mar. Chem. 2015, 177, 411–420. [Google Scholar] [CrossRef]
  46. Masmoudi, S.; Tastard, E.; Guermazi, W.; Caruso, A.; Morant-Manceau, A.; Ayadi, H. Salinity gradient and nutrients as major structuring factors of the phytoplankton communities in salt marshes. Aquat. Ecol. 2015, 49, 1–19. [Google Scholar] [CrossRef]
  47. Mu, S.; Li, B.; Yao, J.; Yang, G.; Wan, R.; Xu, X. Monitoring the spatio-temporal dynamics of the wetland vegetation in Poyang Lake by Landsat and MODIS observations. Sci. Total Environ. 2020, 725, 138096. [Google Scholar] [CrossRef] [PubMed]
  48. Gao, G.; Jin, P.; Liu, N.; Li, F.; Tong, S.; Hutchins, D.A.; Gao, K. The acclimation process of phytoplankton biomass, carbon fixation and respiration to the combined effects of elevated temperature and pCO2 in the northern South China Sea. Mar. Pollut. Bull. 2017, 118, 213–220. [Google Scholar] [CrossRef] [PubMed]
Figure 1. Map of Iraqi marshes and the satellite image of the general study area (Landsat 8) and the specific study sites (S1, S2, S3).
Jmse 09 00811 g001
Figure 2. Distribution of the different phyla of microalgae and diatoms.
Jmse 09 00811 g002
Figure 3. Canonical Corresponding Analysis (CCA) of the physico-chemical and biological variables measured or determined at the sampling sites in the Auda marsh (n = 39).
Jmse 09 00811 g003
Figure 4. Image of surface productivity metric (NDVI metric) for wet (A), dry (B), and intermediate (C) seasons.
Jmse 09 00811 g004
Figure 5. Image of chlorophyll-a metric (KIVU metric) for wet (A), dry (B) and intermediate (C) seasons.
Jmse 09 00811 g005
Table 1. Characteristics of the three study sites in the Auda marsh.
SiteDepthDitchingVegetation
S13.3 mChannels 5–15 m width, represent permanent part of the marshLow cover
S22.7 mOne main channel 35 m width, moderate open areaHigh cover dominated by Phragmites australis
S31.5 mLarge open areaVegetation consists of Phragmites australis,
Typha domingensis and the free-floating plant Ceratophyllum demersum
Table 2. Physico-chemical and biological variables in the Auda marsh (mean of the three sites S1, S2 and S3 ± SD) during the wet (January) and dry (July) seasons. The season with the higher value is indicated in bold. PP = primary productivity.
WetDry
Temperature (°C)15.9 ± 0.528.1 ± 0.6
Turbidity (NTU)26.0 ± 5.148.4 ± 15.3
DO (mg L−1)7.6 ± 0.34.5 ± 0.5
BOD5 (mg L−1)2.1 ± 0.11.8 ± 0.2
Si (µg L−1)26.8 ± 3.119.3 ± 3.5
TP (µg L−1)0.10 ± 0.010.17 ± 0.01
TN (µg L−1)1.5 ± 1.51.0 ± 0.5
PP (mg C m−3 h−1)125 ± 15176 ± 13
Chl-a (µg L−1)4.7 ± 1.99.8 ± 1.5
Table 3. Pearson’s correlation coefficients (r > 0.5; p < 0.05; n = 39) between the physico-chemical and biological variables recorded in the Auda marsh. The highest correlation coefficient for each variable is in bold. PP = primary productivity.
TemperatureTurbidityDOBOD5SiO3−2TPTNPP
Temperature1
Turbidity0.841
DO−0.82−0.711
BOD5 1
SiO3−2−0.68−0.710.65 1
TP0.550.63−0.62 1
TN 1
PP 1
Chl-a0.640.71−0.80−0.23−0.520.51 0.68
Publisher’s Note: MDPI stays neutral with regard to jurisdictional claims in published maps and institutional affiliations.

