Article

Response to Environmental Factors of Spawning Ground in the Pearl River Estuary, China

1
South China Sea Fisheries Research Institute, Chinese Academy of Fishery Sciences, Guangzhou 510300, China
2
College of Marine Science, Shanghai Ocean University, Shanghai 201306, China
3
Guangdong Provincial Key Laboratory of Fishery Ecology and Environment, Guangzhou 510300, China
4
Department of Optoelectronic Engineering, Jinan University, Guangzhou 510632, China
*
Author to whom correspondence should be addressed.
Dongliang Wang and Lijun Yao contributed equally to this work.
J. Mar. Sci. Eng. 2021, 9(7), 763; https://doi.org/10.3390/jmse9070763
Submission received: 31 May 2021 / Revised: 6 July 2021 / Accepted: 7 July 2021 / Published: 12 July 2021
(This article belongs to the Section Marine Biology)

Abstract

:
Spawning grounds are important areas for fish survival and reproduction, and play a key role in the supplement of fishery resources. This study investigated environmental effects on the spatiotemporal variability of spawning ground in the Pearl River Estuary (PRE), China, using the generalized additive model (GAM), based on satellite remote sensing (sea surface temperature (SST), chlorophyll-a concentration (Chl-a), sea surface salinity (SSS), depth), and in situ observations. Results showed that 39.8% of the total variation in fish egg density was explained by these factors. Among them, the most important factor was SST, accounting for 14.3%, followed by Depth, SSS, and Chl-a, with contributions of 9.7%, 8.5%, and 7.3%, respectively. Spawning grounds in the PRE were mainly distributed in the waters with SST of 22 °C, depth of 30–50 m, SSS of 16–35 ‰, and Chl-a of 6–15 mg/m3. From spring to summer, the spawning ground moved from the outlet of the PRE to the east. The distribution of the spawning ground in the PRE was mainly affected by the Pearl River Plume (PRP), Guangdong Coastal Current (GCC), and monsoons in this area.

1. Introduction

Spawning grounds are the areas where fish, shrimps, and shellfish mate, spawn, hatch, and breed, and are critical for the survival and reproduction of aquatic animals [1]. Fish eggs, as an important biological group, are the foundation for the replenishment of fishery resources and sustainable utilization of fishery resources [2]. Therefore, it is of great significance to understand the distribution of fish eggs for maintaining the balance of marine ecosystems [3]. As a critical and vulnerable period in the life cycle of fish populations, the distribution of fish eggs is influenced not only by the spawning behavior of fish (including spawning locations, timing, etc.) and ocean dynamics phenomena (currents, eddies, upwelling and stratification of the water column, etc.) [4,5,6,7,8], but also by water temperature, salinity, water depth, and topography [9,10,11]. Studies have shown that the timing of spawning population emergence in fish distributed in the English Channel was related to water temperature. In warmer years, the spawning season of the summer spawning population came earlier; while in colder years, the spawning season of the winter spawning population came earlier [11]. The distribution of Lutjanus campechanus in the East Seto Inland Sea was related to the substrate, water depth, and temperature, and the sandy substrate area was more suitable for spawning [12]. The distribution of fish eggs in the Mediterranean Sea was related to depth, wind direction, coastal eddies current direction, and topographic features of the coastline, and the nearshore ecosystem of the rocky coasts resulted in the accumulation of eggs [5,7,13]. The Baltic Sea had a strong thermocline and oxycline, and its central highly stratified basin was often used as a spawning ground for herring [10]. Moreover, its topographic features combined with hydrological conditions acted as a barrier, limiting the transport of cod eggs between the basins in the Central Baltic Sea [14]. In Yellow and Bohai Sea of China, the distribution of fish eggs was affected by temperature, salinity, and transparency, while the currents had a significant impact on them, and eggs often gathered in small eddies [15,16,17]. In the East China Sea, the spatiotemporal variability of the thermohaline front and the biological properties of fish were major factors affecting the distribution of fish eggs and the formation of spawning grounds [3]. In the western Guangdong waters, the spatiotemporal distribution of spawning grounds was influenced by the western Guangdong current, cyclonic circulation, and warm current in the South China Sea, and fish usually spawn in the areas with high seabed slope and steep topography (near Qiongzhou Strait) [18]. The number of fish eggs in the Pearl River Estuary (PRE) in spring was influenced by water temperature, pH, and dissolved oxygen [19]. These studies showed that the distribution of fish eggs was sensitive to environmental conditions, and that different geographical conditions and fish species produced unique spawning preferences and egg distribution. However, the extent to which the seafloor topography and marine environmental factors affect the distribution of fish eggs in the Pearl River Estuary is still unclear. Exploring the quantitative relationship between egg density and marine environmental factors will help to understand the mechanism of spawning ground formation and fishery resource replenishment in the area.
The relationship between fisheries resources and the marine environment is complex, non-linear, and non-additive [20]. The choice of method is important in the quantitative analysis of the relationship between fish egg density and the marine environment [18]. Generalized additive models (GAMs) could demonstrate non-linear relationships between dependent variables and multiple independent variables [21]. Therefore, this analysis was used to explore the relationship between the spatiotemporal distribution of marine organisms and environments [7,18,22], and to predict the location of spawning grounds [23].
The PRE is a typical subtropical highly productive estuary. Influenced by the Pearl River runoff, Guangdong coastal currents, and the invasion of high salinity seawater from the outer sea, it is rich in marine organisms, and is an important place for spawning, baiting, breeding and migration of many kinds of economic fish and shrimps [24,25]. In recent years, due to overfishing, industrial and agricultural development, and engineering construction, the traditional spawning grounds in the PRE have disappeared and fishery resources have been depleted [26,27]. Therefore, it is scientifically important to clarify the spatiotemporal variability of spawning grounds under intensified human activities and their response to the marine environment. Based on satellite remote sensing and in situ observations, their response to environmental factors in the PRE was analyzed, using general additive models (GAMs). The results of this study provide a reference for understanding the early replenishment mechanism of fishery resources, the protection of fish habitats, and the sustainable development of offshore fishery resources in the PRE.

2. Materials and Methods

2.1. Fish Egg Data

The data of fish eggs were obtained from spawning ground surveys from 2014–2017 (April–July) (Table 1). The study area is located at 112–116° E, 20–23° N (Figure 1). The plankton nets (shallow water type I) were used in the waters less than 30 m, and macroplankton nets were used in the waters more than 30 m. The trawling depth from the bottom to the surface and different water layers were not sampled separately. In the area of water depth less than 50 m, sampling every 3 h, samplings were performed a total of 9 times; in the area of water depth greater than 50 m, sampling every 4 h, samplings were performed a total of 7 times. During the trawling, the wire rope inclination angle was less than 45°. Fish egg samples were preserved in 5% formaldehyde solution and taken back to the laboratory for identification and counting. Fish eggs were identified and classified based on their morphological characteristics [28,29]. The major species of eggs in this study were Carangidae, Trichiurus haumela, Thunnidae, Sardinella aurita, and Stolephorus commersoni. The egg data were grouped by 0.5 × 0.5° grid cells, and the formula for calculating the density of individual fish eggs is as follows.
C = N V
where C is the fish-egg density, in ind/(10m)3. N is the number of fish eggs, in ind. V is the volume of filtered water, in (10m)3.

2.2. Environmental Data

Satellite data include sea surface temperature (SST), sea surface salinity (SSS), sea surface chlorophyll a concentration (Chl-a), water depth (Depth), and currents (Current) (Table 2). SST and Chl-a data are from MODIS Aqua products, acquired from April 2014 to July 2017 (http://oceancolor.gsfc.nasa.gov). SSS and Current data come from the Global Ocean Physical Reanalysis Product of Copernicus Marine Environment Management Service (CMEMS), acquired from April 2014 to July 2017 (http://marine.copernicus.eu/). Depth data come from Google Earth elevation data with an elevation class of 18. Water depth and stations are one-by-one correspondence. R v.4.0.0 (R Development Core Team, 2020) [30] software was applied to remove invalid values, month-by-month averaging, and data fusion for SST, SSS, and Chl-a. The same month, the same grid of fish egg data, and environmental data are matched together for subsequent statistical analysis. ArcGIS 10.3 (Esri, Redlands, CA, USA) was used to map the spatial distribution of environmental factors and fish eggs [31,32,33].

2.3. GAM

The generalized additive model (GAM) is a nonparametric extension of the generalized linear model (GLM), which can explain the nonlinear relationship between the dependent variable and multiple independent variables [21]. The basic GAM is as follows:
log ( Y + 1 ) = s ( S S T ) + s ( S S S ) + s ( C h l - a ) + s ( D e p t h ) + ε
where Y is the egg density, and log transformation is performed for Y + 1 to incorporate zero values in the response variable; s(x) is spline-smoothing function of covariate x; SST is the sea surface temperature; SSS is the sea surface salinity; Chl-a is the chlorophyll-a concentration; Depth is the water depth; and ε is the modelling error. In the rug plots of GAMs, the x-axis indicates the relative density of data points. As the y-axis scale is relative, the mean effect of each predictor on the response variable is indicated by a y-value of zero, with positive values indicating a positive effect and negative values indicating a negative effect. The “mgcv” package in software R v.4.0.0 was used to construct and test the GAM model [34].

2.4. Model Testing

Akaike information criterion (AIC) was used to test the fit of the model after adding the influence factors. The smaller is the AIC, the better is the fit [35]. Generalized cross validation (GCV) was applied to evaluate predictor variables. The smaller the GCV value is, the stronger the generalization is [36,37]. A stepwise method was applied to test the influencing effects of selecting factors including SST, SSS, Chl-a, and Depth. The influencing factors were added sequentially to the model to select the best model according to the reduction of GCV and AIC values [37]. The significance of these influencing factors was assessed by F-test and chi-square test [38,39,40].
The calculation formula for the AIC value is as follows:
AIC = θ   +   2 d f φ
where θ is the deviation, d f is the degree of freedom, and φ is the variance.

3. Results

3.1. GAMs Analysis

In GAMs, the contribution of each selected factor to the egg density indicates the degree of influence of each factor on the egg density (Table 3). Among them, SST was the most influential factor affecting egg density, with a contribution of 14.3%, followed by Depth, SSS, and Chl-a, with contributions of 9.7%, 8.5%, and 7.3%, respectively. The chi-square test and F-test showed that all factors selected in the model were significantly correlated with egg density (p < 0.001; Table 3).
GAM analysis of the effects of environmental and spatial factors on fish egg density in the PRE is shown in Figure 2. In the ranges of 22–24 °C and 29–30 °C, egg density decreased with increasing SST with narrow confidence intervals and high confidence levels. In the range of 24–29 °C, egg density was stable with increasing SST with narrow confidence intervals and high confidence levels (Figure 2a). The contribution of Depth to egg density in GAMs was 9.7%. When Depth was in the range of 0–50 m, the egg density increased with increasing Depth, with a narrow confidence interval and high confidence level. While in the range of 50–280 m, the egg density decreased with increasing Depth, the confidence interval increased, and the confidence level decreased (Figure 2b). When SSS was in the range of 10–17‰, the egg density increased with the increasing SSS, with a wide confidence interval and low confidence level. While in the range of 17–35‰, the egg density fluctuated with the increase of SSS, with a narrow confidence interval and high confidence level (Figure 2c). In the range of 1–10 mg/m3, the egg density increased with increasing Chl-a, the confidence interval increased with increasing Chl-a, and the confidence level decreased (Figure 2d).
The cumulative explained deviations of spatiotemporal and environmental factors on fish egg density were obtained using GAMs to fit and predict the effects of the added variables on the model (Table 4). The influencing factors selected based on AIC and GCV values included SST, SSS, Chl-a, and Depth. The cumulative explanatory bias of these factors to fish egg density was 39.8%, with an adjusted R2 of 0.35 (Table 4). According to the model checking plots for GAMs, the distribution of the residuals conforms to a normal distribution. Therefore, the prediction results are relatively satisfactory (Figure 3).

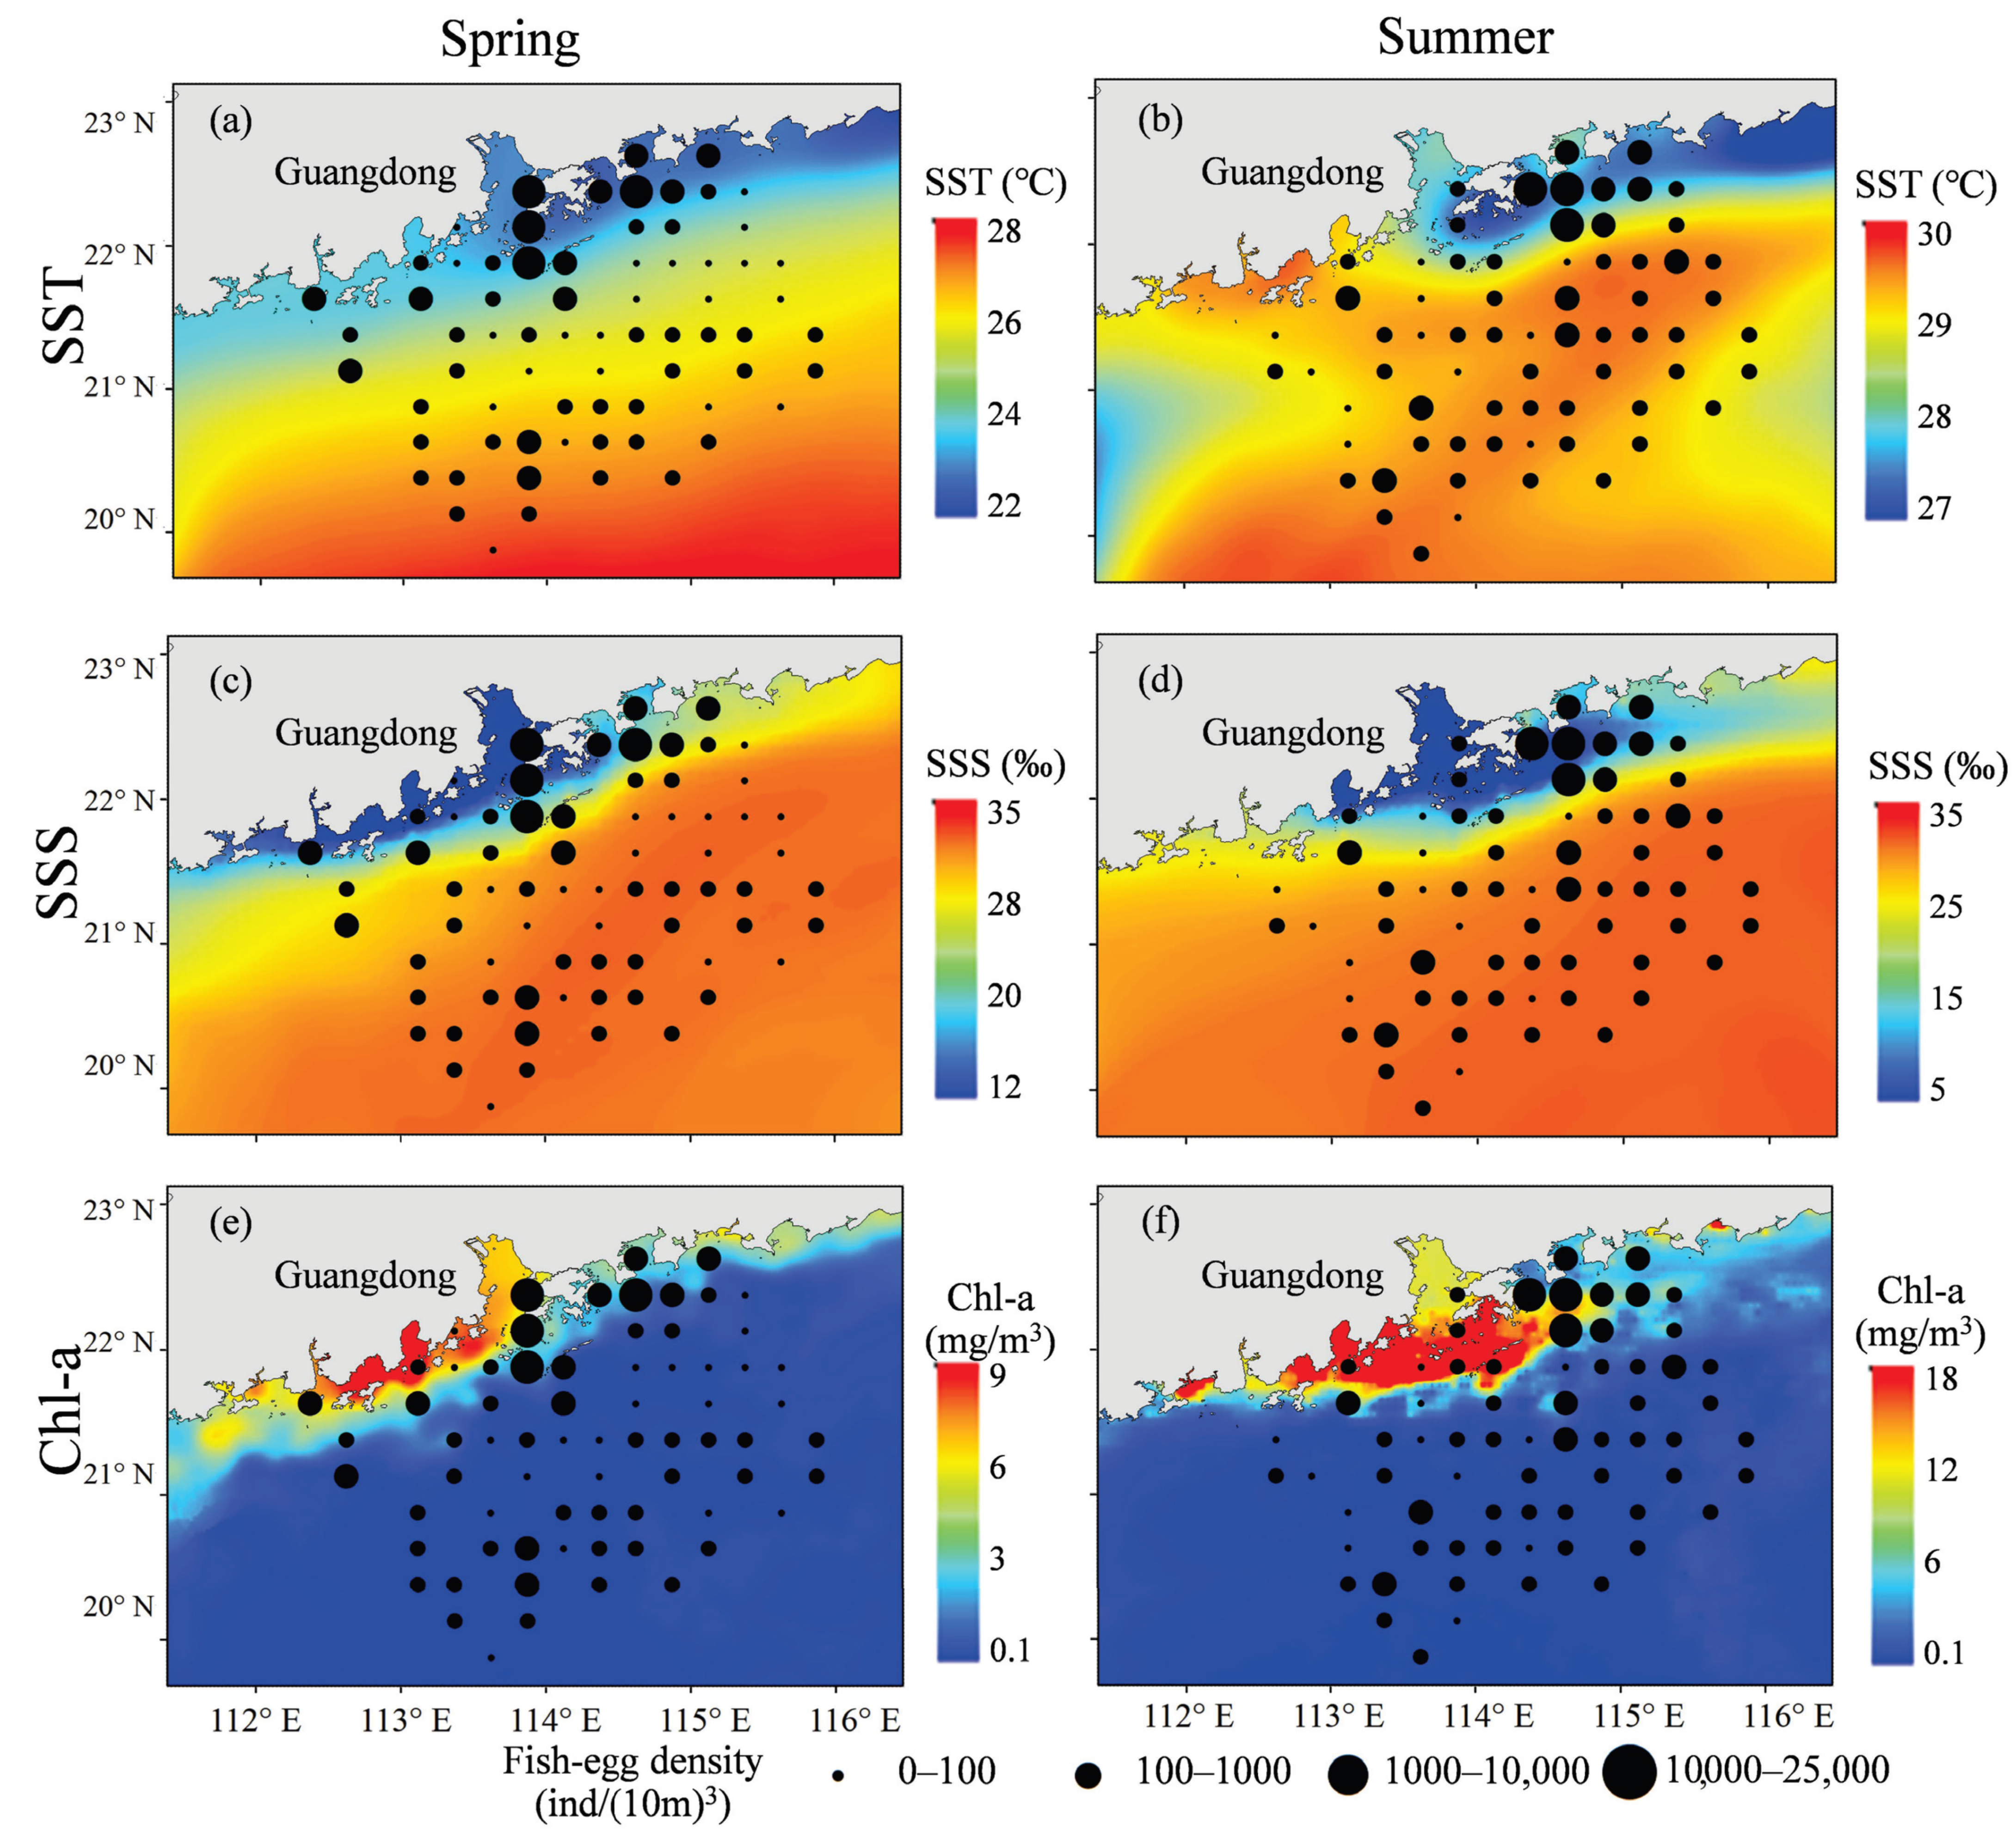
3.2. Spatiotemporal Distribution of Egg Density and SST, SSS, Chl-a

Higher egg density (10,000–25,000 ind/(10m)3) was mainly distributed in the waters of PRE (113.8–114° E, 21.8–22.5° N) in spring. In summer, higher egg densities (10,000–25,000 ind/(10m)3) were mainly distributed in Dapeng Bay and Daya Bay (114.3–115.2° E, 22–22.7° N) (Figure 4). Fish eggs were mainly distributed in the waters with low SST in spring and summer (Figure 4a,b). Among them, high egg density (10,000–25,000 ind/(10m)3) was distributed in waters of SST 22–23 °C in spring and in waters of SST 27–28 °C in summer (Figure 4a,b).
SSS in the PRE was 12–35‰ in spring and 5–35‰ in summer (Figure 4c,d). Waters with low SSS (12–20‰) spread from the PRE to the southwest in spring and to the northeast in summer. High egg density (10,000–25,000 ind/(10m)3) was found in waters with SSS 12–20‰ in spring, and in waters with SSS 5–15‰ in summer.
Chl-a in the PRE was 0.1–9 mg/m3 in spring and 0.1–18 mg/m3 in summer (Figure 4e,f). High egg density (10,000–25,000 ind/(10m)3) was distributed in waters with Chl-a 3–6 mg/m3 in spring and in waters with Chl-a 4–8 mg/m3 in summer.

3.3. Spatiotemporal Distribution of Fish Egg Density and Current

Egg density and flow field superimposed maps were obtained by kriging interpolation in the whole area, based on the egg density data in each station (Figure 5). The Pearl River Plume (PRP) fresh water at the PRE and the coastal area forms an approximate plume current under the joint effects of buoyancy and external forcing [41]. In spring, the direction of the current in coastal waters west of the mouth of PRE is southwestward, while in the offshore waters, the direction of current is northeastward. As a result, a cyclonic vortex formed between the Pearl River runoff and the high salinity seawater off the coast, and the density of fish eggs was higher (4000–8000 ind/(10m)3) (Figure 5a). In addition, in the waters near the PRE, multiple small- and medium-scale eddies formed due to the confluence of salt and freshwater, and the egg density was also higher in these areas (8000–18,000 ind/(10m)3) (Figure 5a). In coastal waters east of the PRE, as the direction of the current is northeastward, the egg density was higher in waters at the mouth of Daya Bay and Dapeng Bay (4000–10,000 ind/(10m)3) (Figure 5a). The egg density was lower in offshore waters (0–1000 ind/(10m)3) than in coastal waters (4000–18,000 ind/(10m)3) (Figure 5a).
In summer, the direction of the current in the PRE was northeastward, and the higher egg density (4000–18,000 ind/(10m)3) was mainly distributed in the waters east of the PRE. Among them, the highest egg density (8000–18,000 ind/(10m)3) was found in Dapeng Bay (Figure 5b). The egg density in the waters west of the PRE was about 0–4000 ind/(10m)3 (Figure 5a).

4. Discussion

4.1. Relationship between Egg Density and SST, SSS, Chl-a, Depth

GAM analysis of the environmental and spatial factors selected in this study on egg density showed that SST was the most important factor affecting egg density, with a contribution of 14.3% (Table 3). Fish eggs, which are in the early stage of fish life history, are sensitive to changes in their habitat. Studies have shown that water temperature plays an important role in fish distribution and spawning [42]. It is an important factor affecting fish maturation and egg development [9], controlling the timing of fish spawning and the number of adults entering the spawning grounds [4,9,43]. Higher water temperatures promote fish gonad development and increase spawning activity [44]. This study showed that eggs of major economic fishes in the PRE were mainly distributed in waters with SST 22–30 °C, and the most suitable SST was 22 °C, followed by 25–28 °C (Figure 2a). Major economic fishes in the PRE are Trichiurus haumela, Trachinidae, Nemipteras virgatus, Pneumatophorus japonicus, etc. [45,46,47]. Among them, the suitable spawning water temperature for Trichiurus haumela is 25–28 °C [45]. The suitable spawning water temperature for Pneumatophorus japonicus is 22–29 °C [46] and is 18.79–25.98 ℃ for Nemipteras virgatus [47], which is basically consistent with the results of this study. In this suitable temperature range, the overall egg density is negatively correlated with water temperature (Figure 2a). For fish eggs with a higher suitable temperature, higher water temperature promotes shorter egg development time, and accelerates the speed of fish egg hatching, which also leads to a decrease in the fish egg density [13,48,49].
In GAMs, SSS contributed 8.5% to the variation in egg density (Table 3). Salinity has long been considered a dominant factor affecting the distribution, survival, and community composition of estuarine fishes [50,51]. Studies have shown that lower or higher salinities can interfere with egg development and the hatching processes, and reduce the survival rate of larvae and juveniles [48,52]. Drastic changes in salinity can cause large-scale changes in the spawning area [53]. In the PRE, the optimum salinity for egg density was 17–35‰, and the egg density decreased when SSS was lower than 17‰ (Figure 2c). The suitable salinity range for spawning grounds of major economic fishes (Pneumatophorus japonicus, Nemipteras virgatus, and Trichiurus haumela) in the PRE is 31–35‰ [45,46,47], which is basically consistent with the results of this study. In addition, salinity also affects the buoyancy of fish eggs, which determines their vertical distribution in the waters. In waters with low salinity, fish eggs tend to accumulate and cannot get enough oxygen, which hinders egg development. In waters with higher salinity, fish eggs can be suspended or float in the water, which facilitates the absorption of oxygen from the surrounding water, and thus, improves the survival rate of fish eggs. Moreover, fish fertilization activity also increases with high salinity, leading to increased egg density [10,54]. In the PRE, there were multiple peaks in egg density in the range of SSS 17–35‰ (Figure 2c). On the one hand, it may be caused by the noise in the model fitting process, which attempted to match fish egg and salinity data from a limited number of records. On the other hand, it may be related to the characteristics of salty and freshwater confluence in the estuary that influence the abundance of eggs. The fishery resources in the area are diverse and complex in composition, forming three ecological groups: semi-saline, inshore, and offshore species [19,55]. Suitable salinity provides spawning grounds for fish with different reproductive habits [24,56].
The contribution of Chl-a to egg density was 8.07% (Table 3). The spawning goal of fish is to provide a favorable foraging and feeding environment for their larvae [6,57]. Spawning grounds usually coincide with bait distribution, which contributes to reproductive success and the increase of population replenishment [9,58]. Chlorophyll concentration reflects the standing stock of phytoplankton in the waters, which is the main feeding source of zooplankton and some marine organisms [59]. This study showed that the egg density generally increased with increasing Chl-a (Figure 2d), which is consistent with preferred conditions for spawning grounds. In addition, the effect of higher chlorophyll a concentration on fish populations usually has a lag effect. In the Gulf of Cadiz, anchovy adults required high chlorophyll a concentrations 3–4 days before the spawning process occurred to increase the food supply of anchovy larvae, so the chlorophyll a concentration with a time lag of 3 days was the environmental variable that best characterizes their spawning grounds [60]. The hysteresis effect was also evident in different stages of other organisms; for example, in the South China Sea, the hysteresis effect of chlorophyll a concentration on protozoa was about 2 months [61]. This phenomenon mainly depends on the trophic level and life stages of different organisms [60,61,62]. However, the egg density increased when Chl-a was less than 1 mg/m3 (Figure 2d). This may be due to the increased transparency of seawater at lower Chl-a, which has a positive impact on the spawning activities of fish [63].
In the PRE, the contribution of Depth to the egg density was 5.1%, and the most suitable depth in the area was 30–50 m (Figure 2b). Water depth affects the spawning activity of fish by influencing the level of dissolved oxygen in the water [64]. Studies have shown that spawning fish populations have a clear preference for different depths [12]. The area of 30–50 m water depth is the most concentrated spawning ground in the PRE, where the major spawning grounds of Trichiurus haumela, Decapterus maruadsi, Pneumatophorus japonicus, Nemipteras virgatus, Upeneus sulphureus, and Priacanthus tayenus are distributed [45,46,47,65], with the highest egg density. Fewer fish spawned in areas with water depths less than 30 m and greater than 100 m [65], and egg densities were lower (Figure 2b). In addition, the egg density in the deep-water area was significantly lower than that in the shallow-water area in the PRE (Figure 5a,b). Studies have shown that eggs of major economic fishes in the western Guangdong waters were usually distributed in shallow waters, forming main spawning grounds [18], which is consistent with the distribution characteristics of spawning grounds in this study area. Coastal habitats are generally considered to provide more suitable conditions for the survival of fish eggs, larvae, and juveniles than other offshore waters [5,66], which may be related to the ability of shallow marine habitats to provide higher water mass stability and more abundant bait biomass. Another possible explanation is that this may be due to its unique recruitment strategy. For example, in Biscay Bay, although in that region the food availability offshore is approximately half that on the shelf, the predatory risk is also lower. Anchovies spawn along the coast, larval advection offshore, juvenile, and then swim to the coast, which is a way of moving that makes them the least vulnerable to predation. This interpretation is based on the possibility of the population exploiting the off the shelf waters for recruitment through a loophole of lower predation [67].

4.2. Spatiotemporal Variation of Fish Eggs

Although the spawning site preferences may be the biggest factor affecting the density distribution of fish eggs, the distribution of fish eggs is also subject to wind fields and currents to some extent because fish eggs are not capable of swimming [5,68]. The current in the PRE is controlled by monsoons, tides, river discharges, coastal currents, and mesoscale eddies [69,70,71]. Of those, the monsoon plays the most important role in the surface shape and extension of the Pearl River Plume [41,69,71]. In spring, the sea level in the PRE is higher than that in the western Guangdong waters, but lower than that in the eastern Guangdong waters. The surface fresh-water discharge mainly diffuses westward [72], forming a sea area with low SSS and high Chl-a in the western PRE (Figure 4c,e). While the fresh-water plume expands outward from the estuary, highly saline water between the estuary is transported to the shore during high tides. In the sea area beyond the front formed by the diffusion of freshwater (roughly bounded by the salinity 33 contour), seawater is driven by the southwest monsoon and flows in a northeastward direction. As a result, the formation of cyclonic eddies is caused by the shear effects of estuarine discharged water, intrusion of highly saline water from the inter-estuarine shelf, and northeastward flow of the shelf [73] (Figure 5a). The formation of such eddies is thought to be a key spawning ground for pelagic fish, as these features increase the feeding opportunities of larvae and juveniles [6]. Analysis based on the currents and egg density distribution showed that higher egg density (about 4000–6000 ind/(10m)3) was in the center of this vortex, and the highest egg density (about 14,000–18,000 ind/(10m)3) was in the central waters of the PRE (Figure 5a). This is partly due to the fact that in this area, the flow field is more complex, forming multiple eddies, which is conducive to the bait organisms. On the other hand, there are many islands here and complex topography are advantageous to the aggregation of fish eggs [18]. In addition, this area is where freshwater and seawater meet, with nutrient-rich waters and abundant bait organisms (Figure 4c,e). These topographic, current and bait conditions are beneficial to the formation of spawning grounds [74,75,76]. In summer, the Pearl River runoff enters the northern South China Sea, forming a freshwater hypersaline tongue near the mouth of the Pearl River, and expanding out to the sea or coast under the action of tides, monsoons, and coastal currents [77]. The surface-flushing freshwater expands in a “symmetrical expansion-like pattern” to both eastern and western Guangdong waters [72]. Under the influence of the southwest monsoon, the runoff from four outlets (Humen, Jiaomen, Hongqili, and Hengmen) and the east mouth of Modaomen in Lingding Bay spread eastward [78], and the area with high egg density also transfers from the mouth of PRE to the eastern Guangdong waters, forming the most suitable spawning ground near the Dapeng Bay (Figure 5b). Studies have shown that spawning in the bay and downstream of the cape is effective in reducing egg loss and maintaining juveniles in the spawning area, and therefore, can be a suitable spawning ground [42,79]. Under the influence of the southwest monsoon, the direction of the coastal current is mainly eastward [78] (Figure 5b), and the fish eggs near the mouth of PRE follow the current to spread eastward as well as southeastward (Figure 5b).
In this study, survey data cover spring and summer, which are major spawning seasons in the PRE. Fishery in the area has characteristics of multi-species fishery resources, and single species have large varieties and small quantities [18,78]. Therefore, fish eggs are analyzed as a whole in this study. Environmental factors such as SSS, SST, and Chl-a available from satellite remote sensing are considered, and other influencing factors including fishing vessel parameters, egg biological characteristics, current fields, wind fields, eddies, water turbidity, and predation, which may improve the accuracy of the model will be considered in a future study.

5. Conclusions

For the first time, the environmental effects of the spatiotemporal distribution of fish eggs were quantified in the PRE. SST was the most important environmental factor affecting fish egg density (contribution of 14.3%), followed by depth, SSS, and Chl-a. The spawning grounds in the PRE are mainly distributed in the waters with SST of 22 °C, water depth of 30–50 m, SSS of 16–35‰, and Chl-a of 4–10 mg/m3. The egg density along the coast is higher than that of the outer sea, and the Pearl River plume is favorable for the aggregation of fish eggs. Major spawning grounds are found in the PRE in spring and in the eastern PRE (Dapeng Bay) in summer. In the next study, a long term survey and analysis on fish eggs will be conducted, and more oceanographic parameters will be considered to clarify the early replenishment mechanism for fishery resources in the PRE.

Author Contributions

L.Y. and D.W. designed the study. J.Y. and L.Y. collected the fishery data. D.W. and P.C. analyzed the data. L.Y. and R.H. helped with data collection and analysis. J.Y. and D.W. wrote the article. All authors have read and agreed to the published version of the manuscript.

Funding

This study was supported by the following funds: (1) R & D Projects in Key Areas of Guangdong Province, China (2020B1111030002), (2) National Key R&D Program of China (2018YFD0900901), (3) Natural Science Foundation of Guangdong Province, China (2018A030313120), (4) Central Public-Interest Scientific Institution Basal Research Fund, CAFS, China (2018HY-ZD0104).

Institutional Review Board Statement

Not applicable.

Informed Consent Statement

Not applicable.

Data Availability Statement

Data available on request due to restrictions. The data presented in this study are available on request from the corresponding author. The data are not publicly available due to privacy policy.

Conflicts of Interest

The authors declare no conflict of interest.

References

  1. Yingjie, P. Fisheries Dictionary (Essence); Shanghai Lexicographical Publishing House: Shanghai, China, 2007. [Google Scholar]
  2. Rui, W.J.; Shan, S. The category composition and abundance of ichthyoplankton in the ecosystem of the Yellow Sea and the East China Sea. Acta Zool. Sin. 2006, 52, 28–44. [Google Scholar]
  3. Jingrui, W.; Dingyong, Z.; Xiaodong, B.; Xiaobo, N. Species composition and abundance distribution pattern of ichthyoplankton and their relationship with environmental factors in the East China Sea ecosystem. J. Fish. China 2014, 38, 1375–1398. [Google Scholar]
  4. Nanami, A.; Sato, T.; Kawabata, Y.; Okuyama, J. Spawning aggregation of white-streaked grouper Epinephelus ongus: Spatial distribution and annual variation in the fish density within a spawning ground. PeerJ 2017, 5, e3000. [Google Scholar] [CrossRef] [Green Version]
  5. Roussel, E.; Crec’hriou, R.; Lenfant, P.; Mader, J.; Planes, S. Relative influences of space, time and environment on coastal ichthyoplankton assemblages along a temperate rocky shore. J. Plankton Res. 2010, 32, 1443–1457. [Google Scholar] [CrossRef]
  6. Richardson, D.E.; Llopiz, J.K.; Leaman, K.D.; Vertes, P.S.; Muller-Karger, F.E.; Cowen, R.K. Sailfish (Istiophorus platypterus) spawning and larval environment in a Florida Current frontal eddy. Prog. Oceanogr. 2009, 82, 252–264. [Google Scholar] [CrossRef]
  7. Ospina-Alvarez, A.; Catalán, I.A.; Bernal, M.; Roos, D.; Palomera, I. From egg production to recruits: Connectivity and inter-annual variability in the recruitment patterns of European anchovy in the northwestern Mediterranean. Prog. Oceanogr. 2015, 138, 431–447. [Google Scholar] [CrossRef] [Green Version]
  8. Porcaro, R.R.; Zani-Teixeira, M.D.L.; Katsuragawa, M.; Namiki, C.; Ohkawara, M.H.; Favero, J.M.D. Spatial and temporal distribution patterns of larval sciaenids in the estuarine system and adjacent continental shelf off Santos, Southeastern Brazil. Braz. J. Oceanogr. 2014, 62, 149–164. [Google Scholar] [CrossRef] [Green Version]
  9. Coulter, A.A.; Keller, D.; Bailey, E.J.; Goforth, R.R. Predictors of bigheaded carp drifting egg density and spawning activity in an invaded, free-flowing river. J. Great Lakes Res. 2016, 42, 83–89. [Google Scholar] [CrossRef]
  10. Petereit, C.; Hinrichsen, H.H.; Voss, R.; Kraus, G.; Freese, M.; Clemmesen, C. The influence of different salinity conditions on egg buoyancy and development and yolk sac larval survival and morphometric traits of Baltic Sea sprat (Sprattus sprattus balticus Schneider). Sci. Mar. 2009, 73, 59–72. [Google Scholar] [CrossRef] [Green Version]
  11. Genner, M.J.; Halliday, N.C.; Simpson, S.D.; Southward, A.J.; Hawkins, S.J.; Sims, D.W. Temperature-driven phenological changes within a marine larval fish assemblage. J. Plankton Res. 2009, 32, 699–708. [Google Scholar] [CrossRef] [Green Version]
  12. Zenitani, H.; Onishi, Y.; Obata, Y. Spawning grounds of red sea bream in the east Seto Inland Sea. Fish. Sci. 2014, 80, 499–504. [Google Scholar] [CrossRef]
  13. Bonanno, A.; Zgozi, S.; Cuttitta, A.; El Turki, A.; Di Nieri, A.; Ghmati, H.; Basilone, G.; Aronica, S.; Hamza, M.; Barra, M.; et al. Influence of environmental variability on anchovy early life stages (Engraulis encrasicolus) in two different areas of the Central Mediterranean Sea. Hydrobiologia 2012, 701, 273–287. [Google Scholar] [CrossRef]
  14. Hinrichsen, H.H.; Lehmann, A.; Petereit, C.; Nissling, A.; Ustups, D.; Bergström, U.; Hüssy, K. Spawning areas of eastern Baltic cod revisited: Using hydrodynamic modelling to reveal spawning habitat suitability, egg survival probability, and connectivity patterns. Prog. Oceanogr. 2016, 143, 13–25. [Google Scholar] [CrossRef] [Green Version]
  15. Xiaodong, B.; Xiumei, Z.; Tianxiang, G.; Ruijing, W.; Peidong, Z. Category composition and distributional patterns of ichthyoplankton in the Yellow River estuary during spring and summer 2007. J. Fish. Sci. China 2010, 17, 199–211. [Google Scholar]
  16. Shuang, L.; Jimin, Z.; Yu, L. Species and distribution characteristics of fish eggs and larvae at the Yellow River Estuary. Mar. Sci. Bull. 2011, 30, 662–667. [Google Scholar]
  17. Xiukai, S.; Aiying, L.; Yanyan, Y.; Jianmin, Y.; Lihua, R.; Lijuan, L.; Guohua, S.; Xiaojing, L. Distributing of ichthyoplankton and the correlation with environmental factors in laizhou bay. Oceanol. Limnol. Sin. 2010, 41, 378–385. [Google Scholar]
  18. Lu, Y.; Yu, J.; Lin, Z.; Chen, P. Environmental influence on the spatiotemporal variability of spawning grounds in the western Guangdong waters, South China Sea. J. Mar. Sci. Eng. 2020, 8, 607. [Google Scholar] [CrossRef]
  19. Yuzhang, X.; Rong, W.; Qiang, O.; Hongda, F. Relationship between abundance distribution of fish eggs,larvae and juveniles and environmental factors in the Pearl River Estuary waters in spring. J. Oceanogr. Taiwan Strait 2010, 29, 488–495. [Google Scholar] [CrossRef]
  20. Stenseth, N.C.; Mysterud, A.; Ottersen, G.; Hurrell, J.W.; Chan, K.-S.; Lima, M. Ecological Effects of Climate Fluctuations. Science 2002, 297, 1292–1296. [Google Scholar] [CrossRef] [Green Version]
  21. Hastie, T.; Tibshirani, R. Generalized Additive Models; Chapman and Hall: London, UK, 1990. [Google Scholar]
  22. González-Irusta, J.; Wright, P.J. Spawning grounds of whiting (Merlangius merlangus). Fish. Res. 2017, 195, 141–151. [Google Scholar] [CrossRef]
  23. Loots, C.; Vaz, S.; Koubbi, P.; Planque, B.; Coppin, F.; Verin, Y. Inter-annual variability of North Sea plaice spawning habitat. J. Sea Res. 2010, 64, 427–435. [Google Scholar] [CrossRef] [Green Version]
  24. Li, K.Z.; Yin, J.Q.; Huang, L.M.; Tan, Y.H. Spatial and temporal variations of mesozooplankton in the Pearl River estuary, China. Estuar. Coast. Shelf Sci. 2006, 67, 543–552. [Google Scholar] [CrossRef]
  25. Yuan, G.; Zini, L.; Wanling, Y.; Yanyi, Z. Changes of zooplankton community before and after the spring closed season in the Pearl River in 2014—2015. Ecol. Environ. Sci. 2017, 026, 1562–1569. [Google Scholar]
  26. Fangmin, S.; Xinhui, L.; Qianpu, L.; Yuefei, L.; Jiping, Y.; Jie, L.; Fangcan, C. Spatial patterns of fish diversity and distribution in the Pearl River. Acta Ecol. Sin. 2017, 37, 3182–3192. [Google Scholar]
  27. Lu, Z.; Gan, J. Controls of seasonal variability of phytoplankton blooms in the Pearl River Estuary. Deep. Sea Res. Part. II Top. Stud. Oceanogr. 2015, 117, 86–96. [Google Scholar] [CrossRef]
  28. Lin, Z.; Wang, X.; Jiang, Y. Distribution and species composition of fish eggs in Daya Bay. J. Fish. Sci. China/Zhongguo Shuichan Kexue 2010, 17, 543–550. [Google Scholar]
  29. Ruijing, W.; Feng, Z.; Xiujuan, S.; Shan, S.J.A.E.S. Impacts of variability of habitat factors on species composition of ichthyoplankton and distribution of fish spawning ground in the Changjiang River estuary and its adjacent waters. Acta Ecol. Sin. 2010, 30, 155–165. [Google Scholar] [CrossRef]
  30. Team, R.C. R development core team. RA Lang Env. Stat Comput. 2013, 55, 275–286. [Google Scholar]
  31. Müller, D. Estimation of algae concentration in cloud covered scenes using geostatistical methods. In Proceedings of the ENVISAT Symposium, Montreux, Switzerland, 23 April 2007. [Google Scholar]
  32. Jing, Y.; Qiwei, H.; Huarong, Y.; Pimao, C. Effect assessment of summer fishing moratorium in Daya Bay based on remote sensing data. South China Fish. Sci. 2018, 14, 1–9. [Google Scholar] [CrossRef]
  33. Yanfeng, W.; Qiwei, H.; Jing, Y.; Pimao, C.; Liming, S. Effect assessment of fishery resources proliferation in Zhelin Bay marine ranching in eastern Guangdong. South China Fish. Sci. 2019, 15. [Google Scholar] [CrossRef]
  34. Wood, S. Generalized Additive Models: An Introduction with R; CRC Press: Boca Raton, FL, USA, 2006; Volume 66, p. 391. [Google Scholar]
  35. Venables, W.N.; Dichmont, C.M. GLMs, GAMs and GLMMs: An overview of theory for applications in fisheries research. Fish. Res. 2004, 69, 319–337. [Google Scholar] [CrossRef]
  36. Hilborn, R.; Mangel, M. The Ecological Detective; Princeton University Press: Princeton, NJ, USA, 1997. [Google Scholar]
  37. Mangel, M.; Quinn, T.J.; Deriso, R.B. Quantitative fish dynamics. Q. Rev. Biol. 1999, 2, 286–287. [Google Scholar]
  38. Stone, C.J. Additive regression and other nonparametric models. Ann. Stats 1985, 13, 689–705. [Google Scholar] [CrossRef]
  39. Akaike, H. Information Theory and an Extension of the Maximum Likelihood Principle. In Breakthroughs in Statistics: Foundations and Basic Theory; Kotz, S., Johnson, N.L., Eds.; Springer: New York, NY, USA, 1992; pp. 610–624. [Google Scholar]
  40. Burnham, K.; Anderson, D.; Burnham, P.; Anderson, R. Model Selection and Multimodel Inference: A Practical Information-Theoretical Approach; Springer: New York, NY, USA, 2010. [Google Scholar]
  41. Shu, Y.; Wang, Q.; Zu, T. Progress on shelf and slope circulation in the northern South China Sea. Sci. China Earth Sci. 2018, 61, 560–571. [Google Scholar] [CrossRef]
  42. Bacha, M.; Jeyid, M.A.; Vantrepotte, V.; Dessailly, D.; Amara, R. Environmental effects on the spatio-temporal patterns of abundance and distribution ofSardina pilchardusand sardinella off the Mauritanian coast (North-West Africa). Fish. Oceanogr. 2017, 26, 282–298. [Google Scholar] [CrossRef]
  43. Keefer, M.L.; Moser, M.L.; Boggs, C.T.; Daigle, W.R.; Peery, C.A. Variability in migration timing of adult Pacific lamprey (Lampetra tridentata) in the Columbia River, U.S.A. Environ. Biol. Fishes 2009, 85, 253–264. [Google Scholar] [CrossRef]
  44. Kimura, S.; Kato, Y.; Kitagawa, T.; Yamaoka, N. Impacts of environmental variability and global warming scenario on Pacific bluefin tuna (Thunnus orientalis) spawning grounds and recruitment habitat. Prog. Oceanogr. 2010, 86, 39–44. [Google Scholar] [CrossRef]
  45. Jingqi, L. Study on The nature regulative adaptibility of The Hairtail(Trichiurus haumela) in the oceanic environment. Trans. Oceanol. Limnol. 1981, 1, 60–65. [Google Scholar]
  46. Renzhai, Z. Spawning grounds and periods of chub mackerel in the northern South China Sea. Fish. Sci. Technol. Inf. 1981, 6, 6–9. [Google Scholar]
  47. Renzhai, Z. Morphology, spawning ground and spawning period of larva and juvenile of Nemipterus aureus in the northern South China Sea. Fish. Res. 1986, 7, 1. [Google Scholar]
  48. Spies, B.T.; Steele, M.A. Effects of temperature and latitude on larval traits of two estuarine fishes in differing estuary types. Mar. Ecol. Prog. Ser. 2016, 544, 243–255. [Google Scholar] [CrossRef]
  49. Wang, J.; Liu, Y.; Xiao, Y.; Wang, T.; Li, C. Population characteristics of fish eggs and larvae and their relationship with environmental factors in Daya Bay. J. Fish. Sci. China 2019, 26, 14–25. [Google Scholar] [CrossRef]
  50. Selleslagh, J.; Amara, R. Environmental factors structuring fish composition and assemblages in a small macrotidal estuary (eastern English Channel). Estuar. Coast. Shelf Sci. 2008, 79, 507–517. [Google Scholar] [CrossRef]
  51. Walsh, C.T.; Reinfelds, I.V.; Ives, M.C.; Gray, C.A.; West, R.J.; van der Meulen, D.E. Environmental influences on the spatial ecology and spawning behaviour of an estuarine-resident fish, Macquaria colonorum. Estuar. Coast. Shelf Sci. 2013, 118, 60–71. [Google Scholar] [CrossRef]
  52. Fonds, M. Laboratory Observations on the Influence of Temperature and Salinity on Development of the Eggs and Growth of the Larvae of Solea solea (Pisces). Mar. Ecol. Prog. Ser. 1979, 1, 91–99. [Google Scholar] [CrossRef]
  53. Shane, O.; Hickford, M.; Schiel, D.R. Earthquake-induced habitat migration in a riparian spawning fish has implications for conservation management. Aquat. Conserv. Mar. Freshw. Ecosyst. 2018, 28, 702–712. [Google Scholar]
  54. Goarant, A.; Petitgas, P.; Bourriau, P. Anchovy (Engraulis encrasicolus) egg density measurements in the Bay of Biscay: Evidence for the spatial variation in egg density with sea surface salinity. Mar. Biol. 2007, 151, 1907–1915. [Google Scholar] [CrossRef] [Green Version]
  55. Jun, Z.; Yongsong, Q.; Zuozhi, C.; Peng, Z.; Kui, Z.; Jiangtao, F.; Guobao, C.; Yancong, C.; Mingshuai, S. Advances in pelagic fishery resources survey and assessment in open South China Sea. South China Fish. Sci. 2018, 14, 118–127. [Google Scholar]
  56. Suursaar, U.; Raid, T.; Vetemaa, M.; Saat, T. Storm-generated shallow sea turbidity and its influence on spawning and nursery grounds of littoral fish. In Proceedings of the 2015 IEEE International Geoscience and Remote Sensing Symposium (IGARSS), Milan, Italy, 26–31 July 2015. [Google Scholar]
  57. Bakun, A. Patterns in the ocean: Ocean processes and marine population dynamics. Oceanogr. Lit. Rev. 1996, 5, 530. [Google Scholar]
  58. Hinrichsen, H.-H.; Lehmann, A.; Möllmann, C.; Schmidt, J.O. Dependency of larval fish survival on retention/dispersion in food limited environments: The Baltic Sea as a case study. Fish. Oceanogr. 2003, 12, 425–433. [Google Scholar] [CrossRef]
  59. Pitchaikani, J.S.; Lipton, A.P. Nutrients and phytoplankton dynamics in the fishing grounds off Tiruchendur coastal waters, Gulf of Mannar, India. Springerplus 2016, 5, 1405. [Google Scholar] [CrossRef] [Green Version]
  60. Casaucao, A.; González-Ortegón, E.; Jiménez, M.P.; Teles-Machado, A.; Plecha, S.; Peliz, A.J.; Laiz, I. Assessment of the spawning habitat, spatial distribution, and Lagrangian dispersion of the European anchovy (Engraulis encrasicolus) early stages in the Gulf of Cadiz during an apparent anomalous episode in 2016-ScienceDirect. Sci. Total. Environ. 2021, 781, 146530. [Google Scholar] [CrossRef]
  61. Yu, J.; Hu, Q.; Tang, D.; Chen, P. Environmental effects on the spatiotemporal variability of purpleback flying squid in XishaZhongsha waters, South China Sea. Mar. Ecol. Prog. Ser. 2019, 623, 25–37. [Google Scholar] [CrossRef]
  62. Wang, D.; Yao, L.; Yu, J.; Chen, P. The Role of Environmental Factors on the Fishery Catch of the Squid Uroteuthis chinensis in the Pearl River Estuary, China. J. Mar. Sci. Eng. 2021, 9, 131. [Google Scholar] [CrossRef]
  63. Pawelec, A.J.; Sapota, M.R.; Kobos, J. The effect of algal blooms on fish in their inshore nursery grounds in the Gulf of Gdańsk. J. Mar. Biol. Assoc. United Kingd. 2017, 98, 97–104. [Google Scholar] [CrossRef]
  64. Zeidberg, L.D.; Butler, J.L.; Ramon, D.; Cossio, A.; Stierhoff, K.L.; Henry, A. Estimation of spawning habitats of market squid (Doryteuthis opalescens) from field surveys of eggs off Central and Southern California. Mar. Ecol. 2012, 33, 326–336. [Google Scholar] [CrossRef]
  65. Ministry of Agriculture and Rural Affairs of the People’s Republic of China. Marine fishery water area map of China (batch 1). China Fish. 2002, 8, 21–22. [Google Scholar]
  66. Myers, R.A.; Pepin, P. Recruitment variability and oceanographic stability. Fish. Oceanogr. 1994, 3, 246–255. [Google Scholar] [CrossRef]
  67. Irigoien, X.; Fiksen, Ø.; Cotano, U.; Uriarte, A.; Alvarez, P.; Arrizabalaga, H.; Boyra, G.; Santos, M.; Sagarminaga, Y.; Otheguy, P. Could Biscay Bay Anchovy recruit through a spatial loophole? Prog. Oceanogr. 2007, 74, 132–148. [Google Scholar] [CrossRef]
  68. Cushing, D.H. Hydrographic containment of a spawning group of plaice in the Southern Bight of the North Sea. Mar. Ecol. Prog. Ser. 1989, 58, 287–297. [Google Scholar] [CrossRef]
  69. Wong, L.A. A model study of the circulation in the Pearl River Estuary (PRE) and its adjacent coastal waters: 1. Simulations and comparison with observations. J. Geophys. Res. 2003, 108. [Google Scholar] [CrossRef]
  70. Pan, J.; Gu, Y.; Wang, D. Observations and numerical modeling of the Pearl River plume in summer season. J. Geophys. Res.: Oceans 2014, 119, 2480–2500. [Google Scholar] [CrossRef]
  71. Ji, X.; Sheng, J.; Tang, L.; Liu, D.; Yang, X. Process study of dry-season circulation in the Pearl River estuary and adjacent coastal waters using a triple-nested coastal circulation model. Atmos. Ocean. 2011, 49, 138–162. [Google Scholar] [CrossRef]
  72. Yang, Y. Seasonal variation of the Pearl River diluted water and its dynamical cause. Mar. Sci. Bull. 2014, 33, 36–44. [Google Scholar]
  73. Huayong, X.; Changjian, L.; Dongxiao, W. The upwelling driven by the Zhujiang River runoff in 2006 summer. Haiyang Xuebao 2018, 40, 43–54. [Google Scholar]
  74. Potter, N.I.C. Movement of larval fishes through the entrance channel of a seasonally open estuary in Western Australia. Estuar. Coast. Shelf Sci. 1992, 35, 213–224. [Google Scholar]
  75. Harris, S.A.; Cyrus, D.P. Composition, abundance and seasonality of larval fish in richards bay harbour, kwazulu-natal, south africa. South. Afr. J. Aquat. Sci. 1997, 23, 56–78. [Google Scholar] [CrossRef]
  76. Zhaoli, X.; Hua, C.; Qinghui, C. Distribution patterns of ichthyoplankton in the Oujiang estuary. J. Fish. Sci. China 2008, 32, 733–739. [Google Scholar]
  77. Suying, O.; Dongxiao, W. A study on the spreading variations and its causes of the Zhujiang River plume. In Proceedings of the 10th China Estuarine and coastal Symposium; China Ocean Press: Beijing, China, 2009; pp. 34–43. [Google Scholar]
  78. Huijie, X.; Fei, C.; Liya, W.; Jiezhong, C. Zhujiang River Estuarine Circulation Model; Oceanography in China, China Ocean Press: Beijing, China, 2001; Volume 13, pp. 138–151. [Google Scholar]
  79. Mbaye, B.C.; Brochier, T.; Echevin, V.; Lazar, A.; Lévy, M.; Mason, E.; Gaye, A.T.; Machu, E. DoSardinella auritaspawning seasons match local retention patterns in the Senegalese-Mauritanian upwelling region? Fish. Oceanogr. 2015, 24, 69–89. [Google Scholar] [CrossRef] [Green Version]
Figure 1. Research area and survey stations.
Jmse 09 00763 g001
Figure 2. GAM analysis of the effects of environmental and spatial factors on egg density in the PRE: (a) SST; (b) SSS; (c) chlorophyll a concentration (Chl-a); (d) water depth (Depth). Shaded area: 95% confidence intervals. Rug plots on the x-axis, data density, and Y-axis indicate the modeled effect of environmental and spatial factors on egg density.
Jmse 09 00763 g002
Figure 3. Model check for GAMs: (a) Normal Q-Q plot; (b) observed residuals against predicted values; (c) Histogram of residuals; (d) observed values against predicted values.
Jmse 09 00763 g003
Figure 4. Spatiotemporal distribution of egg density and SST, SSS, Chl-a in the PRE: (a) SST in spring; (b) SST in summer; (c) SSS in spring; (d) SSS in summer; (e) Chl-a in spring; (f) Chl-a in summer.
Jmse 09 00763 g004
Figure 5. Spatial distribution of current and egg density in the PRE: (a) Current and egg density in spring; (b) Current and egg density in summer.
Jmse 09 00763 g005
Table 1. Survey date, voyage, and number of stations.
YearMonthVoyageNumber of Stations
2014April122
May 222
June322
2015April120
June2, 340
2016April122
June222
July322
2017April124
June224
July324
Table 2. Influencing factors information.
Influencing FactorsUnitTemporal ResolutionSpatial ResolutionStart and End Dates
SST°C1 day4 kmApril 2014–July 2017
Chl-amg/m31 day4 kmApril 2014–July 2017
SSS1 month1/12°April 2014–July 2017
Current/1 month1/12°April 2014–July 2017
Depthm/8.85 m/
Table 3. Contribution and significance test of influencing factors in GAMs.
Influencing Factorsd.f.Contribution (%)Pr(chi)Pr(F)
SST9.2014.3<0.001<0.001
Depth3.819.7<0.001<0.001
SSS8.368.5<0.001<0.001
Chl-a8.077.3<0.001<0.001
Table 4. GAMs fitting and bias analysis.
ModelAIC GCV Adjusted R2Deviance Explained (%)Residual
Deviance
Log(Y+1)~NULL1813.343.91001679.5
Log(Y+1)~s(SSS)1790.063.710.068.51537.3
Log(Y+1)~s(SSS) + s(SST)1734.373.260.2022.81296.7
Log(Y+1)~s(SSS) + s(SST) + s(Chl-a)1705.913.060.2630.11173.6
Log(Y+1)~s(SSS) + s(SST) + s(Chl-a) + s(Depth)1654.592.720.3539.8993.1
Publisher’s Note: MDPI stays neutral with regard to jurisdictional claims in published maps and institutional affiliations.

