
Acoustic Monitoring of a Bottlenose Dolphin (Tursiops truncatus) Population: Trends in Presence and Foraging beyond the Limits of the Lower River Shannon SAC


Abstract
1. Introduction
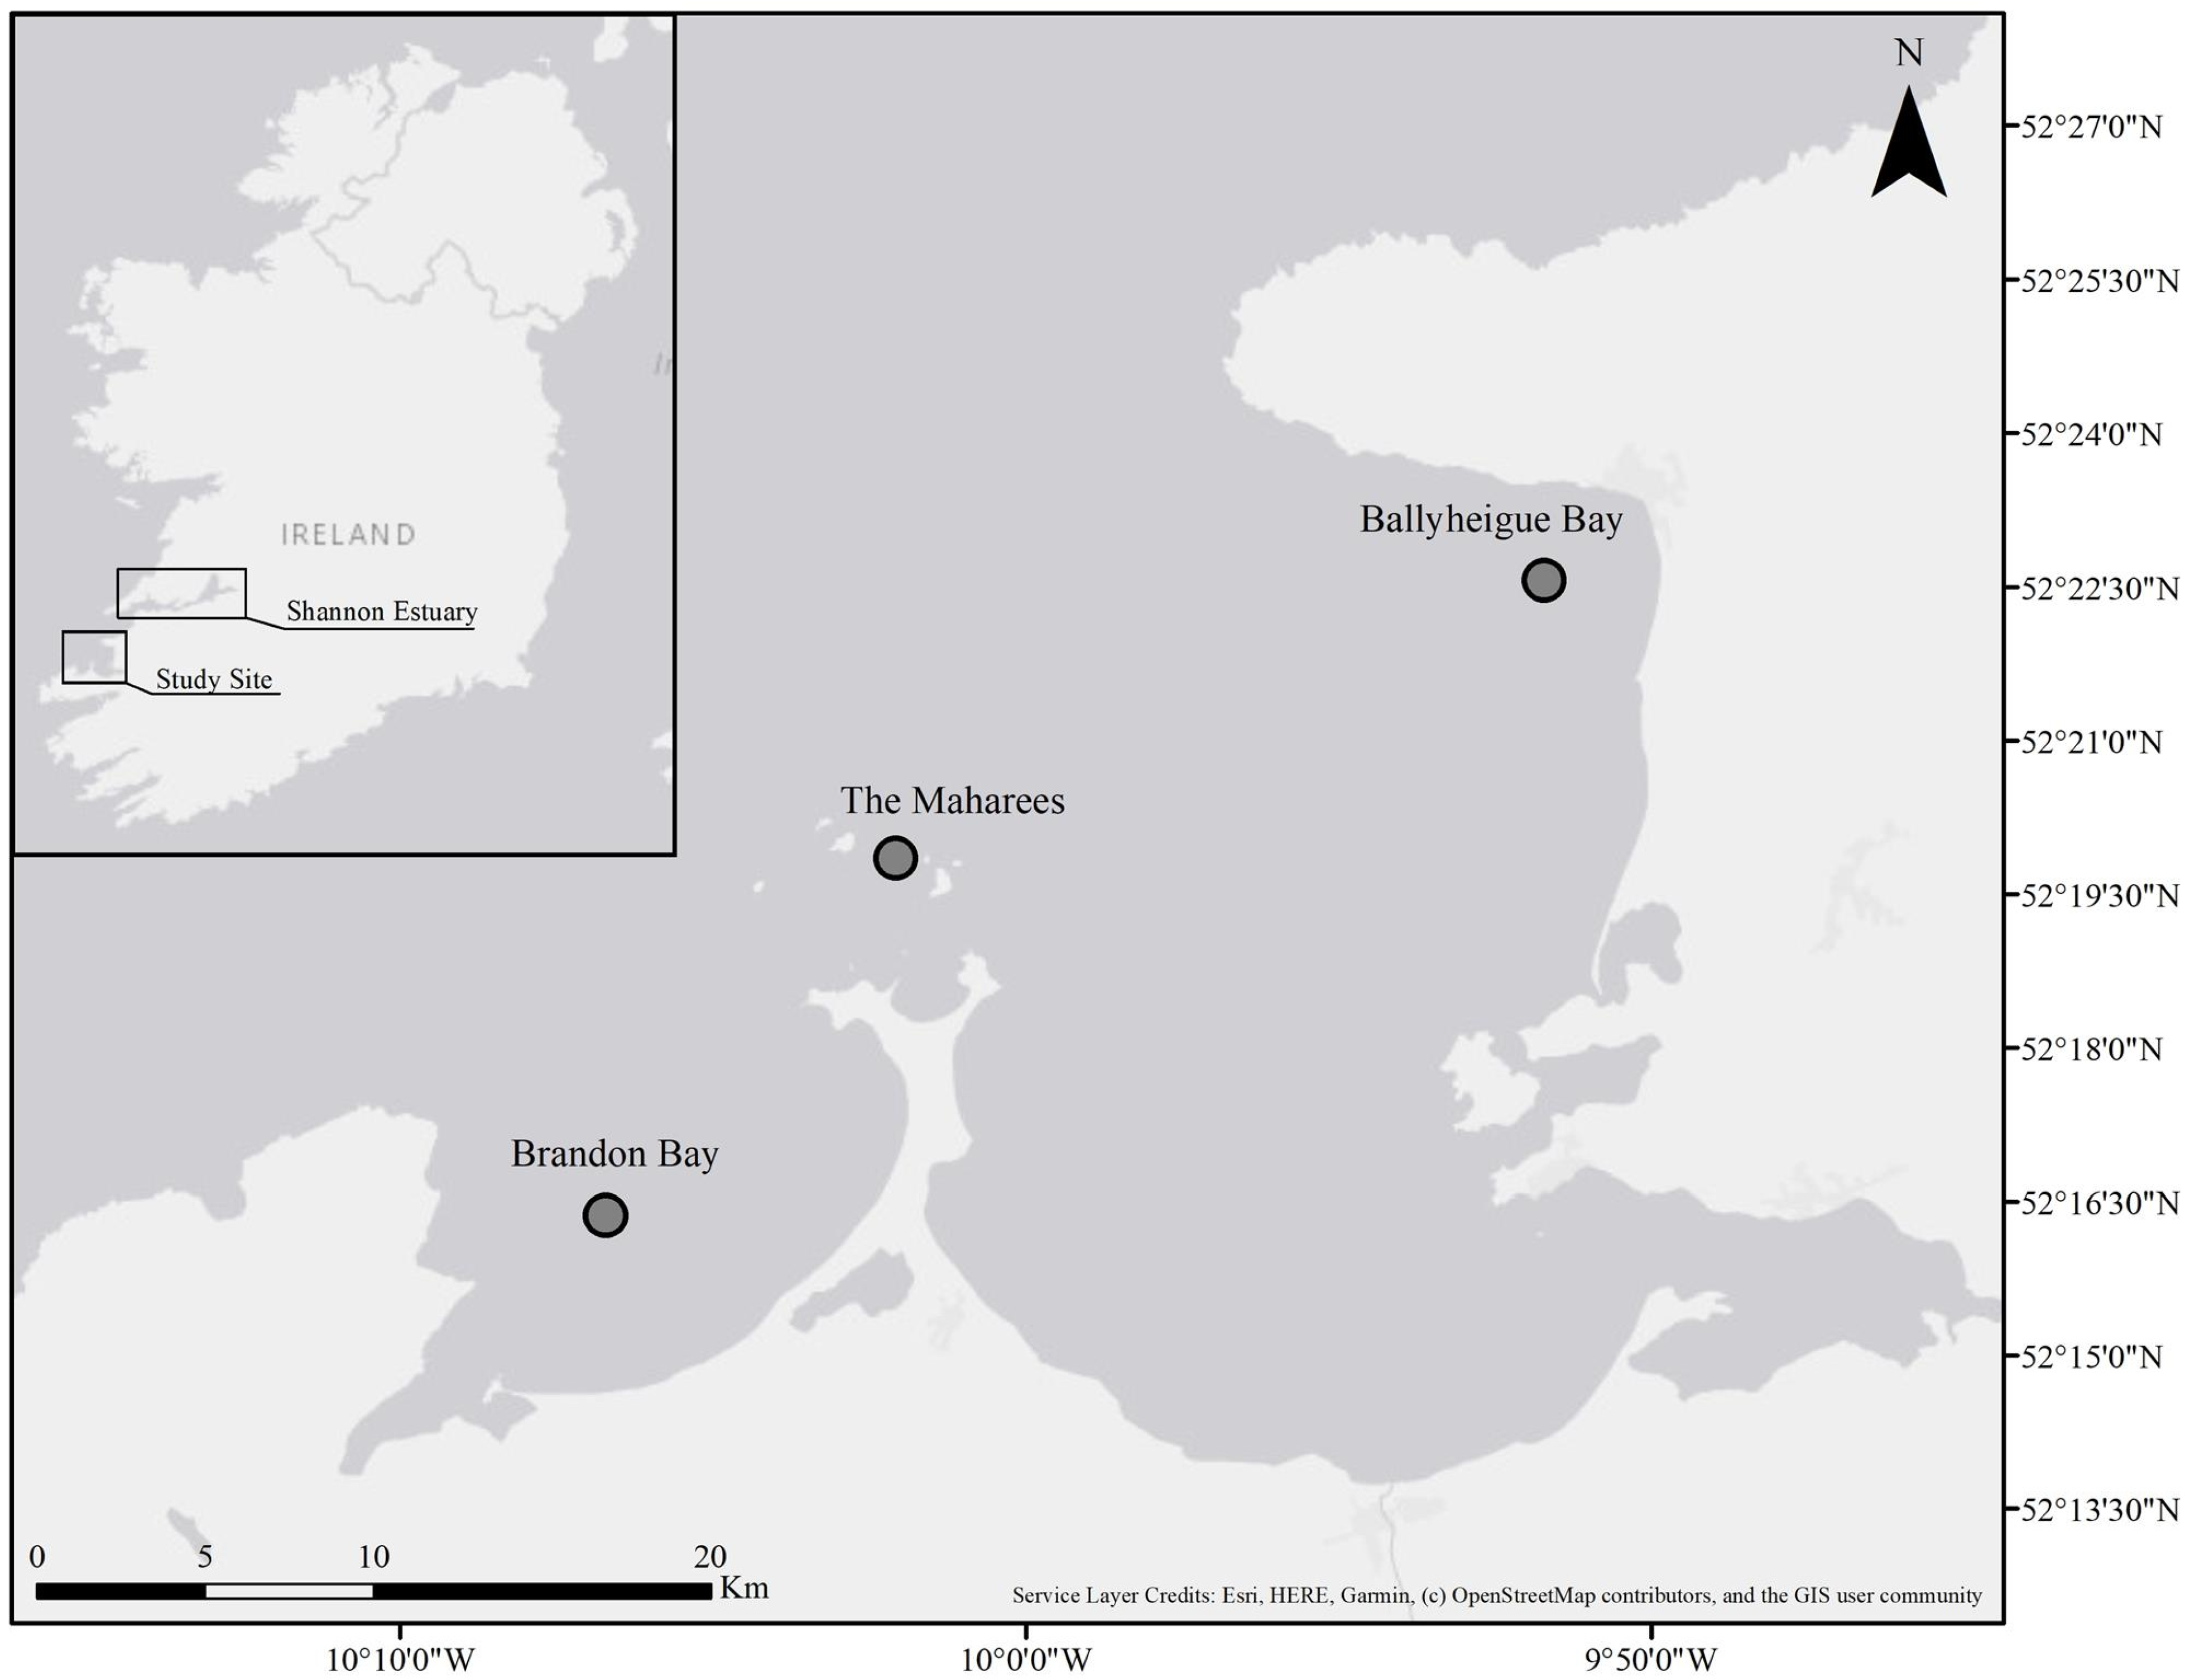
- The presence of bottlenose dolphins in Ballyheigue Bay, Brandon Bay, and around the Maharees;
- Whether these sites represent potential foraging habitats for bottlenose dolphins;
- What the environmental drivers of bottlenose dolphin presence and foraging are in these locations.
2. Materials and Methods
2.1. Data Collection
2.2. Environmental Data
2.3. Statistical Modelling
3. Results
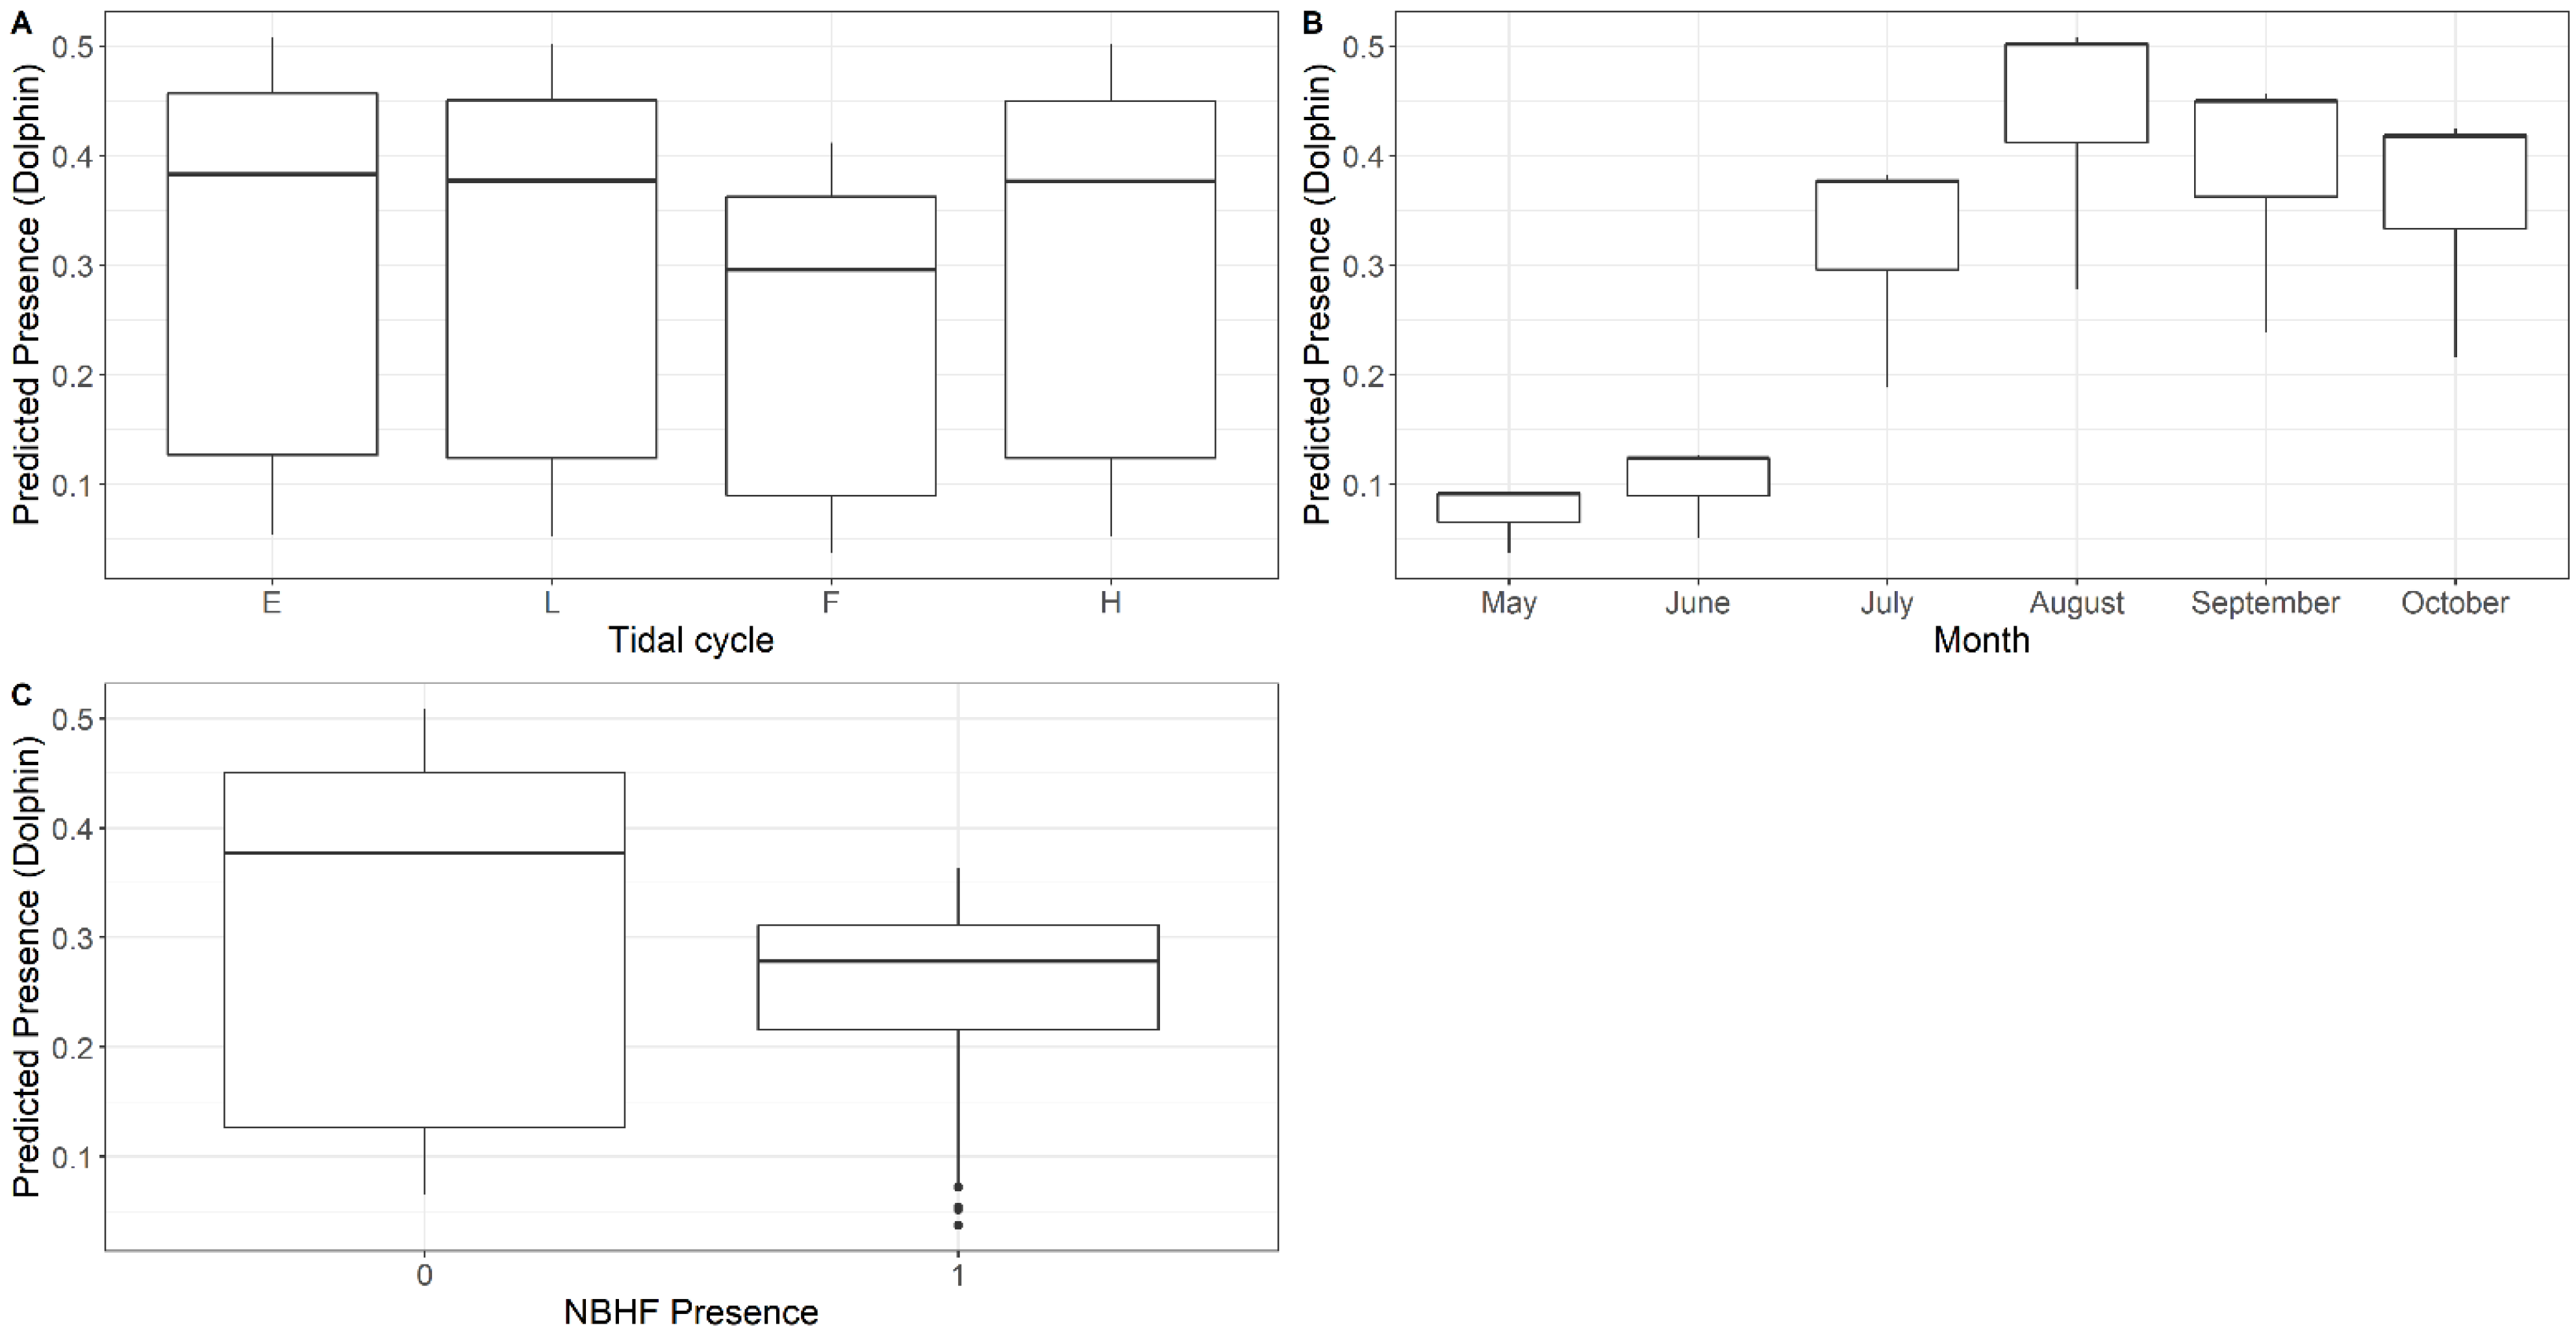
3.1. Presence
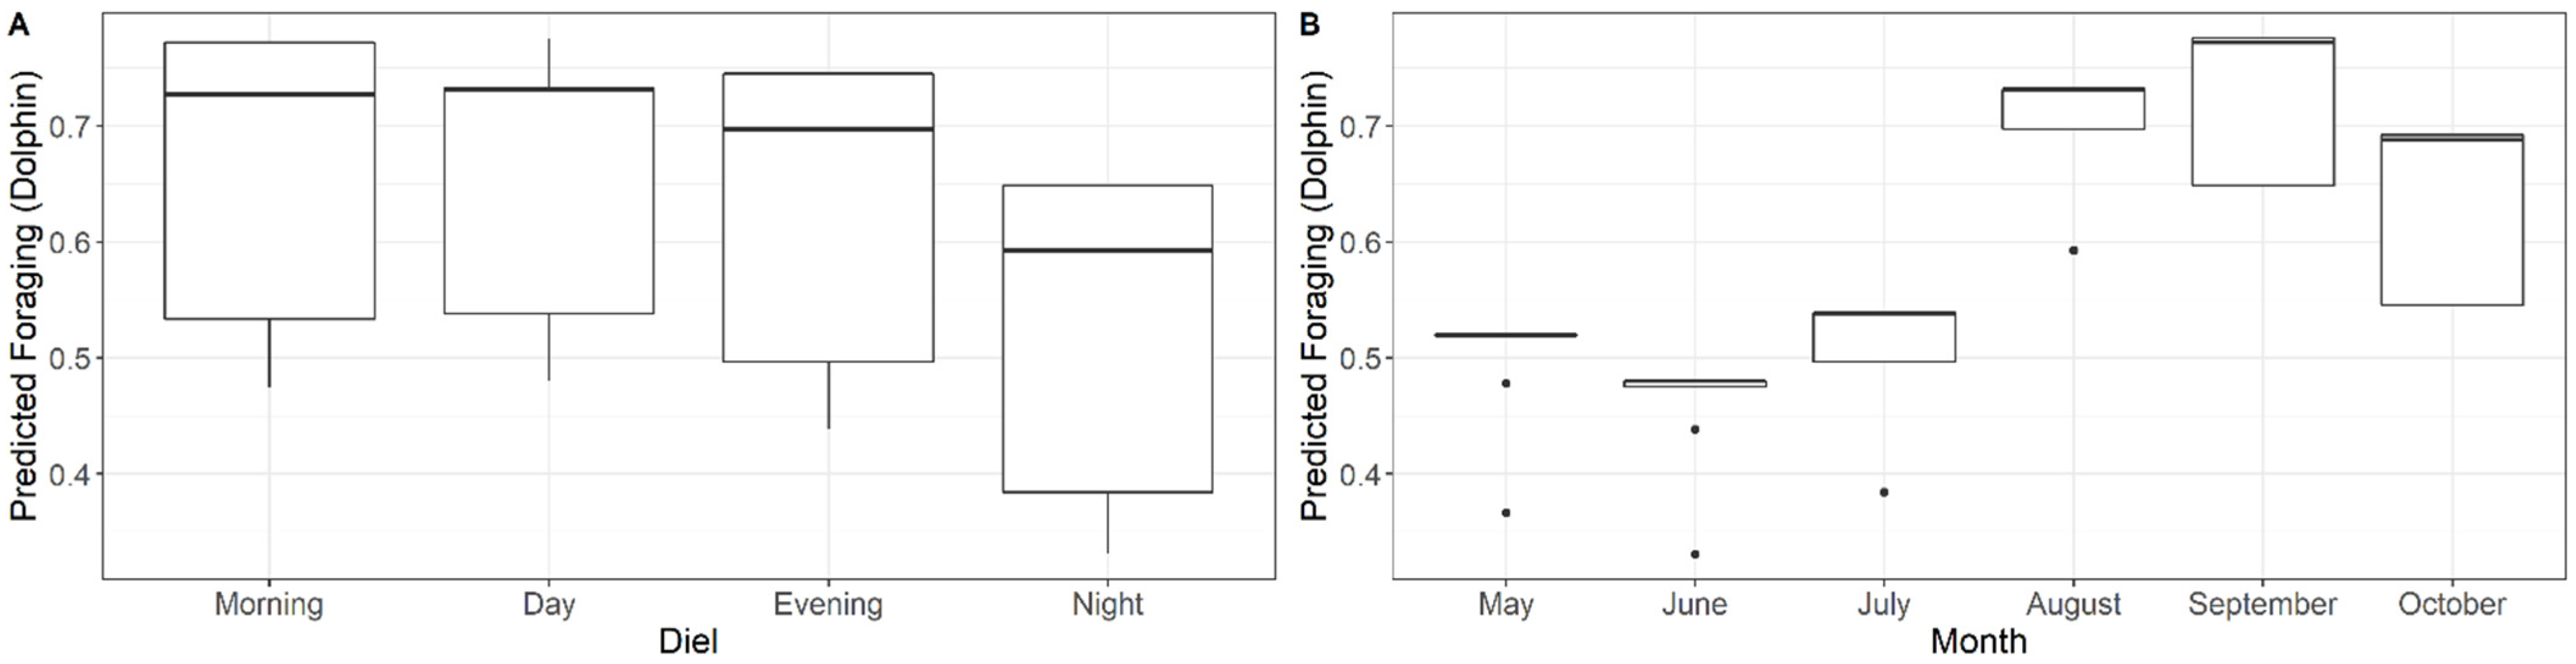
3.2. Foraging
4. Discussion
Supplementary Materials
Author Contributions
Funding
Institutional Review Board Statement
Informed Consent Statement
Data Availability Statement
Acknowledgments
Conflicts of Interest
References
- Levesque, S.; Reusch, K.; Baker, I.; O’Brien, J.; Berrow, S. Photo-identification of bottlenose dolphins (Tursiops truncatus) in Tralee and Brandon Bay, Co. Kerry: A case for SAC boundary extension. Biol. Environ. 2016, 116B, 109–118. [Google Scholar] [CrossRef]
- Mirimin, L.; Miller, R.; Dillane, E.; Berrow, S.D.; Ingram, S.; Cross, T.F.; Rogan, E. Fine-scale population genetic structuring of bottlenose dolphins in Irish coastal waters. Anim. Conserv. 2011, 14, 342–353. [Google Scholar] [CrossRef]
- Blázquez, M.; Baker, I.; O’Brien, J.M.; Berrow, S.D. Population viability analysis and comparison of two monitoring strategies for bottlenose dolphins (Tursiops truncatus) in the Shannon Estuary (Ireland) to inform management. Aquat. Mamm. 2020, 46, 307–325. [Google Scholar] [CrossRef]
- Louis, M.; Viricel, A.; Lucas, T.; Peltier, H.; Alfonsi, E.; Berrow, S.; Brownlow, A.; Covelo, P.; Dabin, W.; Deaville, R.; et al. Habitat-driven population structure of bottlenose dolphins, Tursiops truncatus, in the North-East Atlantic. Mol. Ecol. 2014, 23, 857–874. [Google Scholar] [CrossRef]
- Berrow, S.D.; Holmes, B.; Kiely, O.R. Distribution and abundance of bottle-nosed dolphins Tursiops truncatus (Montagu) in the Shannon Estuary. Biol. Environ. 1996, 96B, 1–9. [Google Scholar]
- Carmen, M.; Berrow, S.D.; O’Brien, J.M. Foraging behavior of bottlenose dolphins in the Shannon Estuary, Ireland as determined through static acoustic monitoring. J. Mar. Sci. Eng. 2021, 9, 275. [Google Scholar] [CrossRef]
- Knott, M.J. Two Months in Kilkee, 2nd ed.; Clasp Press: Ennis, Ireland, 1997; p. 255. [Google Scholar]
- Ingram, S.N.; Rogan, E. Identifying critical areas and habitat preferences of bottlenose dolphins Tursiops truncatus. Mar. Ecol. Prog. Ser. 2002, 244, 247–255. [Google Scholar] [CrossRef]
- Barker, J.; Berrow, S. Temporal and spatial variation in group size of bottlenose dolphins (Tursiops truncatus) in the Shannon Estuary, Ireland. Biol. Environ. 2016, 116B, 63–70. [Google Scholar] [CrossRef][Green Version]
- SIFP. Strategic Integrated Framework Plan for the Shannon Estuary. 2013. Available online: http://www.shannonestuarysifp.ie (accessed on 26 February 2021).
- O’Brien, J.; Beck, S.; Wall, D.; Pierini, A.; Hanbsen, S. Marine Mammals and Megafauna in Irish Waters-Behavior, Distribution and Habitat Use: Work Package 2: Developing Acoustic Monitoring Techniques; PReCAST Final Report; Marine Research Sub-Programme 2007–2013; Marine Institute: Oranmore, Ireland, 2013; pp. 76, 86. [Google Scholar]
- Ingram, S.N.; Englund, A.; Rogan, E. An Extensive Survey of Bottlenose Dolphins (Tursiops truncatus) on the West Coast of Ireland; Heritage Council Report No. WLD/2001/42; University College Cork: Cork, Ireland, 2001; pp. 1–17. [Google Scholar]
- Ryan, C.; Berrow, S. An extension to the known home range of Shannon Estuary bottlenose dolphins (Tursiops truncatus (Montagu, 1821)). Ir. Nat. J. 2013, 32, 77–78. [Google Scholar]
- Berrow, S.D.; O’Brien, J.; Meade, R.; Delarue, J.; Kowarski, K.; Martin, B.; Moloney, J.; Wall, D.; Gillespie, D.; Leaper, R.; et al. Acoustic Surveys of Cetaceans in the Irish Atlantic Margin in 2015–2016: Occurrence, Distribution and Abundance; Department of Communications, Climate Action & Environment and the National Parks and Wildlife Service (NPWS), Department of Culture, Heritage and the Gaeltacht: Dublin, Ireland, 2018; p. 283. [Google Scholar]
- Nuuttila, H.K.; Meier, R.; Evans, P.G.H.; Turner, J.R.; Bennell, J.D.; Hiddink, J.G. Identifying foraging behaviour of wild bottlenose dolphins (Tursiops truncatus) and harbour porpoises (Phocoena phocoena) with static acoustic dataloggers. Aquat. Mamm. 2013, 39, 147–161. [Google Scholar] [CrossRef]
- Fernandez-Betelu, O.; Graham, I.M.; Cornulier, T.; Thompson, P.M. Fine scale spatial variability in the influence of environmental cycles on the occurrence of dolphins at coastal sites. Sci. Rep. 2019, 9, 2548. [Google Scholar] [CrossRef]
- Nuuttila, H.K.; Courtene-Jones, W.; Baulch, S.; Simon, M.; Evans, P.G.H. Don’t forget the porpoise: Acoustic monitoring reveals fine-scaled temporal variation between bottlenose dolphin and harbour porpoise in Cardigan Bay SAC. Mar. Biol. 2017, 164, 50. [Google Scholar] [CrossRef]
- Pirotta, E.; Thompson, P.M.; Miller, P.I.; Brookes, K.L.; Cheney, B.; Barton, T.R.; Graham, I.M.; Lusseau, D. Scale-dependent foraging ecology of a marine top predator modelled using passive acoustic data. Funct. Ecol. 2014, 28, 206–217. [Google Scholar] [CrossRef]
- Guisan, A.; Zimmermann, N.E. Predictive habitat distribution models in ecology. Ecol. Modell. 2000, 135, 147–186. [Google Scholar] [CrossRef]
- Redfern, J.V.; Ferguson, M.C.; Becker, E.A.; Hyrenbach, K.D.; Good, C.; Barlow, J.; Kaschner, K.; Baumgartner, M.F.; Forney, K.A.; Balance, L.T.; et al. Techniques for cetacean-habitat modeling. Mar. Ecol. Prog. Ser. 2006, 310, 271–295. [Google Scholar] [CrossRef]
- Arso Civil, M.; Quick, N.J.; Cheney, B.; Pirotta, E.; Thompson, P.M.; Hammond, P.S. Changing distribution of the east coast of Scotland bottlenose dolphin population and the challenges of area-based management. Aquat. Conserv. 2019, 29, 178–196. [Google Scholar] [CrossRef]
- Chelonia Limited. C-POD User Guide. Available online: https://www.chelonia.co.uk/downloads/C-POD%20User%20Guide%20BPC4%20up%20to%20POD2089.pdf (accessed on 1 January 2020).
- Chelonia Limited. CPOD (Version 2.041). Available online: www.chelonia.co.uk (accessed on 5 January 2020).
- Caldwell, M.C.; Caldwell, D.K.; Tyack, P.L. Review of the signature-whistle hypothesis for the Atlantic bottlenose dolphin. In The Bottlenose Dolphin; Leatherwood, S., Reeves, R.R., Eds.; Academic Press: San Diego, CA, USA, 1990; pp. 199–234. [Google Scholar]
- Tyack, P.L. Studying How Cetaceans Use Sound to Explore Their Environment. In Perspectives in Ethology; Owings, D., Beecher, M.D., Thompson, N.S., Eds.; Plenum Press: New York, NY, USA, 1997; Volume 12, pp. 251–297. [Google Scholar]
- Janik, V.M. Acoustic Communication in Delphinids. In Advances in the STUDY of behavior; Naguib, M., Janik, V.M., Eds.; Academic Press: Burlington, VT, USA, 2009; Volume 40, pp. 123–157. [Google Scholar] [CrossRef]
- Tyack, P.L. Functional aspects of cetacean communication. In Cetacean Societies: Field Studies of Dolphins and Whales, 1st ed.; Mann, J., Connor, R.C., Tyack, P.L., Whitehead, H., Eds.; University of Chicago Press: Chicago, IL, USA, 2000; pp. 270–307. [Google Scholar]
- Wahlberg, M.; Jensen, F.H.; Soto, N.A.; Beedholm, K.; Bejder, L.; Oliveira, C.; Rasmussen, M.; Simon, M.; Villadsgaard, A.; Madsen, P.T. Source parameters of echolocation clicks from wild bottlenose dolphins (Tursiops aduncus and Tursiops truncatus). J. Acoust. Soc. Am. 2011, 130, 2263–2274. [Google Scholar] [CrossRef] [PubMed]
- Clausen, K.T.; Wahlberg, M.; Beedholm, K.; Deruiter, S.; Madsen, P.T. Click communication in harbour porpoises Phocoena Phocoena. Bioacoustics 2011, 20, 1–28. [Google Scholar] [CrossRef]
- Miller, L.A. Prey capture by harbor porpoises (Phocoena phocoena): A comparison between echolocators in the field and in captivity. J. Acoust. Soc. Jpn. 2010, 37, 156–168. [Google Scholar]
- Simon, M.; Nuuttila, H.; Reyes-Zamudio, M.M.; Ugarte, F.; Verfub, U.; Evans, P.G.H. Passive acoustic monitoring of bottlenose dolphin and harbour porpoise, in Cardigan Bay, Wales, with implications for habitat use and partitioning. J. Mar. Biol. Assoc. U.K. 2010, 90, 1539–1545. [Google Scholar] [CrossRef]
- Koschinski, S.; Diederichs, A.; Amundin, M. Click train patterns of free-ranging harbour porpoises acquired using T-PODs may be useful as indicators of their behaviour. J. Cetacean Res. Manag. 2008, 10, 147–155. [Google Scholar]
- Akamatsu, T.; Wang, D.; Wang, K.; Naito, Y. Biosonar behaviour of free-ranging porpoises. Proc. R. Soc. B 2005, 272, 797–801. [Google Scholar] [CrossRef]
- Villadsgaard, A.; Wahlberg, M.; Tougaard, J. Echolocation signals of wild harbour porpoises, Phocoena phocoena. J. Exp. Biol. 2007, 210, 56–64. [Google Scholar] [CrossRef]
- Chelonia Limited. CPOD.exe: A Guide for Users. Available online: https://www.chelonia.co.uk/downloads/CPOD.pdf (accessed on 5 January 2020).
- Chelonia Limited. Validating Cetacean Detections. Available online: https://www.chelonia.co.uk/downloads/Validating%20cetacean%20detections.pdf (accessed on 15 January 2020).
- WXTide 32 (Version 2.4). Available online: http://www.wxtide32.com (accessed on 1 January 2020).
- O’Brien, J. The Inshore Distribution and Abundance of Small Cetaceans on the West Coast of Ireland: Site Assessment for SAC Designation and an Evaluation of Monitoring Techniques. Ph.D. Thesis, Galway-Mayo Institute of Technology, Galway, Ireland, 2009. [Google Scholar]
- Todd, N.R.E.; Cronin, M.; Luck, C.; Bennison, A.; Jessopp, M.; Kavanagh, A.S. Using passive acoustic monitoring to investigate the occurrence of cetaceans in a protected marine area in northwest Ireland. Estuar. Coast. Shelf Sci. 2020, 232, 106509. [Google Scholar] [CrossRef]
- Wingfield, J.E.; O’Brien, M.; Lyubchich, V.; Roberts, J.J.; Halpin, P.N.; Rice, A.N.; Bailey, H. Year-round spatiotemporal distribution of harbour porpoises within and around the Maryland wind energy area. PLoS ONE 2017, 12, e0176653. [Google Scholar] [CrossRef] [PubMed]
- R Core Team. R: A Language and Environment for Statistical Computing; R Foundation for Statistical Computing: Vienna, Austria. Available online: https://www.R-project.org/ (accessed on 1 January 2020).
- Zuur, A.F.; Hilbe, J.M.; Ieno, E.N. A Beginner’s Guide to GLM and GLMM with R. A Frequentist and Bayesian Perspective for Ecologists, 1st ed.; Highland Statistics Ltd.: Newburgh, UK, 2013; pp. 52–54. [Google Scholar]
- Zuur, A.F.; Ieno, E.N.; Walker, N.J.; Saveliev, A.A.; Smith, G.M. Mixed Effects Models and Extensions in Ecology with R, 1st ed.; Springer: New York, NY, USA, 2009; pp. 295–320, 387. [Google Scholar] [CrossRef]
- Bailey, H.; Corkrey, R.; Cheney, B.; Thompson, P.M. Analyzing temporally correlated dolphin sightings data using generalized estimating equations. Mar. Mamm. Sci. 2013, 29, 123–141. [Google Scholar] [CrossRef]
- Højsgaard, S.; Halekoh, U.; Yan, J. The R package geepack for generalized estimating equations. J. Stat. Softw. 2006, 15, 1–11. [Google Scholar] [CrossRef]
- Yan, J. geepack: Yet another package for generalized estimating equations. R News 2002, 2, 12–14. [Google Scholar]
- Yan, J.; Fine, J.P. Estimating equations for association structures. Stat. Med. 2004, 23, 859–880. [Google Scholar] [CrossRef] [PubMed]
- Pirotta, E.; Matthiopolous, J.; MacKenzie, M.; Scott-Hayward, L.; Rendell, L. Modelling sperm whale habitat preference: A novel approach combining transect and follow data. Mar. Ecol. Prog. Ser. 2011, 436, 257–272. [Google Scholar] [CrossRef]
- Ekstrøm, C.T. MESS: Miscellaneous Esoteric Statistical Scripts. R Package Version 0.5.6. Available online: https://CRAN.R-project-org/package=MESS (accessed on 1 February 2020).
- Pan, W. Aikake’s information criterion in generalized estimating equations. Biometrics 2001, 57, 120–125. [Google Scholar] [CrossRef] [PubMed]
- Zweig, M.H.; Campbell, G. Receiver-operating characteristic (ROC) plots: A fundamental evaluation tool in clinical medicine. Clin. Chem. 1993, 39, 561–577. [Google Scholar] [CrossRef]
- Boyce, M.S.; Vernier, P.R.; Nielsen, S.E.; Schmiegelow, F.K.A. Evaluating resource selection functions. Ecol. Modell. 2002, 157, 281–300. [Google Scholar] [CrossRef]
- Cumming, G.S. Using between-model comparisons to fine-tune linear models of species ranges. J. Biogeogr. 2000, 27, 441–455. [Google Scholar] [CrossRef]
- Freeman, E.A.; Moisen, G. PresenceAbsence: An R package for presence absence analysis. J. Stat. Softw. 2008, 23, 1–31. [Google Scholar] [CrossRef]
- Wickham, H. ggplot2 Elegant Graphics for Data Analysis, 2nd ed.; Springer: New York, NY, USA, 2016; pp. 1–7. [Google Scholar]
- Wilson, B.; Reid, R.J.; Grellier, K.; Thompson, P.M.; Hammond, P.S. Considering the temporal when managing the spatial: A population range expansion impacts protected areas-based management for bottlenose dolphins. Anim. Conserv. 2004, 7, 331–338. [Google Scholar] [CrossRef]
- Santos, M.; Pierce, G.; Reid, R.; Patterson, I.; Ross, H.; Mente, E. Stomach contents of bottlenose dolphins (Tursiops truncatus) in Scottish waters. J. Mar. Biolog. Assoc. U.K. 2001, 81, 873–878. [Google Scholar] [CrossRef]
- Hernandez-Milian, G.; Berrow, S.; Begoña Santos, M.; Reid, D.; Rogan, E. Insights into the trophic ecology of bottlenose dolphins (Tursiops truncatus) in Irish waters. Aquat. Mamm. 2015, 41, 226–239. [Google Scholar] [CrossRef]
- Rogan, E.; Berrow, S. Review of Harbour Porpoises Phocoena Phocoena, L. in Irish Waters; Report of the International Whaling Commission 46; University College Cork: Cork, Ireland, 1996; pp. 595–605. [Google Scholar]
- Penrose, R. Marine Mammal and Marine Turtle Strandings. Welsh Coast, Annual Report 2005; Ceredigion, Whales. 2006, pp. 5–21. Available online: http://www.strandings.com/Graphics%20active/2005%20Mammal%20Strandings.pdf (accessed on 7 June 2021).


| Study Location | C-POD ID | Deployment Start Date | Deployment End Date | Total Number of Days |
|---|---|---|---|---|
| Ballyheigue Bay | 173 | 19/05/2013 | 23/06/2013 | 36 |
| Brandon Bay | 1525 | 25/05/2013 | 22/07/2013 | 59 |
| Brandon Bay | 2020 | 22/07/2013 | 13/10/2013 | 84 |
| Maharees | 1524 | 18/05/2013 | 25/05/2013 | 8 |
| Maharees | 547 | 22/07/2013 | 13/11/2013 | 115 |
| Model Variable | Estimate | Standard Error | Wald | P(>|W|) | Significance Level |
|---|---|---|---|---|---|
| Intercept | 0.0341 | 0.1736 | 0.04 | 0.8443 | |
| Tidal cycle (relative to Ebb) | |||||
| Flood | −0.3904 | 0.1227 | 10.12 | 0.0015 | <0.01 |
| High | −0.0274 | 0.1043 | 0.07 | 0.7926 | |
| Low | −0.0250 | 0.1168 | 0.05 | 0.8303 | |
| Month (relative to August) | |||||
| May | −2.3062 | 0.3723 | 38.37 | 5.8 × 10⁻¹⁰ | <0.001 |
| June | −1.9648 | 0.2572 | 58.36 | 2.2 × 10⁻¹⁴ | <0.001 |
| July | −0.5116 | 0.1992 | 6.60 | 0.0102 | <0.05 |
| September | −0.2076 | 0.2269 | 0.84 | 0.3603 | |
| October | −0.3378 | 0.2474 | 1.86 | 0.1721 | |
| Harbor porpoise presence | −0.5964 | 0.1080 | 30.52 | 3.3 × 10⁻⁸ | <0.001 |
| Model Variable | Estimate | Standard Error | Z Value | P(>|z|) | Significance Level |
|---|---|---|---|---|---|
| Intercept | −6.5603 | 1.0175 | −6.447 | 1.14 × 10⁻¹⁰ | |
| Diel Phase (relative to Day) | |||||
| Evening | 2.5864 | 1.1207 | 2.308 | 0.021005 | <0.05 |
| Night | 3.5974 | 1.0213 | 3.522 | 0.000428 | <0.001 |
| Morning | −13.5065 | 942.3163 | −0.014 | 0.988564 | |
| Month (relative to August) | |||||
| July | −1.1209 | 1.0496 | −1.068 | 0.285539 | |
| September | −0.9022 | 0.5074 | −1.778 | 0.075397 | |
| October | −0.2542 | 0.4032 | −0.631 | 0.528335 | |
| November | −2.1693 | 1.0464 | −2.073 | 0.038160 | <0.05 |
| Model Variable | Estimate | Standard Error | z Value | P(>|z|) | Significance Level |
|---|---|---|---|---|---|
| Intercept | 1.0011 | 0.1368 | 7.318 | 2.51 × 10⁻¹³ | |
| Diel Phase (relative to Day) | |||||
| Evening | −0.1682 | 0.2079 | −0.809 | 0.418587 | |
| Night | −0.6258 | 0.1646 | −3.801 | 0.000144 | <0.001 |
| Morning | −0.0197 | 0.2161 | −0.091 | 0.927355 | |
| Month (relative to August) | |||||
| May | −0.9231 | 0.6478 | −1.425 | 0.154189 | |
| June | −1.0812 | 0.2554 | −4.233 | 2.30 × 10⁻⁵ | <0.001 |
| July | −0.8472 | 0.1782 | −4.755 | 1.98 × 10⁻⁶ | <0.001 |
| September | 0.2384 | 0.1829 | 1.304 | 0.192357 | |
| October | −0.1918 | 0.2460 | −0.780 | 0.435391 |
Publisher’s Note: MDPI stays neutral with regard to jurisdictional claims in published maps and institutional affiliations. |
© 2021 by the authors. Licensee MDPI, Basel, Switzerland. This article is an open access article distributed under the terms and conditions of the Creative Commons Attribution (CC BY) license (https://creativecommons.org/licenses/by/4.0/).
Share and Cite
Charish, R.; Berrow, S.; O’Brien, J. Acoustic Monitoring of a Bottlenose Dolphin (Tursiops truncatus) Population: Trends in Presence and Foraging beyond the Limits of the Lower River Shannon SAC. J. Mar. Sci. Eng. 2021, 9, 650. https://doi.org/10.3390/jmse9060650
Charish R, Berrow S, O’Brien J. Acoustic Monitoring of a Bottlenose Dolphin (Tursiops truncatus) Population: Trends in Presence and Foraging beyond the Limits of the Lower River Shannon SAC. Journal of Marine Science and Engineering. 2021; 9(6):650. https://doi.org/10.3390/jmse9060650
Chicago/Turabian StyleCharish, Rachel, Simon Berrow, and Joanne O’Brien. 2021. "Acoustic Monitoring of a Bottlenose Dolphin (Tursiops truncatus) Population: Trends in Presence and Foraging beyond the Limits of the Lower River Shannon SAC" Journal of Marine Science and Engineering 9, no. 6: 650. https://doi.org/10.3390/jmse9060650
APA StyleCharish, R., Berrow, S., & O’Brien, J. (2021). Acoustic Monitoring of a Bottlenose Dolphin (Tursiops truncatus) Population: Trends in Presence and Foraging beyond the Limits of the Lower River Shannon SAC. Journal of Marine Science and Engineering, 9(6), 650. https://doi.org/10.3390/jmse9060650