Article

Statistical Optimisation and Kinetic Studies of Molybdenum Reduction Using a Psychrotolerant Marine Bacteria Isolated from Antarctica

by
Syazani Darham
1,
Khadijah Nabilah Mohd Zahri
1,
Azham Zulkharnain
2,
Suriana Sabri
3,
Claudio Gomez-Fuentes
4,5,
Peter Convey
6,
Khalilah Abdul Khalil
7 and
Siti Aqlima Ahmad
1,5,8,*
1
Department of Biochemistry, Faculty of Biotechnology and Biomolecular Sciences, Universiti Putra Malaysia, Serdang 43400, Selangor, Malaysia
2
Department of Bioscience and Engineering, College of Systems Engineering and Science, Shibaura Institute of Technology, 307 Fukasaku, Minuma-ku, Saitama 337-8570, Japan
3
Department of Microbiology, Faculty of Biotechnology and Biomolecular Sciences, Universiti Putra Malaysia, Serdang 43400, Selangor, Malaysia
4
Department of Chemical Engineering, Universidad de Magallanes, Avda. Bulnes, Punta Arenas 01855, Chile
5
Center for Research and Antarctic Environmental Monitoring (CIMAA), Universidad de Magallanes, Avda. Bulnes, Punta Arenas 01855, Chile
6
British Antarctic Survey, NERC, High Cross, Madingley Road, Cambridge CB3 0ET, UK
7
School of Biology, Faculty of Applied Sciences, Universiti Teknologi MARA, Shah Alam 40450, Selangor, Malaysia
8
National Antarctic Research Center, B303 Level 3, Block B, IPS Building, Universiti Malaya, Kuala Lumpur 50603, Malaysia
*
Author to whom correspondence should be addressed.
J. Mar. Sci. Eng. 2021, 9(6), 648; https://doi.org/10.3390/jmse9060648
Submission received: 22 April 2021 / Revised: 17 May 2021 / Accepted: 21 May 2021 / Published: 11 June 2021
(This article belongs to the Special Issue Research and Advance in Marine Biotechnology)

Abstract

:
The extensive industrial use of the heavy metal molybdenum (Mo) has led to an emerging global pollution with its traces that can even be found in Antarctica. In response, a reduction process that transforms hexamolybdate (Mo6+) to a less toxic compound, Mo-blue, using microorganisms provides a sustainable remediation approach. The aim of this study was to investigate the reduction of Mo by a psychrotolerant Antarctic marine bacterium, Marinomonas sp. strain AQ5-A9. Mo reduction was optimised using One-Factor-At-a-Time (OFAT) and Response Surface Methodology (RSM). Subsequently, Mo reduction kinetics were further studied. OFAT results showed that maximum Mo reduction occurred in culture media conditions of pH 6.0 and 50 ppt salinity at 15 °C, with initial sucrose, nitrogen and molybdate concentrations of 2.0%, 3.0 g/L and 10 mM, respectively. Further optimization using RSM identified improved optimum conditions of pH 6.0 and 47 ppt salinity at 16 °C, with initial sucrose, nitrogen and molybdate concentrations of 1.8%, 2.25 g/L and 16 mM, respectively. Investigation of the kinetics of Mo reduction revealed Aiba as the best-fitting model. The calculated Aiba coefficient of maximum Mo reduction rate (µmax) was 0.067 h−1. The data obtained support the potential use of marine bacteria in the bioremediation of Mo.

1. Introduction

Heavy metal pollution is fast becoming a global threat. Numerous industrial activities, including mining and smelting, are prime examples of anthropogenic sources of heavy metal discharge into the environment [1,2]. Rare heavy metals including molybdenum (Mo) have even been detected in the Antarctic [3,4,5]. Anthropogenic pollution sourced from nearby landmasses can reach the polar regions through long-range atmospheric transport and marine currents [6]. It has been suggested that mining sources in countries such as Chile could be among the main sources of traces of Mo in Antarctica, as Chile is one of the largest copper (Cu) and Mo producers globally and lies relatively close to the Antarctic region [7]. Low amounts of such anthropogenically sourced heavy metals have been reported to negatively affect Antarctic ecosystems [6,8].
Mo is a trace element that is involved in key biological processes in living organisms. It is required at a low concentration but can be lethal at elevated levels [9]. In rodent studies, high doses of Mo have been shown to cause renal failure [10] and reproductive anomalies [11]. A study of the effects of high human consumption of dietary Mo by residents living in areas of Mo pollution in Armenia demonstrated symptoms resembling gout, with elevated serum uric acid levels and high tissue xanthine oxidase levels [12]. Workers in an Mo production plant exposed to Mo dust also displayed similar symptoms [13].
Research is turning towards bioremediation as a sustainable alternative for the remediation of heavy metal pollution in soil and water. Bioremediation is the process of using resistant organisms, often microorganisms, to remove or break down contaminants into less toxic forms via various mechanisms [14,15]. One mechanism of metal removal is via enzymatic reduction into a less toxic form [16]. In the case of Mo, hexavalent Mo6+ can be enzymatically reduced to Mo-blue, a precipitable colloid compound with an intense blue colour that can be detected and quantified using a spectrophotometer at 865 nm [17,18]. Mo-blue is a less toxic form of the metal and can then be filtered out using dialysis tubing [19].
Pseudomonas sp. strain DRY1 was the first and, until now, the only Antarctic bacterium isolated from soil reported to have the potential to remediate Mo pollution [17]. To date, there has been no research on the potential for Mo reduction in Antarctic waters using marine bacteria. Preliminary screening done on a bacterial strain isolated from an Antarctic marine water sample showed Marinomonas sp. strain AQ5-A9 has the best Mo-reducing potential [20]. Marinomonas is a motile and aerobic gram-negative bacterial genus with straight or curved rod-shaped cells. The genus is psychro- and halotolerant and widely distributed in various marine environments, including in the polar regions [21,22].
Environmental variables such as pH, temperature, substrate concentration and salinity are important factors affecting the efficiency of Mo reduction [17]. Therefore, conditions for Mo reduction must be optimised to ensure successful remediation. The primary objective of the current study was to optimise Mo reduction initially using the conventional OFAT method and then refining further by incorporating two-way interactions between the variables using the statistical approach of RSM. Kinetic studies were also carried out to evaluate the effectiveness of microbial reduction when exposed to a range of molybdate concentrations.

2. Materials and Methods

2.1. Bacterial Culture, Maintenance and Media Preparation

The bacterium Marinonomas sp. strain AQ5-A9, originally isolated from Antarctic seawater, was provided by the Eco-Remediation Technology Laboratory, Faculty of Biotechnology and Biomolecular Sciences, Universiti Putra Malaysia. The seawater sample was collected in the vicinity of Bernardo O’Higgins Riquelme Base Station (63°19′15.41″ S, 57°53′58″ W).
The bacterial culture was grown in saline nutrient broth (NB) with 5% (w/v) sodium chloride (NaCl) and maintained in 50% glycerol stock at −80 °C. Saline low phosphate media (LPM) (pH 7.0) was prepared by adding (%) glucose (1.0), magnesium sulphate heptahydrate (MgSO4.7H2O) (0.05), ammonium sulphate ((NH4)2SO4) (0.3), NaCl (5.0), sodium molybdate dihydrate (Na2MoO4.2H2O) (0.242), yeast extract (0.05) and sodium phosphate dibasic dihydrate (Na2HPO4.2H2O) (0.05). The media and glucose were autoclaved separately at 121 °C for 15 min [20].

2.2. Conventional One-Factor-At-a-Time (OFAT) Optimisation

Optimisation of bacterial growth and Mo reduction was carried out using the conventional One-Factor-At-a-Time (OFAT) approach based on the selected parameters of: salinity (0 to 80 ppt), temperature (10, 15, 20 and 25 °C), carbon source (fructose, sucrose, lactose, galactose, arabinose, starch), carbon source concentration (0.0 to 3.5 g/L), nitrogen source (aspartic acid, ammonium nitrate, ammonium sulphate, ammonium chloride, leucine, sodium nitrate, potassium nitrate), nitrogen source concentration (0.0 to 0.6 g/L), molybdate concentration (0 to 30 mM) and pH (overlapping buffer system of acetate pH 5.0, 5.5, 6.0, phosphate pH 6.0, 6.5, 7.0, 7.5 and Tris-HCl pH 7.5, 8.0, 8.5). The optimised value of each parameter was factored in the subsequent parameter optimisation and so forth until the last parameter of the arrangement.
The effects of these factors were evaluated in 50 mL saline LPM by adding 5 mL enriched bacterial culture grown for 48 h in saline NB of 5% salinity at 10 °C with an optical density (OD) of 0.3 ± 0.05. The sample was incubated for eight days at 150 rpm on an orbital shaker. All experiments were conducted in triplicate. Mo reduction and bacterial growth studies were carried out concurrently. The intensity of the blue colour signifying Mo-blue production was measured at 865 nm using a UV-VIS spectrophotometer (Jenway 7305, Staffordshire, UK) [17]. The bacterial growth was determined using a colony counting technique on saline nutrient agar (NA) (5% salinity). Concentration of colony-forming units (CFU) was expressed by means of logarithmic notation using the average of the plate counts from the experimental triplicates.
The statistical analyses were done using Graphpad Prism software. One-way analysis of variance (ANOVA) was applied to determine any statistically significant differences between the means of two or more independent groups, while Tukey’s multiple comparison test was used to determine which set of data differs from the rest.

2.3. Statistical Approach Response Surface Methodology (RSM)

In RSM, the statistical tool Central Composite Design (CCD) is used for optimising variables and to identify significant two-way interactions between variables. The tool is also used to generate 3D graphical interpretation that enables point prediction and determination of optimum conditions. The software Design Expert version 6.0.8. (State Ease Inc., Minneapolis, MN, USA) was used to design the experiments and analyse the data obtained.
The selected variables were analysed at five different levels with the combination of two 2k factorial points (−1, +1), two 2k axial points (−2, +2) and a central point (0), as shown in Table 1. The total number of design points is determined by n = 2k + 2k + n0, where k is the number of variables and n0 is the number of centre points [23]. Thus, 86 different experiments assessing six significant variables, including ten centre points, were conducted. The reduction of Mo was used as the response variable, as indicated by the OD of Mo-blue.

2.4. Kinetic Modelling

To describe the bioreduction yield achieved, it is important to determine a suitable kinetic model relating the Mo-blue production rate and initial concentration of hexavalent Mo. Various kinetic models have been developed, such as the Monod and Haldane models. Such models enable the calculation of the time required to reduce the toxicant to a certain target concentration, predict the amount of biomass production achievable at a given time and allow bioremediation approaches to be designed to remove the chemical contaminant to a designated concentration in situ or ex situ [24,25].
A batch experiment was conducted under the optimal conditions predicted from RSM. The initial molybdate concentration was varied, ranging from 0 to 45 mM. The kinetics were measured by collecting 1 mL aliquots of the culture every 24 h for four days. OD was measured at 865 nm using a UV-VIS spectrophotometer (Jenway 7305, Staffordshire, UK). In this study, four kinetic models were assessed for their ability to represent the kinetics of hexavalent Mo reduction, namely Aiba, Haldane, Monod and Yano models [26,27,28,29].
The model parameters were evaluated using the curve-fitting toolbox from Matlab R2015a based on Windows 7 (64-bit). The determined Mo-blue production constants were µmax (maximum Mo-blue production rate, h−1), Ks (half-saturation constant, mM), Ki (inhibition constant, mM), S (substrate concentration, mM) and k (Yano constants). The ability of the models to represent the Mo reduction rate was assessed through the coefficient of determination, R2 and adjusted R2, root-mean-square error (RMSE) and corrected Akaike Information Criterion (AICc).

3. Results

3.1. Optimisation of Mo Reduction Using OFAT

The effects of the various factors examined are illustrated in Figure 1, Figure 2, Figure 3, Figure 4, Figure 5 and Figure 6.

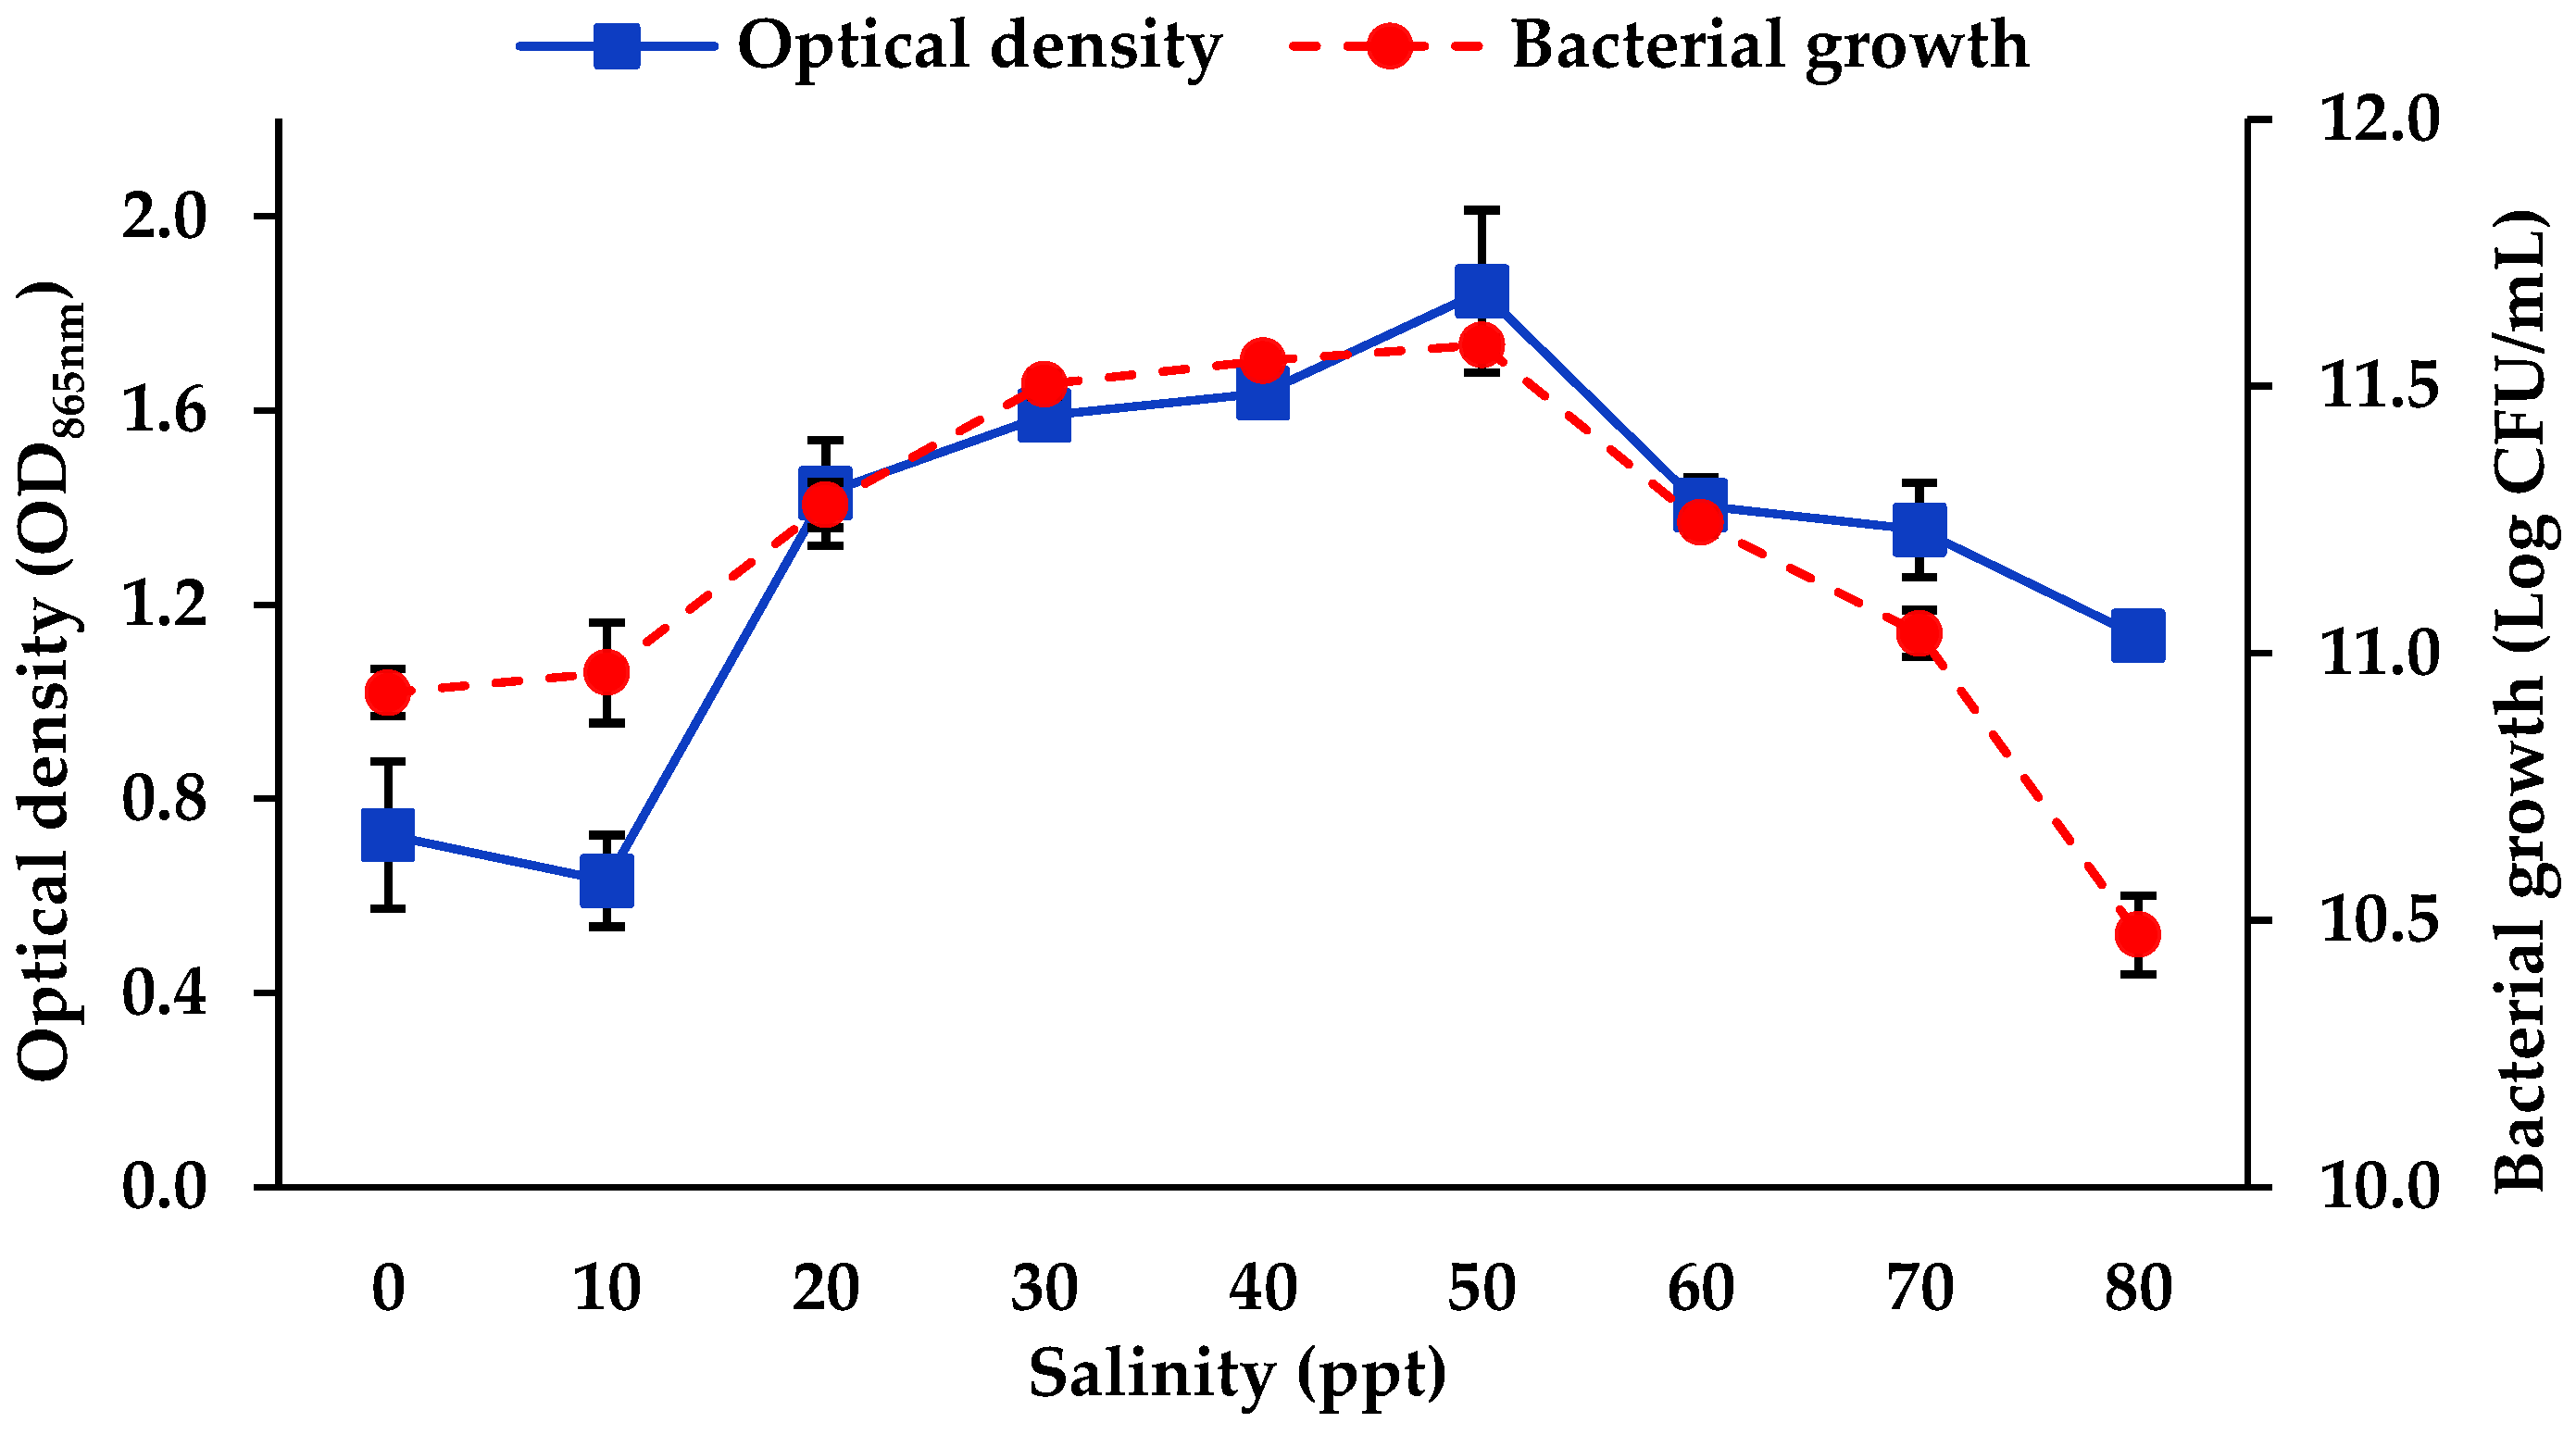
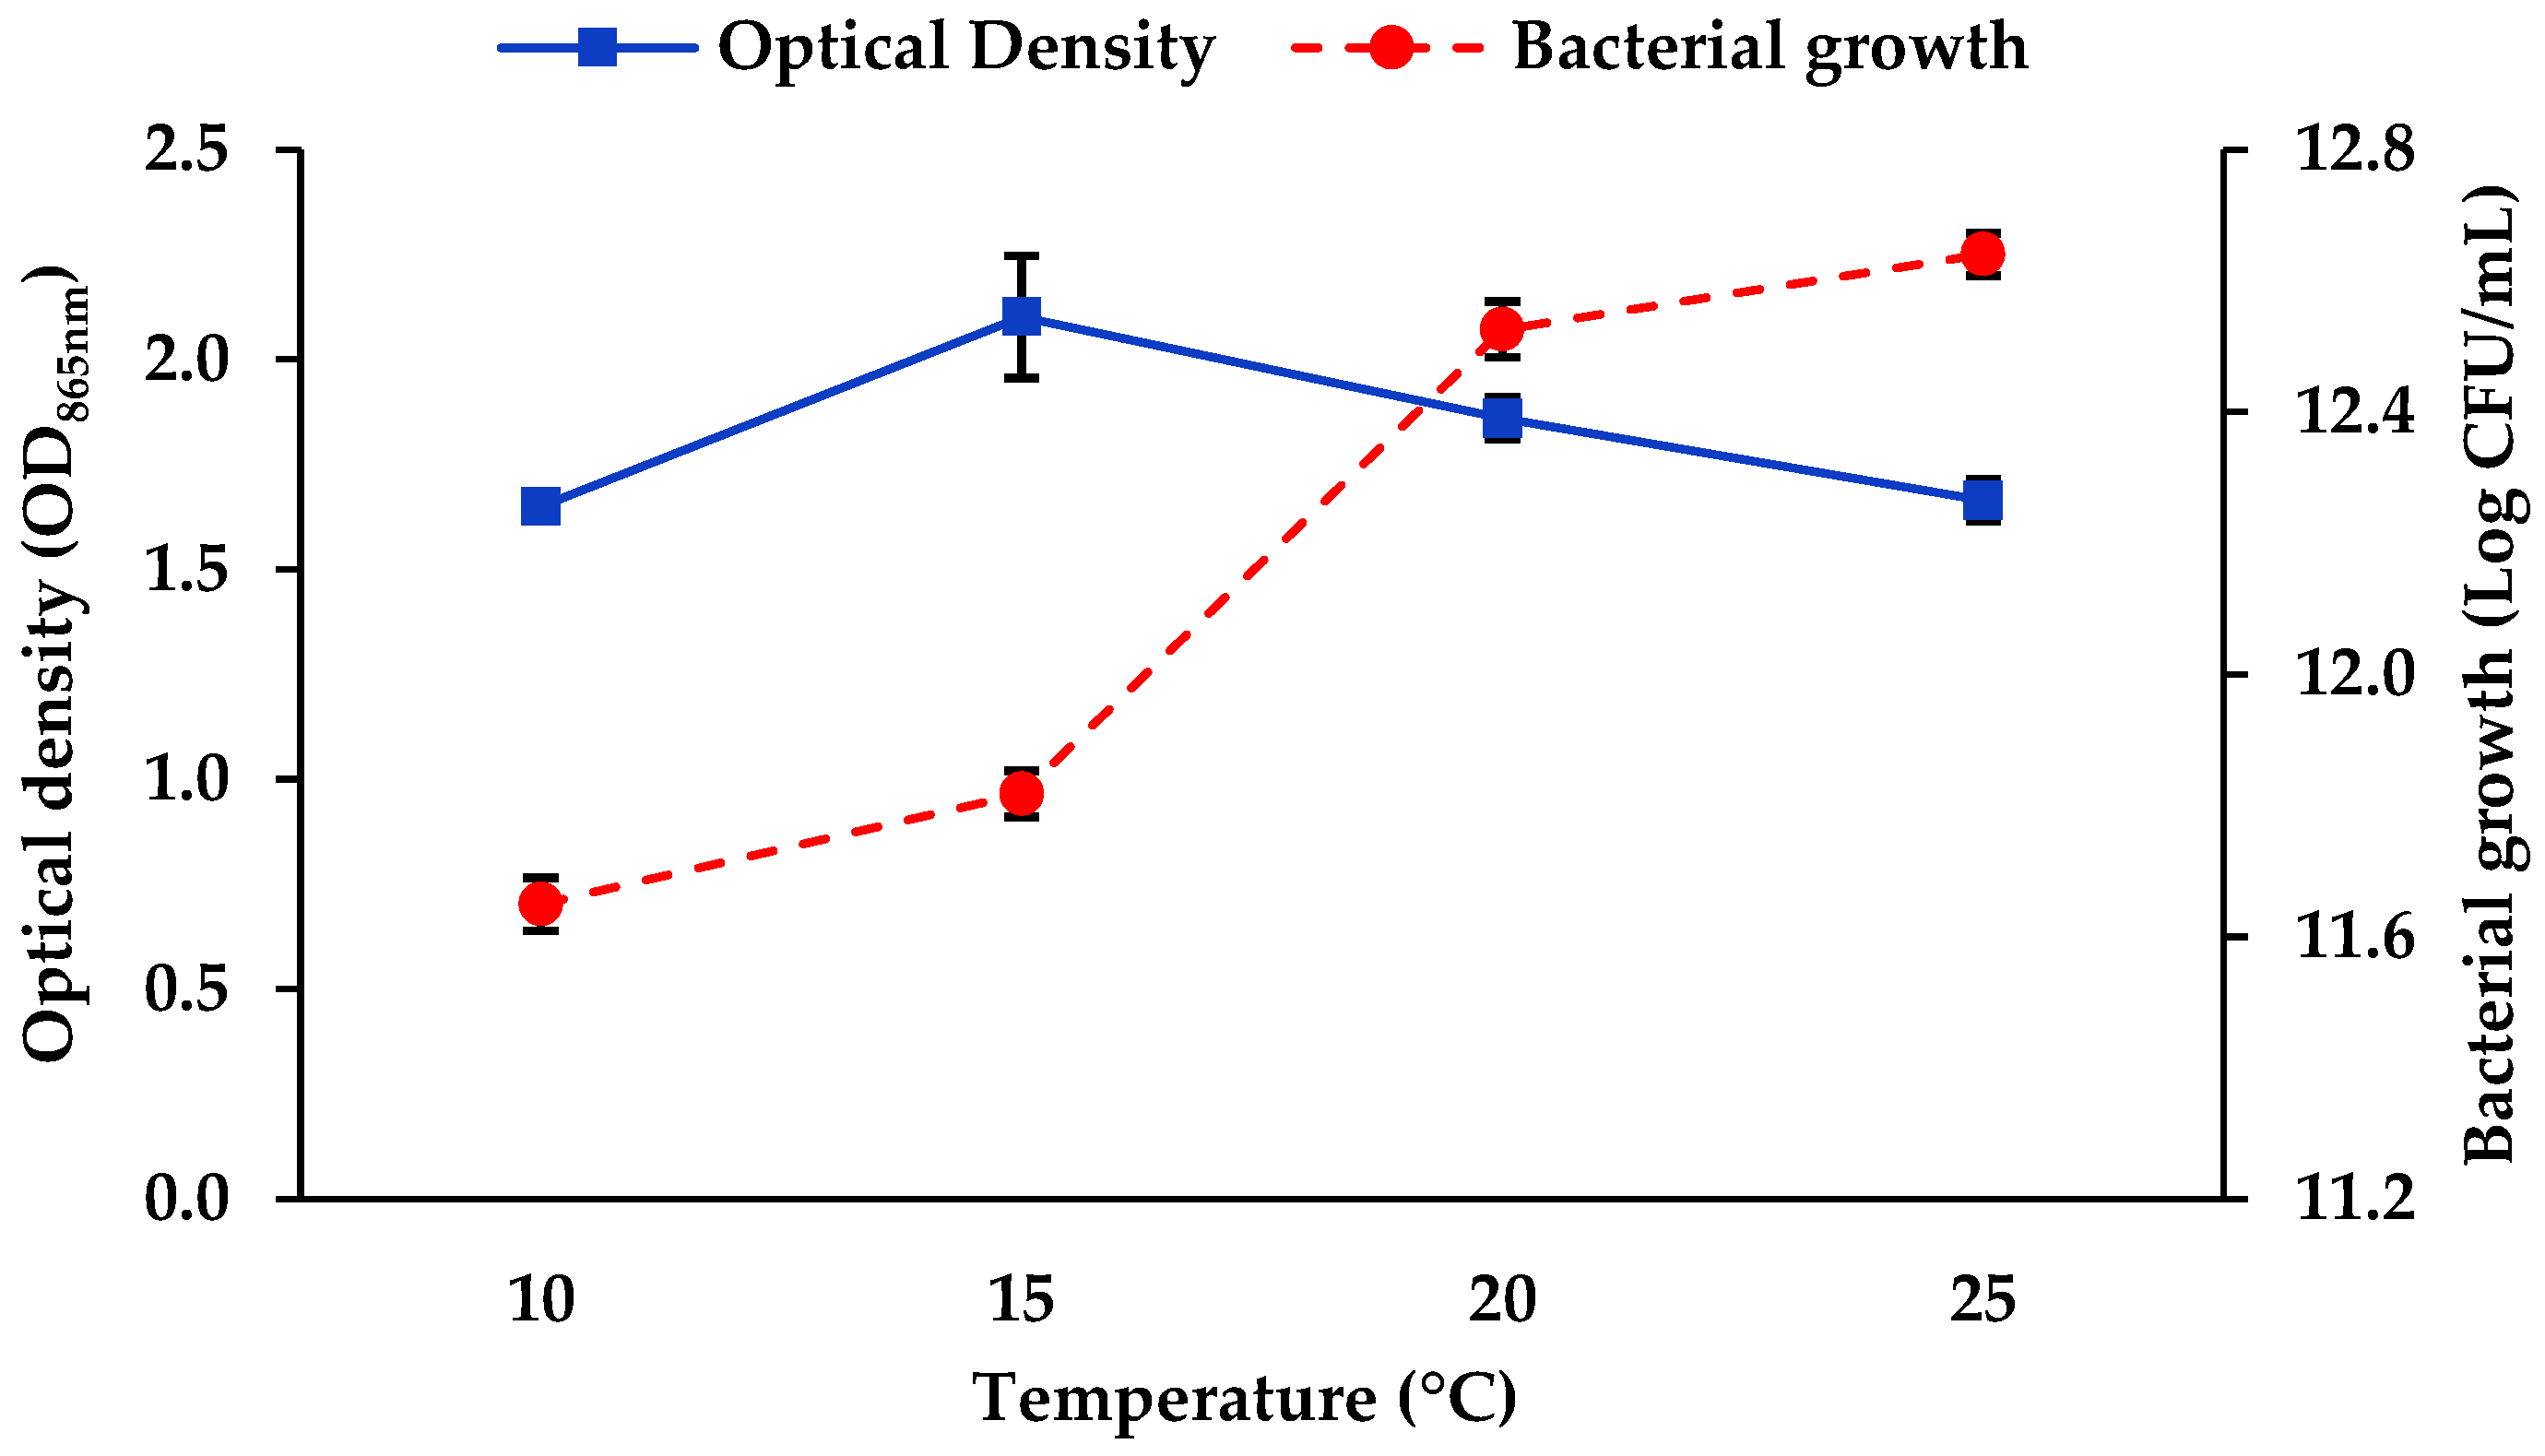
3.1.1. Salinity and Temperature

The effects of salinity on bacterial growth and Mo reduction at 10 °C are shown in Figure 1. One-way ANOVA showed significant differences in Mo reduction (F8,18 = 50.23, p < 0.0001) and bacterial growth (F8,18 = 164.8, p < 0.0001) across the salt concentrations tested. Although there were no significant differences in the OD and bacterial growth observed between 30, 40 and 50 ppt (Tukey’s multiple comparison test), the maximum growth and Mo reduction were observed at 50 ppt. Strain AQ5-A9 was tolerant towards a wide range of salinity conditions, with some growth in both fresh water and at 80 ppt salinity.
Based on Figure 2, there were statistically significant differences across all temperatures tested in Mo reduction (one-way ANOVA, F3,8 = 20.07, p = 0.0004) and bacterial growth (one-way ANOVA, F3,8 = 518.9, p < 0.0001). Mo reduction activity initially increased but started to decrease at 20 °C. OD was maximum and significantly greater at 15 °C than that at 10 °C (p < 0.0001) but not significantly different from that at 20 °C (Tukey’s multiple comparison test). Meanwhile, bacterial growth steadily increased across the temperatures tested. However, there were some indications of a stress response in growth at 20 °C and 25 °C as bacterial cells and Mo-blue were observed to be precipitated at the bottom of the culture flask.

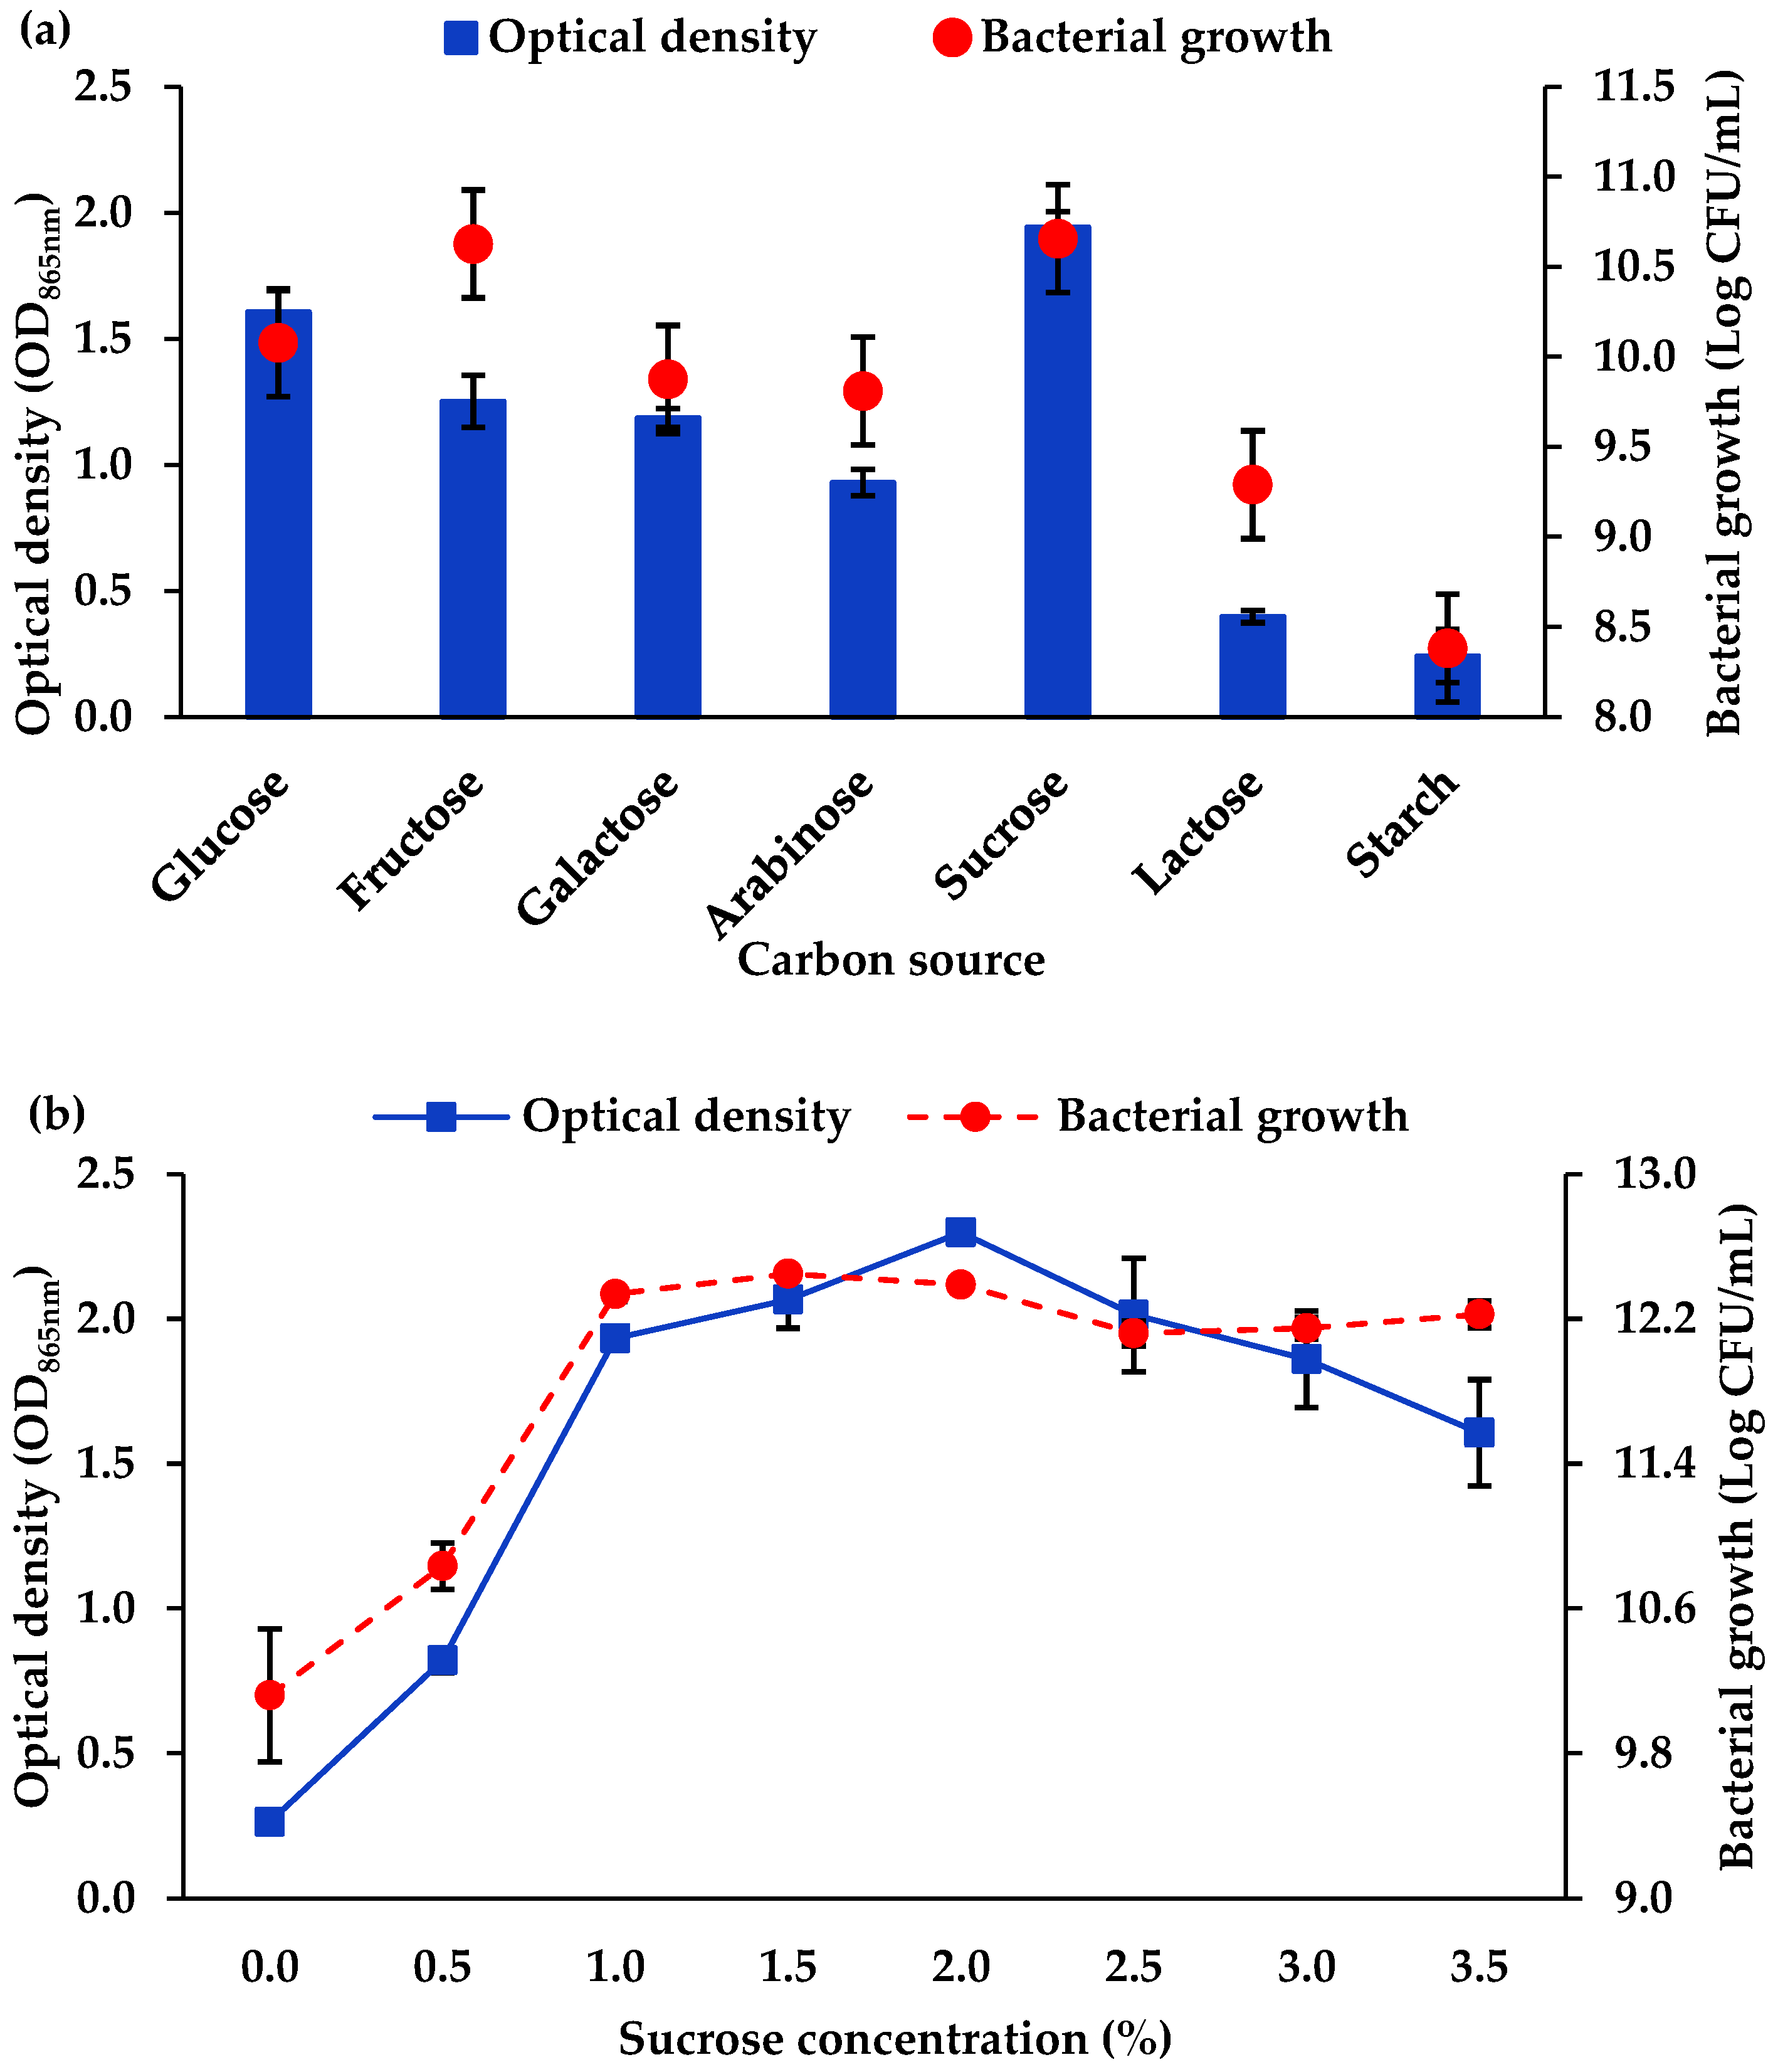
3.1.2. Carbon Source and Concentration

There were statistically significant differences in Mo reduction (one-way ANOVA, F6,14 = 103.5, p < 0.0001) and bacterial growth (one-way ANOVA, F6,14 = 1264, p < 0.0001) across all carbon sources. Figure 3a exhibited the use of sucrose as a carbon source, which led to the greatest Mo reduction. Tukey’s test (p < 0.01) showed a significant difference between sucrose and the second-best carbon source, glucose. In contrast, bacterial growth in sucrose- or fructose-supplemented media was amongst the highest observed, although differences in growth between the different carbon sources were not significantly different.
A series of sucrose concentrations ranging from 0.0 to 3.5% were then tested to find the optimum concentration (Figure 3b). One-way ANOVA showed significant differences in Mo reduction (F7,16 = 103.5, p < 0.0001) and bacterial growth (F7,16 = 106.2, p < 0.0001) across the sucrose concentrations. OD was highest with 2.0% sucrose but was not significantly different from 1.0%, 1.5% and 2.5%. OD was significantly lower using 0%, 0.5%, 3.0% and 3.5% sucrose (Tukey’s multiple comparison tests, all p < 0.01). Bacterial growth increased until 1.0% sucrose concentration and then remained stable across all higher concentrations tested.

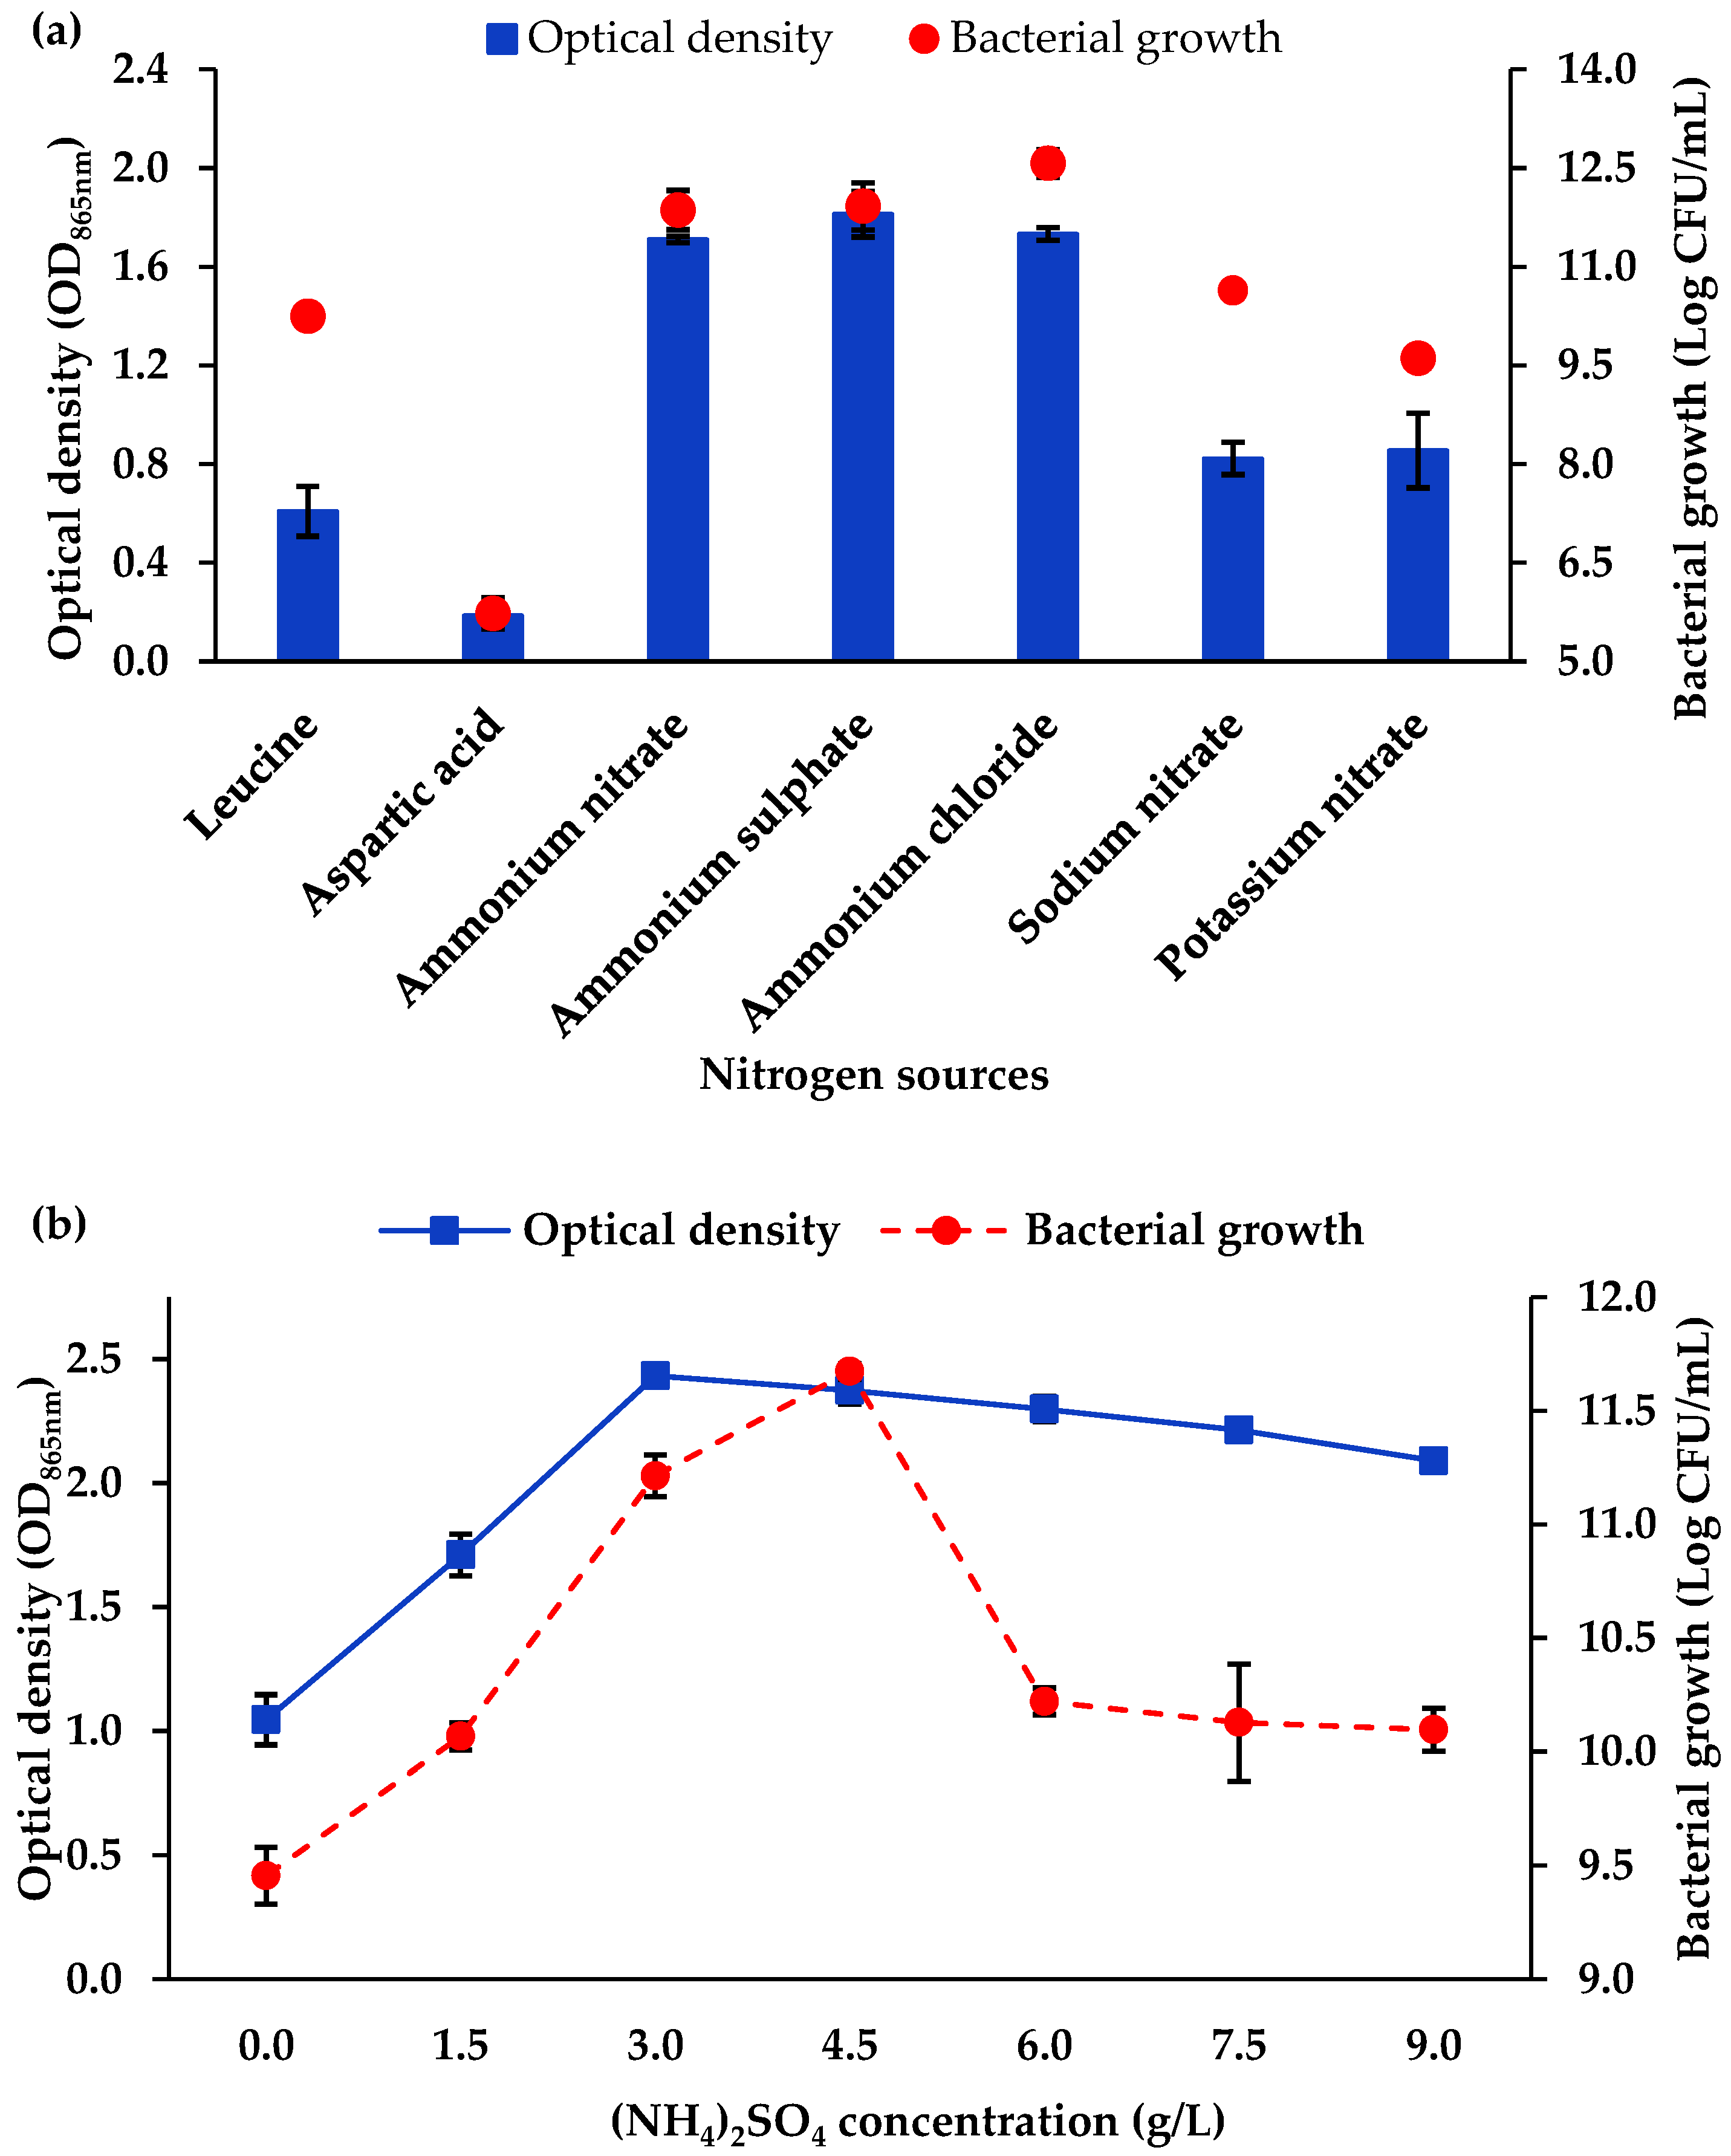
3.1.3. Nitrogen Source and Concentration

There were significant differences across all nitrogen sources in Mo reduction (one-way ANOVA, F6,14 = 231.3, p < 0.0001) and bacterial growth (one-way ANOVA, F6,14 = 315.1, p < 0.0001). The Greatest growth and OD were obtained using ammonium nitrate (NH4NO3), (NH4)2SO4 or ammonium chloride (NH4Cl) as a nitrogen source (Figure 4a). These nitrogen sources showed no significant differences between each other in Mo-blue production and bacterial growth (Tukey’s multiple comparison test). (NH4)2SO4 was selected for further experiments due to being the cheapest of the three sources and its availability in bulk.
The effects of varying concentrations of (NH4)2SO4 on growth and OD are shown in Figure 4b. One-way ANOVA showed significant differences in Mo reduction (F6,14 = 188.6, p < 0.0001) and bacterial growth (F6,14 = 114.9, p < 0.0001) across the nitrogen concentrations. Highest OD was observed at a concentration of 3.0 g/L and gradually decreased at higher concentrations. Mo-blue production at 3.0 g/L showed no significant difference from 4.5 and 6.0 g/L, but was significantly different from that at 0.0, 1.5, 7.5 and 9.0 g/L (Tukey’s multiple comparison test, all p < 0.01). This indicates that Mo reduction was not greatly affected by nitrogen concentration. However, bacterial growth was affected by the increasing nitrogen concentration, significantly declining at 6.0 g/L.

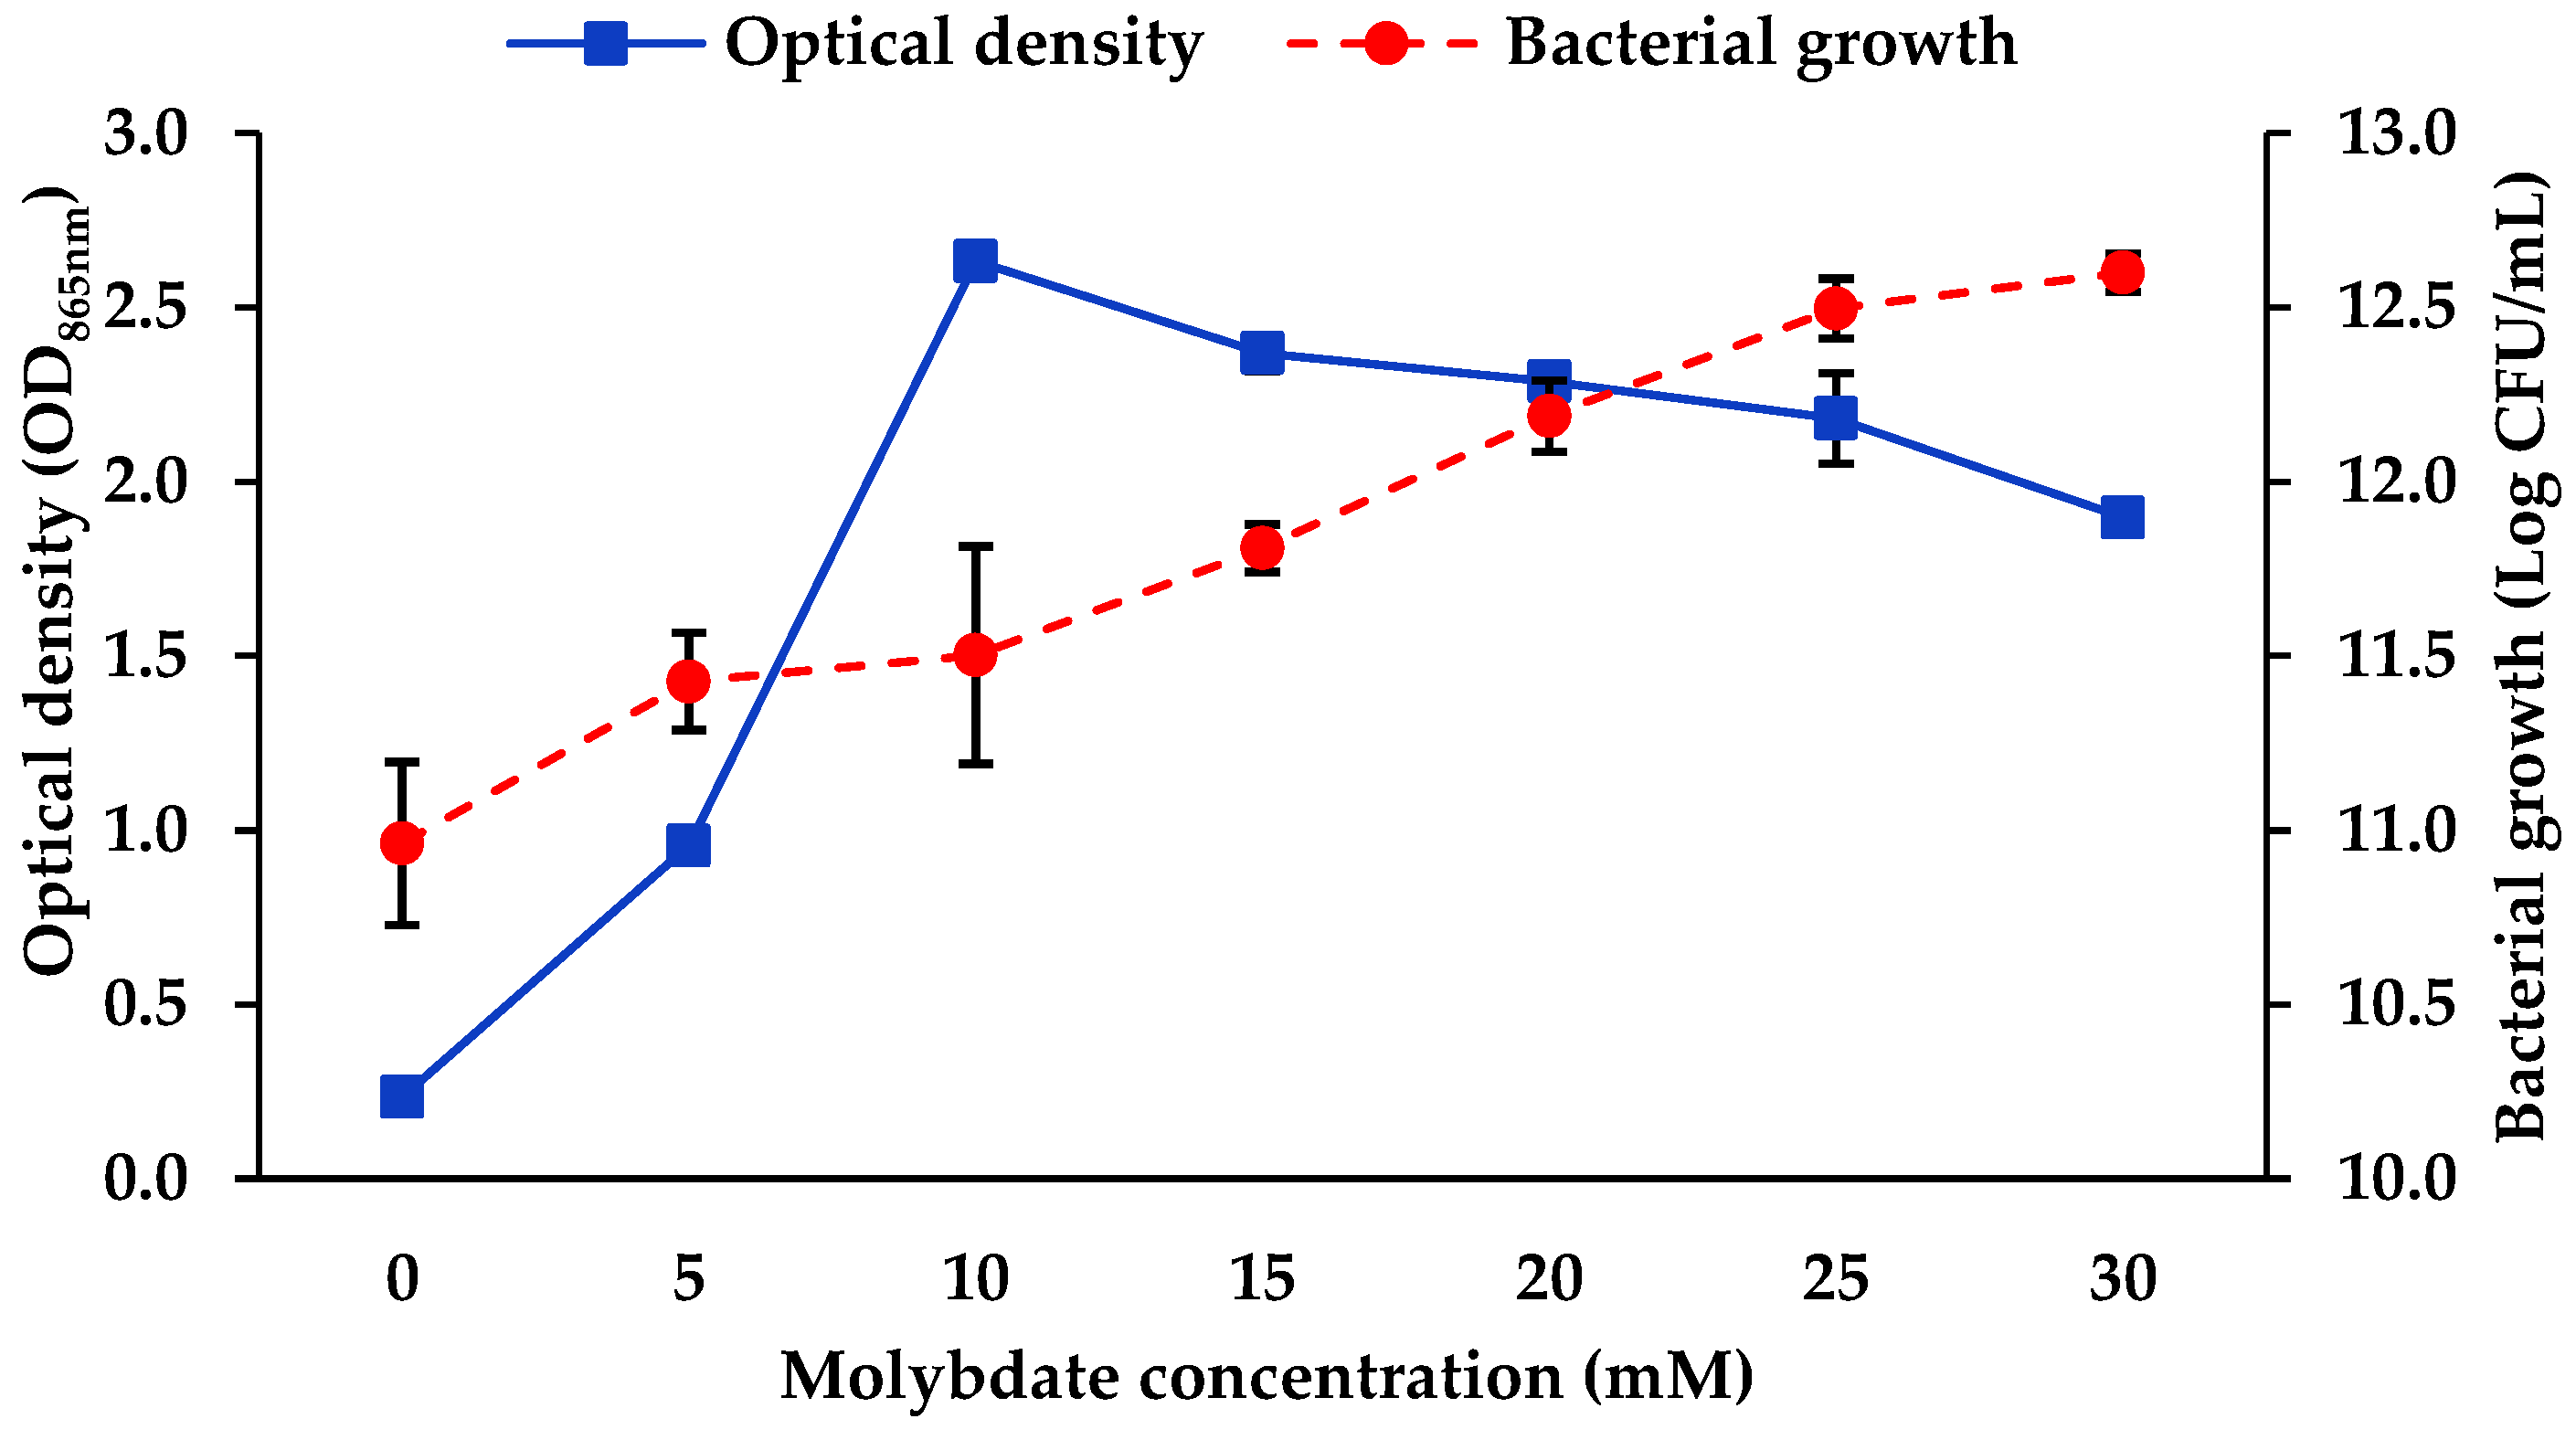
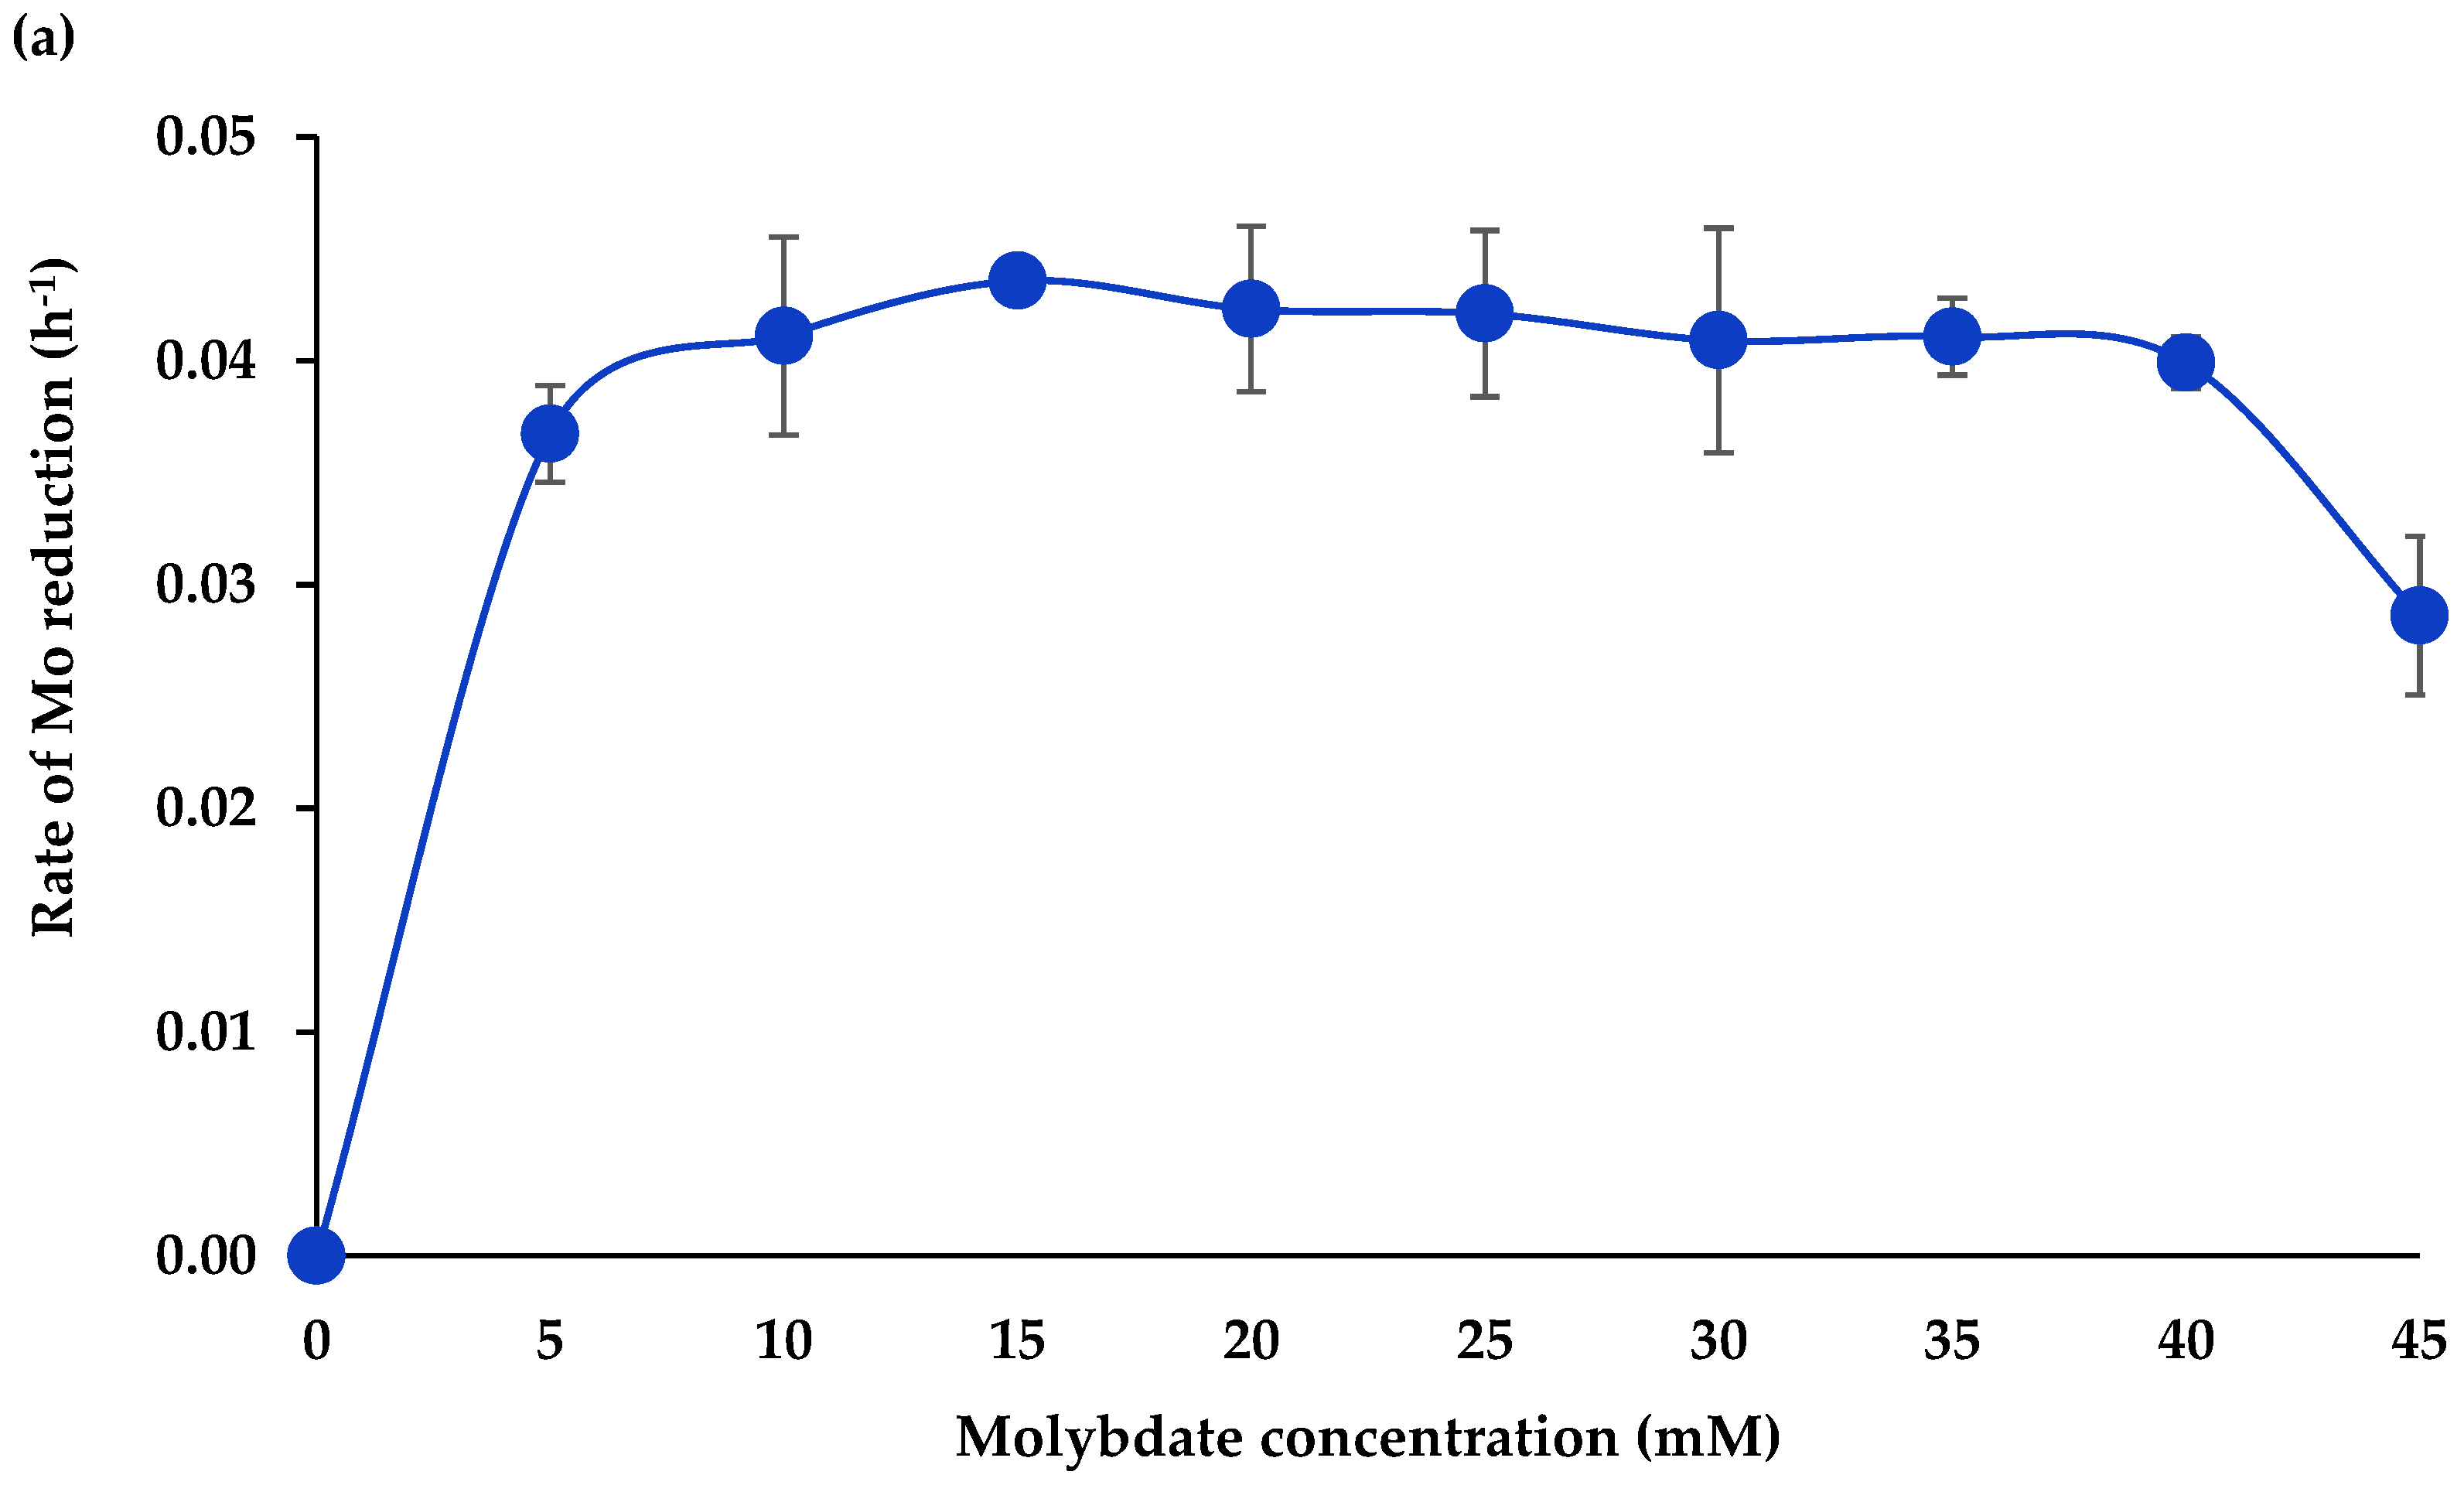
3.1.4. Molybdate Concentration
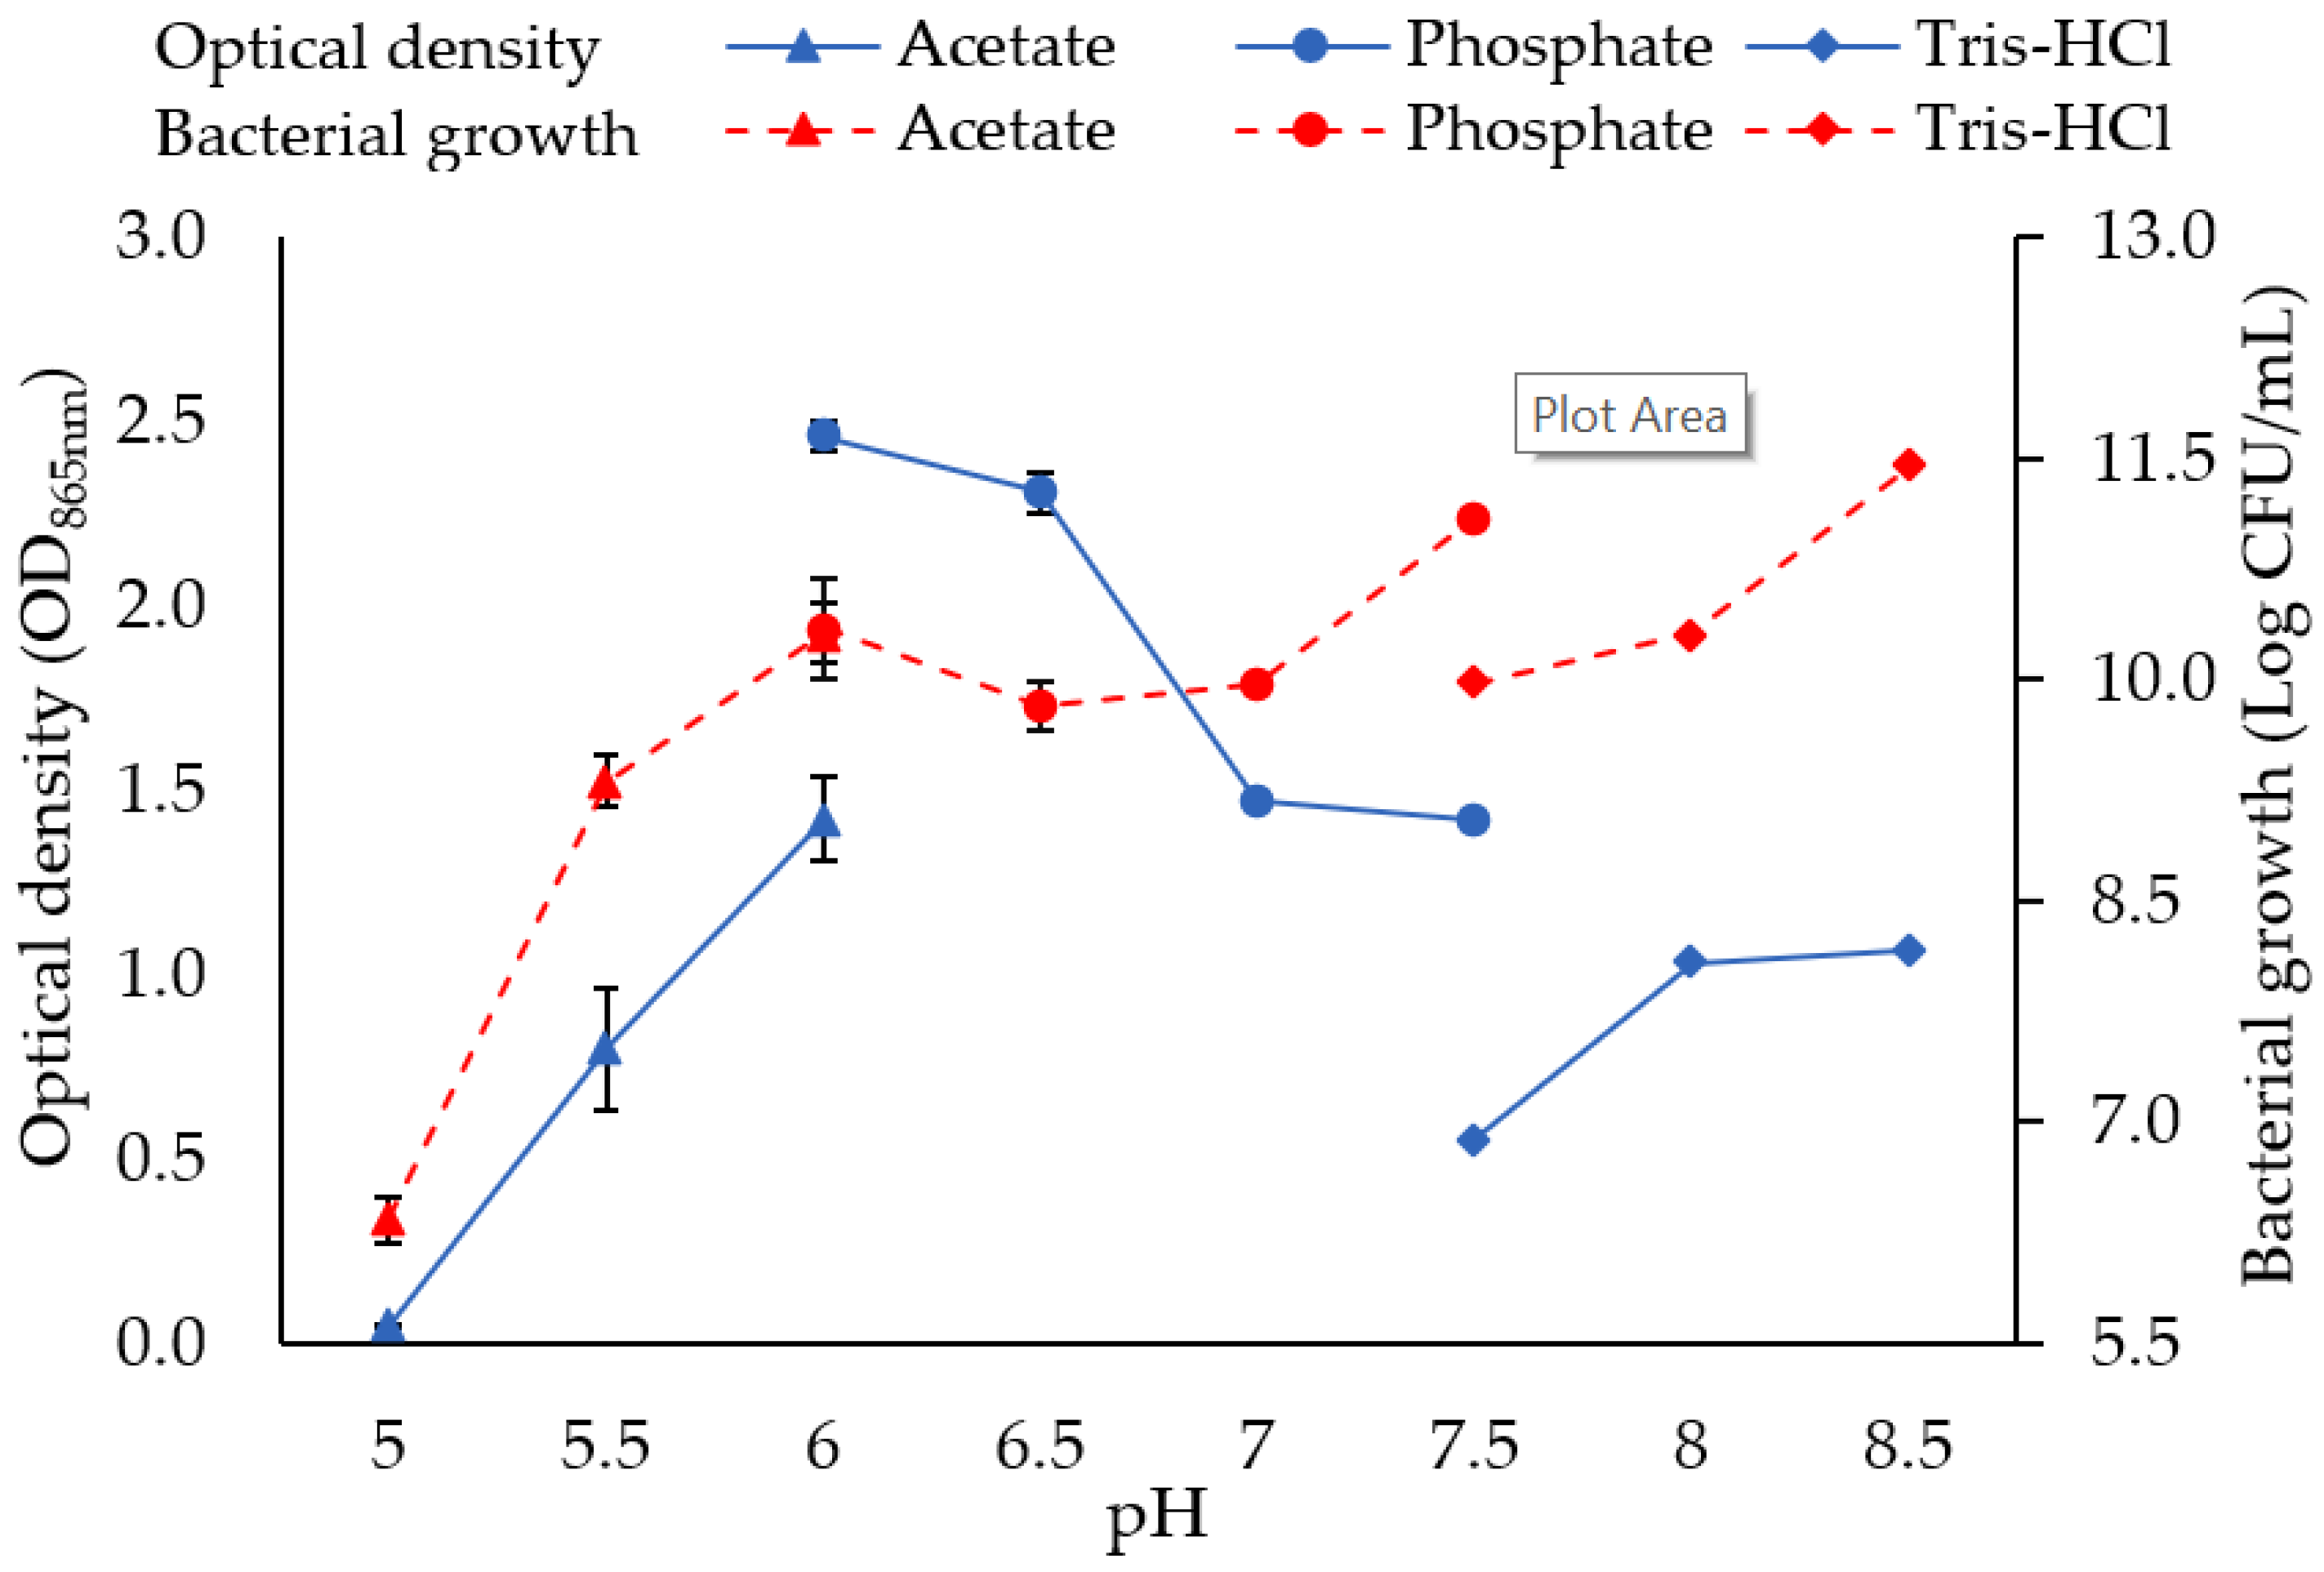
There were statistically significant differences between the various initial molybdate concentrations in both Mo reduction (one-way ANOVA, F6,13 = 654.9, p < 0.0001) and bacterial growth (one-way ANOVA, F6,14 = 20.45, p < 0.0001). Greatest OD was achieved at 10 mM initial concentration of molybdate, significantly greater than at 15 mM (Tukey’s pairwise comparison test, p < 0.05). OD reduced further as molybdate concentration increased beyond 15 mM. Bacterial growth increased consistently across all concentrations tested, indicating that strain AQ5-A9 can tolerate and even benefit from high concentrations of molybdate.

3.1.5. pH

There were significant differences across all pH levels tested in Mo reduction (one-way ANOVA, F9,20 = 203, p < 0.0001) and bacterial growth (one-way ANOVA, F9,20 = 125.4, p < 0.0001). The highest OD was observed in phosphate buffer at pH 6.0, followed by pH 6.5, although these were not significantly different (Tukey’s multiple comparison test). Lower ODs were obtained in both acetate and Tris-HCl buffer systems. The Greatest bacterial growth was observed in Tris-HCl buffer at pH 8.5 though this was not significantly different from that at pH 7.5 (Tukey’s multiple comparison test).

3.2. Statistical Optimisation of Mo Reduction Using RSM

Based on CCD experimental design, 86 experimental runs were proposed from six significant parameters, as determined using Plackett-Burman Design (PB) (data not shown). Table 2 shows the results of ANOVA of CCD on Mo-blue production by strain AQ5-A9 as measured by OD. The overall model was significant. The linear terms A, C, D, quadratic terms A2, B2, C2, D2, F2, and interactive terms AB, AE, BC, BE, BF, CE, DF, EF were significant. The remaining terms were not significant.
The 3D response surfaces were plotted using Design-Expert Software version 6.0.8 to visualise the interaction effects of pairs of variables while keeping the other variables at a constant level. Figure 7a–h represent eight significant interactions between pairs of variables on Mo reduction by strain AQ5-A9. Maximum Mo reduction is predicted at the highest point on each 3D surface plot in which the optimum values of the parameters were determined.
Figure 7a depicts the AB interaction with the highest OD observed at the salinity of 40 ppt and temperature of 10 °C while Figure 7b depicts the AE interaction with the highest OD displayed at the salinity of 47 ppt and molybdate concentration of 16 mM. Figure 7c shows the BC interaction resulting in the highest OD at a temperature of 16 °C and sucrose concentration of 1.8% while Figure 7d illustrates the BE interaction with the highest peak observed at a temperature of 10 °C and molybdate concentration of 18 mM. Figure 7e presents the BF interaction with the highest OD observed at a temperature of 11 °C and pH of 6.0, whereas Figure 7f shows the CE interaction with the highest OD observed at sucrose concentration of 1.8% and molybdate concentration of 16 mM. Figure 7g displays the DF interaction with the highest peak spotted at nitrogen concentration of 1.5 g/L and pH of 6.0. Figure 7h portrays the CE interaction with the highest Mo reduction seen at molybdate concentration of 16 mM and pH of 6.0.

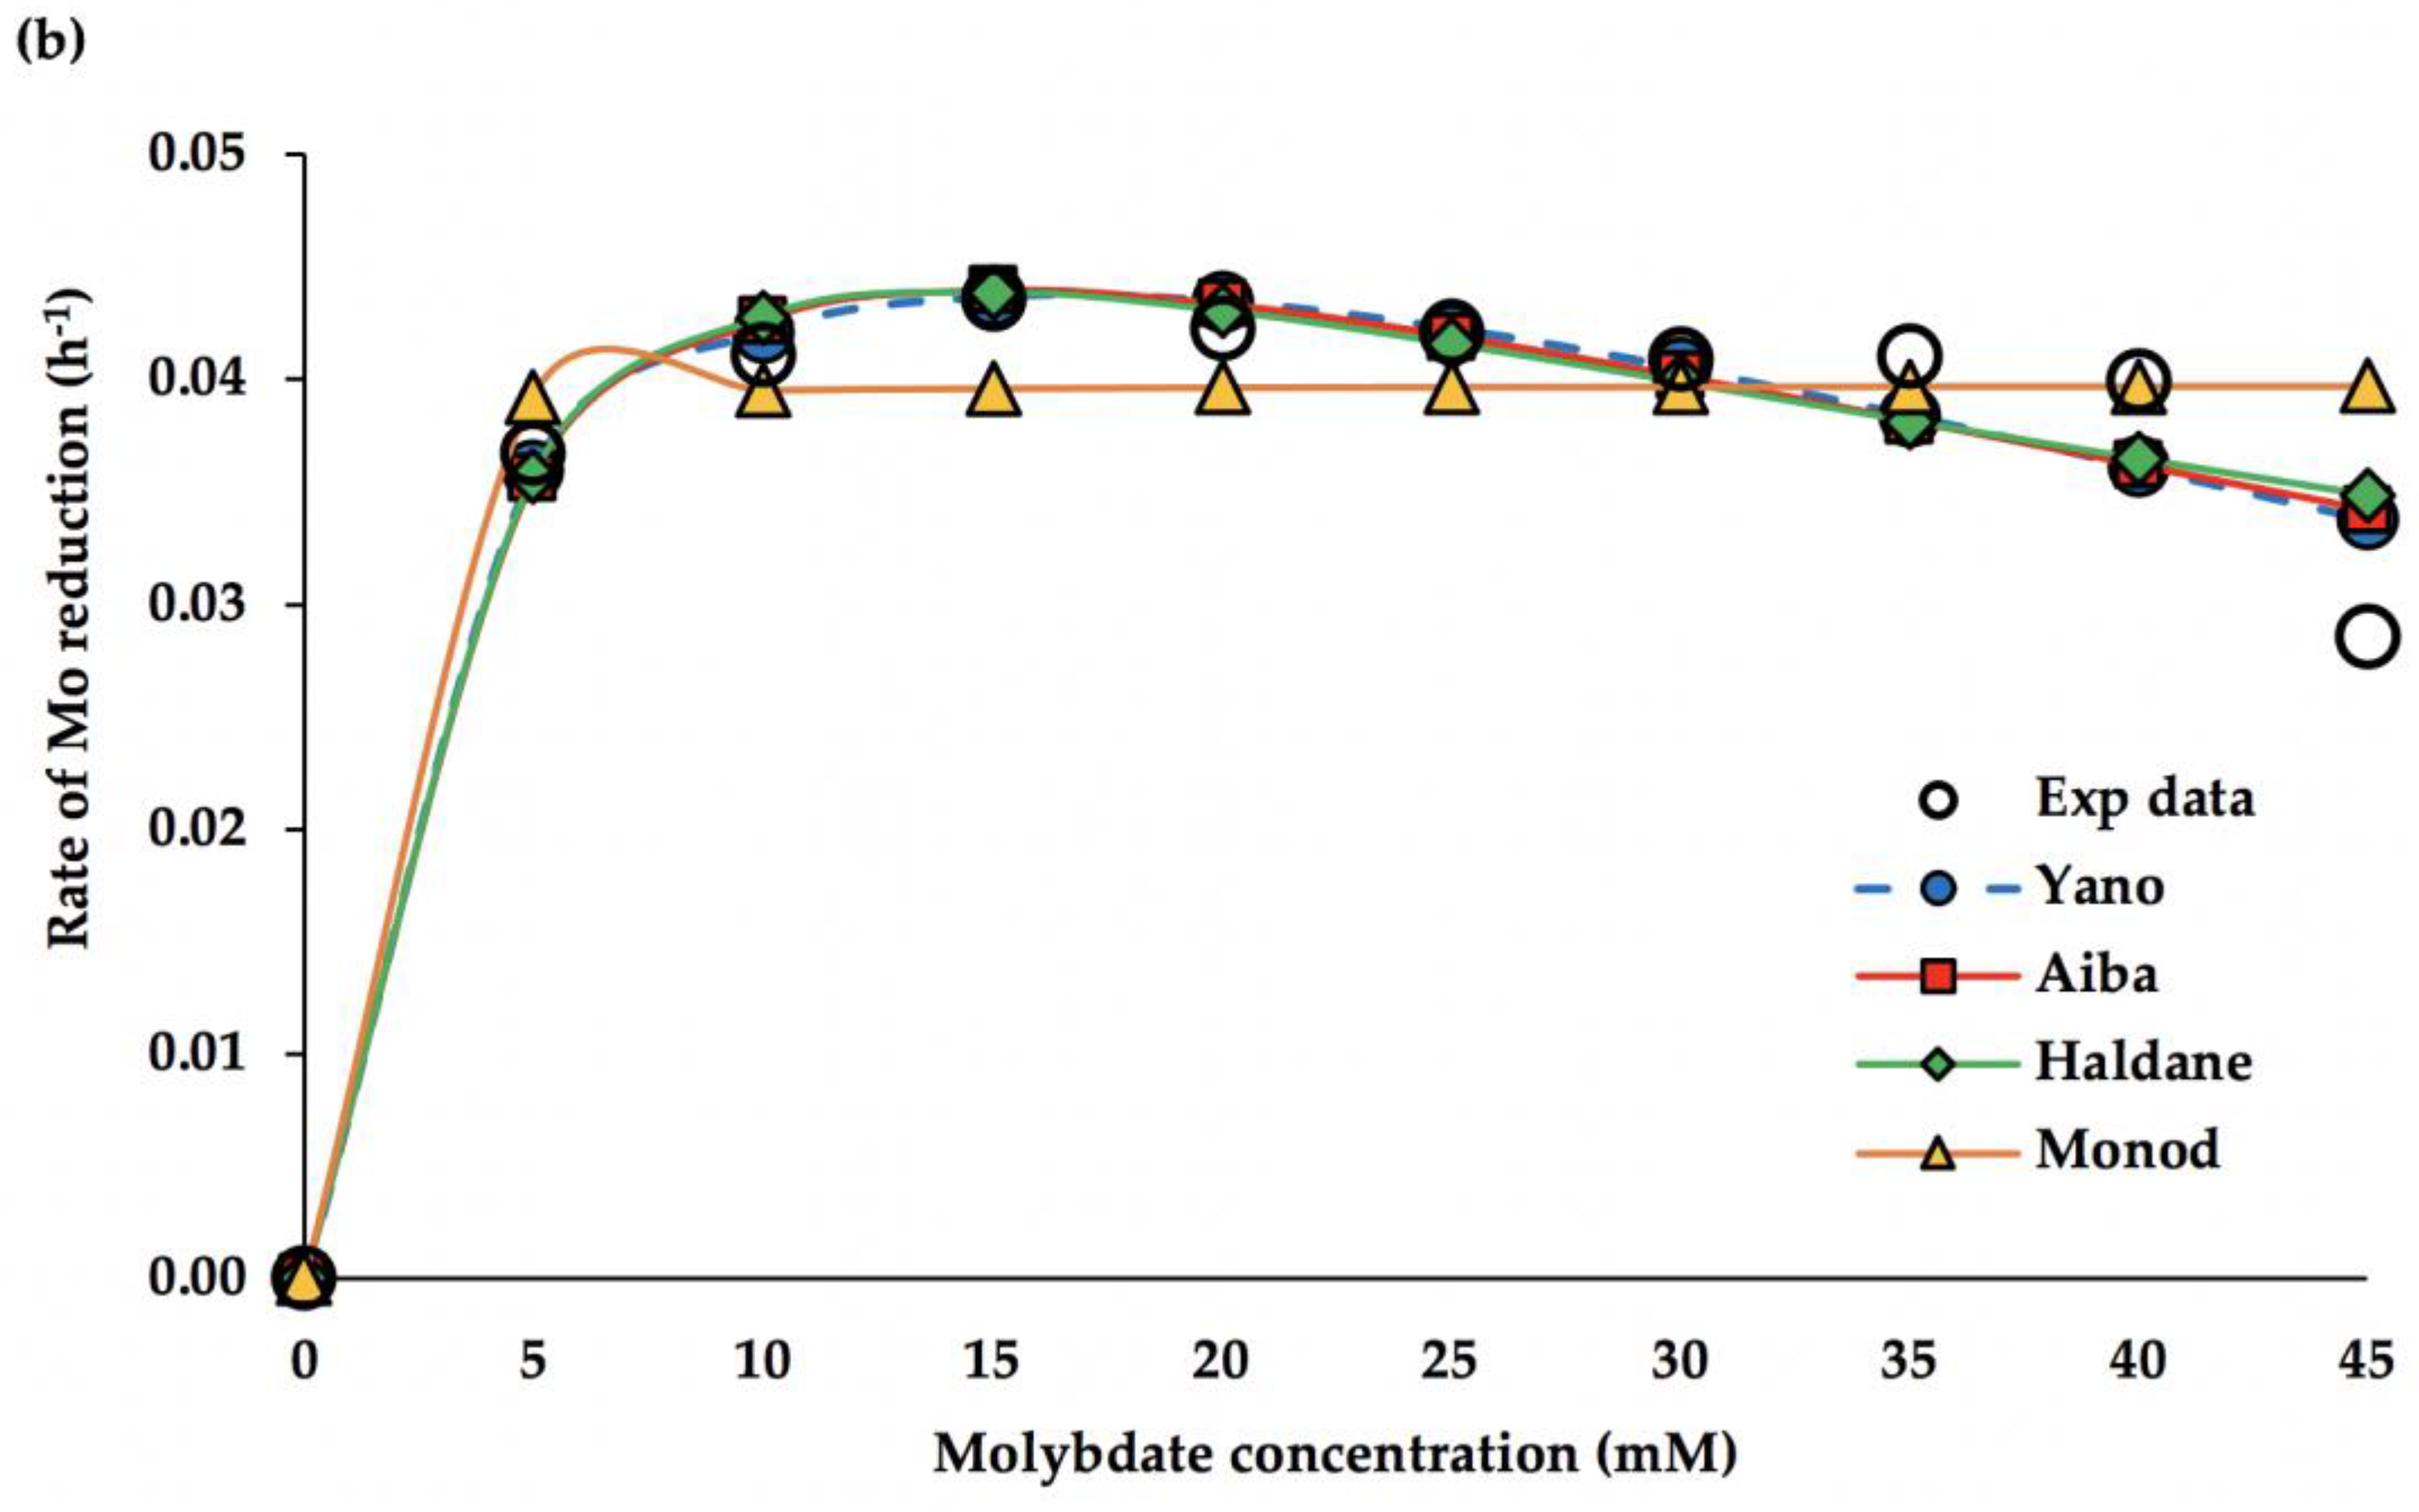
3.3. Kinetic Modelling

In this study, Figure 8a illustrates the rate of Mo reduction (h−1) by bacterial strain AQ5-A9 when exposed to various concentrations of molybdate. A steep incline in the rate of Mo reduction was seen from the concentration of 0 to 5 mM and the rate of reduction maintained until the concentration reaches 40 mM. A sharp decline in the rate of Mo reduction was seen at the concentration of 45 mM. Figure 8b illustrates the curve-fitting of experimental data of Mo reduction against four kinetic models (Aiba, Haldane, Monod and Yano). With the exception of the Monod model, the three remaining models fitted the experimental data well.
Table 3 shows the biokinetics constants of reduction from these models, the Aiba model giving marginally the best model fit. The calculated value for the coefficient of maximum Mo reduction rate (µmax) was 0.067 h−1. The half-saturation constant (Ks) and self-inhibition constant (Ki) were 3.845 mM and 75.620 mM, respectively. The reduction rate (µ) equation generated by the Aiba model using the obtained values is:
µ = 0.067   S S + 3.845   exp   ( S 75.62 )

4. Discussion

4.1. Optimisation of Mo Reduction Using OFAT

The study of microbial molybdate reduction to Mo-blue can contribute both to the advancement of bioremediation approaches and in developing understanding of microbial metal reduction. The application of bioremediation technologies in cold climates depends on the capability of microorganisms to degrade or transform pollutants in conditions that are generally regarded as suboptimal relative to those of temperate or tropical regions. However, as elsewhere, environmental variables such as pH, temperature, substrate concentrations and salinity are amongst the factors likely to be key influences in the efficiency of Mo reduction in cold regions [15,30].
The bacterial genus Marinomonas is halotolerant and has been widely reported in various marine environments, such as seawater or sea ice, and in association with marine animals [22,31]. Seawater generally has a salinity of 31–38 ppt, although it does vary between regions globally. In regions where ice formation is routine, such as around Antarctica, salt excluded during sea ice formation causes the formation of high-salinity and high-density water, which sinks and flows beneath the ice [32]. Most Marinomonas species are unable to grow in the absence of dissolved salt as they require Na+ for growth, but conversely can survive and grow in high salinity conditions of up to 120 ppt, more than three times that of normal seawater [31]. Based on the data obtained in this study, the optimal growth value of salinity of Marinomonas strain AQ5-A9 is around 50 ppt.
Psychrophilic microorganisms only grow in cold conditions. Meanwhile, psychrotolerant microorganisms, while they can tolerate cold conditions, have a relatively broad temperature range for growth [33]. A number of studies have reported that Marinomonas species can grow in a wide range of temperatures between 4 °C and 37 °C with some being able to survive in chronically cold environments, such as in the polar regions [21,34,35]. Strain AQ5-A9 shows the characteristics of psychrotolerance, as reported for many microorganisms isolated from Antarctic environments. Ahmad et al. [17] stated that terrestrial soil bacteria isolated from King George Island similarly had an optimum temperature for Mo reduction between 10 and 20 °C [17], while Lee et al. [30] reported an optimum temperature of 10 to 15 °C. In contrast, studies of Mo-reducing tropical bacteria revealed optimum temperatures between 35 and 40 °C for Mo reduction [36,37]. Clearly, Marinomonas strain AQ5-A9 has evolved adaptations to cold conditions, likely to include considerable structural and physiological adjustments, including distinctive membrane lipid composition [38].
Simple carbon sources like glucose and sucrose are commonly favoured by microorganisms. Mo reduction is associated with growth and requires enzymes(s) from bacterial metabolism; hence, it is best supported by the same simple carbohydrates that sustain most bacterial metabolism and growth [37]. These substrates are preferred as electron donors as they can produce reducing equivalents for NADH and NADPH and are the substrates for Mo-reducing enzymes [19,39]. Studies have reported that optimum sugar concentrations are between 1.0 and 2.5% [17,36]. At higher sugar concentrations, the observed decrease in Mo reduction is likely a result of osmotic stress.
Nitrogen is a major nutrient that is vital for all living organisms. The most effective nitrogen source in any given circumstance depends both on its bioavailability in the environment and the ability of microorganisms to metabolise it. Potential nitrogen sources are often abundant components in the environment, particularly in human-impacted areas where nitrogen-based fertilisers often in the form of ammonium salts are widely used in agriculture. A number of studies have reported that (NH4)2SO4 is the most suitable nitrogen source for Mo-reducing bacteria [17,40]. However, a high concentration of (NH4)2SO4 can also lead to detrimental effects on the growth of microorganisms.
The concentration of molybdate has an important influence on the formation of the intermediate phosphomolybdate species before being converted to Mo-blue, and higher than optimal molybdate concentrations can inhibit Mo-blue production [17,19]. In tropical Mo-reducing bacteria, the optimum molybdate concentration is between 20 and 80 mM [39], although Ghani et al. [19] reported that the tropical bacterium Enterobacter cloacae strain 48 could tolerate and reduce sodium molybdate at a concentration as high as 200 mM. Ahmad et al. [17] reported that an Mo-reducing Antarctic soil bacterium (Pseudomonas sp. strain DRY1) had an optimum molybdate concentration between 30 and 60 mM.
The optimal pH depends on bacterial species and their ability to regulate acid and base levels intracellularly. The pH of Antarctic seawater is typically slightly alkaline, between pH 7.5 and 8.5. This is consistent with the pH responses of bacterial growth observed here, with growth in the buffer Tris-HCl at pH 8.5 being greatest. However, in the phosphate buffer system at pH 6.0, the reduction of Mo was greatest, consistent with other studies that have shown that the optimum initial pH for Mo reduction is slightly acidic to neutral [17,39,41]. This is because phosphomolybdate is highly unstable at neutral and alkaline pH [42]. Under acidic conditions, molybdate is converted to polymolybdates and lowering the pH induces the formation of phosphomolybdates [43]. Phosphorus is also known to play a vital role in many processes in living organisms, in particular playing crucial roles in energy transfer, metabolic regulation for gene transfer, cell division and protein activation [44,45]. This may explain the increase in bacterial growth in the phosphate buffer system, which was significantly higher than in the Tris-HCl buffer system at comparable pH.

4.2. Optimisation of Mo Reduction Using RSM

4.2.1. Statistical Analyses of RSM

Table 3 shows the statistical analysis of quadratic models applying to Mo reduction. The analysis confirmed that the fitted model was highly significant and provided a good fit to the experimental data. The analysis identified that three factors, A (salinity), C (carbon concentration) and D (nitrogen concentration), had a significant influence on Mo reduction. Salinity is a significant factor in this study because of the disposition of the marine bacterium that is receptive to the salt content while carbon, as well as nitrogen source. were significant to the response as they are the essential substrates for Mo reduction and bacterial metabolism.
The analysis also confirmed that three factors, namely B (temperature), E (molybdate concentration) and F (pH), were insignificant to the Mo reduction. Although the bacterial strain was isolated from the Antarctic seawater, its metabolism was not largely affected by the temperature due to its ability to thrive in a wide range of temperatures. Molybdate concentration and pH were also not significant to the reduction as the experimental range (Table 1) did not include the inhibitive concentration of the substrate and is within the acidic condition for reduction, respectively.

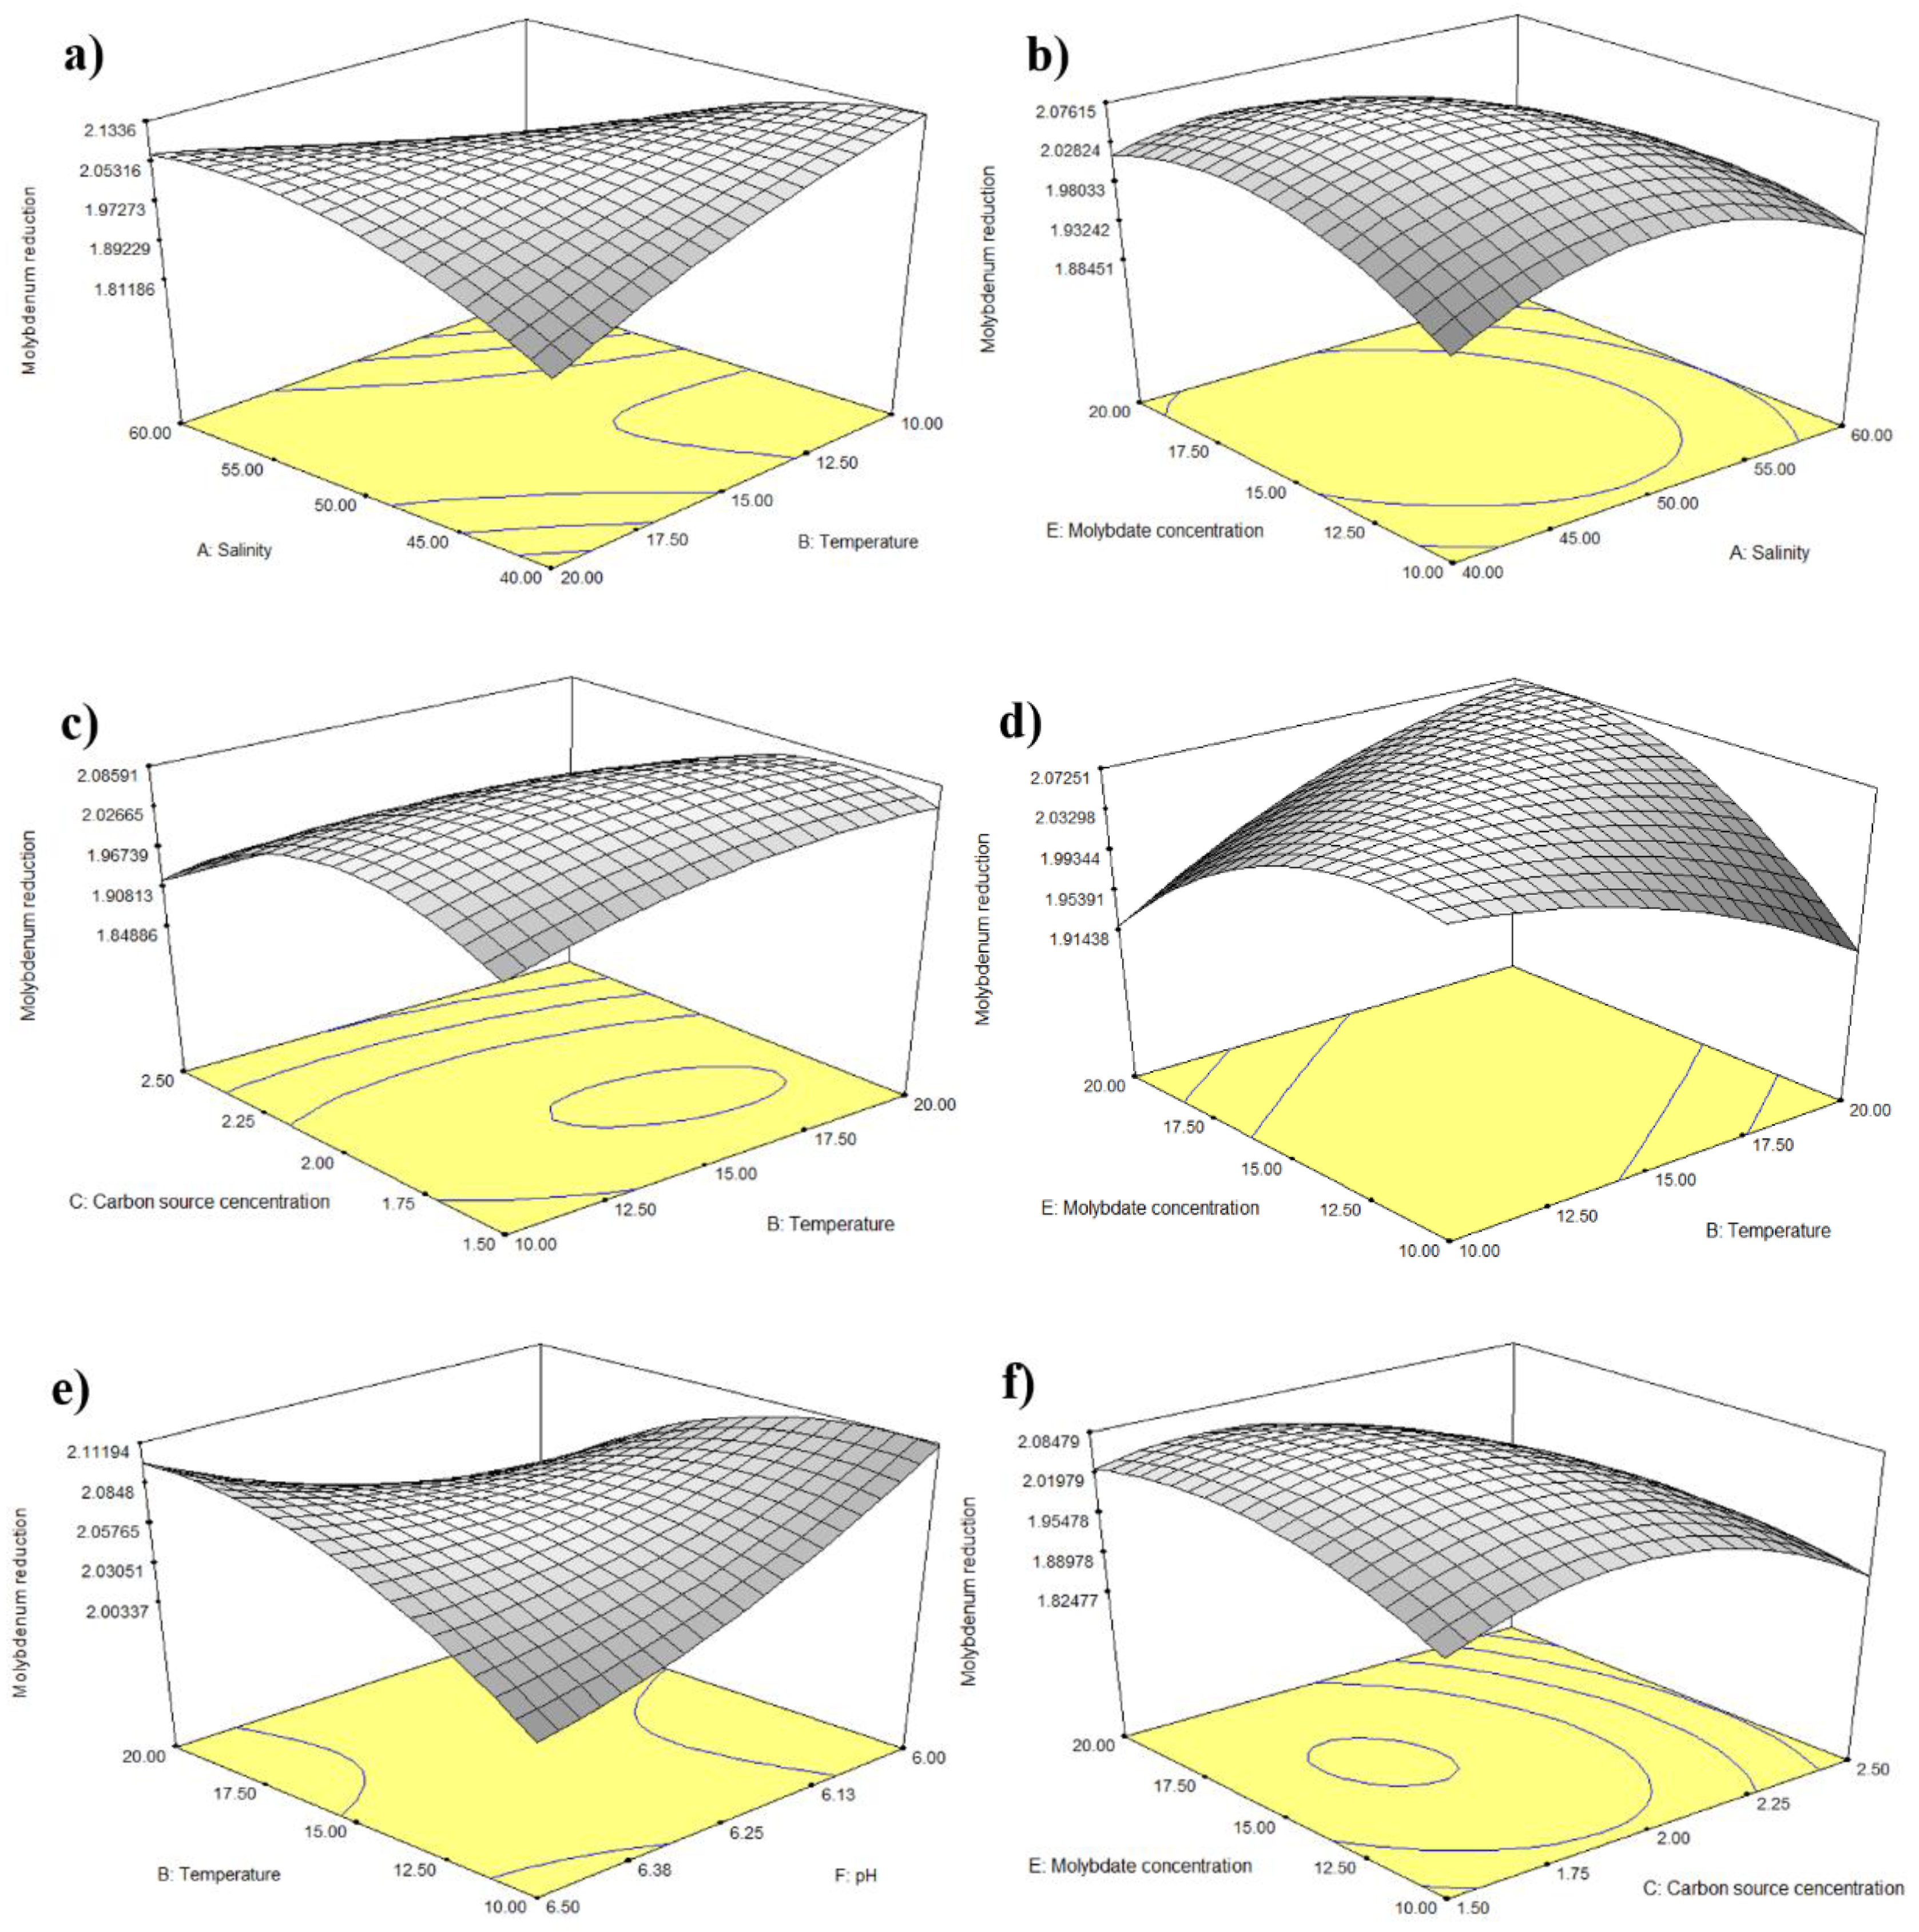
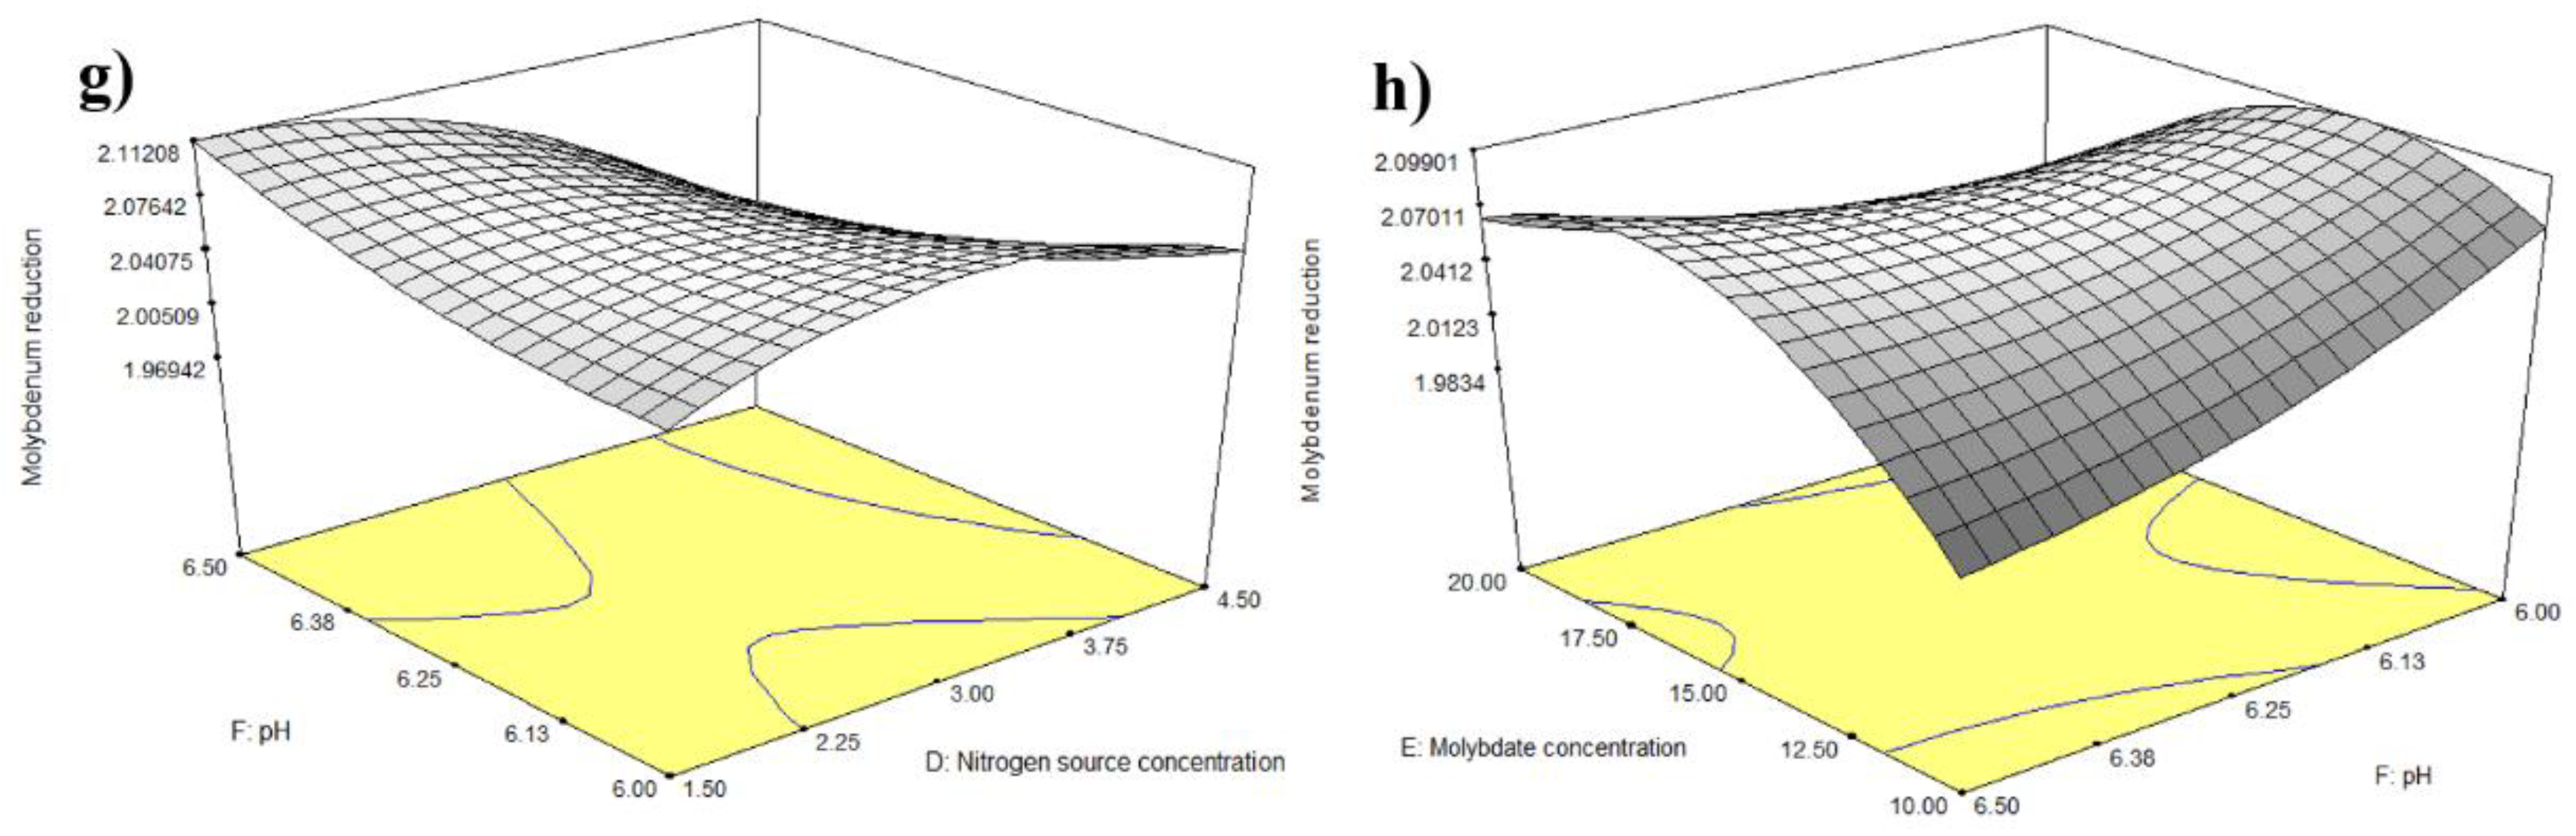
4.2.2. Response Surface Plot of Pairwise Parameter Interactions

Figure 7a,d show the interaction between the pairs of variables, AB, and BE, respectively. These figures illustrate the optimum temperature for strain AQ5-A9 ranging from 10 to 20 °C, confirming its psychrotolerant characteristics. This supports the potential use of this strain for Mo reduction in cold regions during summertime [46]. Zhou et al. [47] stated that the presence of a clear peak in the centre of a response surface plot suggests a mutual relationship between the two variables, as depicted in Figure 7b,c,f. Figure 7b illustrates the interaction between salinity and molybdate concentration, with optimum Mo reduction between 40 and 50 ppt salinity and 15.0 and 17.5 mM molybdate concentration. Increasing the salinity above 50 ppt reduced the reduction of Mo. As noted above, varying salinity results in osmotic and specific ion effects on microorganisms, affecting their activity and biomass [38,48].
Figure 7c shows the interaction between carbon concentration and temperatures. Optimum reduction of Mo was predicted between 1.75 and 2.0% sucrose concentration and temperatures of 15.0 to 17.5 °C. This temperature range is again consistent with the studied Marinomonas strain being psychrotolerant [21,49]. Figure 7f identified the same optimum sucrose concentration in the interaction with molybdate concentration, with the latter optimum between 15.0 and 17.5 mM.
Figure 7e,g,h illustrate the interactions between pH, temperature, nitrogen concentration and molybdate concentration, respectively. All three plots illustrate similar downward trending curves, consistent with the effects of pH on bacterial growth and Mo reduction. Sidgwick [50] reported that the formation of 12-molybdophosphates (12-MP) and heteropolymolybdates requires an acidic environment due to the instability of the compounds at neutral and high pH. However, members of the genus Marinomonas have been reported to favour neutral to slightly alkaline conditions for growth [21,51], consistent with the second peak as the pH increased to 6.5 shown in Figure 7h. Figure 7g suggests that optimum (NH4)2SO4 concentration is between 1.50 to 2.25 g/L while Figure 7h shows an increase in Mo reduction between 12.5 to 17.5 mM molybdate concentration with reduction at higher concentration. Both Figure 7g,h illustrate substrate inhibition at concentrations of (NH4)2SO4 and molybdate exceeding 2.25 g/L and 17 mM, respectively. Substrate inhibition is well-known at higher nitrogen and molybdate concentrations owing to their toxicity to the cell [19,39,52,53].

4.3. Comparison of Optimised Conditions between OFAT and RSM

The predicted optimised conditions for Mo reduction by strain AQ5-A9 using both conventional OFAT and statistical RSM approaches were compared. The data presented in Table 4 suggest that RSM provides a better approach to reducing molybdate as the Mo-blue production in OFAT was 2.459 after an eight-day incubation while RSM shortened the incubation to four days and achieved an OD of 2.201. The optimum conditions predicted by RSM for sucrose and (NH4)2SO4 concentration were lower than those predicted from OFAT, which could reduce expenditure. Under RSM, the optimum initial concentration of molybdate was increased slightly from 15 mM to 16 mM.

4.4. Kinetic Study of Mo Reduction

In this part of the study, the reduction rate of Mo was obtained by subjecting strain AQ5-A9 to various molybdate concentrations. The statistical analysis and biokinetic constants are indicated in Table 3. All models predicted the maximum specific reduction rate per hour, µmax, and Ks (half-saturation constant, mM), Ki (inhibition constant, mM) except for Monod and k constants for Yano. In overview (Figure 8a), the substrate reduction declined, which confirmed the inhibition of substrate from the increase in concentration starting at 40 mM. The Aiba model provided mathematically (but marginally) the best fit to the experimental data, although virtually identical fits were provided by the Haldane and Yano models, with only the Monod model being poorer. The Aiba model is a widely accepted model for use in substrate inhibition kinetics. At high toxic substrate concentration, the specific reduction rate of an organism may be hindered. Therefore, the Aiba model was developed to deliver a suitable fit of µ against S for reduction at high levels of substrate [54]. The model introduces a third constant, Ki, which deals with specific rate inhibition at low and high substrate concentration [55].
Few kinetic studies have attempted to model Mo-blue production in bacteria, with none addressing Mo reduction in Antarctic marine bacteria. Othman et al. [56] used a tropical bacterium strain A.rzi isolated from soil, reporting the Luong model as the best model. However, the Luong model is not suitable for application in the current study, as it includes an additional term to account for complete growth inhibition of bacteria at maximum substrate concentration [57].

5. Conclusions

This study is the first to apply statistical experimental design to optimise Mo reduction, utilizing a psychrotolerant marine bacterium, Marinomonas sp. strain AQ5-A9, isolated from Antarctic waters. The results obtained support RSM being an effective tool for optimising environmental factors to improve Mo reduction in comparison with the conventional OFAT approach. The application and evaluation of kinetic modelling helped to determine the reduction constants, laying a solid foundation for further use of this microorganism in treating high concentrations of Mo. Ongoing studies of enzyme extraction from Mo-reducing bacteria will further improve the application of such bacteria in the Antarctic region.

Author Contributions

Conceptualization, S.A.A., A.Z. and C.G.-F.; methodology, S.A.A. and S.D.; software, S.D., K.N.M.Z. and K.A.K.; validation, S.A.A., S.D., P.C. and S.S.; formal analysis, S.D., S.A.A., K.N.M.Z. and K.A.K.; investigation, S.D.; resources, S.A.A. and C.G.-F.; data curation, A.Z.; writing—original draft preparation, S.D. and K.N.M.Z.; writing—review and editing, S.A.A., A.Z.; S.S., C.G.-F., P.C. and K.A.K.; supervision, S.A.A., A.Z.; S.S., C.G.-F., P.C. and K.A.K.; project administration, S.A.A.; funding acquisition, S.A.A. and C.G.-F. All authors have read and agreed to the published version of the manuscript.

Funding

This research was funded by Universiti Putra Malaysia, grant number PUTRA-Berimpak (9660000) and Centro de Investigacion y Monitoreo Ambiental Antàrctico (CIMAA). P. Convey is supported by NERC core funding to the British Antarctic Survey’s ‘Biodiversity, Evolution and Adaptation’ Team. The APC was funded by Universiti Putra Malaysia. We also thank Universiti Putra Malaysia for providing a GRF scholarship to S. Darham.

Acknowledgments

The authors would like to thank Universiti Putra Malaysia, Centro de Investigacion y Monitoreo Ambiental Antàrctico (CIMAA), Sultan Mizan Antarctic Research Foundation (YPASM), Universidad de Magallanes, Chilean Army and the Antarctic General Bernardo O’Higgins Station: Teniente Coronel Jose Ignacio Alvarado Camps, the Comandante de la sección de exploracion y rescate O’higgins; Capitan René Salgado Rebolledo and the staff; especially Sargento Segundo Flavio Marcelo Nahuelcoy Perez, Sargento Segundo Augusto Antonio Barra Morale and Sargento Segundo Claudio Durand Ibacache. Sultan Mizan Antarctic Research Foundation and National Antarctic Research Centre. This paper also contributes to the international SCAR research programme ‘State of the Antarctic Ecosystem’.

Conflicts of Interest

The authors declare no conflict of interest.

References

  1. United Nations Environmental Protection/Global Program of Action. Why the Marine Environment Needs Protection from Heavy Metals; UNEP/GPA Coordination Officer, United Nations Environment Programme: Nairobi, Kenya, 2004. [Google Scholar]
  2. Zakaria, N.N.; Roslee, A.F.A.; Gomez-Fuentes, C.; Zulkharnain, A.; Abdulrasheed, M.; Sabri, S.; Ramirez-Moreno, N.; Calisto-Ulloa, N.; Ahmad, S.A. Kinetic studies of marine psychrotolerant microorganisms capable of degrading diesel in the presence of heavy metals. Rev. Mex. Ing. Quím. 2020, 19, 1375–1388. [Google Scholar] [CrossRef]
  3. Rowley, P.D.; Williams, P.L.; Pride, D.E. Petroleum and mineral resources of Antarctica. In Mineral Occurrences of Antarctica; U.S. Geological Survey Circular; Behrendt, J.C., Ed.; United States Department of the Interior: Washington, DC, USA, 1983; pp. 25–49. [Google Scholar]
  4. Hong, S.; Soyol-Erdene, T.O.; Hwang, H.J.; Hong, S.B.; Hur, S.D.; Motoyama, H. Evidence of global-scale As, Mo, Sb, and Tl atmospheric pollution in the Antarctic snow. Environ. Sci. Technol. 2012, 46, 11550–11557. [Google Scholar] [CrossRef] [PubMed]
  5. Yang, N.; Welch, K.A.; Mohajerin, T.J.; Telfeyan, K.; Chevis, D.A.; Grimm, D.A.; Lyons, W.B.; White, C.D.; Johannesson, K.H. Comparison of arsenic and molybdenum geochemistry in meromictic lakes of the McMurdo dry valleys, Antarctica: Implications for oxyanion-forming trace element behavior in permanently stratified lakes. Chem. Geol. 2015, 404, 110–125. [Google Scholar] [CrossRef]
  6. Santos, I.R.; Silva-Filho, E.V.; Schaefer, C.E.G.R.; Albuquerque-Filho, M.R.; Campos, L.S. Heavy metal contamination in coastal sediments and soils near the Brazilian Antarctic station, King George island. Mar. Pollut. Bull. 2005, 50, 185–194. [Google Scholar] [CrossRef] [PubMed]
  7. Barra, F.; Alcota, H.; Rivera, S.; Valencia, V.A.; Munizaga, F.; Maksaev, V. Timing and formation of porphyry Cu-Mo mineralization in the Chuquicamata district, northern Chile: New constraints from the Toki cluster. Miner. Deposita 2013, 48, 629–651. [Google Scholar] [CrossRef]
  8. Claridge, G.G.; Campbell, I.B.; Powell, H.K.; Amin, Z.H.; Balks, M.R. Heavy metal contamination in some soils of the McMurdo Sound region, Antarctica. Antarct. Sci. 1995, 7, 9–14. [Google Scholar] [CrossRef] [Green Version]
  9. Novotny, J.A.; Peterson, C.A. Molybdenum. Adv. Nutr. 2018, 9, 272–273. [Google Scholar] [CrossRef]
  10. Bompart, G.; Pécher, C.; Prévot, D.; Girolami, J.P. Mild renal failure induced by subchronic exposure to molybdenum: Urinary kallikrein excretion as a marker of distal tubular effect. Toxicol. Lett. 1990, 52, 293–300. [Google Scholar] [CrossRef]
  11. Fungwe, T.V.; Buddingh, F.; Demick, D.S.; Lox, C.D.; Yang, M.T.; Yang, S.P. The role of dietary molybdenum on estrous activity, fertility, reproduction, and molybdenum and copper enzyme activities of female rats. Nutr. Res. 1990, 10, 515–524. [Google Scholar] [CrossRef]
  12. Kovalskiy, V.V.; Yarovaya, G.A.; Shmavonyan, D.M. Changes of purine metabolism in man and animals under conditions of molybdenum biogeochemical provinces. Zhurnal Obs. Biol. 1961, 22, 179–191. (In Russian) [Google Scholar]
  13. Walravens, P.A.; Moure-Eraso, R.; Solomons, C.C.; Chappell, W.R.; Bentley, G. Biochemical abnormalities in workers exposed to molybdenum dust. Arch. Environ. Health 1979, 34, 302–308. [Google Scholar] [CrossRef]
  14. Tengku-Mazuki, T.A.; Subramanian, K.; Zakaria, N.N.; Convey, P.; Khalil, K.A.; Lee, G.L.Y.; Zulkharnain, A.; Shaharuddin, N.A.; Ahmad, S.A. Optimization of phenol degradation by Antarctic bacterium Rhodococcus sp. Antarc. Sci. 2020, 32, 486–495. [Google Scholar] [CrossRef]
  15. Roslee, A.F.A.; Zakaria, N.N.; Convey, P.; Zulkharnain, A.; Lee, G.L.Y.; Gomez-Fuentes, C.; Ahmad, S.A. Statistical optimisation of growth and diesel degradation by the Antarctic bacterium, Rhodococcus sp. strain AQ5-07. Extremophiles 2020, 24, 277–291. [Google Scholar] [CrossRef] [PubMed]
  16. Verasoundarapandian, G.; Darham, S.; Ahmad, S.A. Toxicity of molybdenum and microbial application in molybdenum reduction for bioremediation: A mini review. Malays. J. Biochem. Mol. Biol. 2019, 22, 46–51. [Google Scholar]
  17. Ahmad, S.A.; Shukor, M.Y.; Shamaan, N.A.; MacCormack, W.P.; Syed, M.A. Molybdate reduction to molybdenum blue by an Antarctic bacterium. BioMed Res. Int. 2013, 2013, 871941. [Google Scholar] [CrossRef] [PubMed]
  18. Campbell, A.M.; del Campillo-Campbell, A.; Villaret, D.B. Molybdate reduction by Escherichia coli K-12 and its chl mutants. Proc. Natl. Acad. Sci. USA 1985, 82, 227–231. [Google Scholar] [CrossRef] [PubMed] [Green Version]
  19. Ghani, B.; Takai, M.; Hisham, N.Z.; Kishimoto, N.; Ismail, A.K.M.; Tano, T.; Sugio, T. Isolation and characterization of a Mo6+ reducing bacterium. Appl. Environ. Microbiol. 1993, 59, 1176–1180. [Google Scholar] [CrossRef] [Green Version]
  20. Darham, S.; Gomez-Fuentes, C.; Zulkharnain, A.; Sabri, S.; Calisto-Ulloa, N.; Ramírez-Moreno, N.; Ahmad, S.A. Isolation and identification of molybdenum-reducing cold-adapted marine bacteria isolated from Bernardo O’Higgins riquelme base station, Antarctica. Malays. J. Biochem. Mol. Biol. 2019, 22, 8–15. [Google Scholar]
  21. Gupta, P.; Chaturvedi, P.; Pradhan, S.; Delille, D.; Shivaji, S. Marinomonas polaris sp. nov., a psychrohalotolerant strain isolated from coastal sea water off the subantarctic Kerguelen islands. Int. J. Syst. Bacteriol. 2006, 56, 361–364. [Google Scholar] [CrossRef]
  22. Zhang, D.C.; Li, H.R.; Xin, Y.H.; Liu, H.C.; Chen, B.; Chi, Z.M.; Zhou, P.J.; Yu, Y. Marinomonas arctica sp. nov., a psychrotolerant bacterium isolated from the Arctic. Int. J. Syst. Evolut. Microbiol. 2008, 58, 1715–1718. [Google Scholar] [CrossRef]
  23. Khuri, A.I.; Mukhopadhyay, S. Response surface methodology. Wiley Interdiscip. Rev. Comput. Stat. 2010, 2, 128–149. [Google Scholar] [CrossRef]
  24. Ibrahim, S.; Khalil, K.A.; Zahri, K.N.M.; Gomez-Fuentes, C.; Convey, P.; Zulkharnain, A.; Sabri, S.; Alias, S.A.; González-Rocha, G.; Ahmad, S.A. Biosurfactant production and growth kinetics studies of the waste canola oil-degrading bacterium Rhodococcus erythropolis AQ5-07 from Antarctica. Molecules 2020, 25, 3878. [Google Scholar] [CrossRef] [PubMed]
  25. Abdulrasheed, M.; Zulkharnain, A.; Zakaria, N.N.; Roslee, A.F.A.; Khalil, K.A.; Napis, S.; Convey, P.; Gomez-Fuentes, C.; Ahmad, S.A. Response surface methodology optimization and kinetics of diesel degradation by a cold-adapted Antarctic bacterium, Arthrobacter sp. strain AQ5-05. Sustainability 2020, 12, 6966. [Google Scholar] [CrossRef]
  26. Haldane, J.B.S. Enzymes. In Monographs and Biochemistry; Plimmer, R.H.A., Hopkins, F.G., Eds.; Longmans and Green: London, UK, 1930; pp. 905–942. [Google Scholar]
  27. Monod, J. The growth of bacterial cultures. Annu. Rev. Microbiol. 1949, 3, 371–394. [Google Scholar] [CrossRef] [Green Version]
  28. Aiba, S.; Shoda, M.; Nagatani, M. Kinetics of product inhibition in alcohol fermentation. Biotechnol. Bioeng. 1968, 10, 845–864. [Google Scholar] [CrossRef]
  29. Yano, T.; Koga, S. Dynamic behavior of the chemostat subject to substrate inhibition. J. Gen. Appl. Microbiol. 1973, 19, 97–114. [Google Scholar] [CrossRef]
  30. Lee, G.L.Y.; Ahmad, S.A.; Yasid, N.A.; Zulkharnain, A.; Convey, P.; Johari, W.L.W.; Alias, S.A.; Gonzalez-Rocha, G.; Shukor, M.Y. Biodegradation of phenol by cold-adapted bacteria from Antarctic soils. Polar Biol. 2018, 41, 553–562. [Google Scholar] [CrossRef]
  31. Macián, M.C.; Arahal, D.R.; Garay, E.; Pujalte, M.J. Marinomonas aquamarina sp. nov., isolated from oysters and sea water. Syst. Appl. Microbiol. 2005, 28, 145–150. [Google Scholar] [CrossRef]
  32. Gordon, A.L.; Visbeck, M.; Huber, B. Export of Weddell sea deep and bottom water. J. Geophys. Res. 2001, 106, 9005–9017. [Google Scholar] [CrossRef]
  33. Sandle, T.; Skinner, K. Study of psychrophilic and psychrotolerant microorganisms isolated in cold rooms used for pharmaceutical processing. J. Appl. Microbiol. 2012, 114, 1166–1174. [Google Scholar] [CrossRef]
  34. Gilbert, J.A.; Davies, P.L.; Laybourn-Parry, J. A hyperactive, Ca2+-dependent antifreeze protein in an Antarctic bacterium. FEMS Microbiol. Lett. 2005, 245, 67–72. [Google Scholar] [CrossRef] [Green Version]
  35. Dong, C.; Bai, X.; Lai, Q.; Xie, Y.; Chen, X.; Shao, Z. Draft genome sequence of Marinomonas sp. strain D104, a plycyclic aromatic hydrocarbon-degrading bacterium from the deep-sea sediment of the Arctic Ocean. Genome Announc. 2014, 2, e01211–e01213. [Google Scholar] [CrossRef] [Green Version]
  36. Halmi, M.I.E.; Zuhainis, S.W.; Yusof, M.T.; Shaharuddin, N.A.; Helmi, W.; Shukor, Y.; Syed, M.A.; Ahmad, S.A. Hexavalent molybdenum reduction to Mo-blue by a sodium-dodecyl-sulfate-degrading Klebsiella oxytoca strain DRY14. BioMed Res. Int. 2013, 2013, e384541. [Google Scholar] [CrossRef] [PubMed]
  37. Sabullah, M.K.; Rahman, M.F.; Ahmad, S.A.; Sulaiman, M.R.; Shukor, M.S.; Shamaan, N.A.; Shukor, M.Y. Assessing resistance and bioremediation ability of Enterobacter sp. strain saw-1 on molybdenum in various heavy metals and pesticides. J. Math. Fund. Sci. 2017, 49, 193–210. [Google Scholar] [CrossRef] [Green Version]
  38. Poli, A.; Finore, I.; Romano, I.; Gioiello, A.; Lama, L.; Nicolaus, B. Microbial diversity in extreme marine habitats and their biomolecules. Microorganisms 2017, 5, 25. [Google Scholar] [CrossRef] [Green Version]
  39. Adnan, A.S.M.; Zeid, I.M.A.; Ahmad, S.A.; Halmi, M.I.E.; Abdullah, S.R.S.; Masdor, N.A.; Shukor, M.S.; Shukor, M.Y. A molybdenum-reducing Bacillus sp. strain Zeid 14 in soils from Sudan that could grow on amides and acetonitrile. Malays. J. Soil Sci. 2016, 20, 111–134. [Google Scholar]
  40. Shukor, M.Y.; Habib, S.H.M.; Rahman, M.F.A.; Jirangon, H.; Abdullah, M.P.A.; Shamaan, N.A.; Syed, M.A. Hexavalent molybdenum reduction to molybdenum blue by S. marcescens strain Dr. Y6. Appl. Biochem. Biotechnol. 2008, 149, 33–43. [Google Scholar] [CrossRef] [PubMed]
  41. Glenn, J.L.; Crane, F.L. Studies on metalloflavoproteins: V. The action of silicomolybdate in the reduction of cytochrome c by aldehyde oxidase. Biochim. Biophys. Acta 1956, 22, 111–115. [Google Scholar] [CrossRef]
  42. Krishnan, C.V.; Garnett, M.; Chu, B. Influence of pH and acetate on the self-assembly process of (NH4)42[MoVI72MoV60O372(CH3COO)30(H2O)72].ca.300H2O. Int. J. Electrochem. Sci. 2008, 3, 1299–1315. [Google Scholar]
  43. Sabullah, M.K.; Rahman, M.F.; Ahmad, S.A.; Sulaiman, M.R.; Shukor, M.S.; Shamaan, N.A.; Shukor, M.Y. Isolation and characterization of a molybdenum-reducing and glyphosate-degrading Klebsiella oxytoca strain saw-5 in soils from Sarawak. Agrivita 2016, 38, 1–13. [Google Scholar] [CrossRef]
  44. Rubio, V.; Linhares, F.; Solano, R.; Martín, A.C.; Iglesias, J.; Leyva, A.; Paz-Ares, J. A conserved MYB transcription factor involved in phosphate starvation signaling both in vascular plants and in unicellular algae. Genes Develop. 2020, 15, 2122–2133. [Google Scholar] [CrossRef] [Green Version]
  45. Walker, J.; Skou, J.C.; Boyer, P.D. Adenosine Triphosphate. Available online: https://www.britannica.com/science/adenosine-triphosphate (accessed on 12 March 2020).
  46. Lee, J.Y.; Lim, H.S.; Yoon, H.I. Thermal characteristics of soil and water during summer at King Sejong station, King George Island, Antarctica. Geosci. J. 2016, 20, 503–516. [Google Scholar] [CrossRef]
  47. Zhou, J.; Yu, X.; Ding, C.; Wang, Z.; Zhou, Q.; Pao, H.; Cai, W. Optimization of phenol degradation by Candida tropicalis Z-04 using Plackett-Burman design and response surface methodology. J. Environ. Sci. 2011, 23, 22–30. [Google Scholar] [CrossRef]
  48. Yan, N.; Marschner, P.; Cao, W.; Zuo, C.; Qin, W. Influence of salinity and water content on soil microorganisms. Int. Soil. Water Conserv. Res. 2015, 3, 316–323. [Google Scholar] [CrossRef] [Green Version]
  49. Morita, R.Y.; Moyer, C.L. Origins of psychrophiles. In Encyclopedia of Biodiversity; Levin, S.A., Colwell, R., Daily, G., Lubchenco, J., Mooney, H.A., Schulze, E.D., Tilman, G.D., Eds.; Academic Press: San Diego, CA, USA, 2001; Volume 4, pp. 917–924. [Google Scholar]
  50. Sidgwick, N.V. The Chemical Elements and Their Compounds; Clarendon Press: Oxford, UK, 1984. [Google Scholar]
  51. Ivanova, E.P.; Onyshchenko, O.M.; Christen, R.; Lysenko, A.M.; Zhukova, N.V.; Shevchenko, L.S.; Kiprianova, E.A. Marinomonas pontica sp. nov., isolated from the Black Sea. Int. J. Syst. Evolut. Microbiol. 2005, 55, 275–279. [Google Scholar] [CrossRef] [PubMed]
  52. Carmichael, L.M.; Pfaender, F.K. The effect of inorganic and organic supplements on the microbial degradation of phenanthrene and pyrene in soils. Biodegradation 1997, 8, 1–13. [Google Scholar] [CrossRef] [PubMed]
  53. Chaîneau, C.H.; Rougeux, G.; Yéprémian, C.; Oudot, J. Effects of nutrient concentration on the biodegradation of crude oil and associated microbial populations in the soil. Soil Biol. Biochem. 2005, 37, 1490–1497. [Google Scholar] [CrossRef]
  54. Dutta, K.; Dasu, V.; Mahanty, B.; Prabhu, A. Substrate inhibition growth kinetics for cutinase producing Pseudomonas cepacia using tomato-peel extracted cutin. Chem. Biochem. Eng. Q. 2015, 29, 437–445. [Google Scholar] [CrossRef]
  55. Muloiwa, M.; Nyende-Byakika, S.; Dinka, M. Comparison of unstructured kinetic bacterial growth models. S. Afr. J. Chem. Eng. 2020, 33, 141–150. [Google Scholar] [CrossRef]
  56. Othman, A.R.; Bakar, N.A.; Halmi, M.I.E.; Johari, W.L.W.; Ahmad, S.A.; Jirangon, H.; Syed, M.A.; Shukor, M.Y. Kinetics of molybdenum reduction to molybdenum blue by Bacillus sp. strain A.rzi. BioMed Res. Int. 2013, 2013, 371058. [Google Scholar] [CrossRef] [Green Version]
  57. Mulchandani, A.; Luong, H.T.; Groom, C. Substrate inhibition kinetics for microbial growth and synthesis of poly-β-hydroxybutyric acid by Alcaligenes eutrophus ATCC 17697. Appl. Microbiol. Technol. 1989, 33, 11–17. [Google Scholar] [CrossRef]
Figure 1. Molybdate reduction and growth of strain AQ5-A9 in saline LPM at different salinities (ppt). Error bars represent mean ± standard deviation for the three replicates.
Jmse 09 00648 g001
Figure 2. Molybdate reduction and growth of strain AQ5-A9 in saline LPM at different culture temperatures (°C). Error bars represent mean ± standard deviation for the three replicates.
Jmse 09 00648 g002
Figure 3. The effects of different (a) carbon sources at the initial concentration of 1.0%; (b) different concentrations of sucrose in saline LPM on Mo reduction and growth of strain AQ5-A9 at 15 °C. Error bars represent the mean ± standard deviation for the three replicates.
Jmse 09 00648 g003
Figure 4. (a) The effects of different nitrogen sources at an initial concentration of 3.0 g/L on bacterial growth and OD; (b) The effects of different concentrations of (NH4)2SO4 in saline LPM on bacterial growth and OD of strain AQ5-A9 at 15 °C with 2.0% sucrose as electron donor. Error bars represent mean ± standard deviation for the three replicates.
Jmse 09 00648 g004
Figure 5. The effects of various concentrations of molybdate (mM) on bacterial growth and OD of strain AQ5-A9 at 15 °C in saline LPM with 2.0% sucrose as electron donor. Error bars represent mean ± standard deviation for the three replicates.
Jmse 09 00648 g005
Figure 6. The effects of pH (using an overlapping buffer system) on bacterial growth and OD at 15 °C in saline LPM with 2.0% sucrose as electron donor. Error bars represent mean ± standard deviation for the three replicates.
Jmse 09 00648 g006
Figure 7. Three-dimensional response surface plots showing the significant interactions between pairs of variables on molybdate reduction by strain AQ5-A9. (a) AB; (b) AE; (c) BC; (d) BE; (e) BF; (f) CE; (g) DF; (h) EF.
Jmse 09 00648 g007aJmse 09 00648 g007b
Figure 8. The effect of (a) a molybdate concentration on Mo reduction rate; (b) Curve-fitting of experimental Mo reduction rate for strain AQ5-A9 against various kinetic models.
Jmse 09 00648 g008aJmse 09 00648 g008b
Table 1. Experimental ranges of six different variables tested in CCD.
VariablesSymbolExperimental Values
−2−10+1+2
Salinity (ppt)A21.7240.050.060.078.28
Temperature (°C)B0.8610.015.020.029.14
Carbon concentration (%)C0.591.52.02.53.41
Nitrogen concentration (g/L)D−1.241.53.04.57.24
Mo concentration (mM)E0.8610.015.020.029.14
pHF5.546.06.256.56.96
Table 2. Analysis of variance (ANOVA) of Mo reduction by strain AQ5-A9 with CCD 1.
SourceSum of Squares(Degrees of Freedom)
DF
Mean SquareF-ValueProb > F
Model4.12160.1615.46<0.0001 ***
A0.08910.0899.120.0035 **
B0.0001510.000150.0150.9041
C0.3610.3636.99<0.0001 ***
D0.0910.099.210.0034 **
E0.0006710.000670.00660.7977
F0.004510.00450.450.5067
A20.5410.5453.63<0.0001 ***
B20.08510.0858.380.0053 **
C20.9710.9795.69<0.0001 ***
D20.1610.1615.80.0002 ***
E20.3710.370.37<0.0001 ***
F20.02310.0232.290.1359
AB1.0411.04103.07<0.0001 ***
AC0.02610.0262.580.1135
AD0.0016510.001650.160.6873
AE0.06310.0636.480.0132 *
AF0.0008110.000810.080.7785
BC0.08210.0828.380.0051 **
BE0.3410.3434.75<0.0001 ***
BF0.1410.1414.010.0004 ***
CD0.008410.00840.830.3654
CE0.07310.0737.270.0091 **
DE0.01210.0121.150.2883
DF0.09110.0919.290.0039 **
EF0.08810.0889.030.0044 **
Residual0.59580.01
Lack of Fit0.52490.0111.370.3194
Pure Error0.06990.0077
Cor Total4.885
Standard deviation0.10R20.8780
Mean1.82Adjusted R20.8213
Coefficient variance5.52Predicted R20.6272
Predicted residual error sum of square1.79Adequate Precision19.347
1 A: Salinity (ppt); B: Temperature (°C); C: Sucrose concentration (%); D: Nitrogen concentration (g/L); E: Molybdate concentration (mM); F: pH. * p < 0.05, ** p < 0.01, *** p < 0.001.
Table 3. Statistical analysis and biokinetic constants of Mo reduction kinetic models for strain AQ5-A9.
ModelDFRMSER2Adj R2 µmax (h−1)Ks (mM)Ki (mM)KAICc
Aiba70.00290.9520.9520.0673.8575.6-−114.7
Haldane70.00310.9470.9470.0694.1650.7-−113.7
Yano60.00300.9520.9520.0532.3383380.47−111.8
Monod80.00450.8960.8830.0400.06--−107.7
Table 4. Comparison of optimised conditions between OFAT and RSM.
VariablesOFATRSM
Salinity (ppt)50.047.0
Temperature (°C)15.016.0
Carbon concentration (%)2.01.8
Nitrogen concentration (g/L)3.02.25
Molybdate concentration (mM)15.016.0
pH (phosphate buffer)6.06.0
Incubation period (day)84
Mo-blue production (OD865nm)2.4592.201
Publisher’s Note: MDPI stays neutral with regard to jurisdictional claims in published maps and institutional affiliations.

