Article

Design and Automated Optimization of an Internal Turret Mooring System in the Frequency and Time Domain

1
Daewoo Shipbuilding & Marine Engineering Co., Ltd., 3370 Geoje-daero, Geoje-si 100180, Korea
2
Korea Research Institute of Ships and Ocean Engineering, Daejeon 34103, Korea
*
Author to whom correspondence should be addressed.
J. Mar. Sci. Eng. 2021, 9(6), 581; https://doi.org/10.3390/jmse9060581
Submission received: 4 May 2021 / Revised: 21 May 2021 / Accepted: 26 May 2021 / Published: 27 May 2021
(This article belongs to the Special Issue Design and Analysis of Offshore Structures)

Abstract

:
A cost-effective mooring system design has been emphasized for traditional offshore industry applications and in the design of floating offshore wind turbines. The industry consensus regarding mooring system design is mainly inhibited by previous project experience. The design of the mooring system also requires a significant number of design cycles. To take aim at these challenges, this paper studies the application of an optimization algorithm to the Floating Production Storage and Offloading (FPSO) mooring system design with an internal turret system at deep-water locations. The goal is to minimize mooring system costs by satisfying constraints, and an objective function is defined as the minimum weight of the mooring system. Anchor loads, a floating body offset and mooring line tensions are defined as constraints. In the process of optimization, the mooring system is analyzed in terms of the frequency domain and time domain, and global and local optimization algorithms are also deployed towards reaching the optimum solution. Three cases are studied with the same initial conditions. The global and local optimization algorithms successfully find a feasible mooring system by reducing the mooring system cost by up to 52%.

1. Introduction

Due to the desire for cost-effective energy, people have developed floating bodies such as offshore platforms in the traditional oil and gas industry and floating wind turbines in the renewable energy industry in order to seek energy sources at sea. The floating bodies have been installed in deep seas, and a mooring system design is important for station keeping them. The main purpose of the mooring system is to limit the maximum horizontal offset of the floating bodies, and to reduce the extreme forces acting on the mooring system by adjusting mooring line stiffness at appropriate values. In general, a stiffer mooring system has less maximum horizontal offset but higher mooring line tension, and vice versa. Chakrabarti noted the historical development of offshore structures and the mooring system design [1]. Guidelines by Det Norske Veritas GL (DNVGL), Bureau Veritas (BV) and the American Petroleum Institute (API) described the design criteria and analysis methodology of the mooring system, considering external forces acting on the floating bodies [2,3,4].
A mooring system has many design variables, the characteristics of which are highly dependent on the project and site specifications. These design variables include the mooring line materials, line configurations and mooring layout, and the mooring system response is highly affected by the selected variables. Currently, choosing such design values requires an iterative analysis process that is extremely time-consuming. Even in actual projects, finding a mooring system that meets the specific design criteria depends mainly on the experience gained from previous projects, and is generally done via a large number of trial-and-error sequences [5]. Thus, formal optimization approaches must systemically find solutions that fulfill all defined design criteria, and at a low cost.
In addition, a mooring system takes up considerable resources in terms of the Levelized Cost Of Energy (LCOE) for ocean renewable energy converters and offshore wind turbines [6,7,8]. The mooring system can take up to 20–30% of the total construction cost of the wave energy converters [8]. Furthermore, as offshore wind turbines are installed in deeper waters to harness steadier and stronger winds with less visual impact, the mooring system cost is dramatically increased, as it must be able to withstand the harsh environmental conditions of the ocean. Therefore, the high cost of the mooring system hinders the commercialization of renewable energy converters, and it is essential to reduce the mooring system cost to a competitive level, while satisfying the design constraints at a minimum level.
In order to address the needs of optimization in a mooring system, Fylling (1977) investigated the application of an optimization method into the design procedures of a mooring system in a frequency domain and proved that the optimization method is a powerful tool for the conceptual design of a mooring system in the early stage [9]. Later, Fylling and Kleiven (2000) added a riser system, and riser properties were also included in mooring system optimization [10]. A different optimization algorithm was also used depending on the objective function. Fylling and Berthelsen used the gradient method to optimize the cost of offshore wind turbines by considering the mooring line load, fatigue life, cable curvature, nacelle acceleration and maximum vessel offset [11]. Shafieefar and Rezvani (2007) implemented a Genetic Algorithm (GA) based on the concepts of Darwin’s theory of evolution to minimize the offset of a floating body using a frequency domain analysis tool. Even though frequency domain analysis is an efficient and powerful tool in the early stages of mooring system design, it is less accurate than the time domain analysis since it linearizes nonlinear vessel and mooring models [12]. Mahdi et al. (2013) used the GA for mooring pattern optimization with a time-domain analysis tool to take account of the nonlinear properties of a mooring system [13].
To improve the sophistication of the design procedure and search for new concepts, the present study introduced an optimization method and automation procedure. The objective function is the mooring system cost in terms of material weight, and a mooring system is analyzed in terms of its frequency domain and time domain. In addition, the Progressive Quadratic Response Surface Method (PQRSM) and Evolutionary Algorithm (EA) were applied to compare the local minima and global minima of the mooring system design. In Section 2, an optimization problem is defined and design variables and constraints are described, along with a floating body. The optimization results and discussion are presented in Section 3, and conclusions follow in Section 4.

2. Setup

2.1. Floater and Mooring System

To reflect the complexity of the mooring system, a Floating Production Storage and Offloading (FPSO) platform with a turret system is selected as a case study. The FPSO is a very popular floater type for deep-sea and ultra-deep-sea applications in the oil and gas industry and enable the production and storing of oil or gas. The turret system installed at the FPSO is an internal turret type, and the distinctive feature of a turret system is the weathervane. The turret system makes the FPSO adjust its azimuth to a direction with a lower environmental load. The particulars of the FPSO are shown in Table 1.
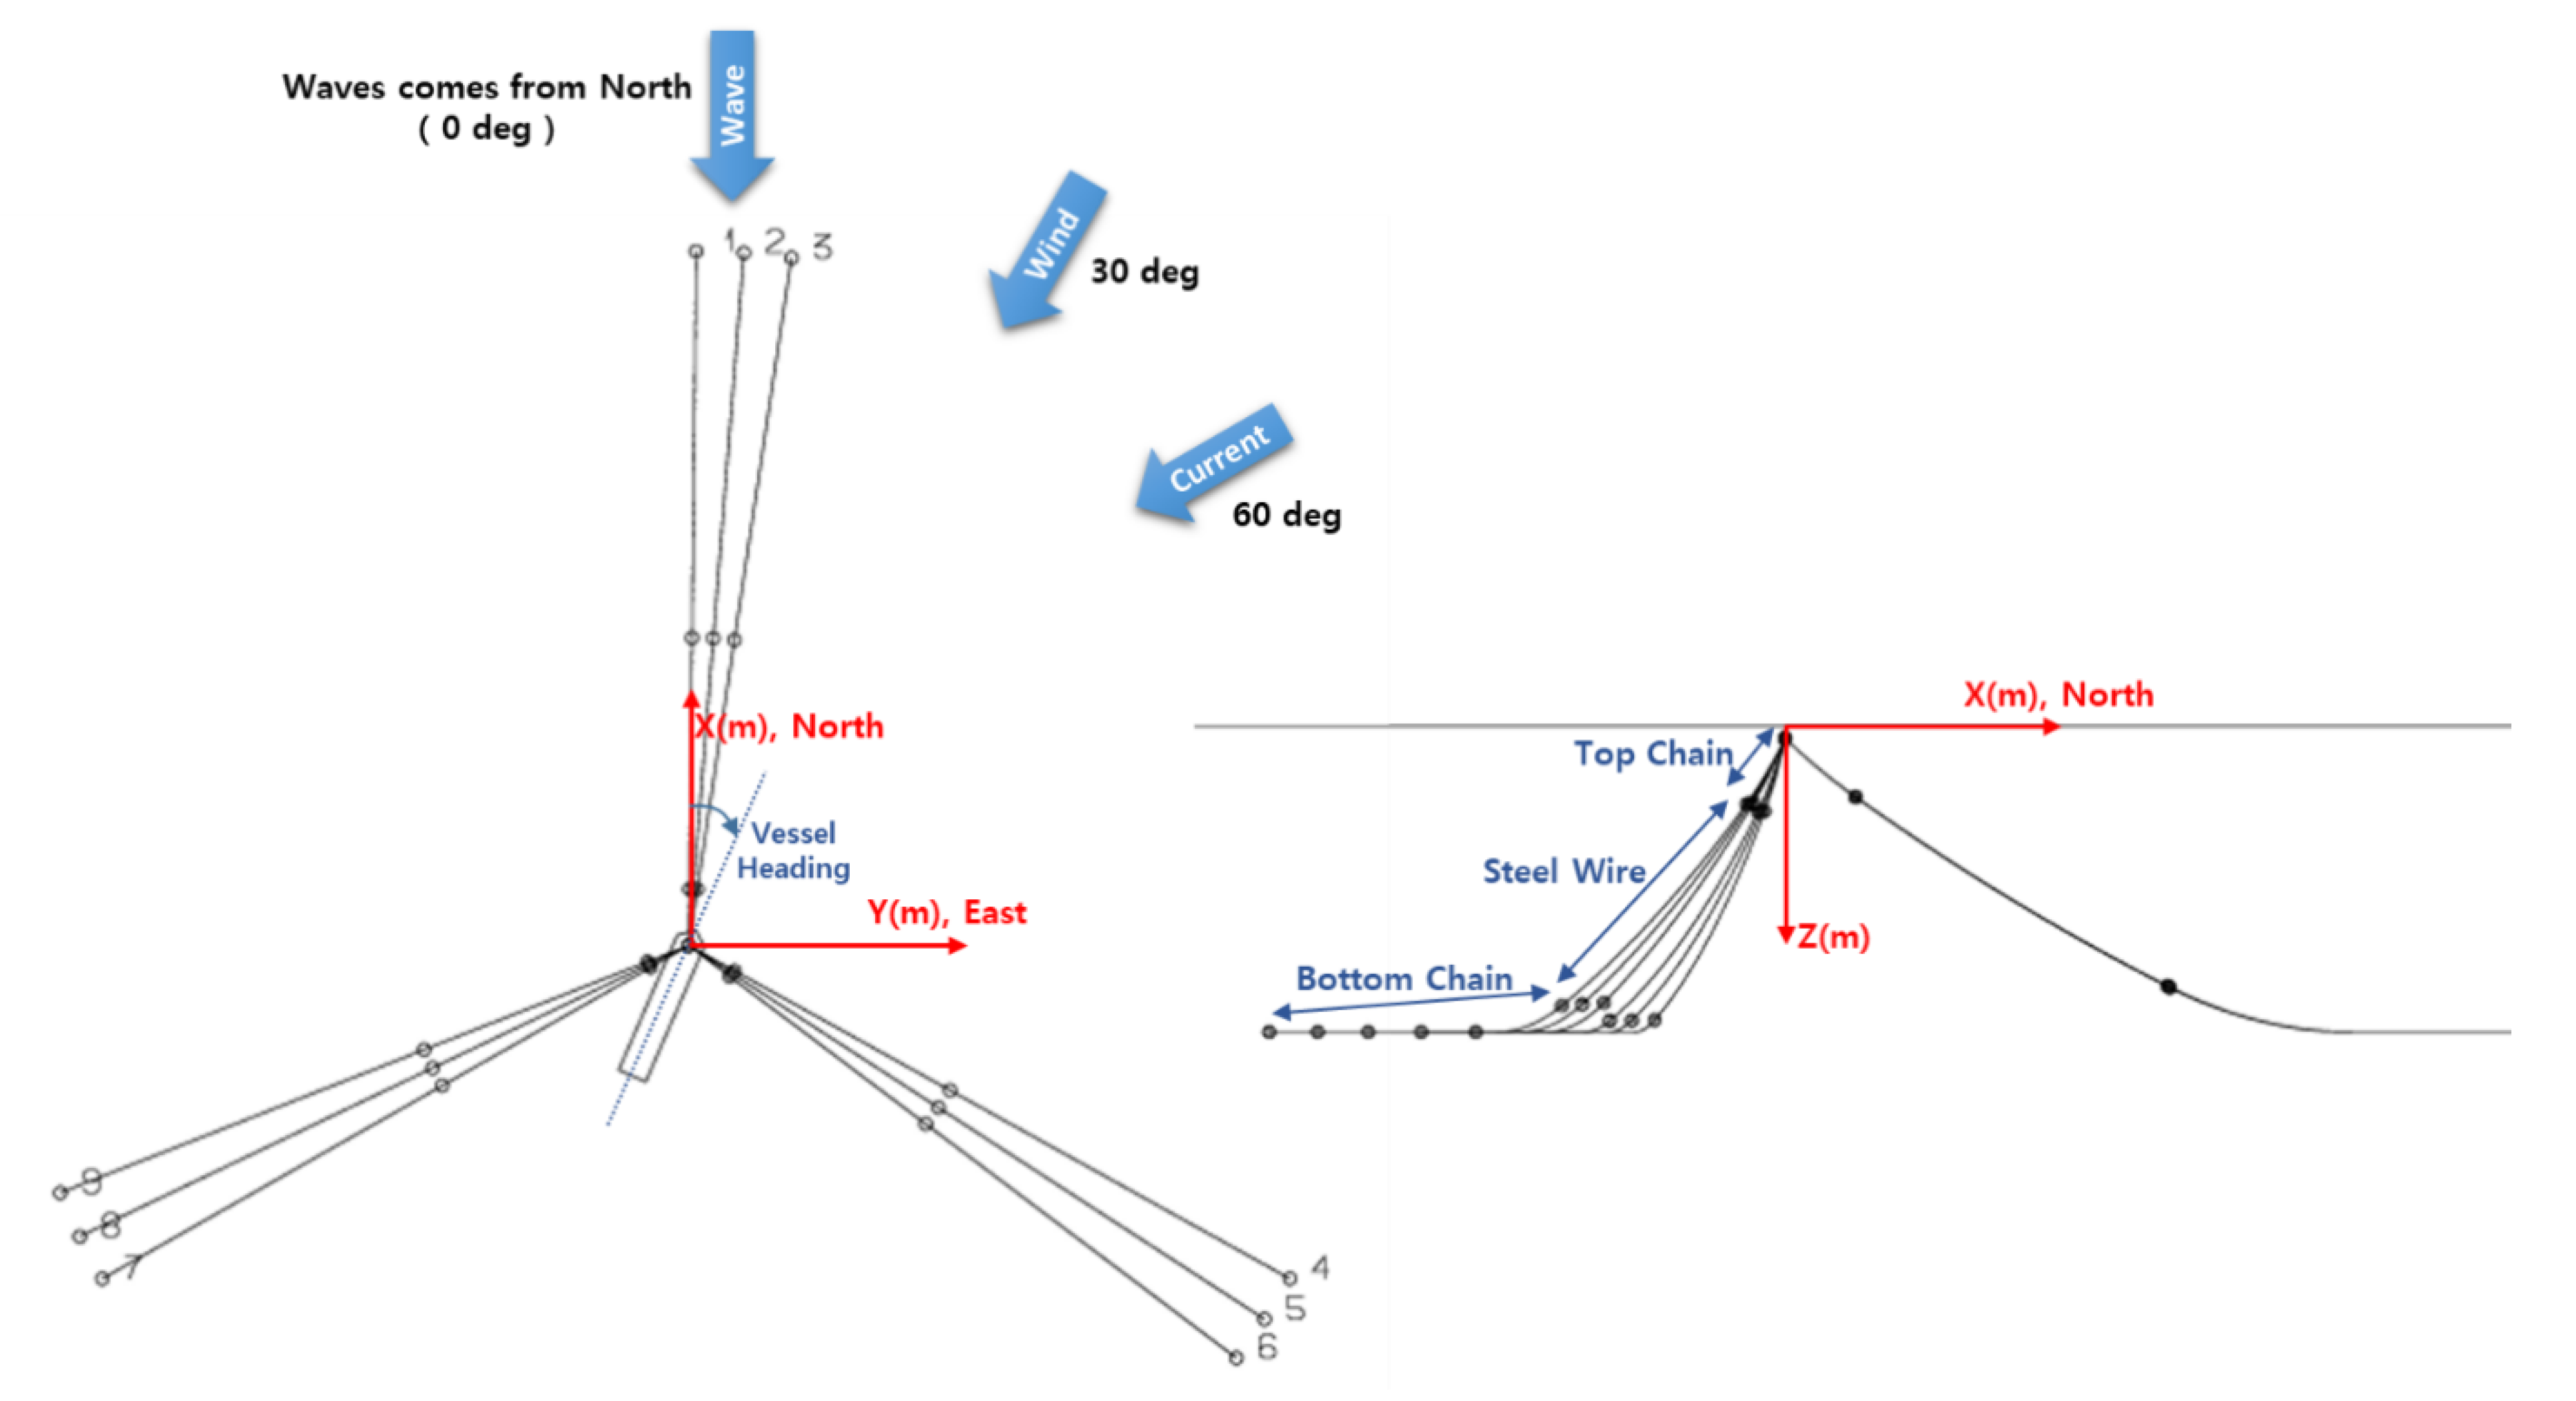
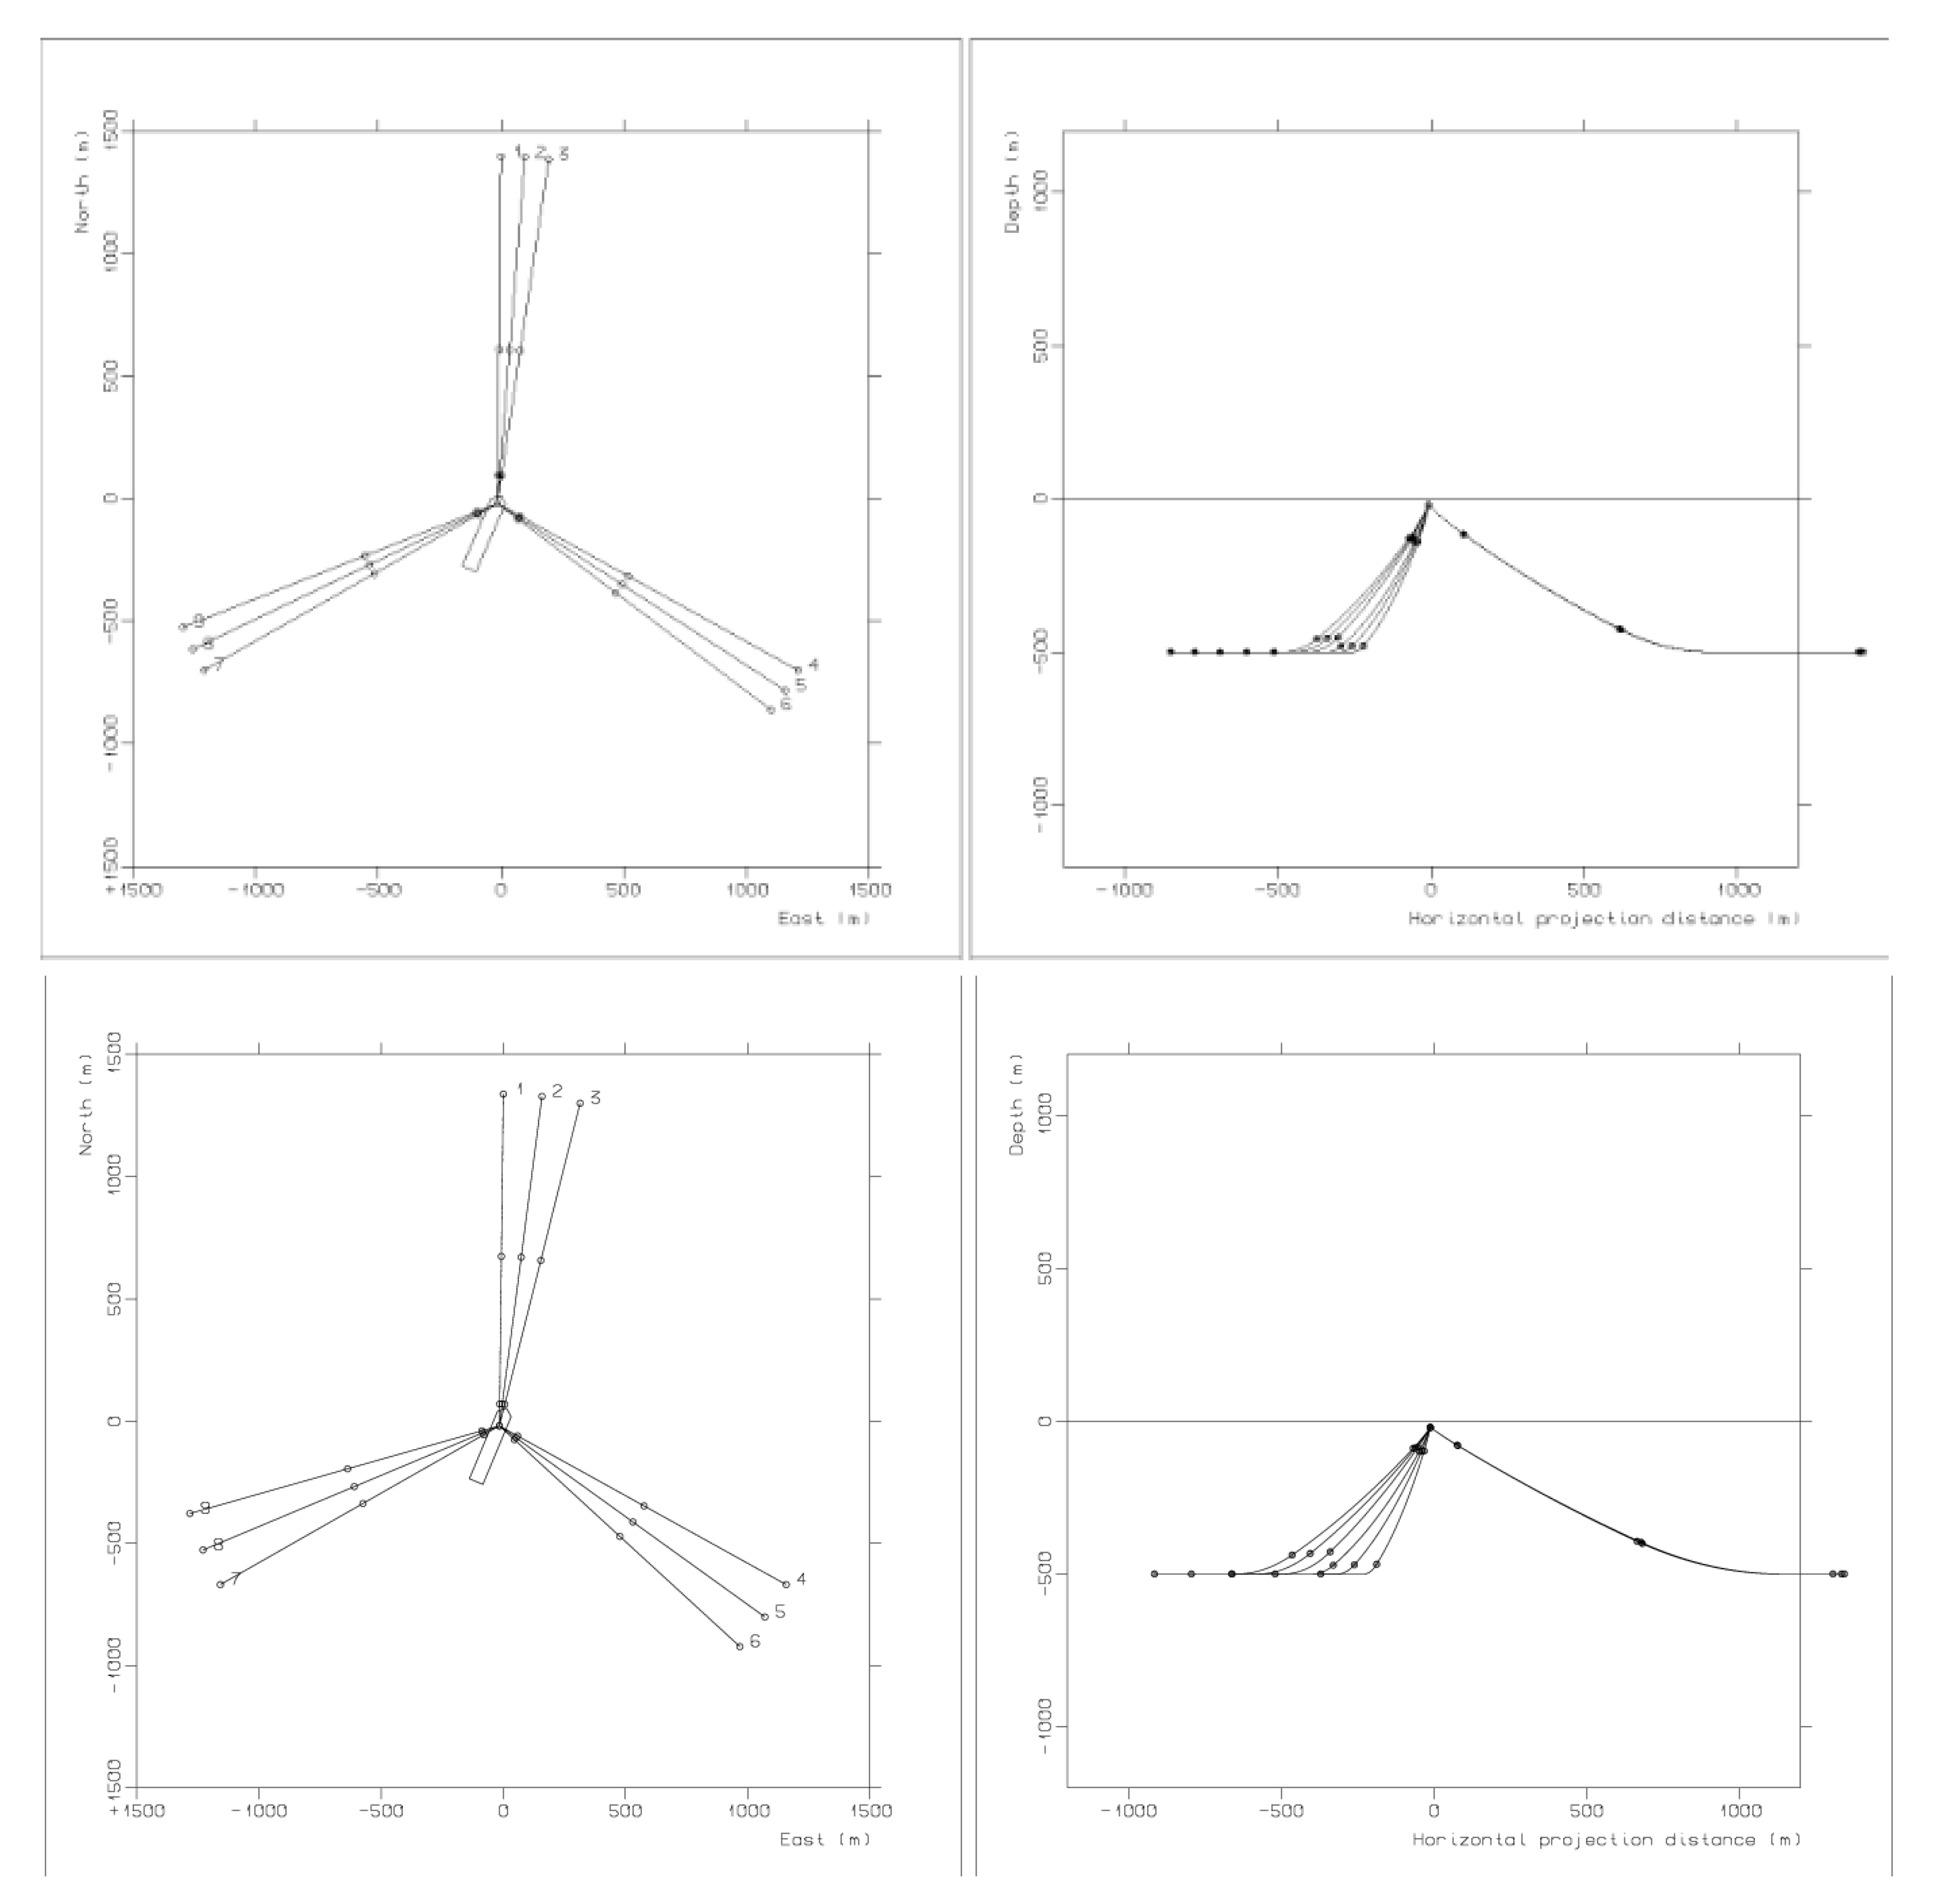
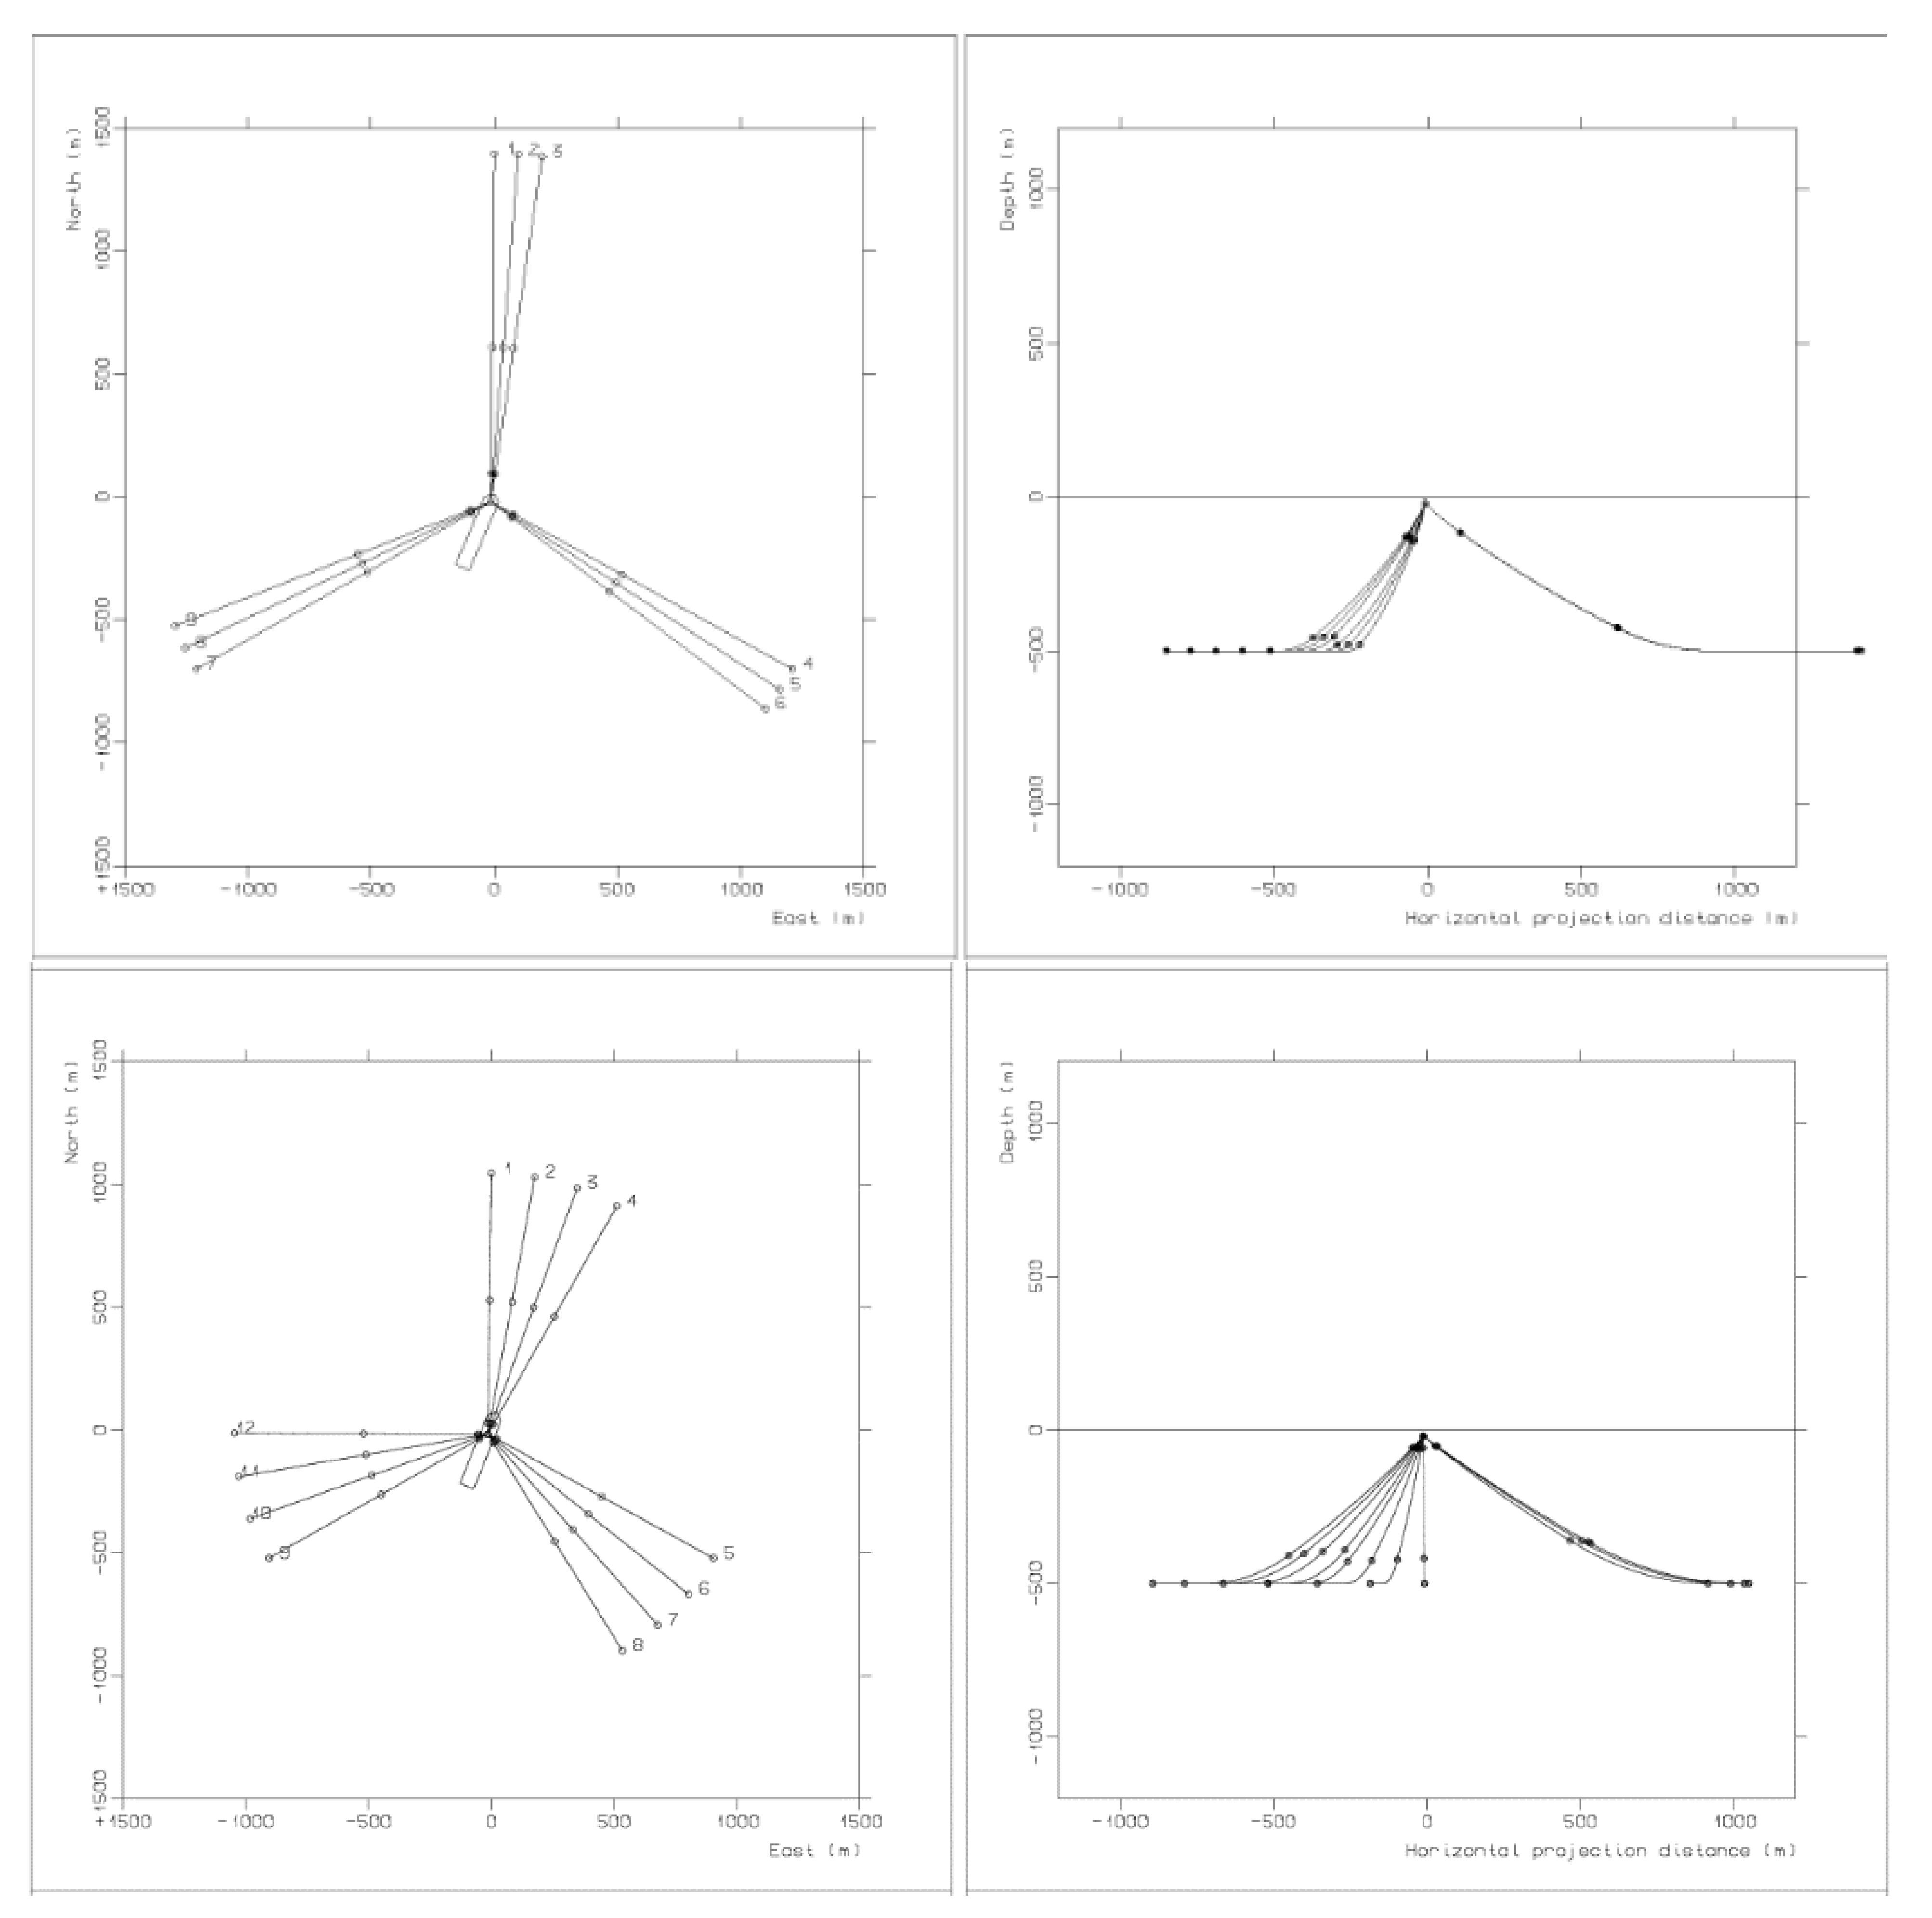
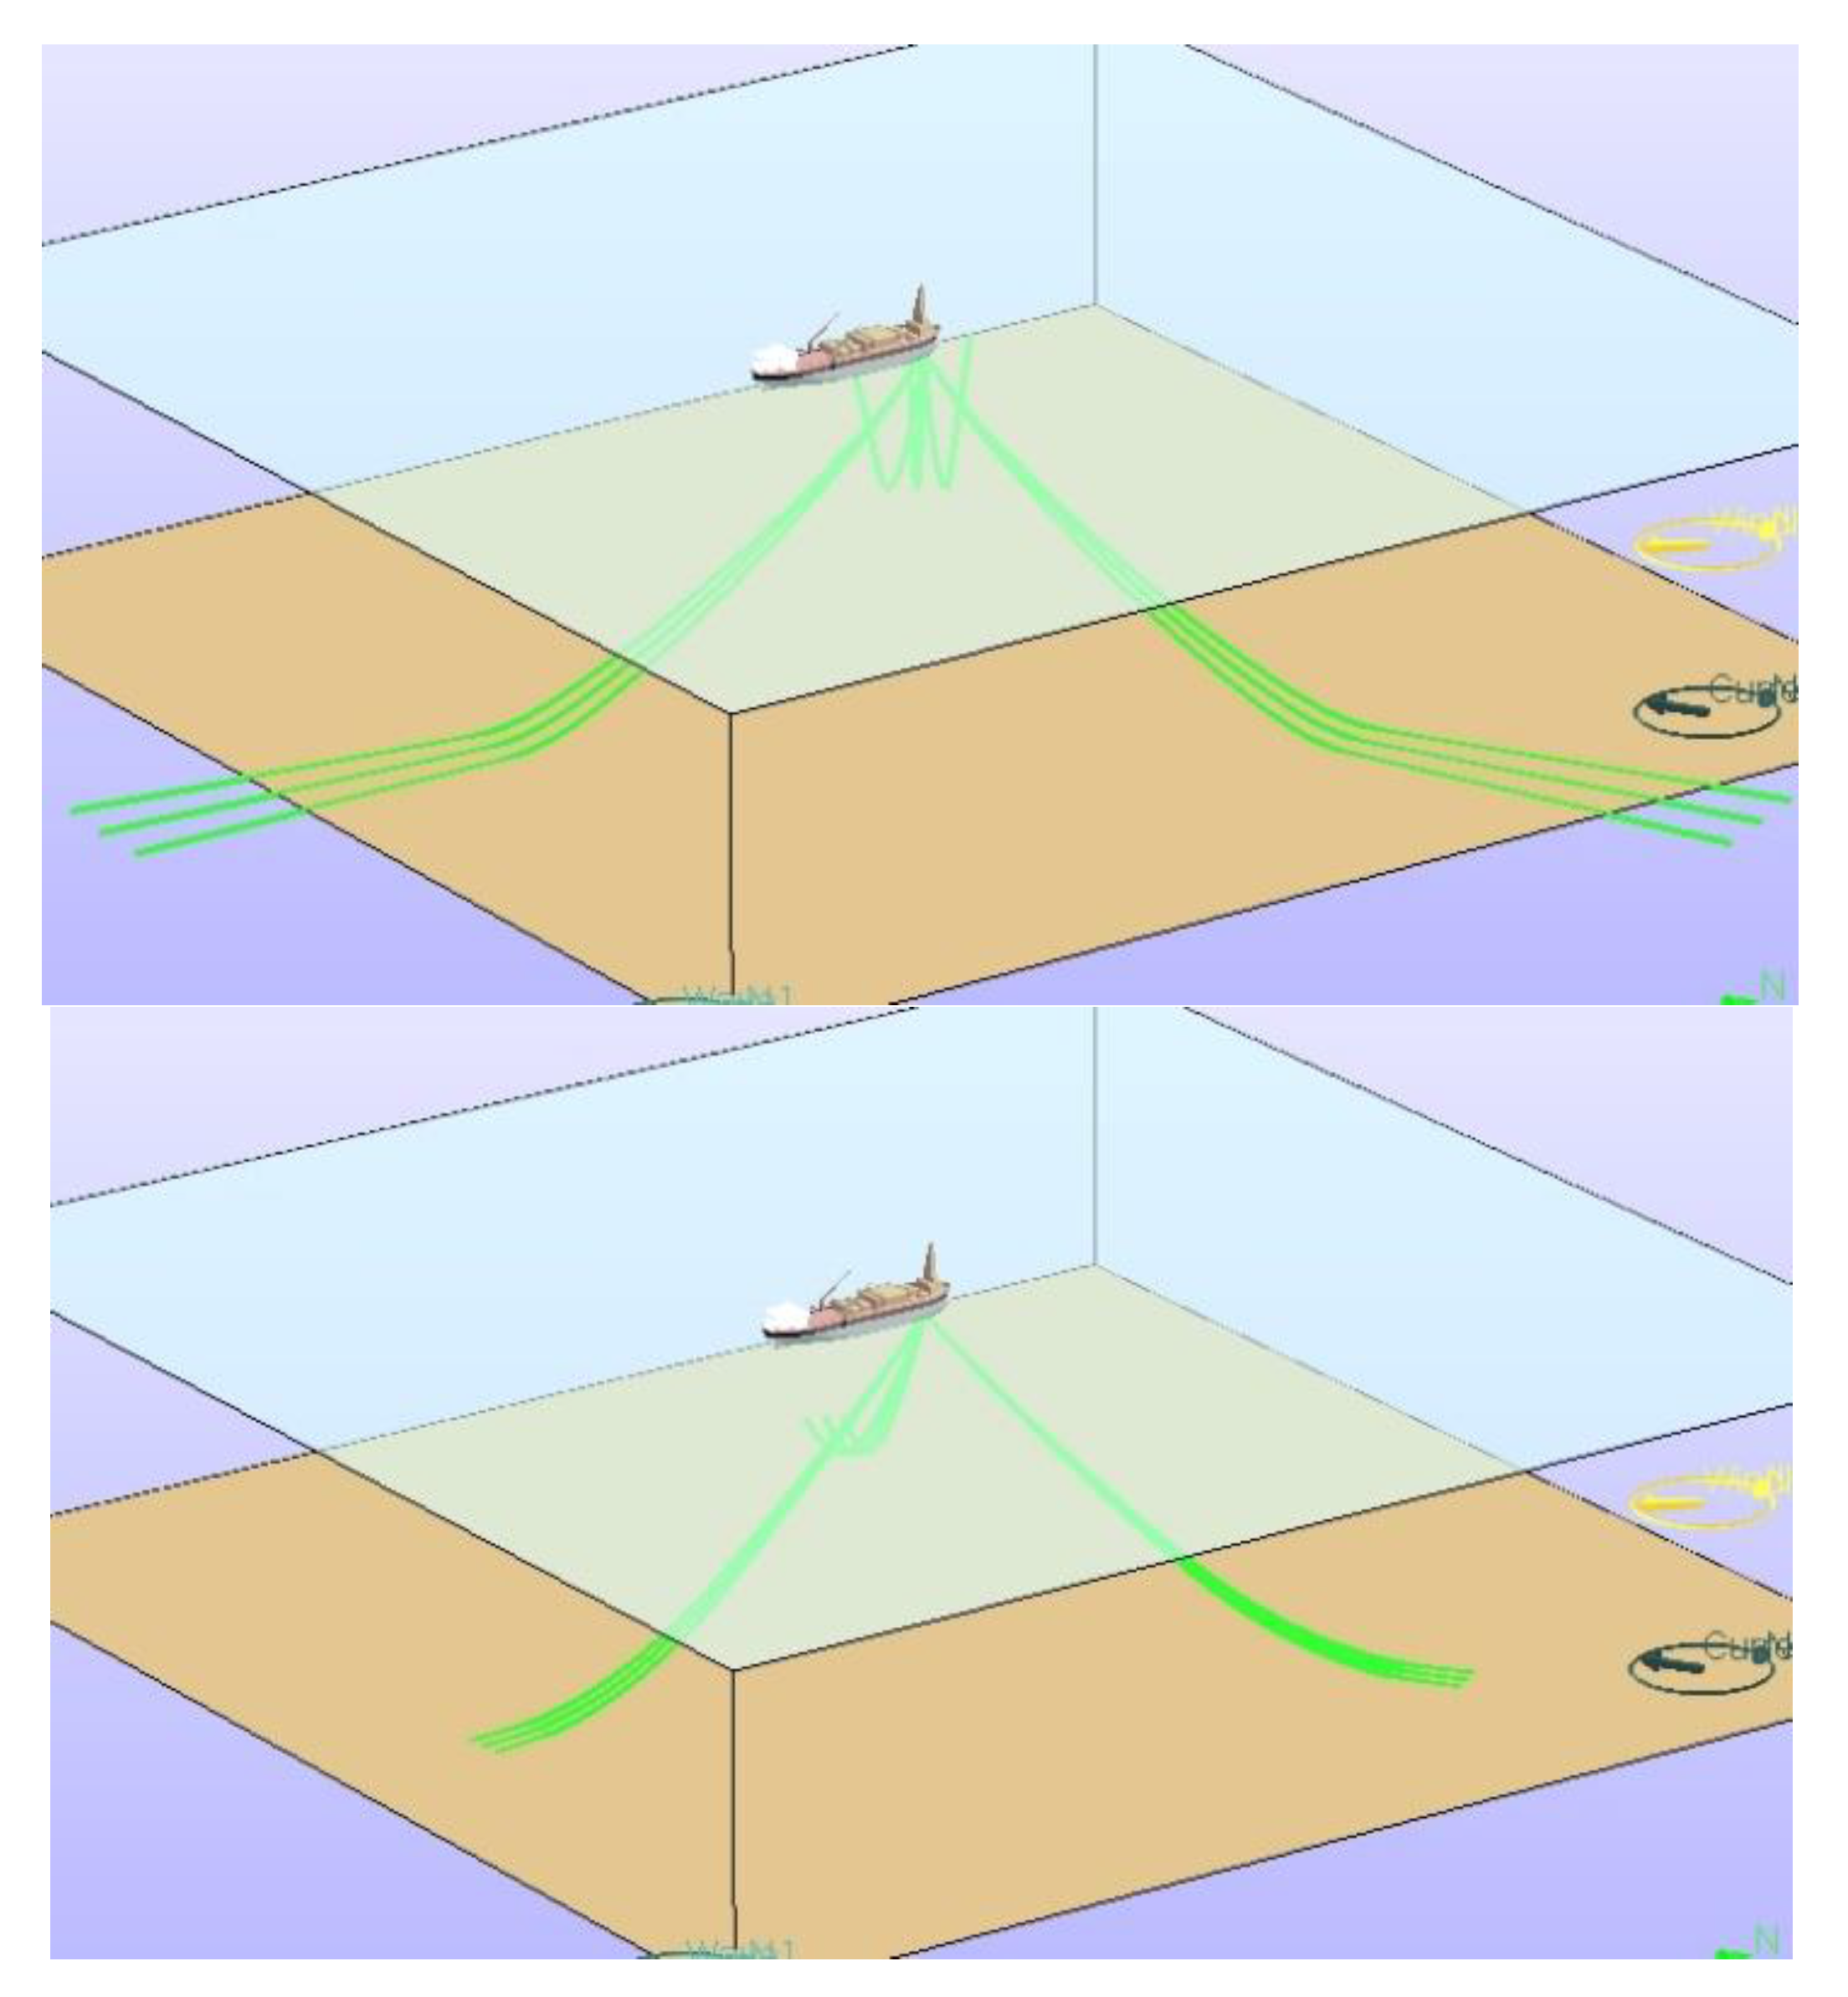
The initial design of the internal turret system has three groups of mooring lines, and each group has a further three mooring lines. In the present study, risers and umbilical cords are not considered in the mooring system design. As shown in Figure 1, the first group is aligned toward North, and the second and third groups are arranged from 120 degrees clockwise rotation apart from the first and second group, respectively. The initial number of degrees between the adjacent mooring lines in a group is 4 degrees. Each mooring line consists of a studless bottom chain, spiral strand wire rope and studless top chain. The bottom chain is connected to the embedded anchor, which is submerged to the seabed. The bottom chain weight contributes to the anchor’s holding capacity, and the chain provides good abrasion resistance to the seabed. A spiral strand wire rope used for the intermediate segment of the mooring line has a high strength-to-weight ratio, so it minimizes the vertical loads on the turret bearings, and the elongation rate of the steel wire and chain used for the anlaysis is 1% at minimum breaking load (MBL). The top chain, connected to a chain stopper, makes it easy to adjust the mooring line length since the design lengths of the mooring lines may not be the same as the installation line lengths due to uncertainties caused by the on-site anchor position.
In the initial condition, the FPSO heading points North. The X-axis and Y-axis in the global coordinate system are directed East and North, respectively. As shown in Figure 1, the X-Y plane coincides with the free water surface, and the Z-axis points downwards. The motion of the FPSO is described relative to the global fixed coordinate system, with a positive rotation clockwise.

2.2. Numerical Simulation Tools

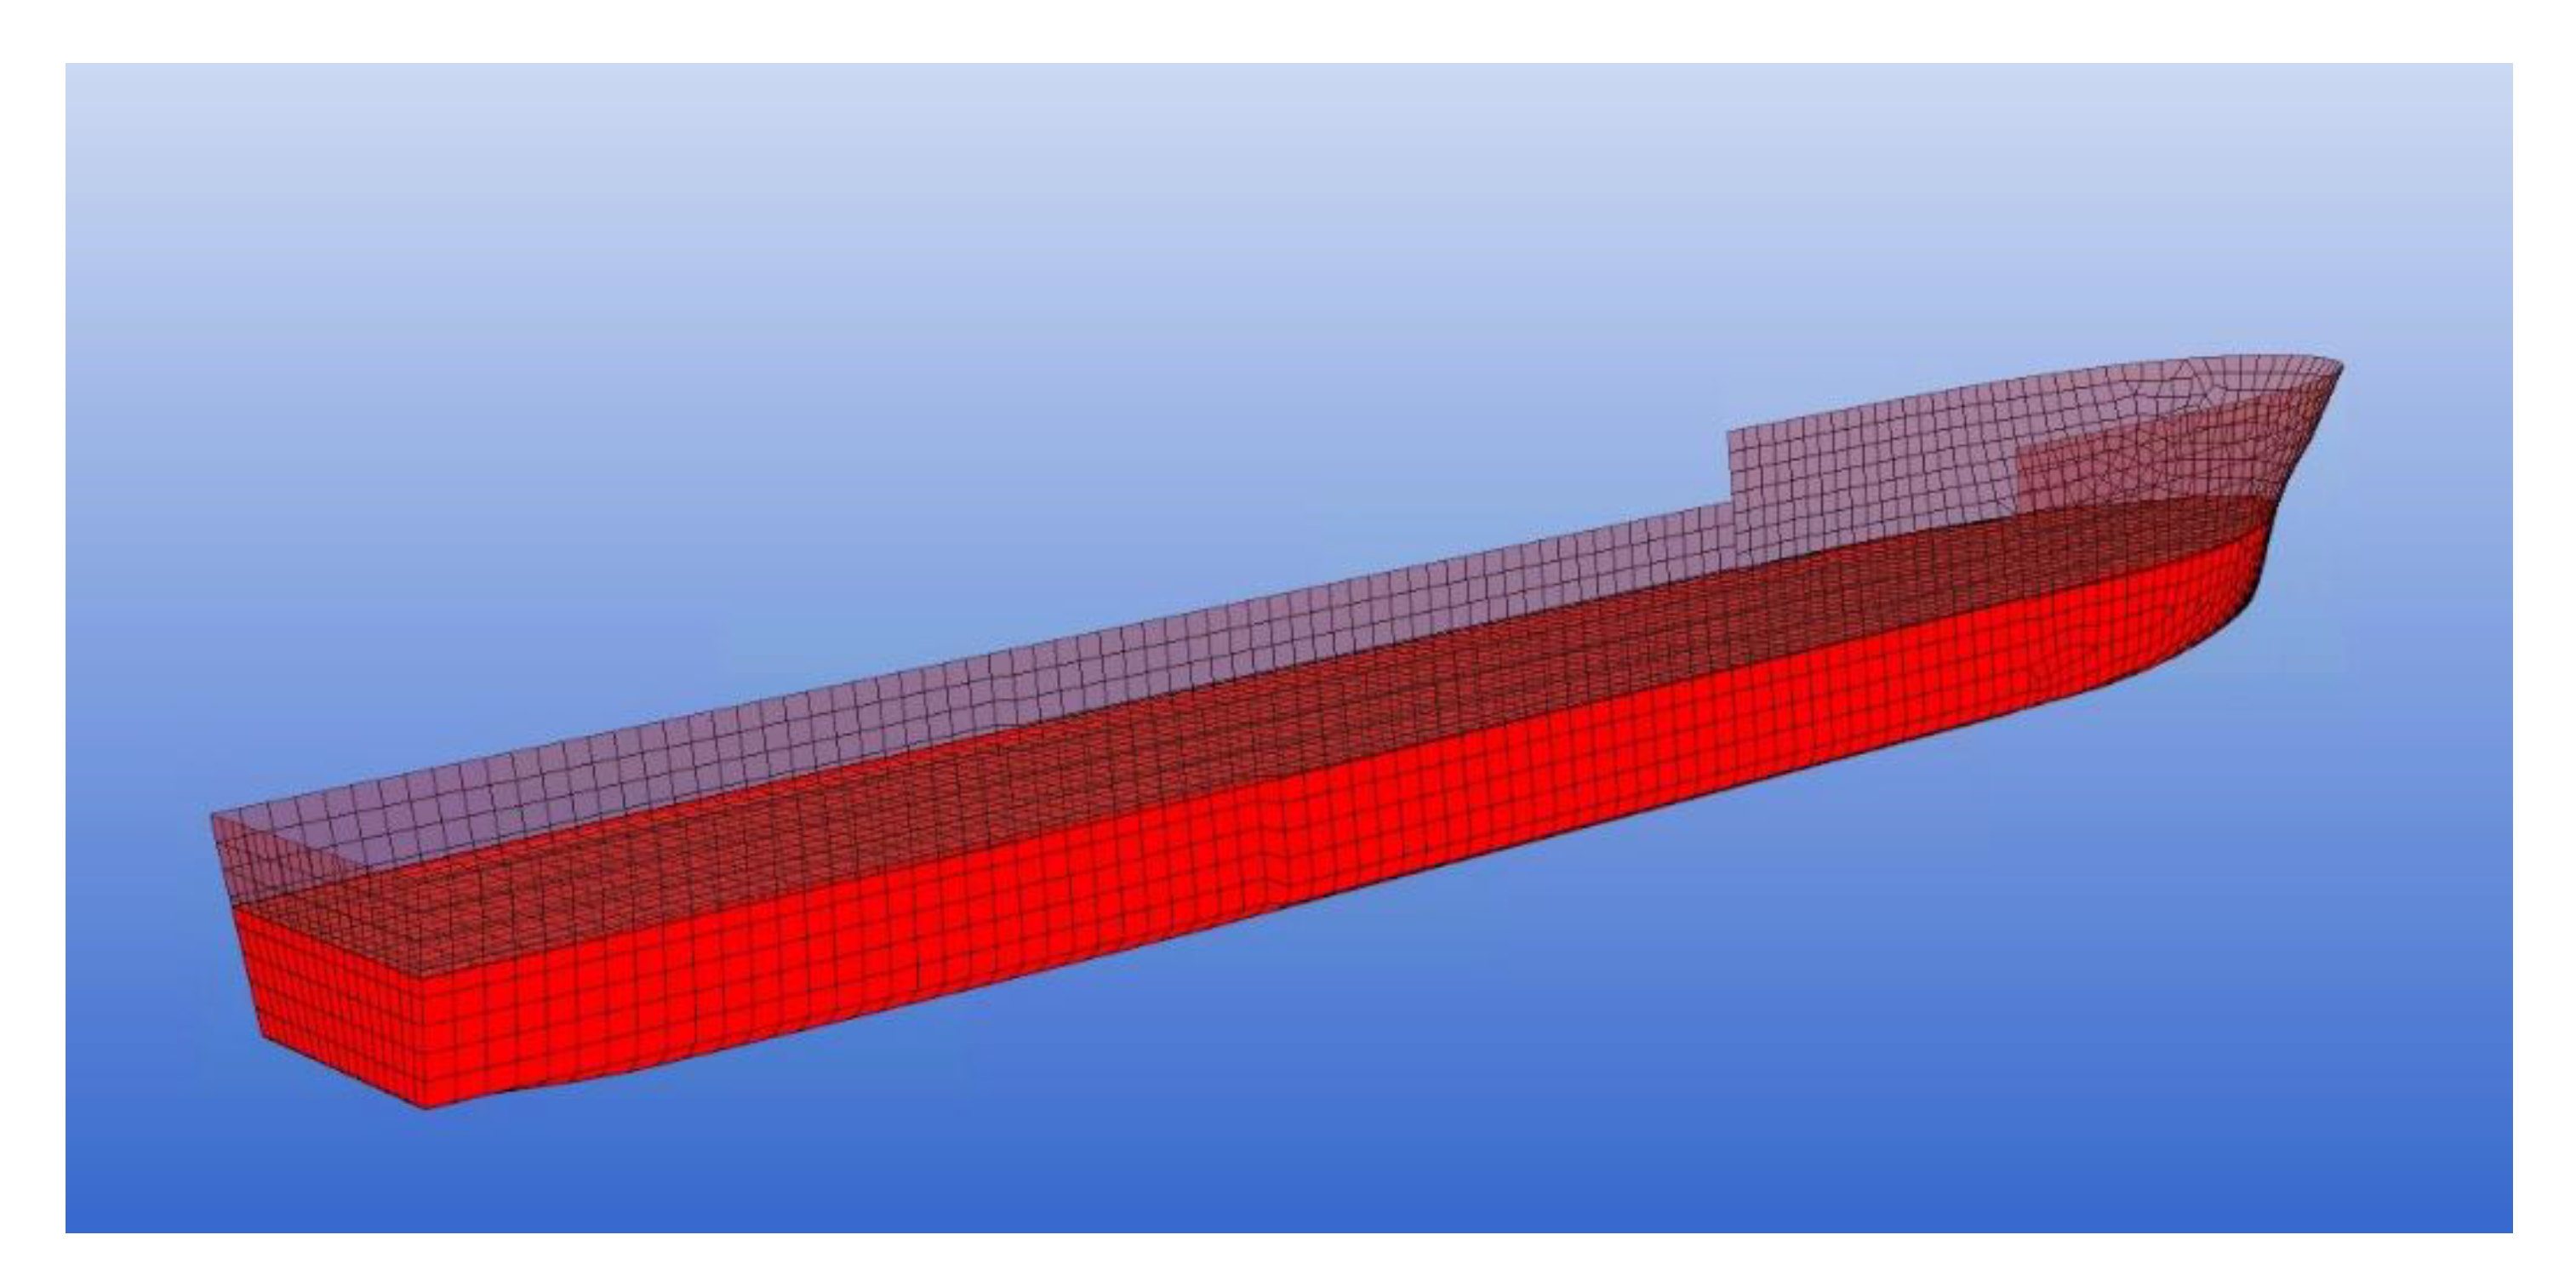
Hydrodynamic analysis is performed via HydroStar (BV, Paris, and France), a three-dimensional diffraction and radiation analysis tool developed by BV. HydroStar is based on potential theory and calculates added mass coefficients, radiation damping coefficients and excitation forces [14]. For wave frequency calculation, the frequency range used in the analysis was from 0.15708 rad/s (40 s) to 2.0944 rad/s (3 s). The interval was 0.5 s when the wave frequency is close to the on-site conditions otherwise the interval was 1.0 s. Viscous damping forces which cannot be calculated from the software are very important for determining vessel motions, especially for the roll direction. Without viscous damping, the hydrodynamic analysis results may deviate from model test results. Thus, 5% of the critical roll damping is added to compensate for this. In addition, wave-drift damping is neglected. Figure 2 shows the panel model of the FPSO used in the HydroStar.
For the mooring system analysis, frequency and time-domain analysis methods are commonly used. Frequency domain simulation is computationally cheap, and is an efficient way to analyze a large set of mooring system cases. It is widely used for parameter studies and concept design studies in the early stage. Since wave frequency (WF) and low-frequency (LF) motions and tension responses are carried out in the frequency domain, the LF response is managed by linearizing the non-linear vessel and mooring responses. Thus, the frequency domain simulation inevitably introduces some errors. On the other hand, the time-domain analysis takes account of the nonlinear effect so that the mooring simulation results are more accurate than those of the frequency domain simulation. However, the time domain analysis is computationally expensive, and is used to check critical cases in the final design stage.
In the present study, both frequency and time domain analysis tools are used for mooring system analysis. For the frequency domain analysis, MIMOSA (Marintek, Oslo, and Norway), developed by MARINTEK, is used for the static and dynamic analysis of moored vessels [12]. It is capable of computing static and dynamic environmental loads, corresponding rigid-body vessel motions, and static and dynamic mooring tensions. For the time domain analysis, Ariane7 (BV, Paris, and France), a hybrid mooring analysis tool developed by BV, is used. Ariane7 calculates 6 degree of freedom (DOF) low-frequency motions at time domain, and 6 DOF wave frequency motions calculated in the frequency domain using Hydrostar are added to the 6 DOF low frequency motions. That is, Ariane7 is a hybrid time domain analysis tool which does not use convolution to convert wave frequency responses to those in time domain. The reason why Ariane7 is selected for this study is that it matches with the goal of mooring system optimization. The mooring analysis tools should be computationally cheap to calculate the tons of iterations, and Arian7 is very efficient for screening critical cases. This study is looking for a possibility of optimization applications to the mooring system design in early engineering stage. For the final mooring system design, the selected optimized cases should be reanalyzed by fully coupled time domain analysis tools with seed variation. Similarly to MIMOSA, Ariane7 is capable of static and dynamic computation under a given set of environmental conditions. In addition, Ariane7 takes account of the nonlinear line characteristic, which is not available in MIMOSA. The total duration and time steps for the time domain is 3 h and 0.5 s, respectively.
To find an optimal solution, a large set of parameter studies are required. Changing variables manually is both time-consuming and tedious. To expedite the process, automation technology is applied for optimization. Process Integrated Automation and Optimization (PIAnO (PIDOTECH, Seoul, and Republic of Korea)) software is used for automation and optimization. PIAnO is commercial software developed by PIDOTECH and provides various optimization algorithms with the automation technique. For the time-domain analysis using Ariane7, PIAnO is not capable of automating Graphical user interface (GUI) based software, so the automation script is coded using AutoIt.

2.3. Environmental Loads

The environmental condition provides information on the static and dynamic loads on the floating bodies. Static loads come from wind, current and wave drift forces. Dynamic loads are a combination of WF and LF components. The WF load comes from the 1st order wave load, and is typically independent of mooring stiffness due to the short period. LF loads come from the 2nd order wave load (slowly varying the wave drift force) and wind. LF loads can have a significant impact on the mooring system due to their closeness to the natural period of the mooring system, and should be considered in the design of the mooring system. MIMOSA calculates LF loads in the frequency domain by linearizing the nonlinear properties, while Ariane7 calculates LF loads in the time domain by taking account of nonlinear properties.
In the actual project, the ultimate limit state (ULS), fatigue limit state (FLS) and accidental limit state (ALS) should be considered for the mooring system design. To simplify the optimization problem, only the ULS with the intact condition is considered. The environmental design condition of the ULS is shown in Table 2. This environmental combination is selected from the most unfavorable condition for the turret mooring system, and thus the headings of the wave, current and wind directions are not collinear. The directions of the environmental loads are defined from North and their sign convention is a positive clockwise rotation, as described in Figure 1. For example, a 0-degree wave means that the waves propagate South from the North. The wave spectrum used for the analysis is the Joint North Sea Wave Observation Project (JONSWAP) spectrum with gamma 3.3, sigma values 0.07 and 0.09. The wind spectrum used for the analysis is the Norwegian Petroleum Directorate (NPD) spectrum, and the wind speed value is measured as a one-h average at 10 m height.

2.4. Optimization Algorithm

A total of 11 independent design parameters are used for the optimization of the mooring system, and are listed below:
  • Turret position;
  • Number of mooring lines;
  • Number of groups;
  • Adjacent angle between mooring lines;
  • Length of each segment (bottom chain–steel wire–top chain);
  • Diameter of each segment (bottom chain–steel wire–top chain);
  • Pretension.
The lower and upper bounds for each design parameter are shown in Table 3.
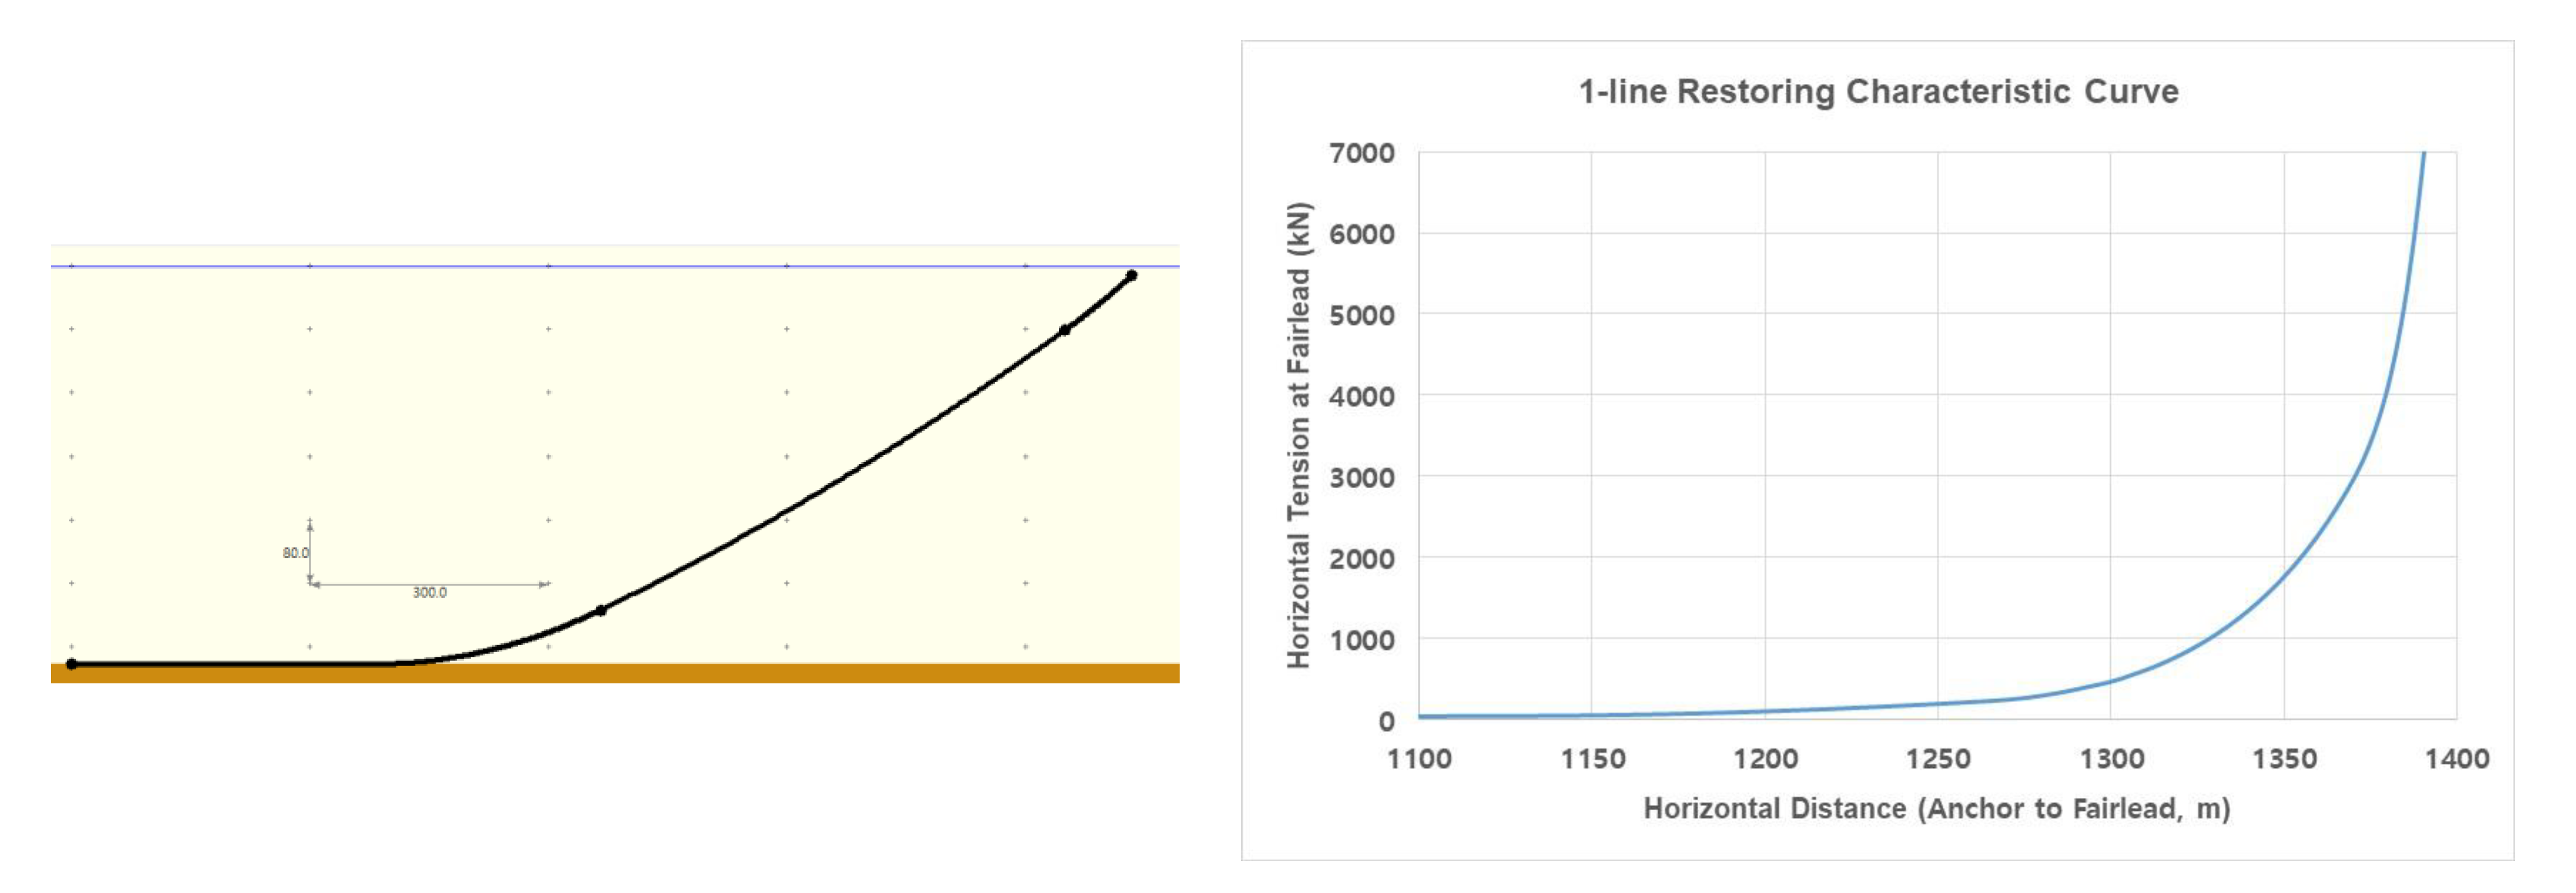
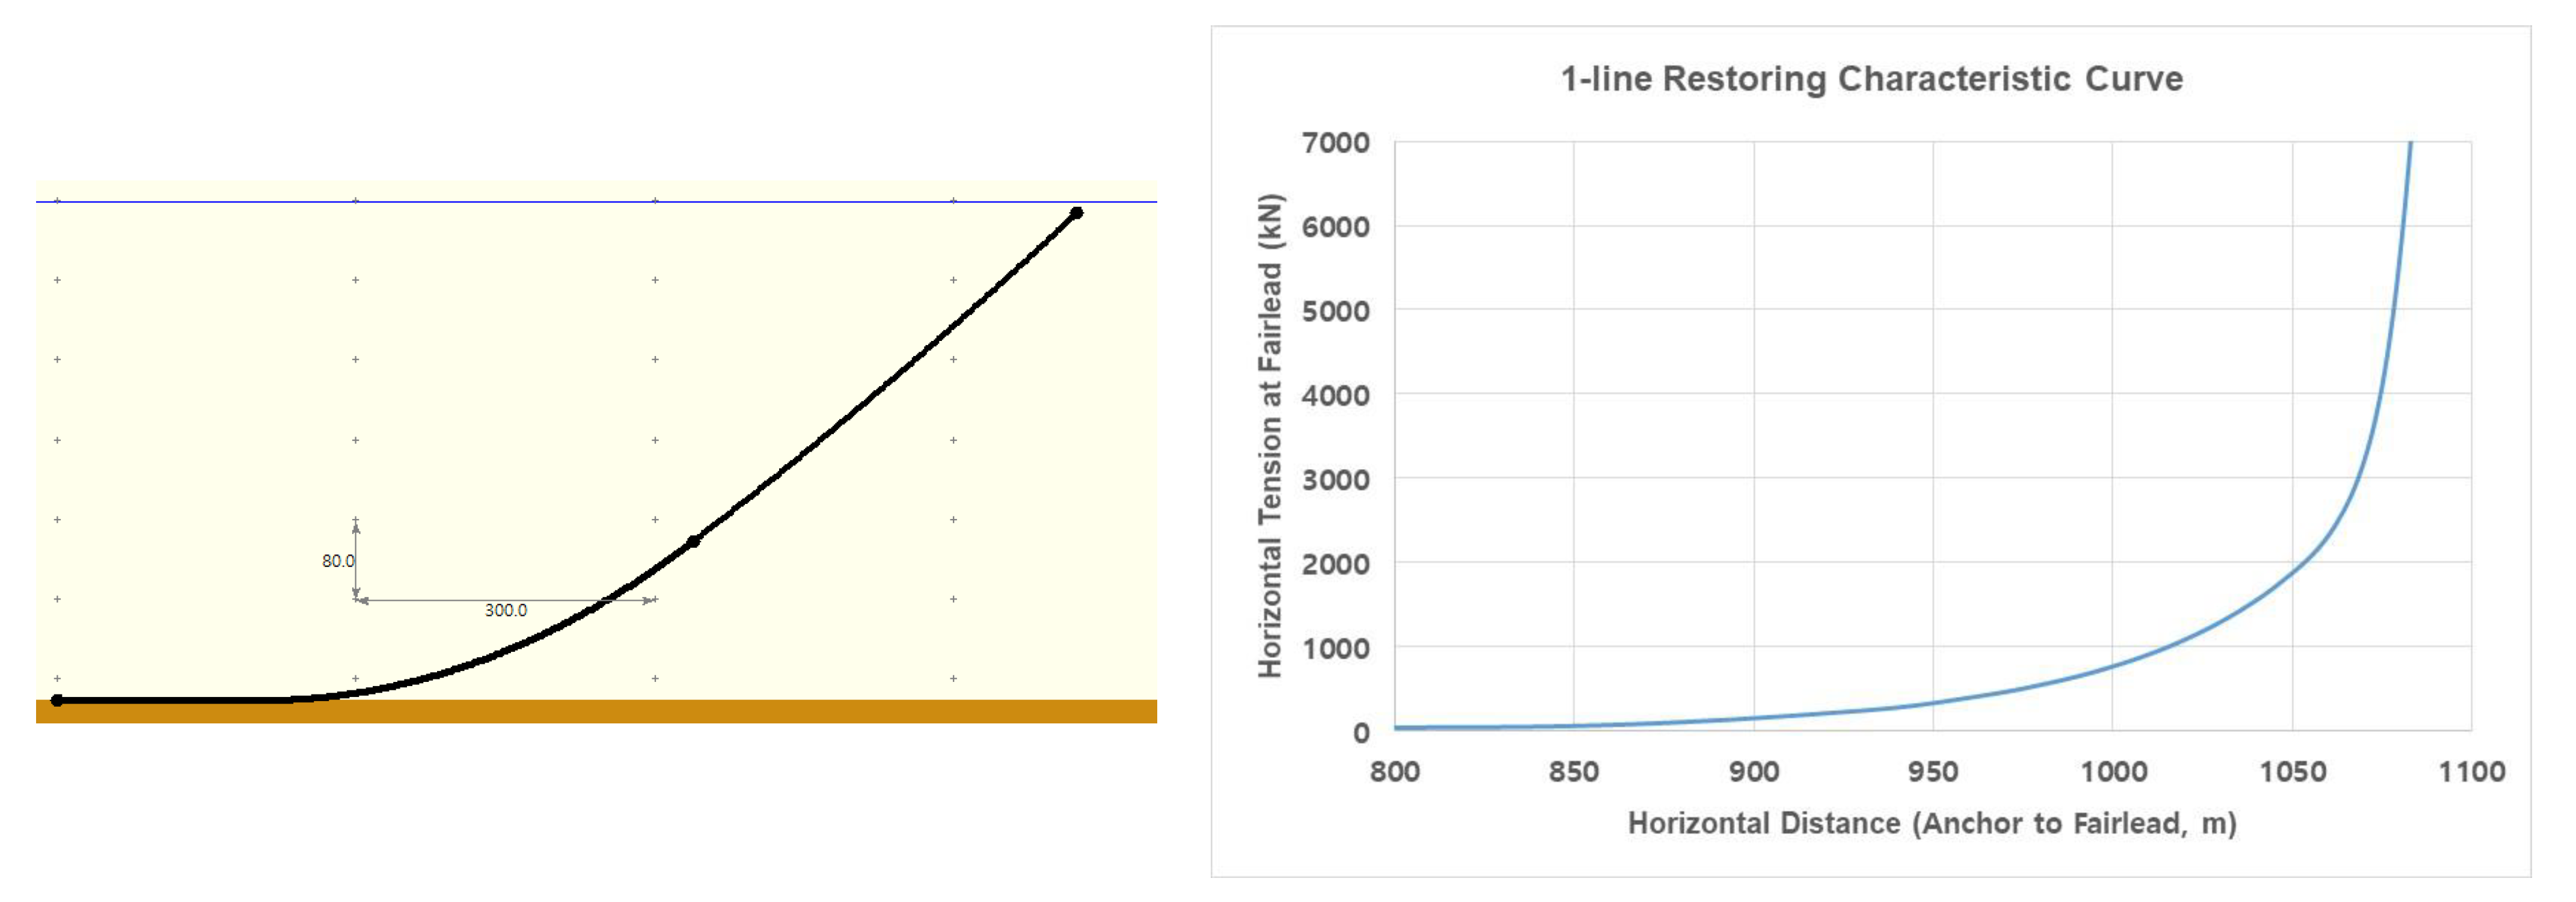
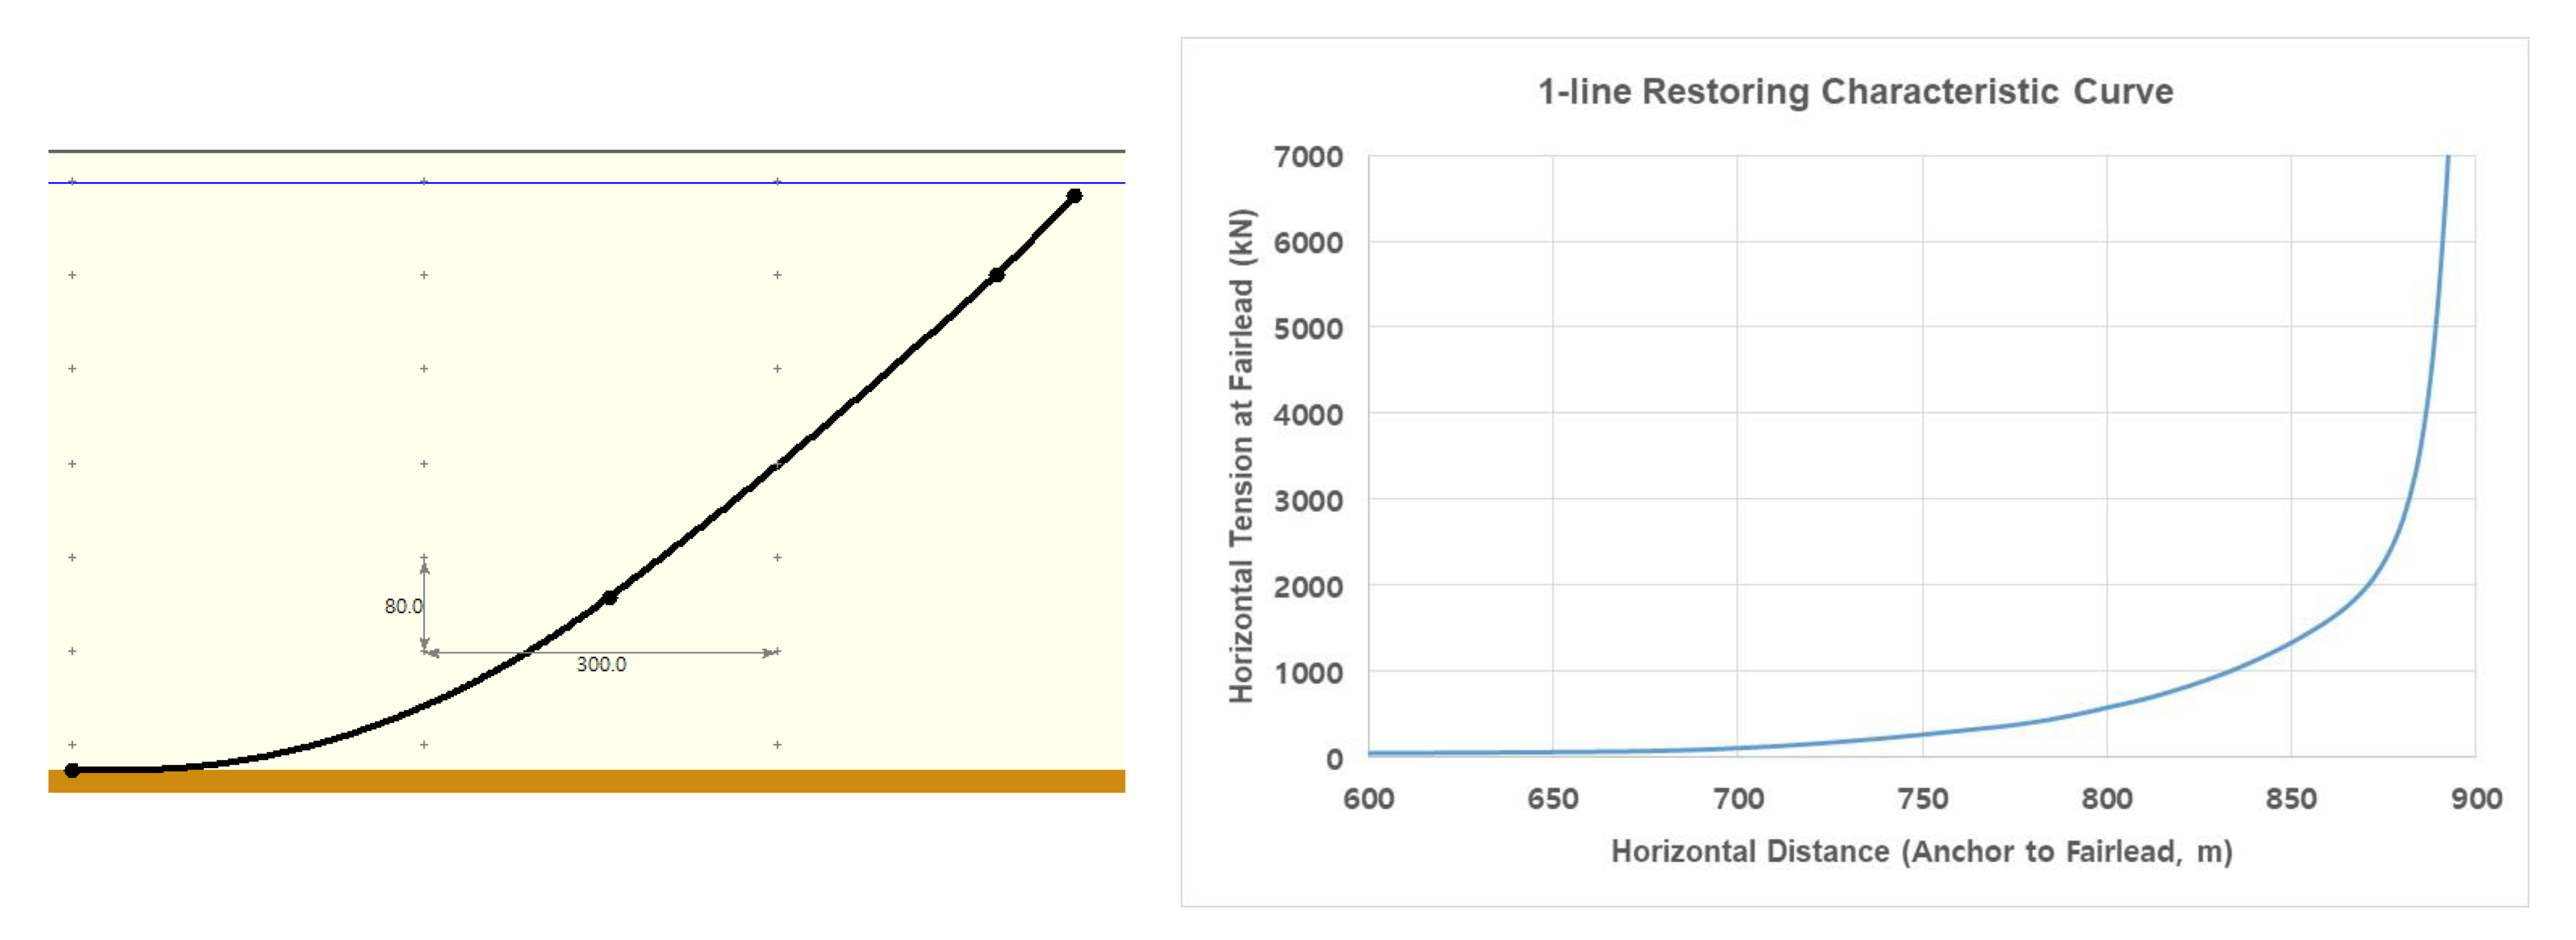
The mooring lines are assumed to be without bending stiffness, and only gravity force is acting on the mooring line. To describe the shape and tension of the mooring line, a catenary equation is used. Since the mass of the mooring line is small compared to the mass of the floater, it is assumed that the mooring line dynamics are neglected so that the mooring lines stay on a vertical plane and external loads from waves, wind and currents are not applied. In the catenary equation, if two out of the three variables are decided among the length of the mooring line, the distance from anchor to the fairlead, and pretension of the mooring lines, the remaining variable is automatically determined. In the optimization problem definition, it is very important to decide which variables are independent or dependent as the conclusions are taken from a satisfactory formulation of the optimization model. In the present study, the mooring line length and pretension are independent variables, and the distance from anchor to fairlead is selected as a dependent variable. Thus, the anchor position is calculated from the catenary equation in the mooring software.
The design constraints are listed as follows:
  • The anchor load is less than 4000 kN to prevent the uplift force, which is not desirable for an embedded drag anchor;
  • The safety factor of the mooring line tension at the fairlead is 2.5 to prevent mooring line failure;
  • The offset limit of the floater is 50 m, i.e., 10% of water depth due to constraints from the umbilicals or risers.
In the present study, the goal is to minimize the cost of the mooring system. The mooring system cost is complex, however, and is a function of many variables such as material cost, fabrication cost, the number of connecting components, the number of winches, the installation method, market conditions and the transportation cost of the mooring equipment to the place of manufacturing, etc. The installation cost is particularly dependent on not only the mooring system concept, but also site depth and location. Furthermore, the above factors vary depending on vendors, and it is difficult to get this information due to project confidentiality. To reduce the complexity and make an objective function simple, it is assumed that the cost of the mooring system design is proportional to the mooring line weight (material cost). Thus, the objective function is to minimize the weight of mooring lines in the mooring system as follows:
C = min [   i = 1 N f ( x i )   ]
where f ( x i ) is the weight of mooring component, x is the design variables and N is the total number of design variables.
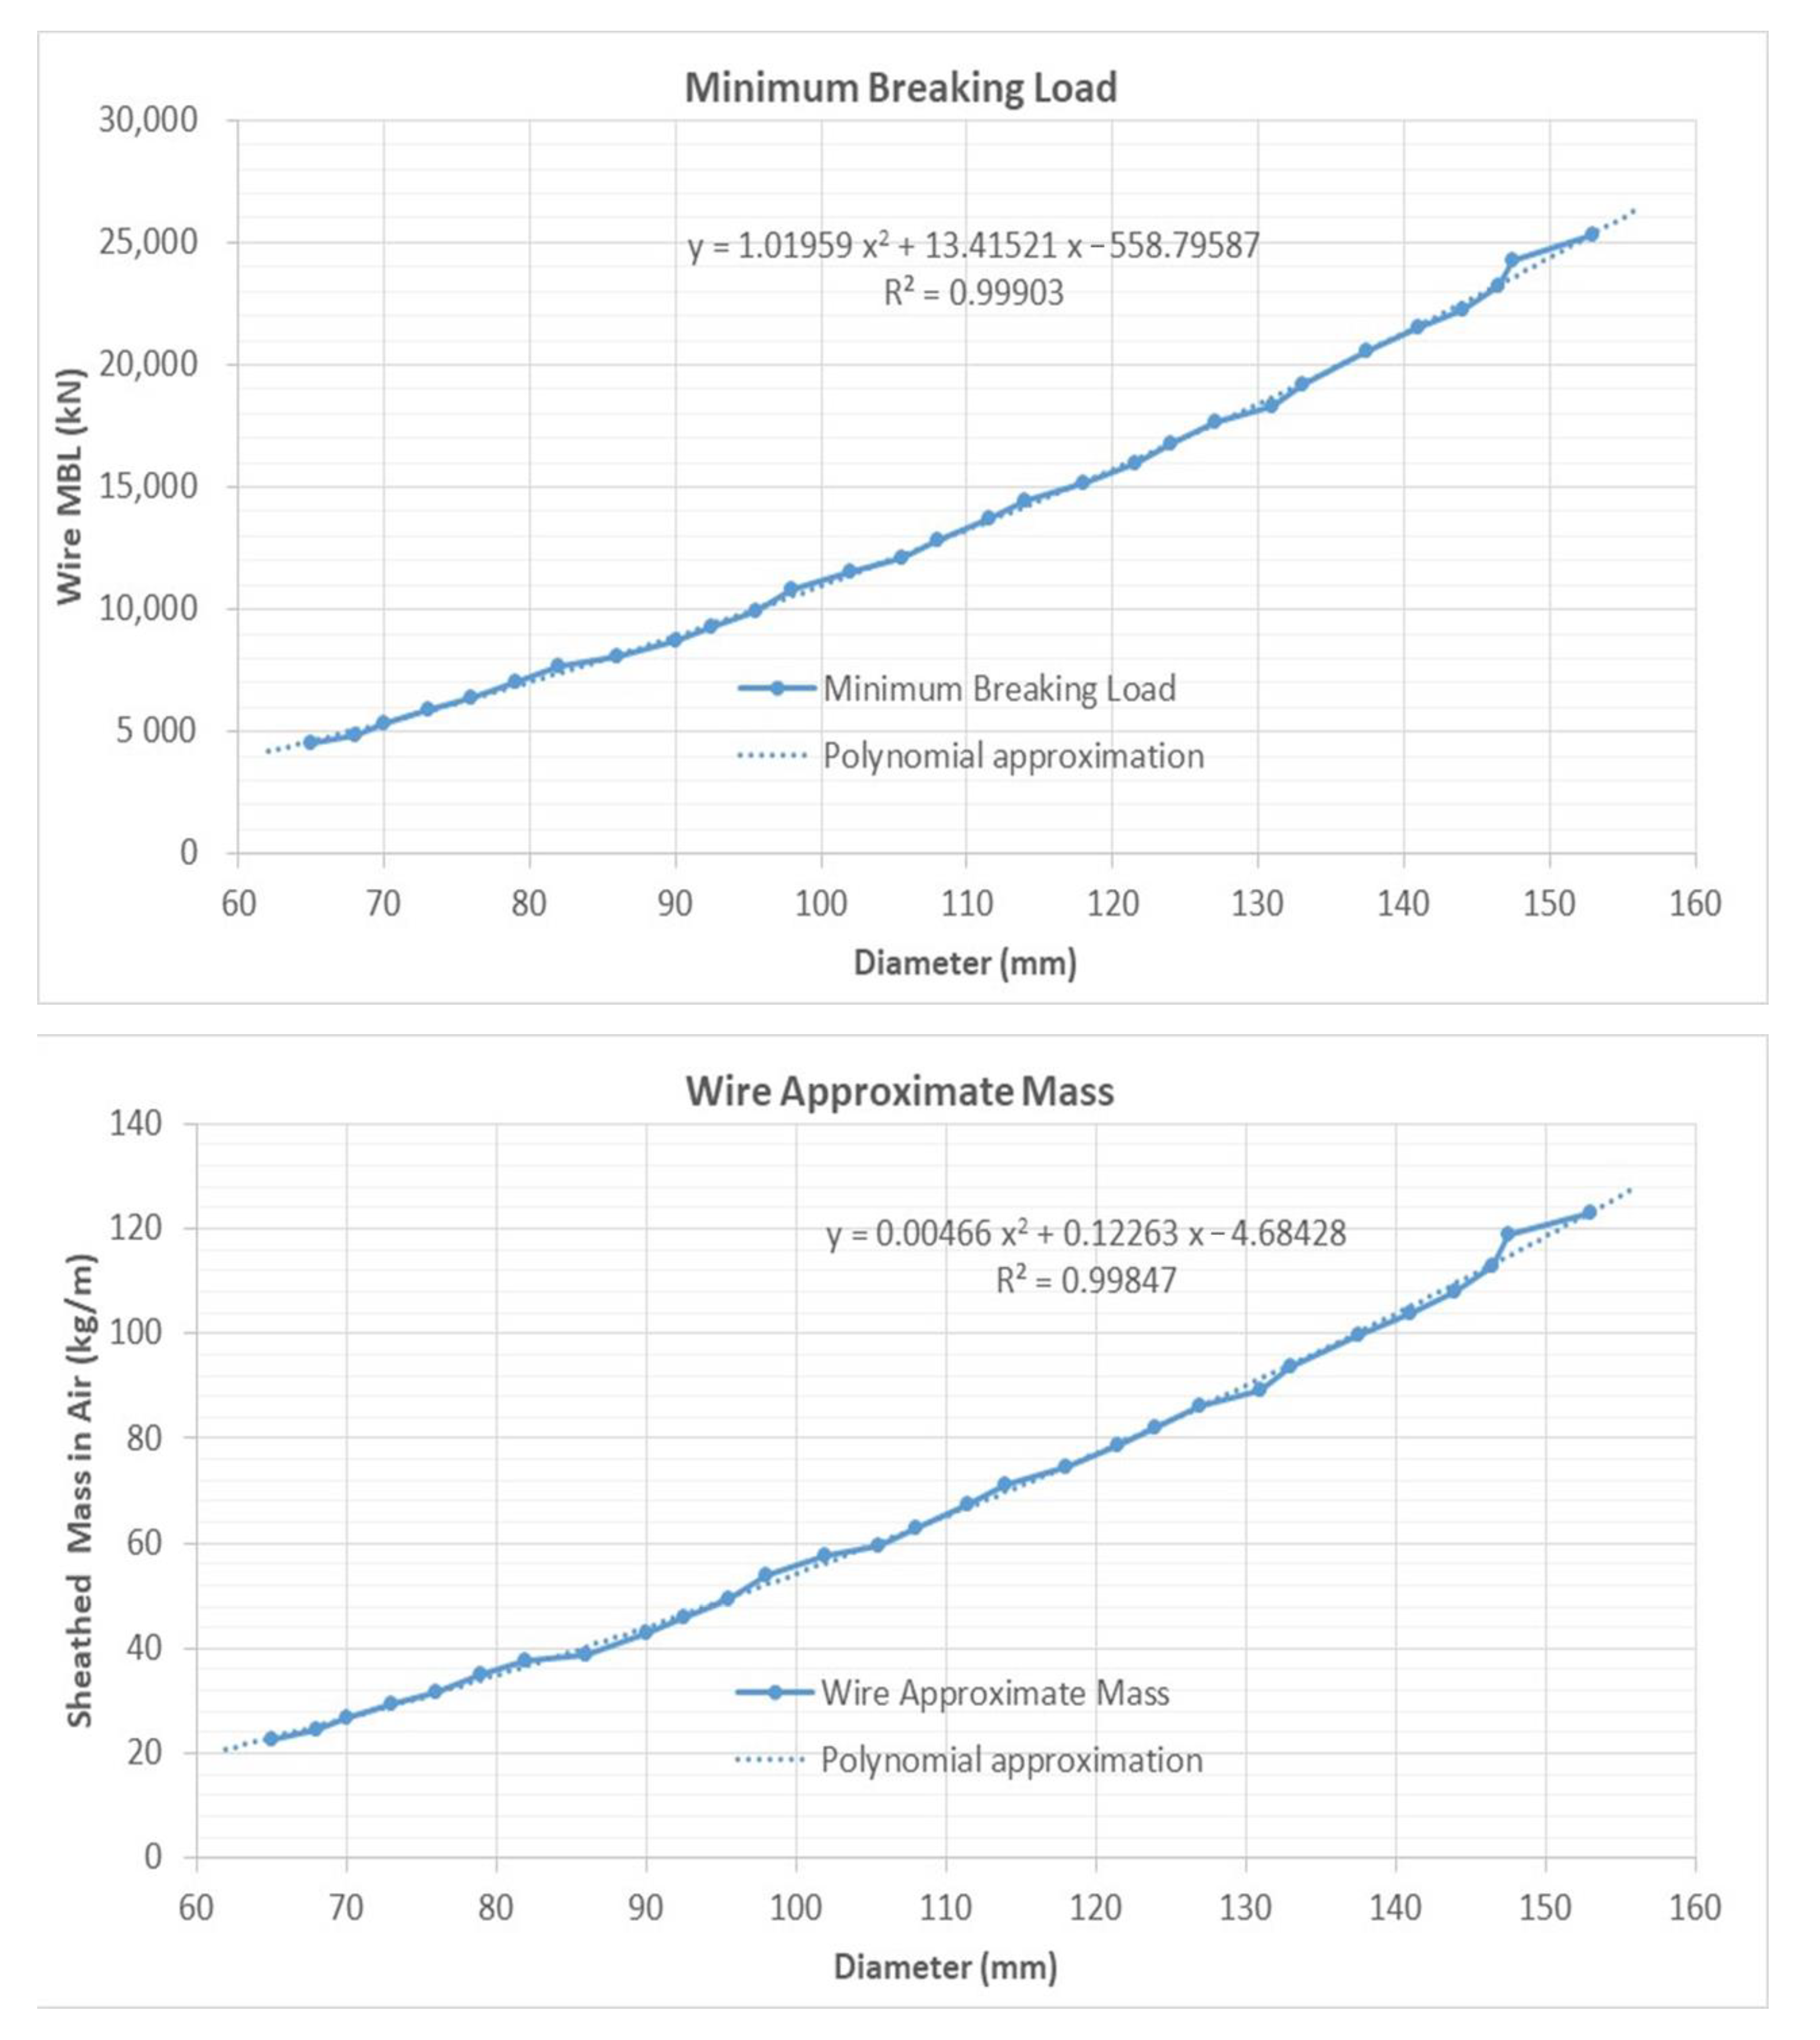
To address the objective function, the diameter of each segment in the mooring line is selected as an independent variable, and the dependent variables such as weight and MBL are affected by the diameter of each segment. For the bottom and top chains, an R4 grade studless chain is used. The weight and MBL of the R4 chain are estimated from formulas in the ABS guide [15]. For steel wire, Xtreme Spiral Strand Wire rope (BRIDON-BEKAERT ROPES GROUP, Belgium, Zwevegm) from Bridon is used, and the formulas for estimated weight and MBL are derived using catalogue data supplied by the manufacturers [16]. As shown in Figure 3, the regression method is used to find the general expressions for line properties.
The formulas used to estimate the MBL and mass of the chain and steel wire in terms of diameter are summarized in Equations (2)–(5).
For the R4 studless chain,
MBL [kN] = 0.0274 d2 (44 − 0.08 d)
Weight [kg/m] = 0.0195 d2
where d is the nominal diameter of the chain.
For steel wire,
MBL [kN] = 1.01959 x2 + 13.41521 x − 558.79587
Weight [kg/m] = 0.00466 x2 + 0.12263 x − 4.68428
where x is the diameter of the steel wire.
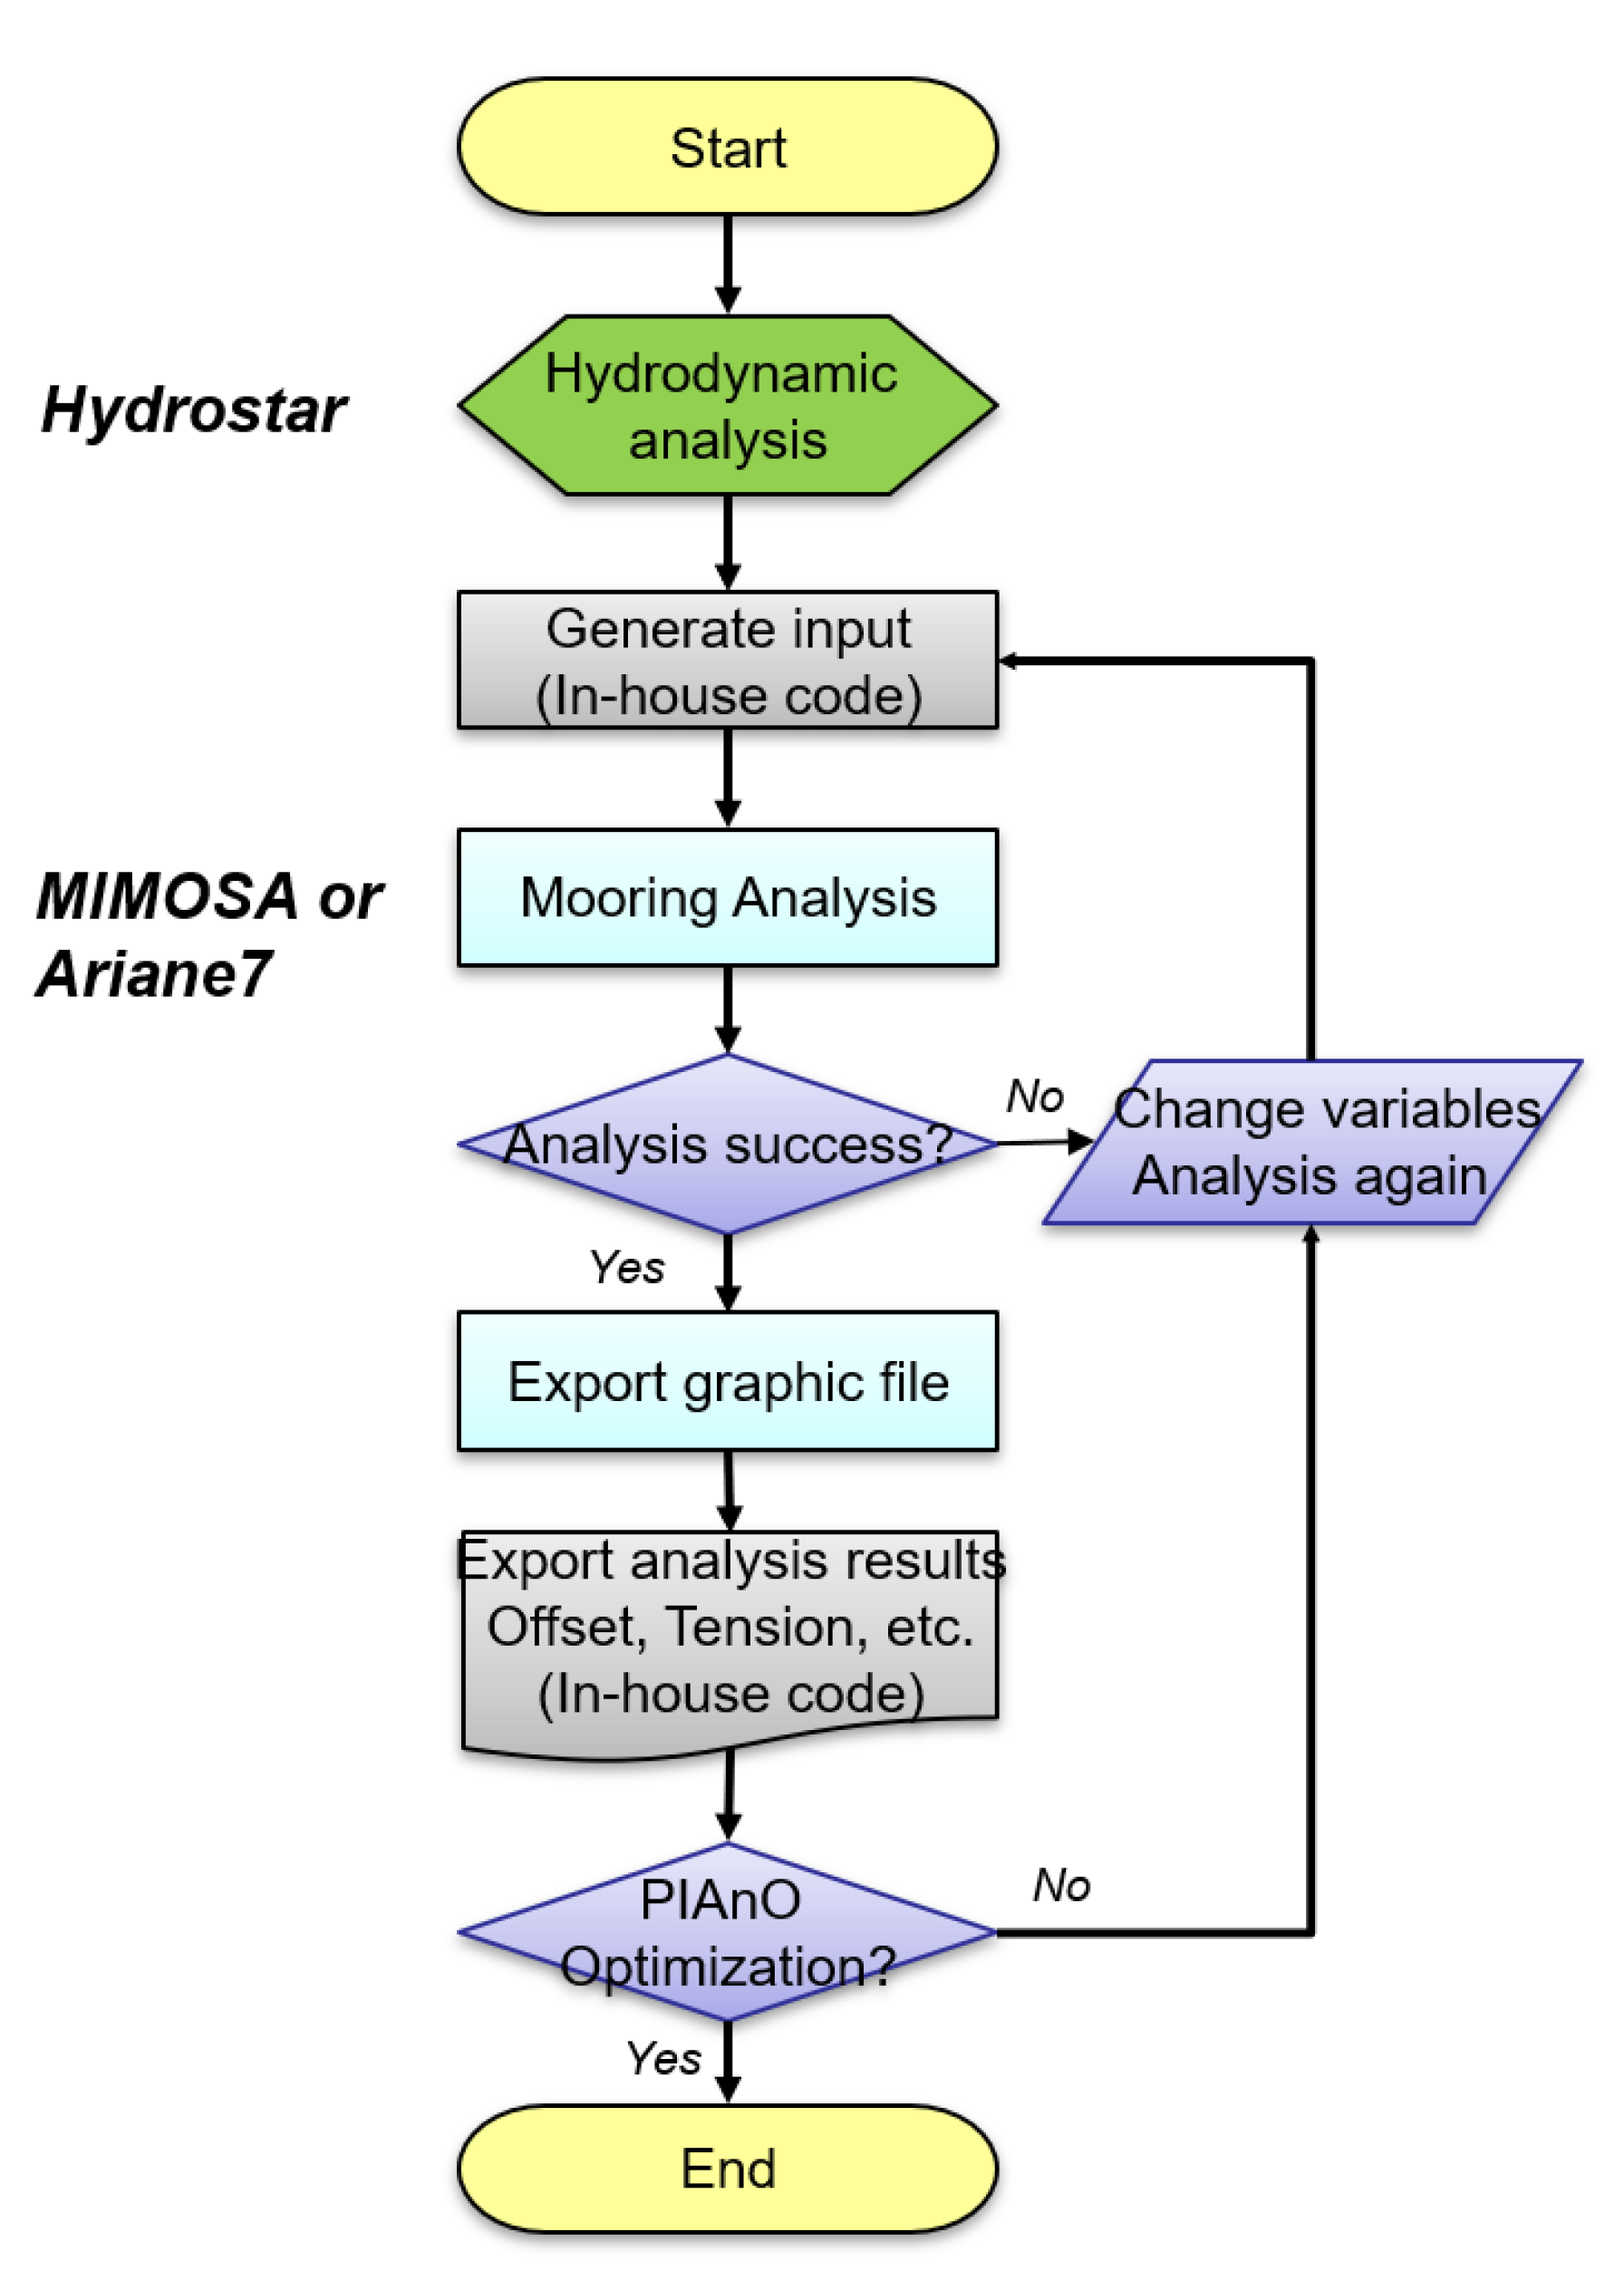
Figure 4 shows the overall flow of the optimization and automation algorithm. Each step is described as follows:
  • Define the optimization variables, constraints and objective function.
  • Specify the initial mooring system and design variables for the mooring software (MIMOSA for frequency domain analysis and Ariane7 for time-domain analysis).
  • Run the mooring software for the static equilibrium position of the floater and dynamic analysis of the mooring system and save the results.
  • Change the design variable and re-run the mooring software if an error occurs.
  • Start the optimization algorithm by PIAnO:
    (i)
    Check the objective function and constraints;
    (ii)
    Find a direction and a speed of convergence for the optimal solution;
    (iii)
    Evaluate the convergence and constraints. If the optimal solution is found, iterations will be stopped, else return to step 3 and repeat until the optimal solution is reached.
The PQRSM and GA algorithms are utilized in the present study to examine the effect of the optimization algorithms on the optimization solution. The PQRSL, known for a weak global optimization algorithm, is based on a gradient search method. The GA algorithm, known for global optimization, consists of heuristic combinatorial search techniques. It should be noted that the optimization run may be terminated due to improper search direction, the vicinity of variable boundaries or negative constraint values. In that case, the results are carefully checked and initial data or variable range are modified in order to find the improved solution.

3. Results of Mooring Optimization

This section presents three different mooring optimization results to demonstrate the effect of the optimization algorithm and mooring analysis methods. Table 4 shows the analysis matrix for the three cases. The optimization algorithm and analysis methods for each case are described. The initial condition of the mooring system is the same for all three cases.

3.1. Optimization Results for Case A

For case A, the PQRSM algorithm was used for the optimization of the mooring system cost, and the mooring system is analyzed in the frequency domain. After iterating 415 cases, the optimum solution is found at case 318. Figure 5 shows the initial and optimized mooring configurations. Figure 6 shows the configuration of optimized mooring line and its line characteristic. Table 5, Table 6 and Table 7 show the design variables, constraints and objective function values at an optimized condition. Compared to the initial case, the turret position of the optimized case is moved toward the center of the FPSO with a greater spread angle of the mooring lines. The adjacent angle of the mooring lines in a group is increased from 4.0 to 6.8. As the pretension is decreased, the line diameter of each segment is also decreased. The length of the top and bottom chains is reduced, while the steel wire length is increased. As shown in Table 6, constraint values at the optimum condition are close to the boundary of the constraint conditions. The PQRSM algorithm reduced the total weight of the mooring system by 50.7%.

3.2. Optimization Results for Case B

For case B, the GA algorithm is used for mooring system cost optimization, and the mooring system is analyzed in the frequency domain. GA searches the global minima and requires much more computing time compared to the weakly global minima algorithm, such as PQRSM. After calculating 32,502 cases, the optimum solution was found at case 31,325. Initial and optimized mooring configurations are shown in Figure 7. Figure 8 shows the configuration of optimized mooring line and its line characteristic. Table 8, Table 9 and Table 10 show the design variables, constraints, and objective function values at the optimized condition. Similarly to the PQRSM algorithm, the turret position is moved toward the center of the FPSO, and the adjacent angles of the mooring lines in a group are increased more than two-fold. Optimization using the GA increased the total number of the mooring lines from 9 to 12. This enables a significant reduction of each length of line segment compared to the PQRSM results. Interestingly, the GA finds the optimum solution by reducing all segment lengths and diameters and increasing the number of lines, while PQRSM finds the optimum solution by increasing steel wire length and decreasing the chain length. The GA requires about 78 times more iterations to find the optimum solution than that of PQRSM. As shown in Table 9, the constraint values satisfy the constraint conditions at the vicinity of the boundary. The PQRSM algorithm reduced total mooring system weight by 49.2%. From these results, the GA algorithm is not as efficient as PQRSM, which found the better optimized solution with less iterations. In this kind of optimization problem where the direction of optimization is very clear and optimum solution can be found by decreasing the diameter and length, the PQRSM found the response surface in the right direction, while the GA tried to find the optimized solution by increasing the number of lines.

3.3. Optimization Results for Case C

For case C, the PQRSM algorithm is used for the optimization of the mooring system cost, and the mooring system is analyzed in the time domain. Due to high computation costs, the GA cannot be applied to the time domain mooring analysis; only the PQRSM algorithm is used. In addition, because of the GUI-based feature of Ariane7, automation of the number of line and group changes is difficult, so the number of lines and groups are excluded from the design variables. After calculating 273 cases, the optimum solution is found at case 111. Figure 9 shows the initial and optimized mooring configurations and Figure 10 shows the configuration of optimized mooring line and its line characteristic. Table 11, Table 12 and Table 13 show the design variables, constraints and objective function values at the optimization condition. Similarly to the frequency domain analysis, the turret position is moved toward the center of the FPSO. Interestingly, the optimal solution tends to become a taut mooring system. Different from the frequency-domain mooring analysis (the cases A and B), the pretensions of the mooring lines are increased, and all segment lengths are reduced much more than those of the optimum conditions found from the frequency-domain analysis. The nonlinearity of the mooring line characteristic may cause these differences, and further investigation is required for clarification. Similarly to the frequency-domain analysis, constraint values satisfy the constraint conditions at the vicinity of boundary. The PQRSM algorithm reduced the total weight of the mooring system by 54.4%.
Figure 11 shows the time series of FPSO motions and mooring line tensions at the optimized case. The simulation duration is 3 hours, and the time series clearly shows the low frequency and wave frequency responses. Considering the environment directions, the mooring line tensions aligns with FPSO surge motions.

4. Conclusions

In this study, an optimization method is proposed to improve the mooring system design procedure and reduce the cost of the mooring system. The FPSO with the internal turret mooring system is selected as the target system. The initial mooring system is a three (mooring lines) by three (groups) system with catenary mooring lines. It is assumed that the mooring system weight is proportional to the mooring system’s cost, and the objective function is defined as minimizing the cost of the mooring system by satisfying the constraints. Global and weakly global optimization schemes are used to investigate the effect of the optimization scheme. For the mooring system analysis, which should be done inside the optimization loop, commercial frequency and time-domain analysis tools are utilized. Three cases are studied depending on the optimization scheme and the mooring system analysis method. The following conclusions are drawn:
  • For all three cases, the cost of the mooring system is successfully reduced by reducing the weight of the mooring system by more than 49.2%.
  • For cases A and B, where the mooring analysis was done in the frequency domain, the optimum mooring system tends to reduce segment diameters rather than segment lengths, and maintains the catenary mooring system.
  • Comparing the optimization scheme in the frequency domain analysis, the PQRSM finds the optimum solution with increased steel wire lengths, while the GA finds the optimum solution by reducing segment lengths and diameters and increasing the number of lines. GA is not as efficient as PQRSM, and requires about 78 times more iterations to find the optimum solution than that of PQRSM.
  • To reflect the nonlinearity of mooring line stiffness, the time domain analysis is performed. During the time-domain analysis, the optimized mooring system increased pretensions and decreased the segment length. Thus, the optimum mooring system is similar to the taut mooring system, rather than the catenary mooring system defined at the initial condition.
  • The results presented in this study are promising for the optimization of mooring system designs. However, the actual mooring design at the final design stage will be more complicated, and the following should be studied further:
    • Several loading conditions should be considered.
    • Fatigue analysis and damaged analysis should be considered.
    • Multiple environment conditions should be used for the universe mooring system design.
    • A sensitivity study of design variables should be conducted.

Author Contributions

Conceptualization, S.J.; methodology, H.P. and S.J.; software, H.P. and S.J.; validation, H.P.; formal analysis, H.P. and S.J.; investigation, H.P. and S.J.; resources, H.P. and S.J.; writing—original draft preparation, H.P.; writing—review and editing, H.P. and S.J.; visualization, H.P. and S.J.; supervision, H.P. and S.J.; project administration, H.P. and S.J.; funding acquisition, S.J. All authors have read and agreed to the published version of the manuscript.

Funding

This research was funded by Korea Research Institute of Ships and Ocean Engineering, grant number PES3920.

Institutional Review Board Statement

Not applicable.

Informed Consent Statement

Not applicable.

Data Availability Statement

Not Applicable.

Acknowledgments

This research was supported by a grant from the Endowment Project of “Development of Performance Evaluation Technology for KRISO Standard Offshore Structures in the Deep Ocean Engineering Basin (DOEB)” funded by the Korea Research Institute of Ships and Ocean Engineering (PES3920). All support is gratefully acknowledged.

Conflicts of Interest

The authors declare no conflict of interest.

References

  1. Chkrabarti, S.K. Handbook of Offshore Engineering, 1st ed.; Elsevier: Amsterdam, The Netherlands, 2005. [Google Scholar]
  2. Det Norske Veritas Germanischer Lloyd (DNVGL). DNV-RP-C205 Environmental Conditions and Environmental Loads; DNV: Oslo, Norway, 2014. [Google Scholar]
  3. Bureau Veritas (BV). Classification of Mooring Systems for Permanent Offshore Units, NR 493 DT R02E; BV: Paris, France, 2012. [Google Scholar]
  4. American Petroleum Institute (API). Design and Analysis of Stationkeeping Systems for Floating Structures, Recommended Practice API-RP-2SK, 3rd ed.; API: Washington, DC, USA, 2005. [Google Scholar]
  5. Weller, S.; Johanning, L.; Victor, L.; Heath, J.; Eddy, J.; Jensen, R.; Banfield, S.; DTOcean. Deliverable 4.5: Mooring and Foundation Module Framework for DTOcean Tool; No. 608597; DTOcean, 2015; Available online: https://www.dtoceanplus.eu/content/download/2526/file/DTO_WP4_EDC_D4.5.pdf (accessed on 27 May 2021).
  6. Ocean Energy Systems (OES); International Energy Agency (IEA). International Levelized Cost of Energy for Ocean Energy Technologies; OES: Portland, OR, USA, 2017. [Google Scholar]
  7. Carbon Trust. Accelerating Marine Energy: The Potential for Cost Reduction—Insights from the Carbon Trust Marine Energy Accelerator; Carbon Trust: London, UK, 2011. [Google Scholar]
  8. Low Carbon Innovation Coordination Group. Technology Innovation Needs Assessment (TINA), Marine Energy Summary Report. Available online: https://www.carbontrust.com/media/168547/tina-marine-energy-summary-report.pdf (accessed on 5 November 2017).
  9. Fylling, I. Optimization of Deepwater Mooring Systems. In Proceedings of the Offshore Mediterranean Conference, Ravenna, Italy, 19–21 March 1997. [Google Scholar]
  10. Fylling, I.; Kleiven, G. Integrated Optimized Design of Riser and Mooring System for Floating Production Vessels. In Proceedings of the OMAE 2000 Conference, Ocean Engineering Symposium, New Orleans, LA, USA, 14–16 February 2000. [Google Scholar]
  11. Fylling, I.; Berthelsen, P. WINDOPT: An Optimization Tool for Floating Support Structures for Deep Water Wind Turbines. In Proceedings of the ASME 2011 30th International Conference on Ocean, Offshore and Arctic Engineering, Rotterdam, The Netherlands, 19–24 June 2011. OMAE2011-49985. [Google Scholar]
  12. MARINTEK. MIMOSA User’s Documentation; MARINTEK: Trondheim, Norway, 2012; Available online: https://home.hvl.no/ansatte/tct/FTP/H2020%20Marinteknisk%20Analyse/SESAM/SESAM%20UM%20Brukermanualer/Mimosa%20User%20Manual.pdf (accessed on 27 May 2017).
  13. Mahdi, M.; Maimun, A.; Priyanto, A.; Fitriadhy, A. Mooring Pattern Optimization Using A Genetic Algorithm. J. Teknol. 2014, 66. [Google Scholar] [CrossRef] [Green Version]
  14. Bureau Veritas (BV). Hydrostar for Experts User Manual; BV: Paris, France, 2018. [Google Scholar]
  15. America Bureau of Shipping (ABS). Guide for the Certification of Offshore Mooring Chain; ABS: Houston, TX, USA, 2017. [Google Scholar]
  16. Bridon-Bekaert. Available online: https://www.bridon-bekaert.com/en-gb/steel-and-synthetic-ropes/offshore-production/mooring/permanent-mooring-lines/spiral-strand (accessed on 27 May 2017).
Figure 1. The coordinate convention and environmental condition direction.
Jmse 09 00581 g001
Figure 2. The panel model used for the hydrodynamic analysis.
Jmse 09 00581 g002
Figure 3. The estimated MBL (top) and mass (bottom) of the steel wire in terms of diameter.
Jmse 09 00581 g003
Figure 4. The overall flow chart of optimization and automation algorithm.
Jmse 09 00581 g004
Figure 5. Initial (top) and optimized (bottom) mooring configurations for Case A.
Jmse 09 00581 g005
Figure 6. Optimized mooring line configuration (left) and its line characteristic (right), Case A.
Jmse 09 00581 g006
Figure 7. Initial (top) and optimized (bottom) mooring configuration for Case B.
Jmse 09 00581 g007
Figure 8. Optimized mooring line configuration (left) and its line characteristic (right), Case B.
Jmse 09 00581 g008
Figure 9. The initial (top) and optimized (bottom) mooring configuration for case C.
Jmse 09 00581 g009
Figure 10. Optimized mooring line configuration (left) and its line characteristic (right).
Jmse 09 00581 g010
Figure 11. Time series of FPSO motions (Sway (top left), Surge (top right), Yaw (bottom left) and mooring line tensions (bottom right) at the optimized case.
Jmse 09 00581 g011
Table 1. The particulars of the FPSO.
LPP (m)320.0
Breadth (m)58.8
Depth (m)32.0
Draft (m)11.0
Mass (MT)204,496
Longitudinal position COG from midship (m)−4.23
Vertical position COG from keel (m)26.42
Corrected metacentric height (m)3.70
Roll radius of gyration (m)24.19
Pitch radius of gyration (m)83.92
Yaw radius of gyration (m)83.87
Turret position from midship (m)130.0
Table 2. Environmental conditions for the ULS design.
Water depth500 (m)Assumed as deep water
WaveHs = 10 m, Tp = 14 s0 degree (from North)
Wind (1 h ave.)30 (m/s)30 degrees (Wave + 30 deg)
Current0.9 (m/s)60 degrees (Wave + 60 deg)
Table 3. The initial values, lower and upper bounds for each design parameter.
Design VariablesInitial ConditionLower BoundUpper Bound
Turret position from midship [m]13020180
Number of mooring lines 318
Number of groups316
Adjacent angle between mooring lines in a group [deg.]4.02.015.0
Bottom chain length [m]8002001200
Steel wire length [m]6002001200
Top chain length [m]15050300
Bottom chain diameter [mm]14050200
Steel wire diameter [mm]13050200
Top chain diameter [mm]14050200
Pretension [kN]200010003000
Table 4. The analysis matrix.
CaseOptimization AlgorithmMooring Analysis Domain
APQRSMFrequency domain
BGAFrequency domain
CPQRSMTime domain
Table 5. The results of the mooring system optimization for case A.
Design VariablesInitial Condition (Iteration 0)Optimum Condition (Iteration 318)
Turret position from midship (m)13087.27
Number of mooring lines (-)33
Number of groups (-)33
Adjacent angle between mooring lines in a group (deg.)4.06.8
Pretension (kN)20001557.7
Bottom chain length (m)800675.3
Steel wire length (m)600683.1
Top chain length (m)150107.5
Bottom chain diameter (mm)140104.7
Steel wire diameter (mm)13099.7
Top chain diameter (mm)140108.6
Table 6. The constraint results for case A.
ConstraintsInitial Condition (Iteration 0)Optimum Condition (Iteration 318)Constraint Conditions
Top tension SF (-)2.992.50≤2.5
Anchor tension (kN)38383988.8<4000
Offset (m)46.449.45≤50
Table 7. Objective function results for case A.
Objective FunctionInitial Condition (Iteration 0)Optimum Condition (Iteration 318)
Mooring system weight (kg)3,871,0121,906,264
Table 8. The results of mooring system optimization for case B.
Design VariablesInitial Condition (Iteration 0)Optimum Condition (Iteration 31,325)
Turret position from midship (m)13068.78
Number of mooring lines (-)34
Number of groups (-)33
Adjacent angle between mooring lines in a group (deg.)4.09.74
Pretension (kN)20001589.4
Bottom chain length (m)800533.7
Steel wire length (m)600590.8
Top chain length (m)15056.4
Bottom chain diameter (mm)140104.8
Steel wire diameter (mm)130100.3
Top chain diameter (mm)140108.7
Table 9. Constraint results for case B.
ConstraintInitial Condition (Iteration 0)Optimum Condition (Iteration 31,325)Constraint Conditions
Top tension SF (-)2.992.50≤2.5
Anchor tension (kN)38383978<4000
Offset (m)46.445.8≤50
Table 10. Objective function results for case B.
Objective FunctionInitial Condition (Iteration 0)Optimum Condition (Iteration 31,325)
Mooring system weight (kg)3,871,0121,967,056
Table 11. The results of mooring the system optimization for case C.
Design VariablesInitial Condition (Iteration 0)Optimum Condition (Iteration 111)
Turret position from midship (m)130113.54
Adjacent angle between mooring lines in a group (deg.)4.02.0
Pretension (kN)20002081
Bottom chain length (m)800490
Steel wire length (m)600429
Top chain length (m)15093.5
Bottom chain diameter (mm)140117.3
Steel wire diameter (mm)130121
Top chain diameter (mm)140117.3
Table 12. The constraint results for case C.
ConstraintInitial Condition (Iteration 0)Optimum Condition (Iteration 111)Constraint Conditions
Top tension SF (-)2.992.50≤2.5
Anchor tension (kN)38383987<4000
Offset (m)46.448.03≤50
Table 13. Objective function results for case C.
Objective FunctionInitial Condition (Iteration 0)Optimum Condition (Iteration 111)
Mooring system weight (kg)3,871,0121,765,181
Publisher’s Note: MDPI stays neutral with regard to jurisdictional claims in published maps and institutional affiliations.

