Article

Origin of the Particulate Organic Matter in a Monsoon-Controlled Bay in Southern China

1
Institute of Marine Science, Shantou University, Shantou 515063, China
2
College of Ocean and Meteorology, Guangdong Ocean University, Zhanjiang 524088, China
*
Author to whom correspondence should be addressed.
J. Mar. Sci. Eng. 2021, 9(5), 541; https://doi.org/10.3390/jmse9050541
Submission received: 28 March 2021 / Revised: 8 May 2021 / Accepted: 9 May 2021 / Published: 17 May 2021
(This article belongs to the Section Chemical Oceanography)

Abstract

:
In this study, the isotopic composition (δ13C and δ15N), total organic carbon content, total nitrogen content, and C/N ratios of suspended particulate organic matter (POM) in Zhanjiang Bay, which is a semi-enclosed bay with concentrated artificial activities in Southern China, were analyzed in order to investigate the seasonal variations in the principal POM sources in the monsoon region. In summer, the δ13C and δ15N values showed a weak correlation with the chlorophyll a (Chl a), suggesting that terrigenous sources were dominant. However, in winter, the particulate organic carbon and particulate nitrogen values were correlated with the Chl a in the middle bay and bay mouth. Moreover, the δ13C values showed a significant correlation with Chl a during the winter, indicating that the contribution of the in situ phytoplankton was relatively important and was affected by the monsoon in winter. Compared with the corresponding δ13C values, the δ15N values exhibited a complex spatial distribution. By using a Bayesian mixing model, in the upper bay, the source of POM was mainly from marine organic matter (49%) in summer, and almost an equilibrated contribution of all sources in winter. In the middle bay and bay mouth, the POM contribution mainly originated from marine organic matter (53%) during the winter. In contrast, the POM source was mainly soil organic matter (63%) in summer, suggesting that the POM was sourced from the runoff from the upstream basin. Our results suggest that the seasonal shifts of the source of POM should be taken into account when estimating C or N mass balance in the monsoon-controlled bay.

1. Introduction

Environmental pollution and eutrophication are causing significant problems in estuaries and coastal waters worldwide [1]. The particulate organic matter (POM) in coastal waters is a complex mixture of marine and terrestrial organic compounds that are sensitive to eutrophic and artificial activities [2,3]. In marine systems, POM plays a significant role in the carbon and nitrogen cycling because it can sustain high biological activity, which is significant for both the global and local carbon and nitrogen cycles [4,5,6,7,8].
The stable C and N isotope compositions (δ13C and δ15N) and the C/N ratios have been extensively used to discriminate organic matter sources in water environments and to investigate the impacts of human activities [9,10,11]. Terrestrial plants are usually divided into C3 and C4 plants based on their carbon sequestration photosynthesis [12]. The δ13C of C3 plants averages −27‰ and ranges from −30‰ to −23‰, while that of C4 plants averages −13‰ and ranges from −16‰ to −10‰ [12,13]. The values of terrestrial organic matter are generally lower than those of river algae because they absorb carbon with higher δ13C values [14]. Thus, the δ13C values of marine organic matter range from −22‰ to −18‰ [15,16]. Similarly, the δ15N of terrestrial vascular plants ranges from −5‰ to 18‰ (3‰ in average), whereas that of marine organic matter ranges from 3‰ to 12‰ (6‰ in average) [17,18]. Moreover, the δ15N values of sewage and livestock waste are typically 10‰ to 22‰ [19]. In aquatic environments, the C/N ratio has also been widely used to discriminate the sources of organic matter [10,20,21]. The molar C/N ratios of marine organisms range from 5 to 8; whereas those of terrestrial organisms are 20 or greater [13]. Therefore, it is very important to understand the spatial and temporal changes in δ13C, δ15N, and C/N and the factors controlling their distributions in order to determine the sources of the POM and to clarify the N and C biogeochemistry.
Zhanjiang Bay is a semi-enclosed bay linking to the northwestern part of the South China Sea. A large number of rivers drain into it, the largest of which is the Suixi River. Furthermore, there are many outlets that directly discharge sewage into the bay [22]. Recently, a large amount of pollutants were discharged into Zhanjiang Bay as a result of the rapid economic growth [23]. Researchers have reported temporal and spatial eutrophication variations in Zhanjiang Bay [24]. Li et al. (2020) found that a large quantity of terrestrial material was imported into Zhanjiang Bay, impacting its ecosystem [25]. Therefore, determining the sources of the POM in the bay is of great importance to controlling regional water eutrophication. Although several studies have examined the stable carbon and nitrogen isotope compositions in Zhanjiang Bay, many of these studies were confined to the surface sediments [26], and no systematic studies have been conducted to elucidate the sources and distribution of the POM in Zhanjiang Bay. Since the bay is controlled by the monsoon seasons and experiences concentrated and frequent human activities, the seasonal changes in the POM sources and their biogeochemical processes are not well constrained. Thus, it is necessary to sample and analyze the POM in the surface seawater of Zhanjiang Bay in order to further understand the effects of the seasonal changes and human activities on the marine ecosystem.
In this study, we reported the spatial and temporal distributions of the particulate organic carbon (POC) and particulate nitrogen (PN), and the isotopic compositions (δ13C and δ15N) of the POM in Zhanjiang Bay in 2017. Then, these findings were used to evaluate the main sources of the POM and to evaluate the biogeochemical processes controlling their variations for the eutrophication management.

2. Materials and Methods
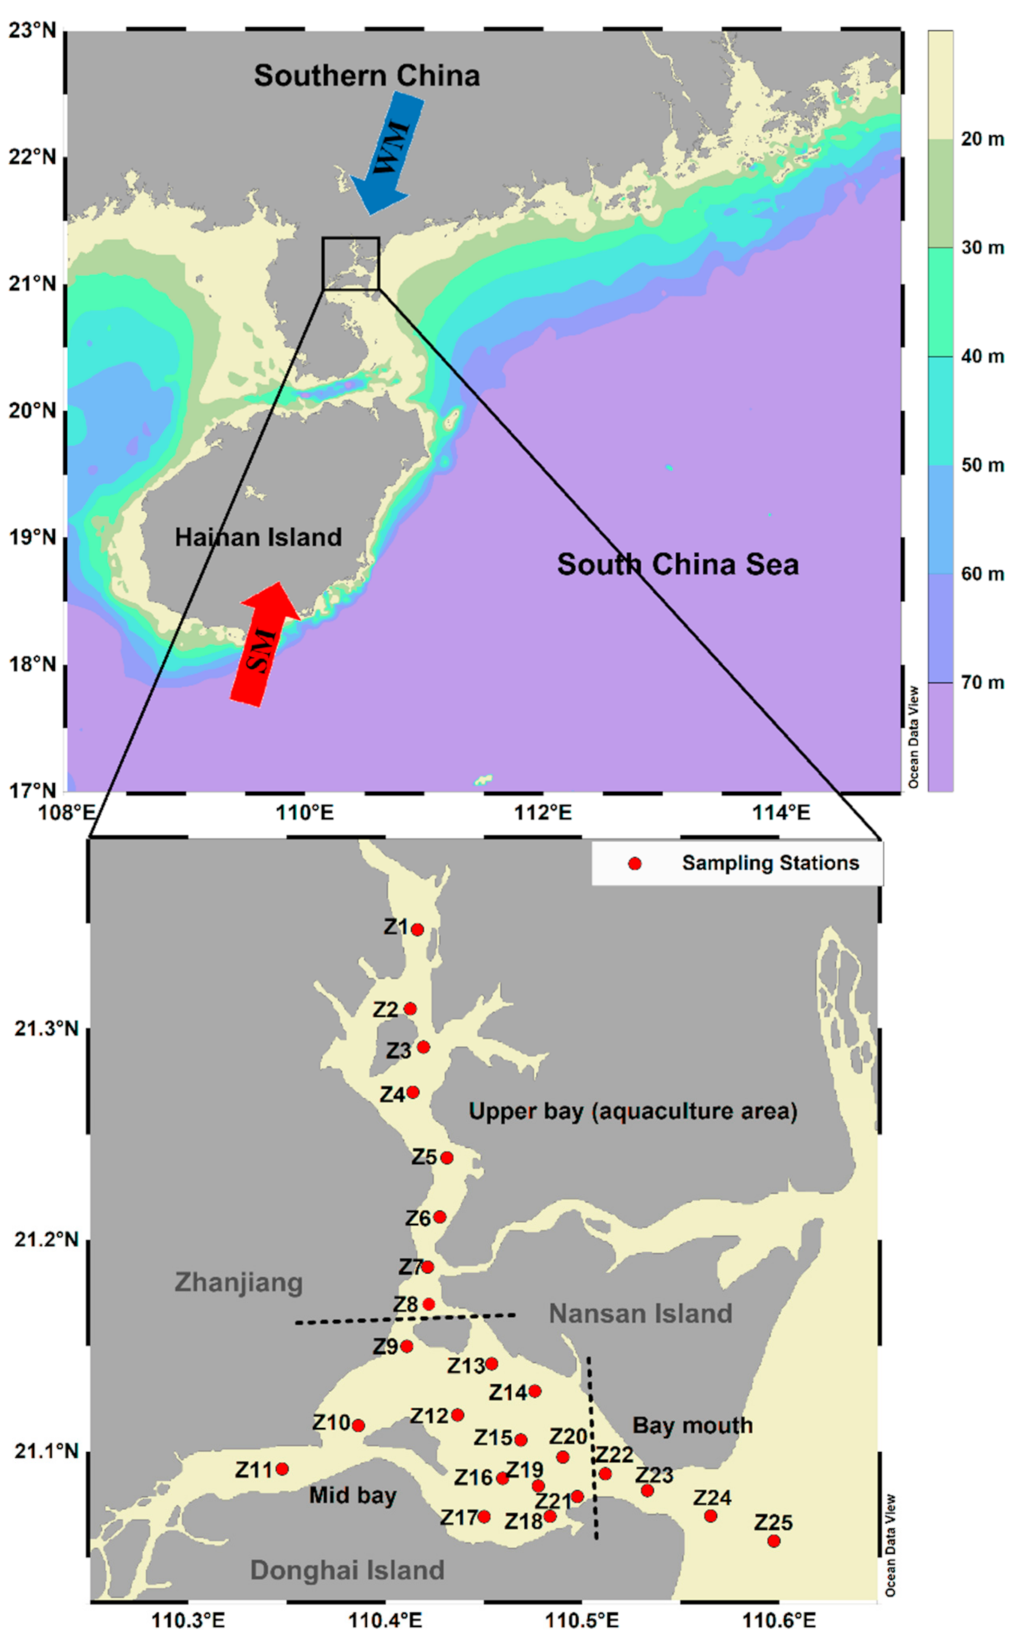
2.1. Field Sampling

Located in the western part of the Guangdong Province, China, Zhanjiang Bay is characterized by a typical monsoon climate. It is a region with a well-developed agriculture. Moreover, Zhanjiang Bay is heavily affected by concentrated human activities, such as industry, mariculture, shipping, and agriculture. The river inflow of Zhanjiang Bay is 8.26 × 10⁹ m3/y, among which the runoff of Suixi River is 7.88 × 10⁹ m3/y and that of other rivers is 3.82 × 10⁸ m3/y [27]. The sewage input flow is 1.51 × 10⁸ m3/y, which is far less than the river input [27]. The Suixi River is the main discharge of local river influencing Zhanjiang Bay. Seawater from the northern part of the South China Sea has a significant impact on the water in Zhanjiang Bay (Figure 1). Due to its narrow mouth (approximately 2-km wide) and shallow water with the depth less than 50 m, it is difficult for the POM to be discharged into the sea. Zhanjiang Bay is controlled by monsoons, with hot and humid climate during the summer monsoon, and cool and dry climate during the winter monsoon (Figure 1). It receives significant precipitation in the spring and summer under the influence of the southwest monsoon. Heavy rainfall (75% of the annual rainfall) generally occurs during the summer and autumn, while the dry seasons are usually winter and spring [28].
The sampling for this study was conducted in summer (June 2017) and winter (December 2017). Surface seawater samples were collected from 25 sites using rose-shaped samplers with Niskin bottles. The salinity and temperature distributions were surveyed using a conductivity temperature depth instrument (SBE911, Seabird). After the surface water samples (approximately 5000 mL) from each site were collected, the isotope samples were pre-filtered using a 47-mm diameter glass fiber filter (GF/F) membrane (pre-combustion at 450 °C for 4 h) and were kept at −20 °C until analysis. In addition, the surface seawater was filtered through a GF/F (Whatman, 0.7 μm), and the membranes were stored at −20 °C before further processing and analysis to determine their chlorophyll a (Chl a) contents. As is shown in Figure 1, the eastern part of the bay’s mouth is the main point of exchange with the offshore water. It should be noted that for the purposes of this study, the sea area of investigation was divided into the upper bay, the middle bay, and the bay mouth.

2.2. Sample Analysis

The concentration of the suspended particulate matter (SPM) was calculated using the difference between the weight of the pre-weighed and re-weighed sample multiplied by the bulk weight of the filtered seawater sample. The samples were extracted with 90% acetone and their Chl a concentration was determined using fluorescence [29]. The filter membranes used for the POC concentration and δ13C analyses were placed in steam filled with condensed HCl for more than 48 h to remove and carbonate, and then they were washed three times with deionized water [30]. After the samples were acidified, the filter membranes were freeze-dried and stored in a dehumidifier until analysis [30]. The sample filter membranes used for the analysis were completely loaded tin cans and were measured using an elemental analysis isotope ratio mass spectrometer (EA-IRMS) (an EA Isolink series elemental analyzer interfaced with a MAT 253 plus mass spectrometer). In order to monitor the stability of the instrument and the accuracy of the measured value, every 5–10 samples were inserted into one copy of reference material for synchronous measurement. The standard substances were USGS64, USGS65, and USGS66. Instrument status and reliability of measured data were checked by synchronous measurement of reference substances. The analytical accuracy of the samples was better than 0.3% in our measurement process. The δ13C and δ15N were calculated in reference to Vienna Pee Dee Belemnite (VPDB) and atmospheric N2, respectively. The mean standard deviations of the δ13C and δ15N were ±0.2‰ and ±0.3‰, respectively, and those of the POC and PN concentrations were ±0.3%. The POC:Chla and C:N ratios are discussed below.

2.3. Isotope Mixing Model

The proportions of the contributions of the potential POM sources to Zhanjiang Bay were determined using the isotope mixing model for stable isotope analysis in R (SIAR, MixSIAR version 3.1.10), which is a package developed for a Bayesian steady mixing model. Additional details regarding the model’s use for quantifying various organic sources have been reported in previous studies [31,32].

3. Results

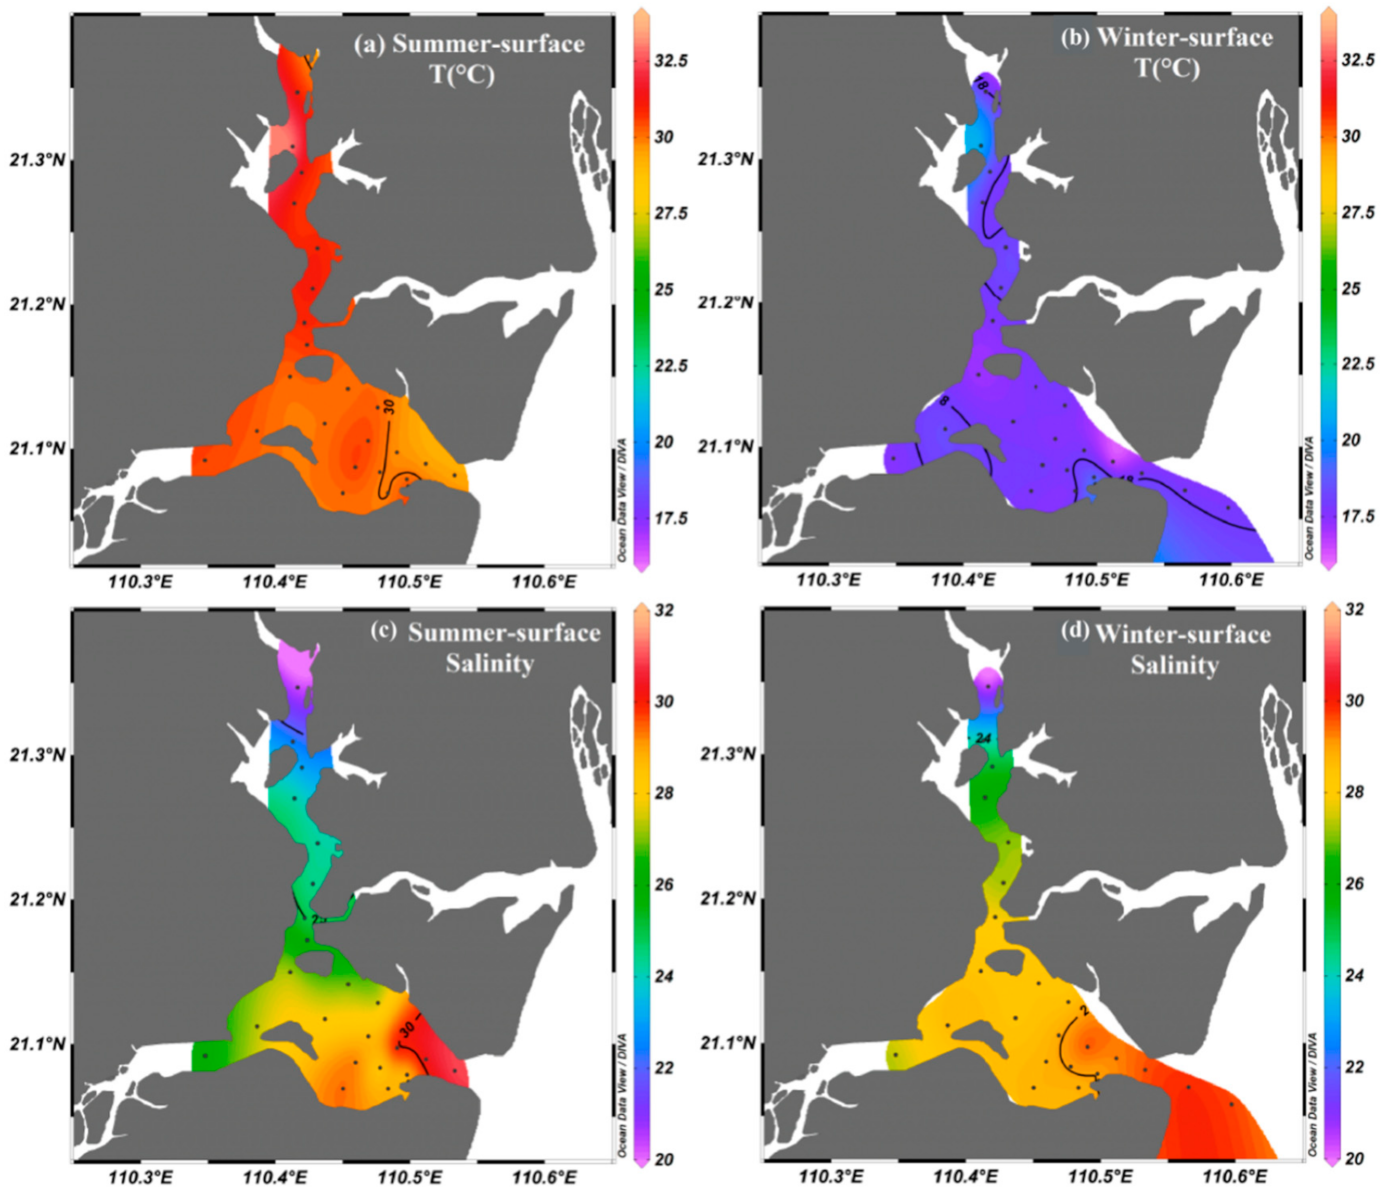
3.1. Hydrographic Properties
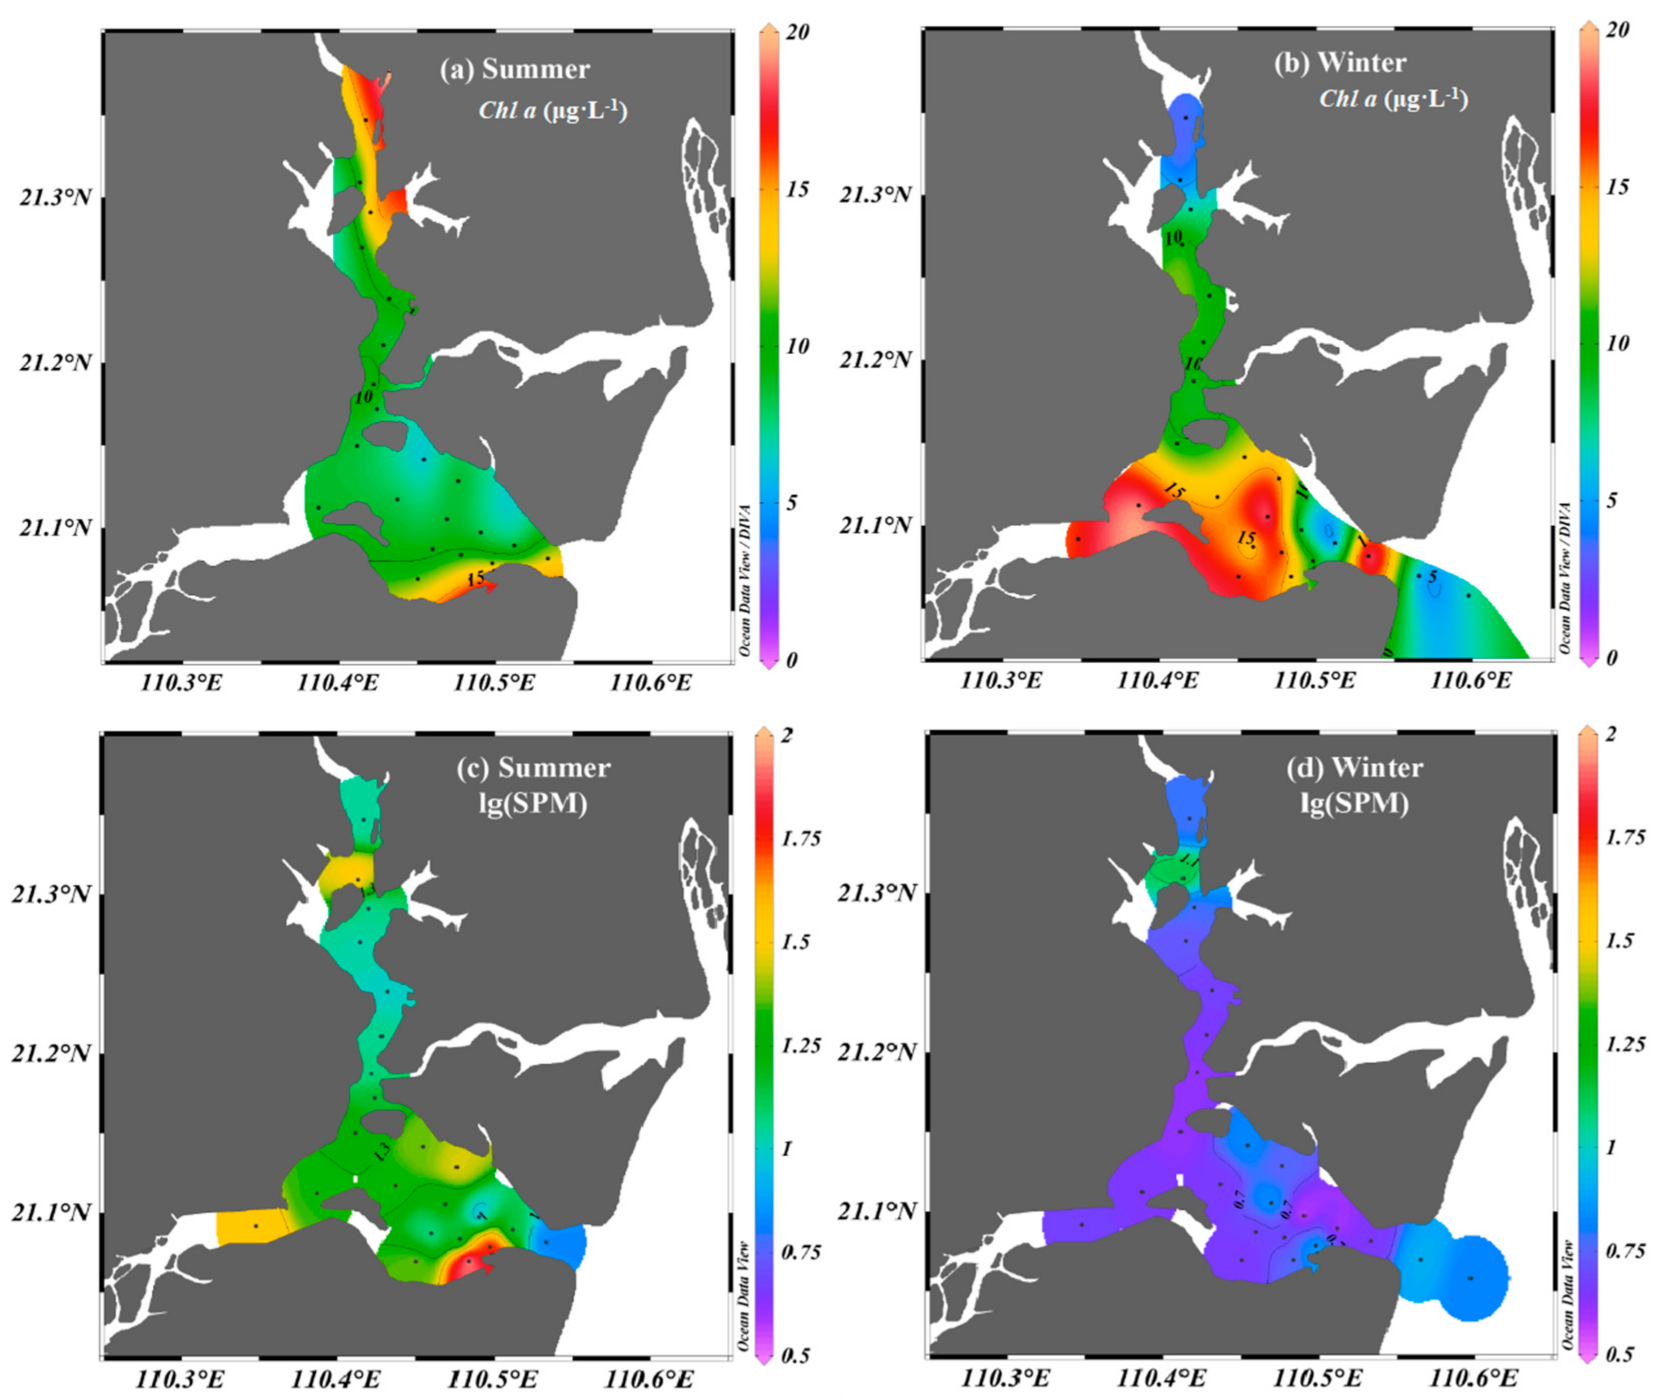
Figure 2 shows the seasonal and spatial distributions of the temperature and salinity. The water temperature exhibits significant seasonal changes, with higher temperatures in summer (28.9 to 33.4 °C, with an average of 30.3 °C), and lower temperatures in winter (16.4 to 21.3 °C, with an average of 17.9 °C). However, the distribution pattern of the salinity in summer was similar to that in winter, with a seaward increase in salinity in Zhanjiang Bay. The salinity was higher in winter (22.6 to 30.4, with an average of 28.3) and lower in summer (20.3 to 31.3, with an average of 27.4). Furthermore, the salinity in summer was lower than that in winter in the upper bay, which may be caused by the fluvial discharge during the rainy season.

3.2. Chl a and SPM

The seasonal and spatial changes in the Chl a and logarithmic suspended particulate matter (lg(SPM)) are illustrated in Figure 3. The Chl a concentrations ranged from 6.1 to 15.4 μg·L−1 (average of 10.0 μg·L−1) in summer and from 3.6 to 19.0 μg·L−1 (average of 11.9 μg·L−1) in winter. In addition, the SPM concentrations were higher in summer (6.6 to 95.0 mg·L−1) and lower in winter (3.6 to 13.8 mg·L−1). In general, the Chl a exhibited significant seasonal changes, with a higher Chl a concentration in summer, and a lower Chl a concentration in winter in the upper bay, whereas, in the middle bay and bay mouth, the Chl a concentration was higher in winter and lower in summer. Conversely, the SPM was homogenous, with the exception of station Z18 (Figure 3c).

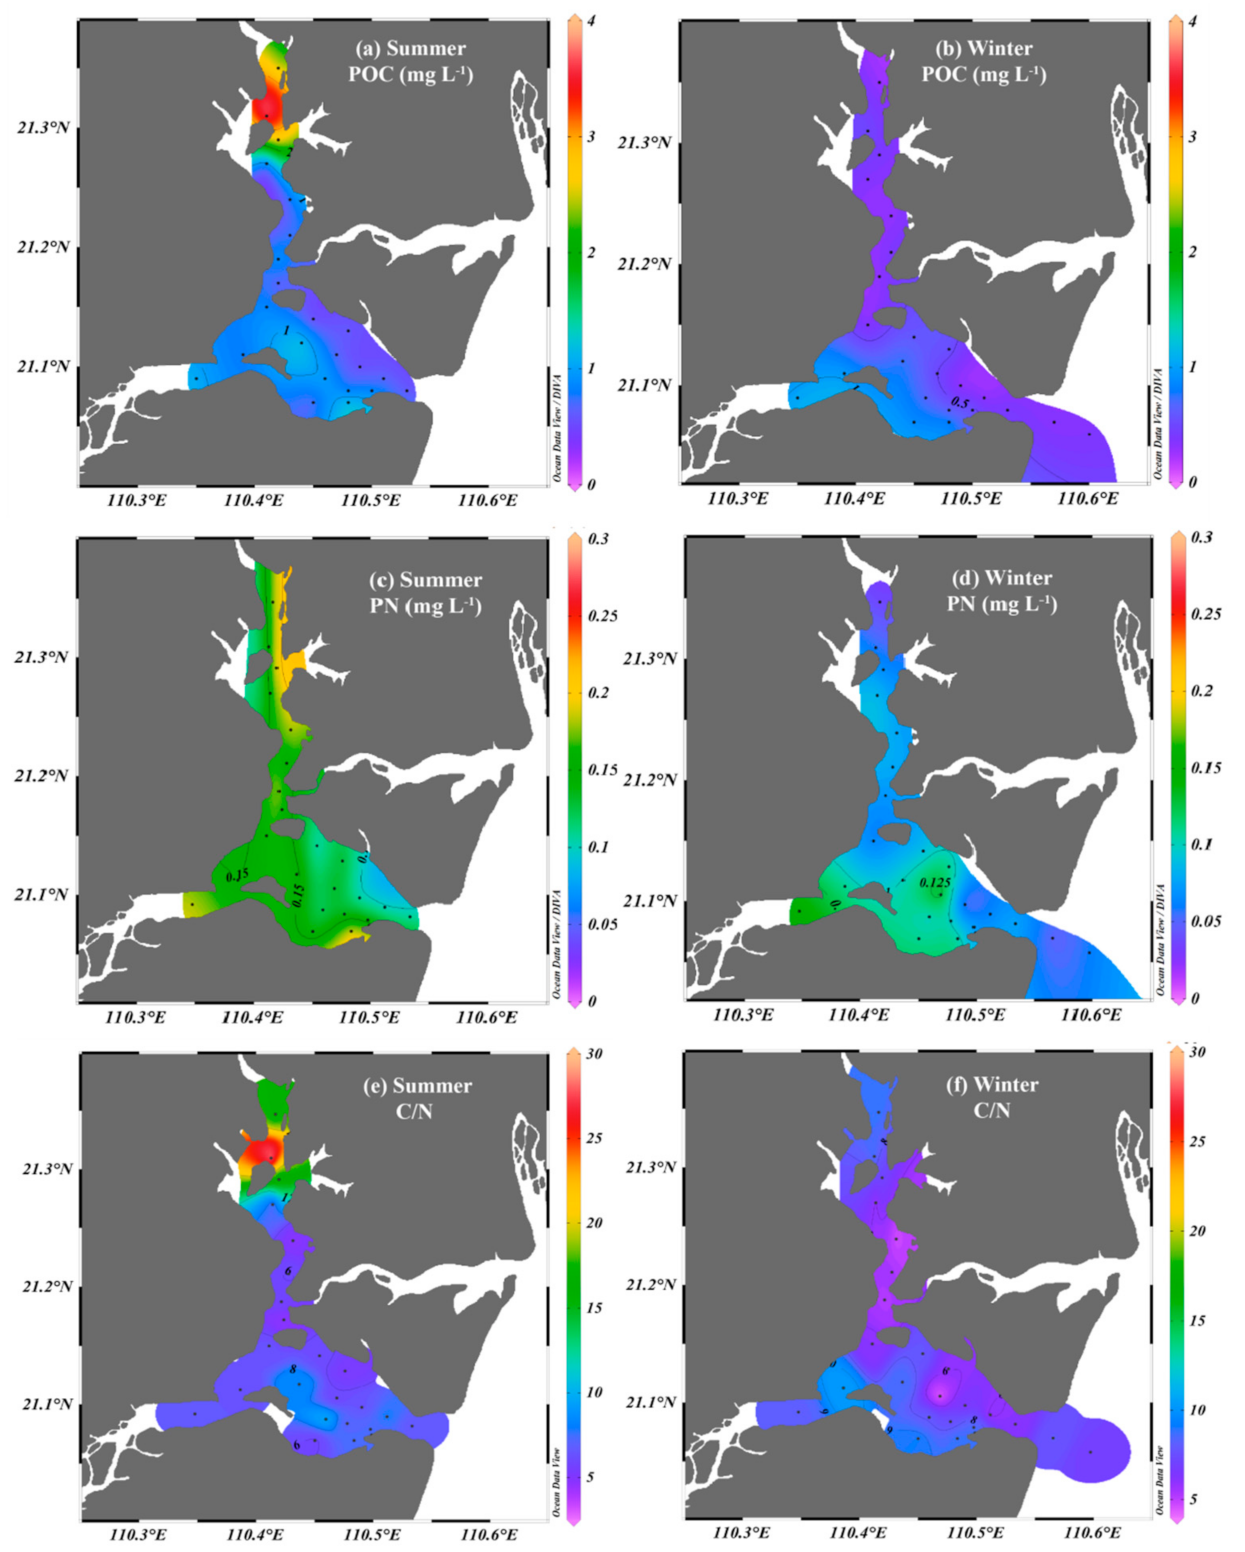
3.3. Organic Carbon, Nitrogen, and C/N Ratios

The seasonal and spatial distributions of the POC, PN, and C/N ratios are shown in Figure 4. The POC ranged from 0.6 to 3.7 mg L−1 (average of 1.1 mg·L−1) in summer and from 0.3 to 1.0 mg·L−1 (average of 0.5 mg·L−1) in winter. Furthermore, the results show that the POC concentrations were higher in summer than in winter. In addition, the PN ranged from 0.1 to 0.2 mg·L−1 (average of 0.2 mg·L−1) in summer and from 0.0 to 0.2 mg·L−1 (average of 0.1 mg·L−1) in winter. The spatial and seasonal distributions of the POC were similar to those of the PN. Both the POC and PN decreased seaward, with lower and higher concentrations in the middle and upper bays, respectively, in summer, and the opposite variation occurred in winter. It should be noted that the bay mouth was characterized by relatively low POC and PN values.
The C/N ratios varied from 4.6 to 29.6 (average of 8.4) in summer and from 4.3 to 10.3 (average of 7.3) in winter (Figure 4). The C/N ratios showed no obvious spatial changes during the winter. However, in summer, higher C/N ratios were found in the upper bay and lower ratios were found in the middle bay and bay mouth.

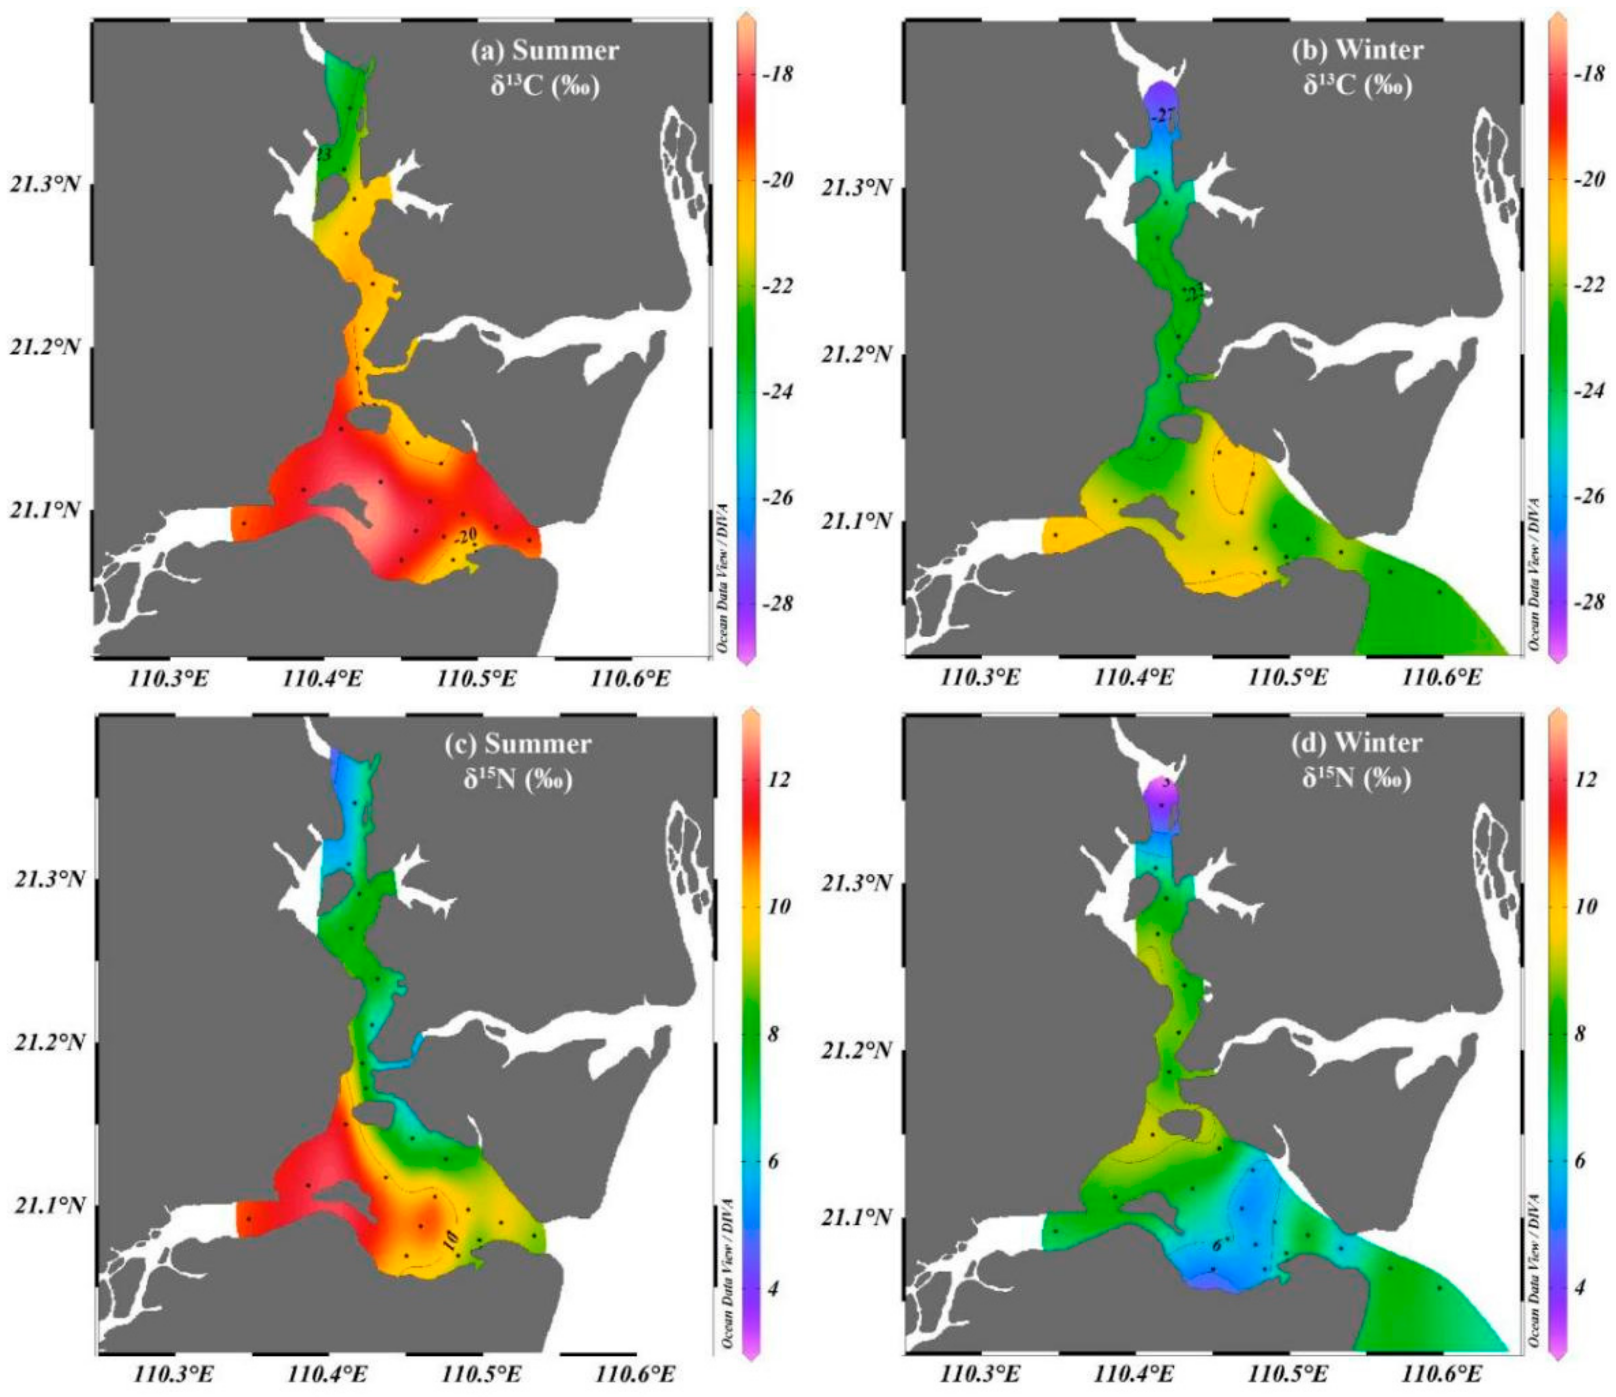
3.4. δ13C and δ15N of the POM

The seasonal and spatial distributions of the δ13C and δ15N values of the POM in the bay are shown in Figure 5. The δ13C values ranged from −23.0‰ to −17.7‰ (average of −19.8‰) in summer and from −27.3‰ to −20.5‰ (average of −22.5‰) in winter. Moreover, the δ15N values ranged from 5.4‰ to 11.9‰ (average of 9.0‰) in summer and from 3.7‰ to 9.3‰ (average of 7.0‰) in winter. The δ13C and δ15N values were slightly higher in summer than in winter. Generally, the δ13C and δ15N values increased seaward, with lower values in the upper bay and higher values in the middle bay and bay mouth.

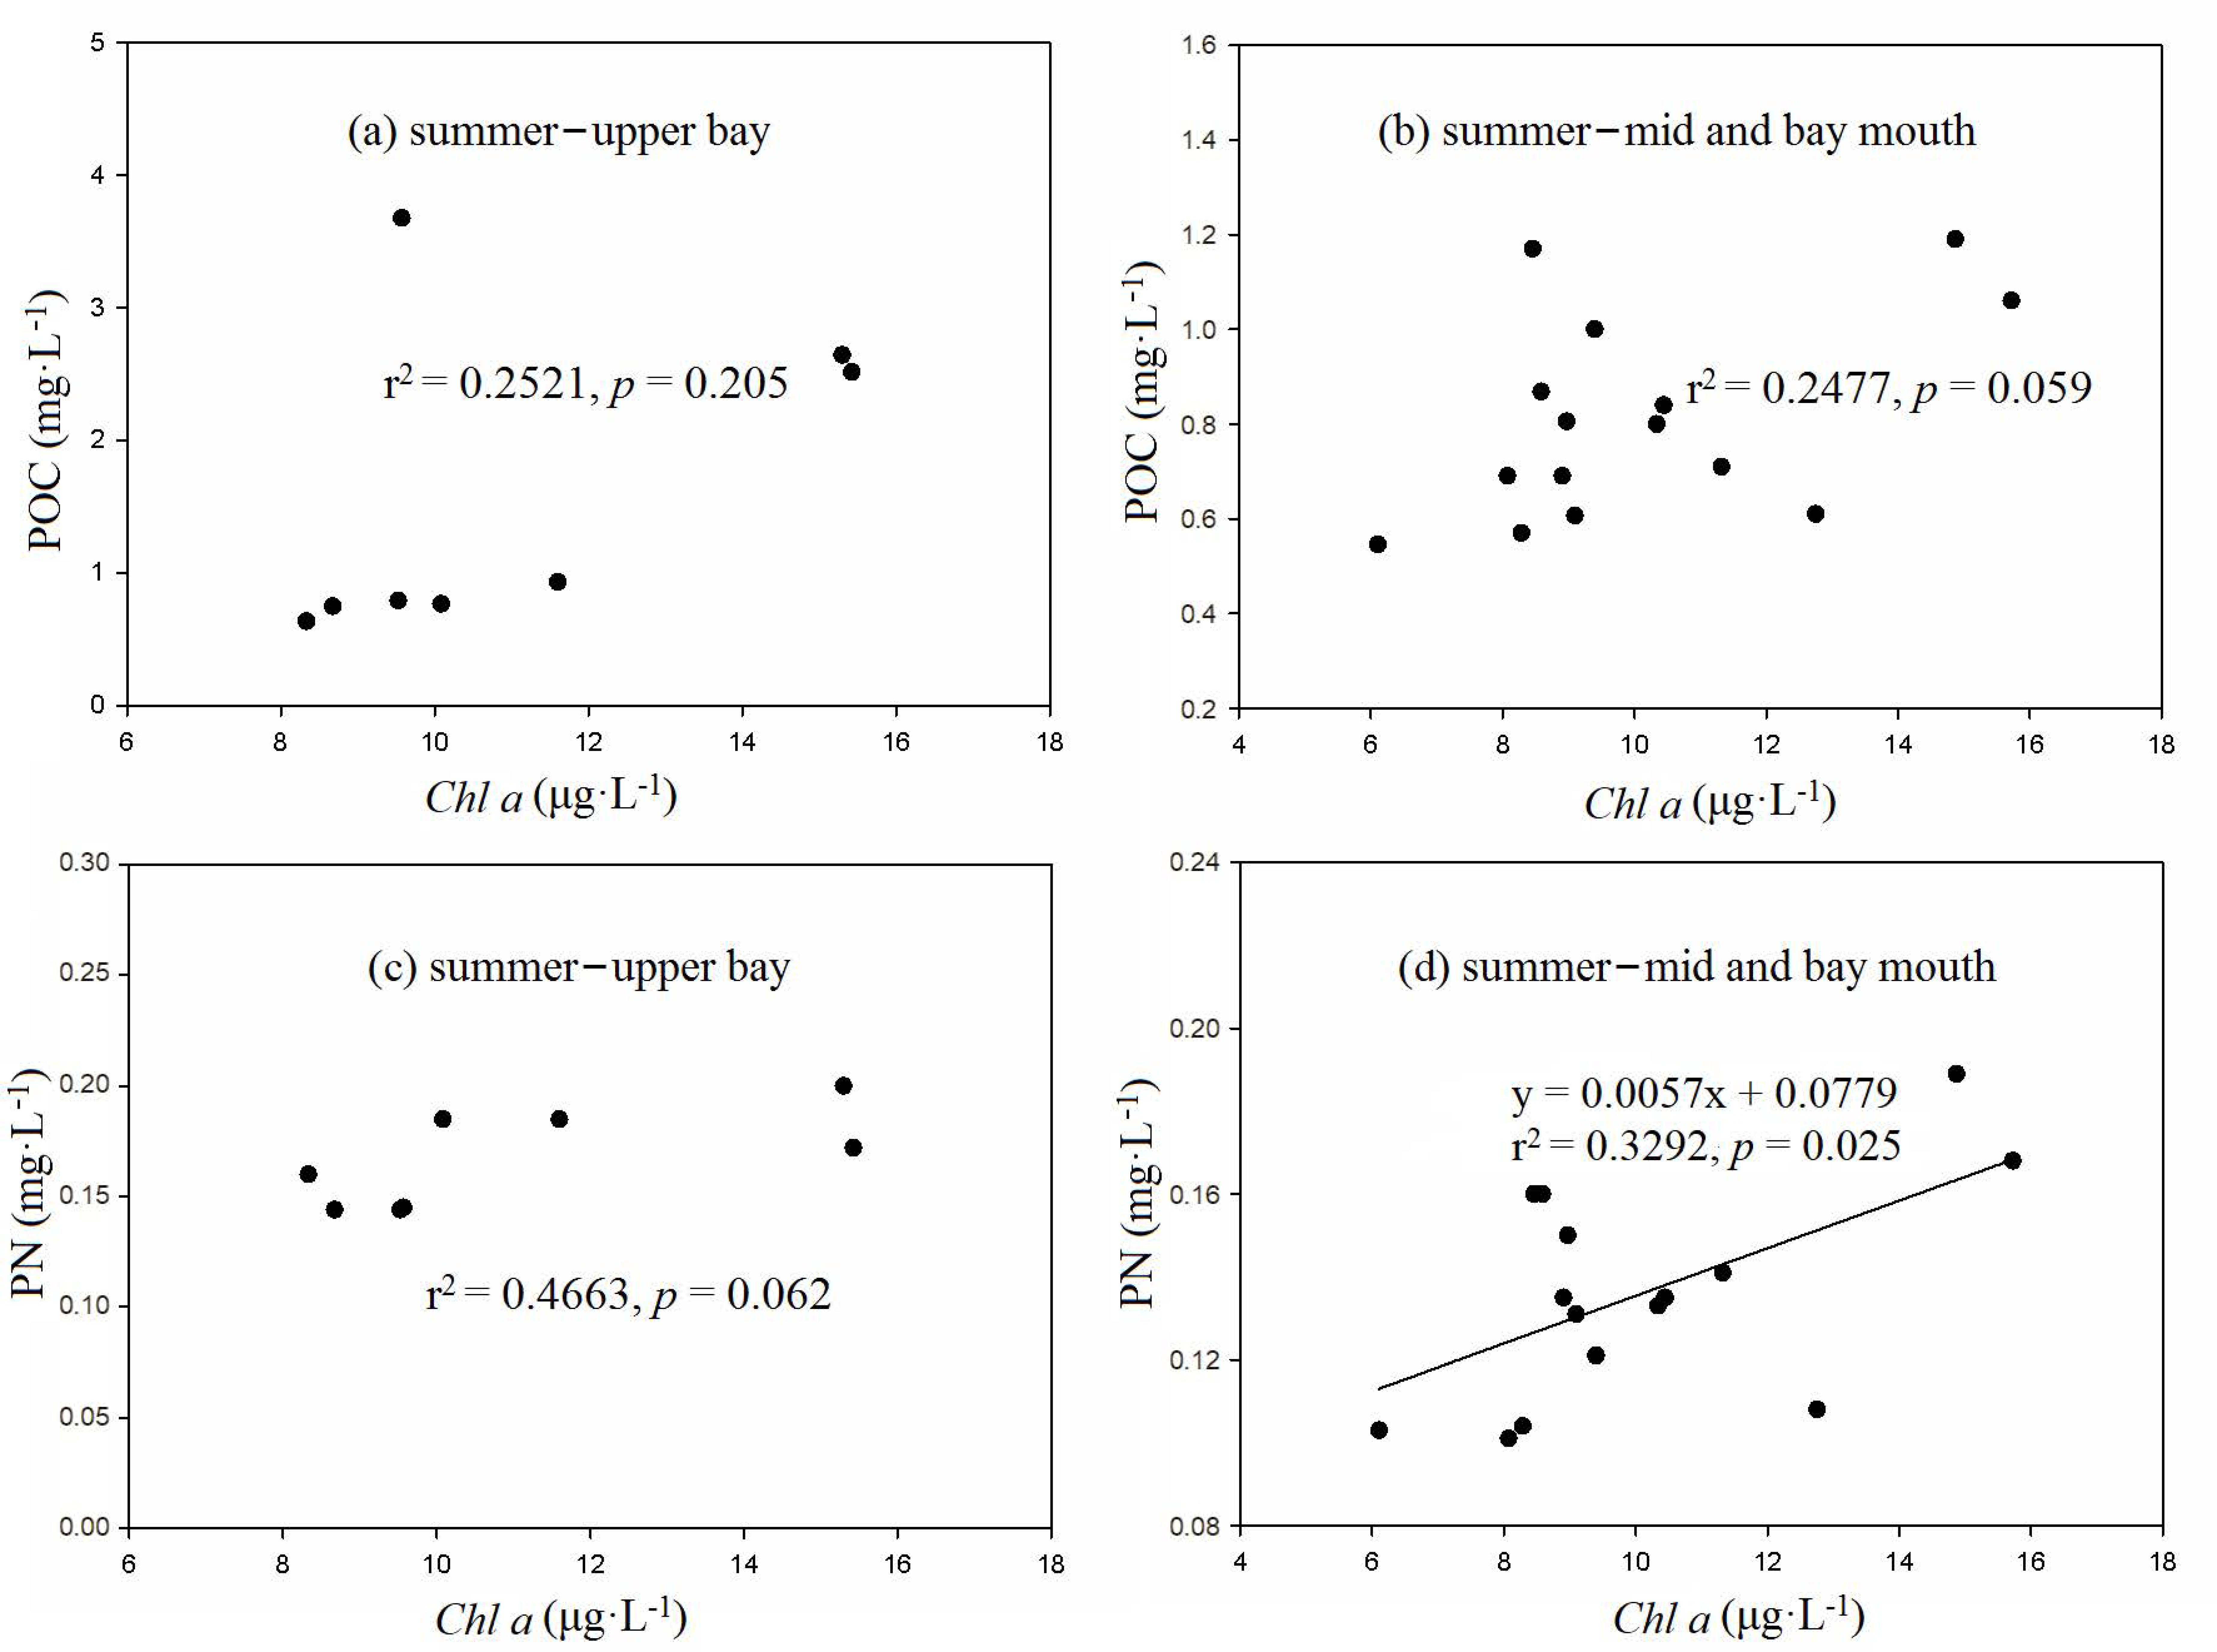
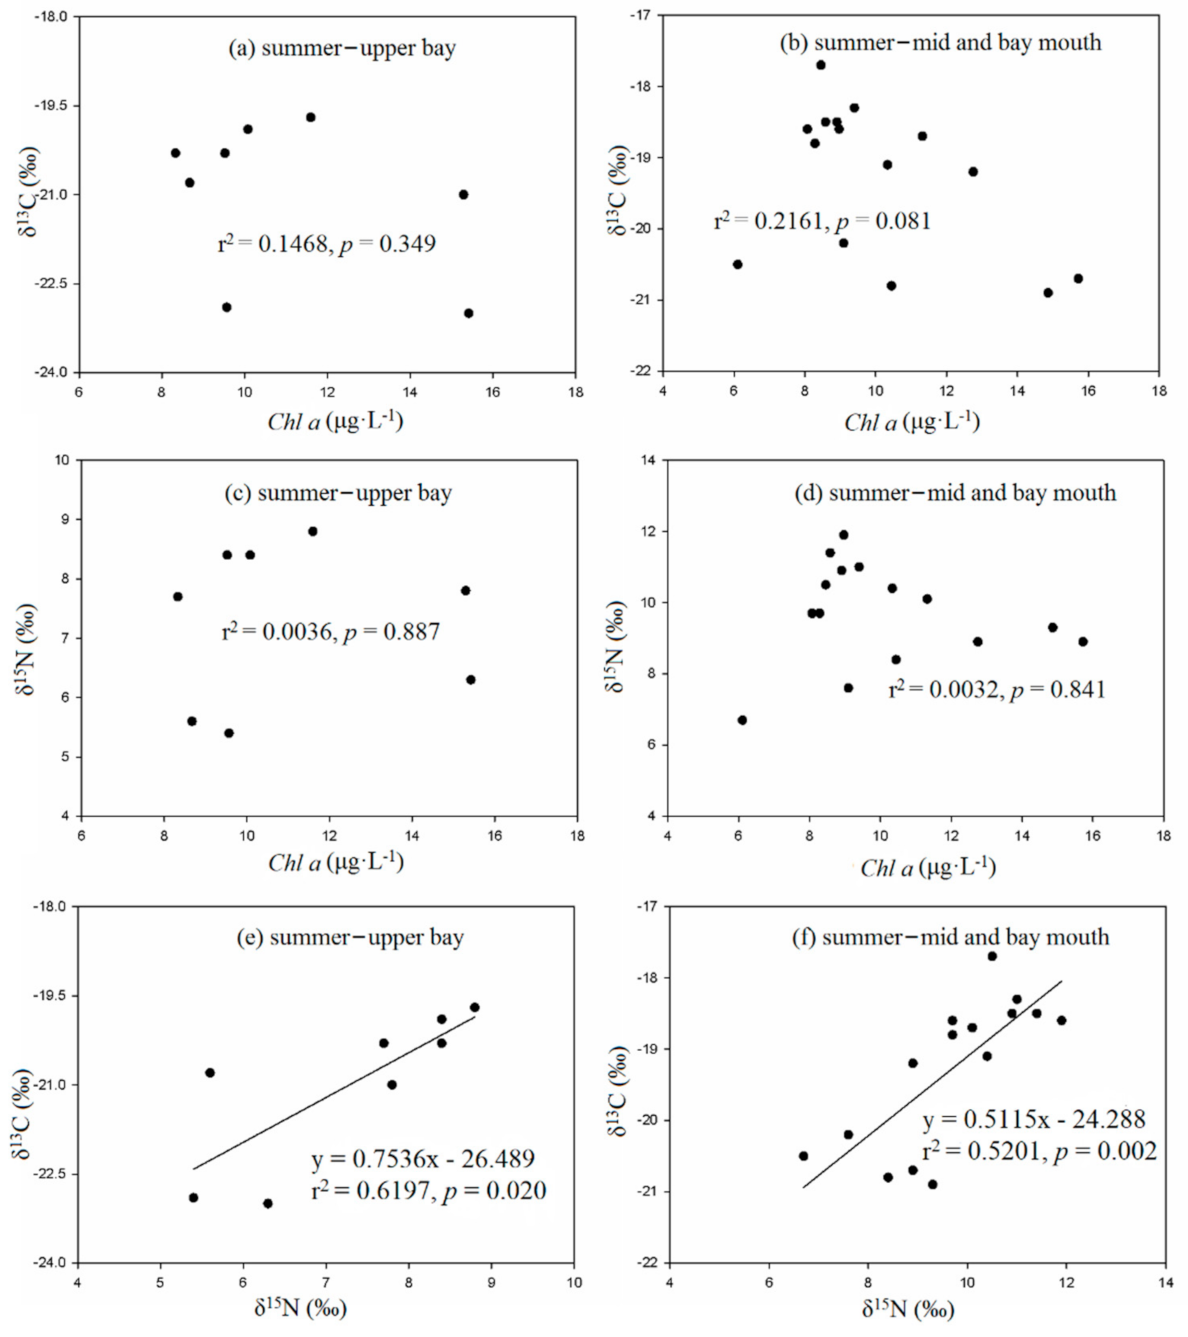
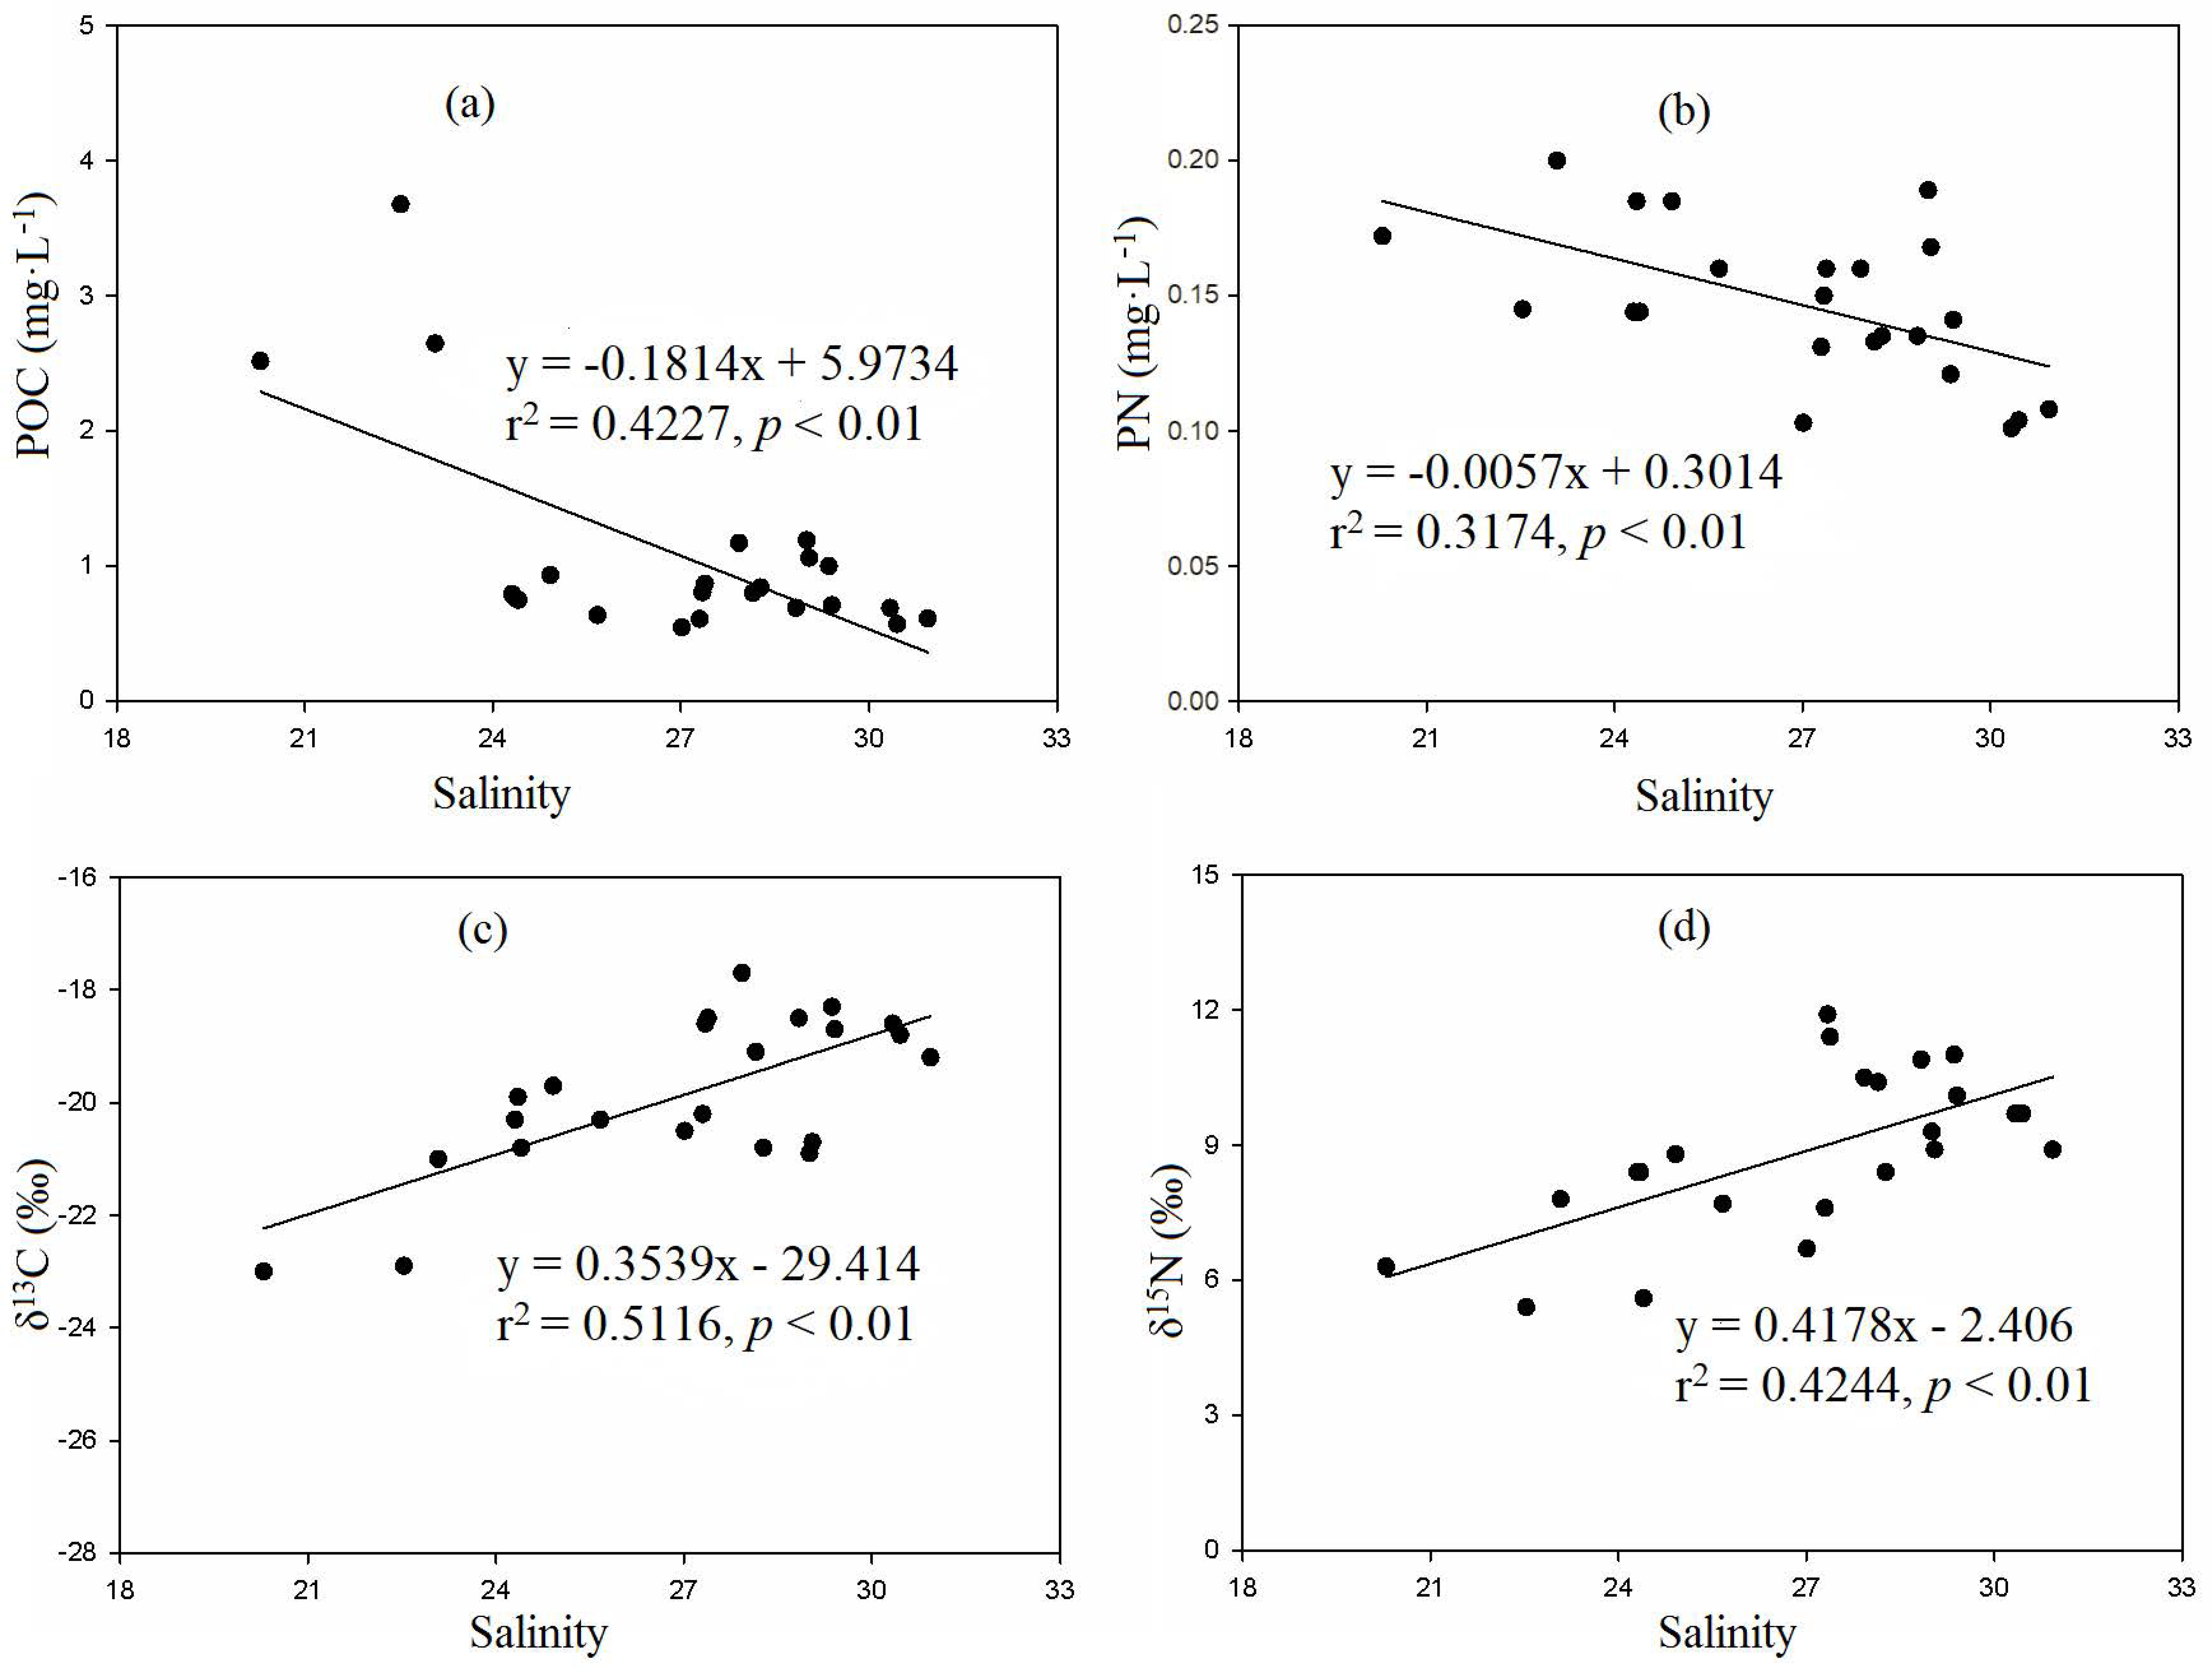
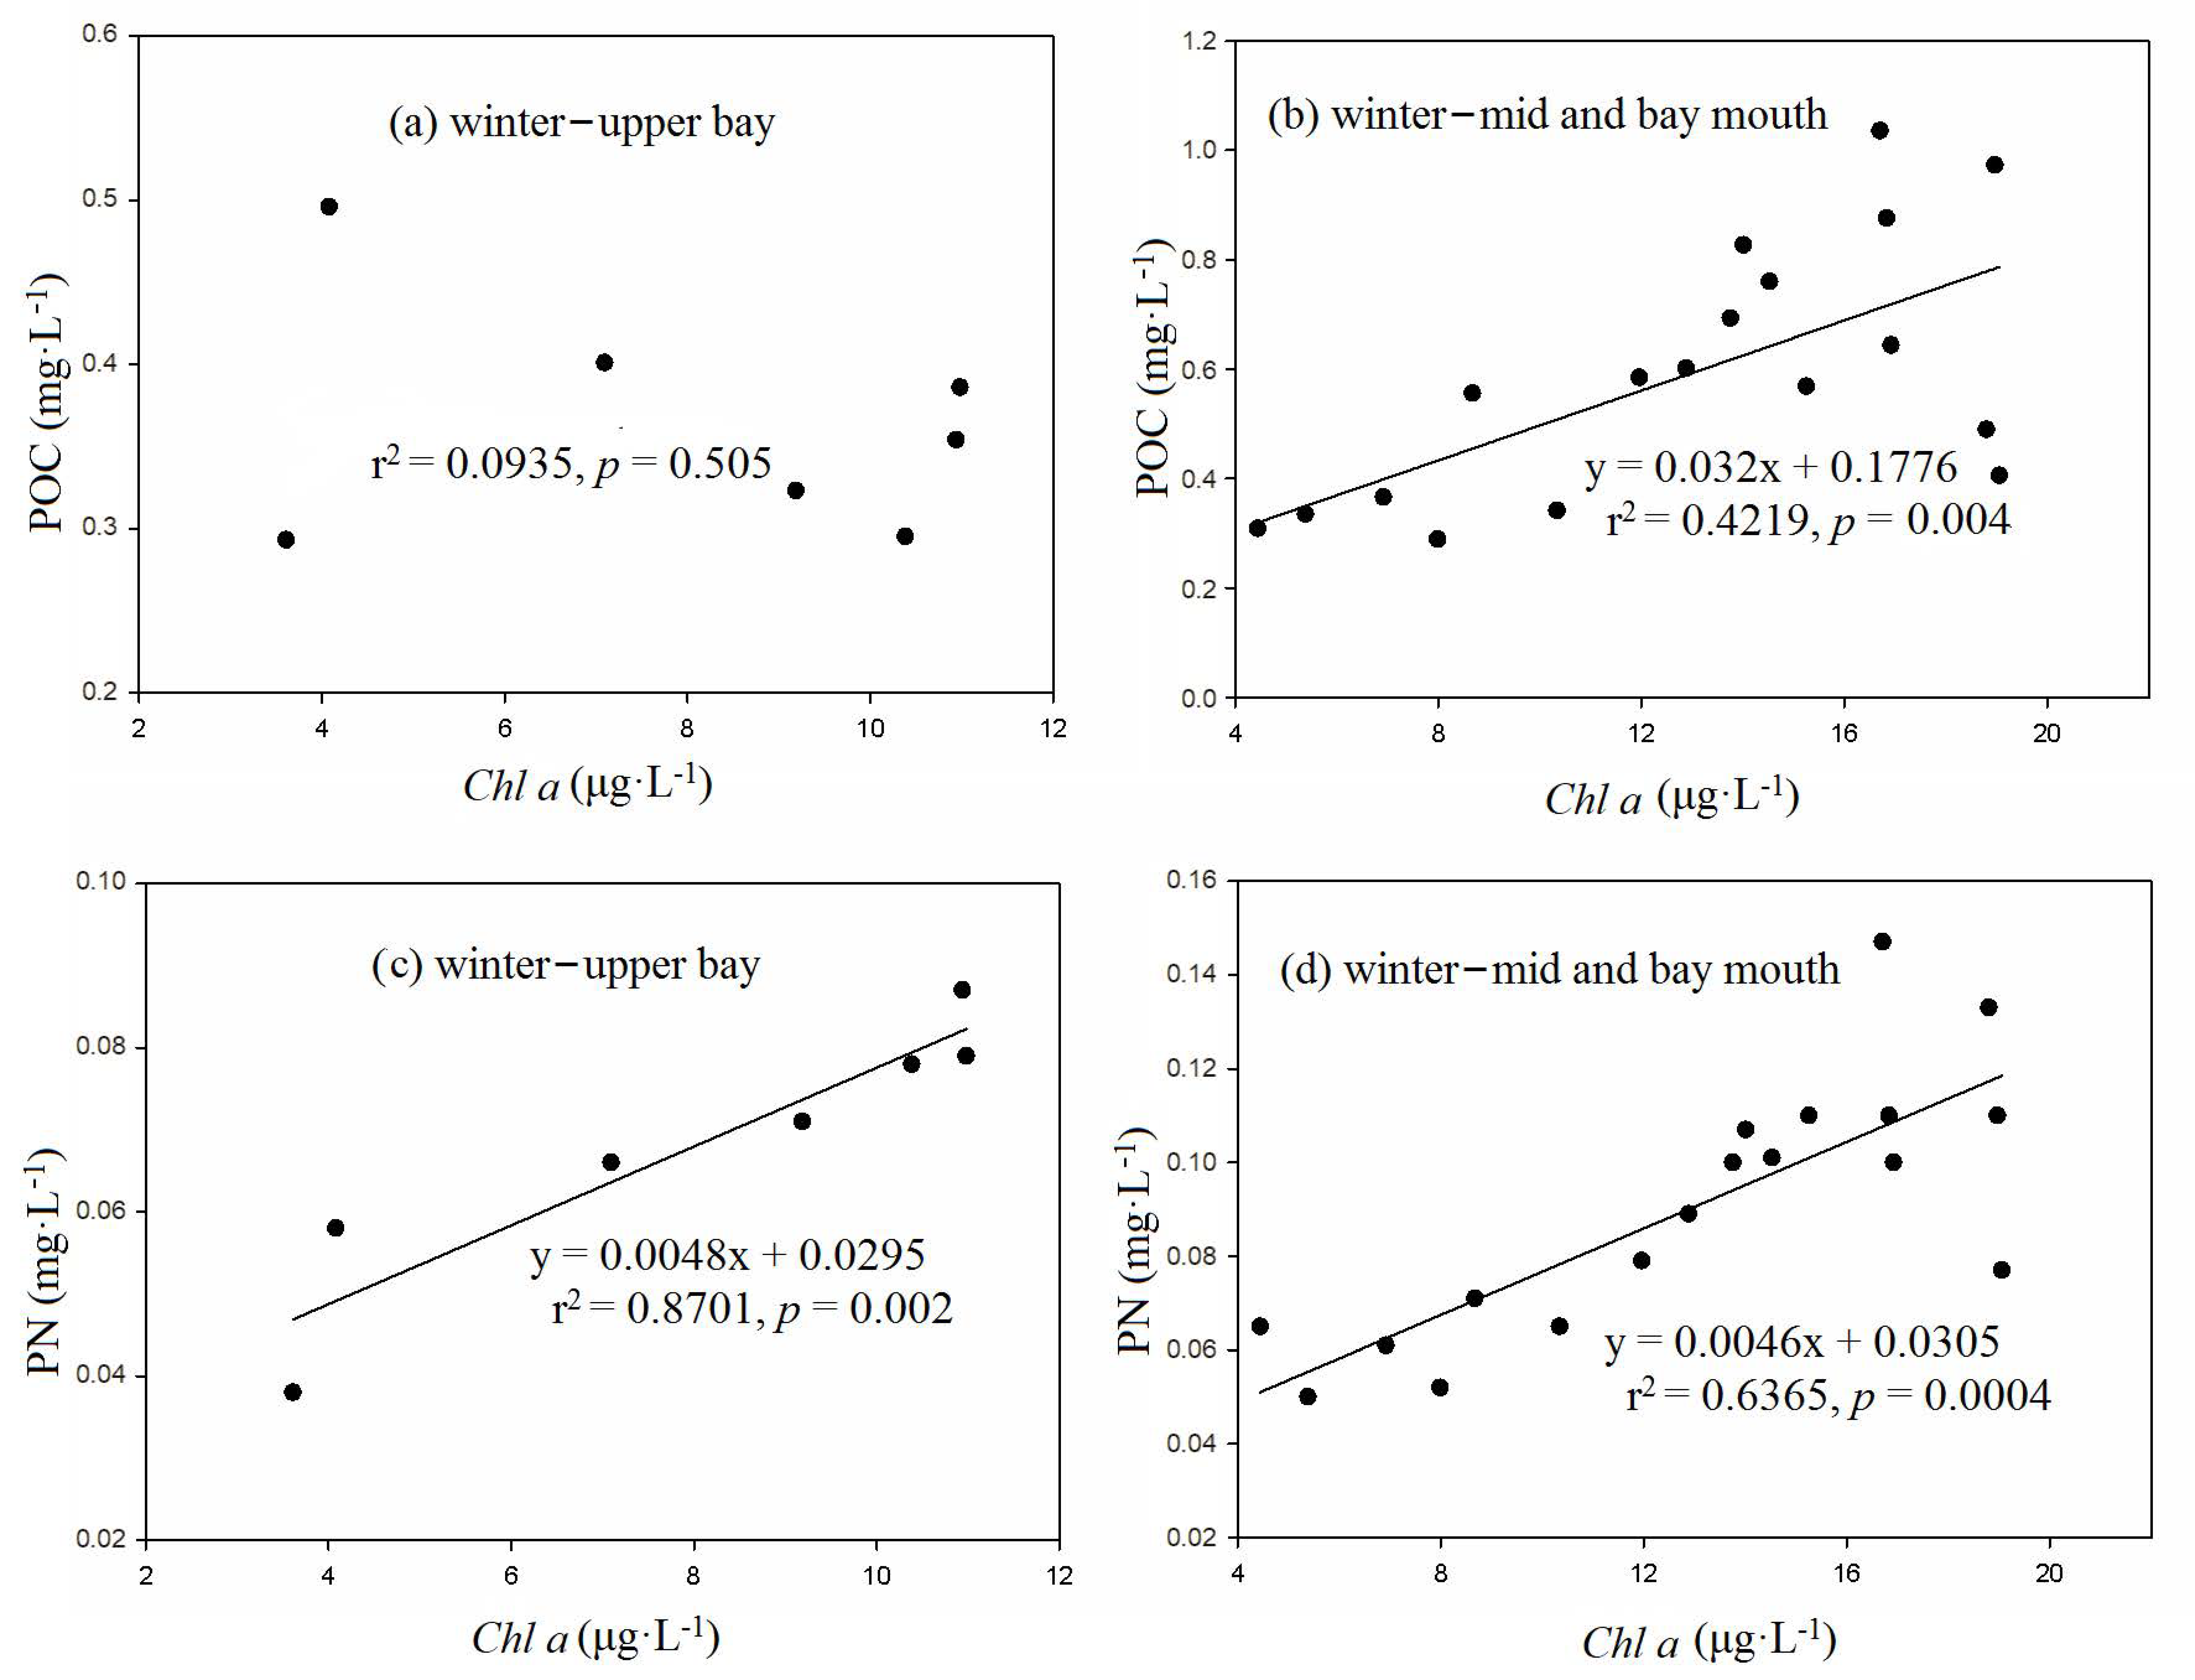
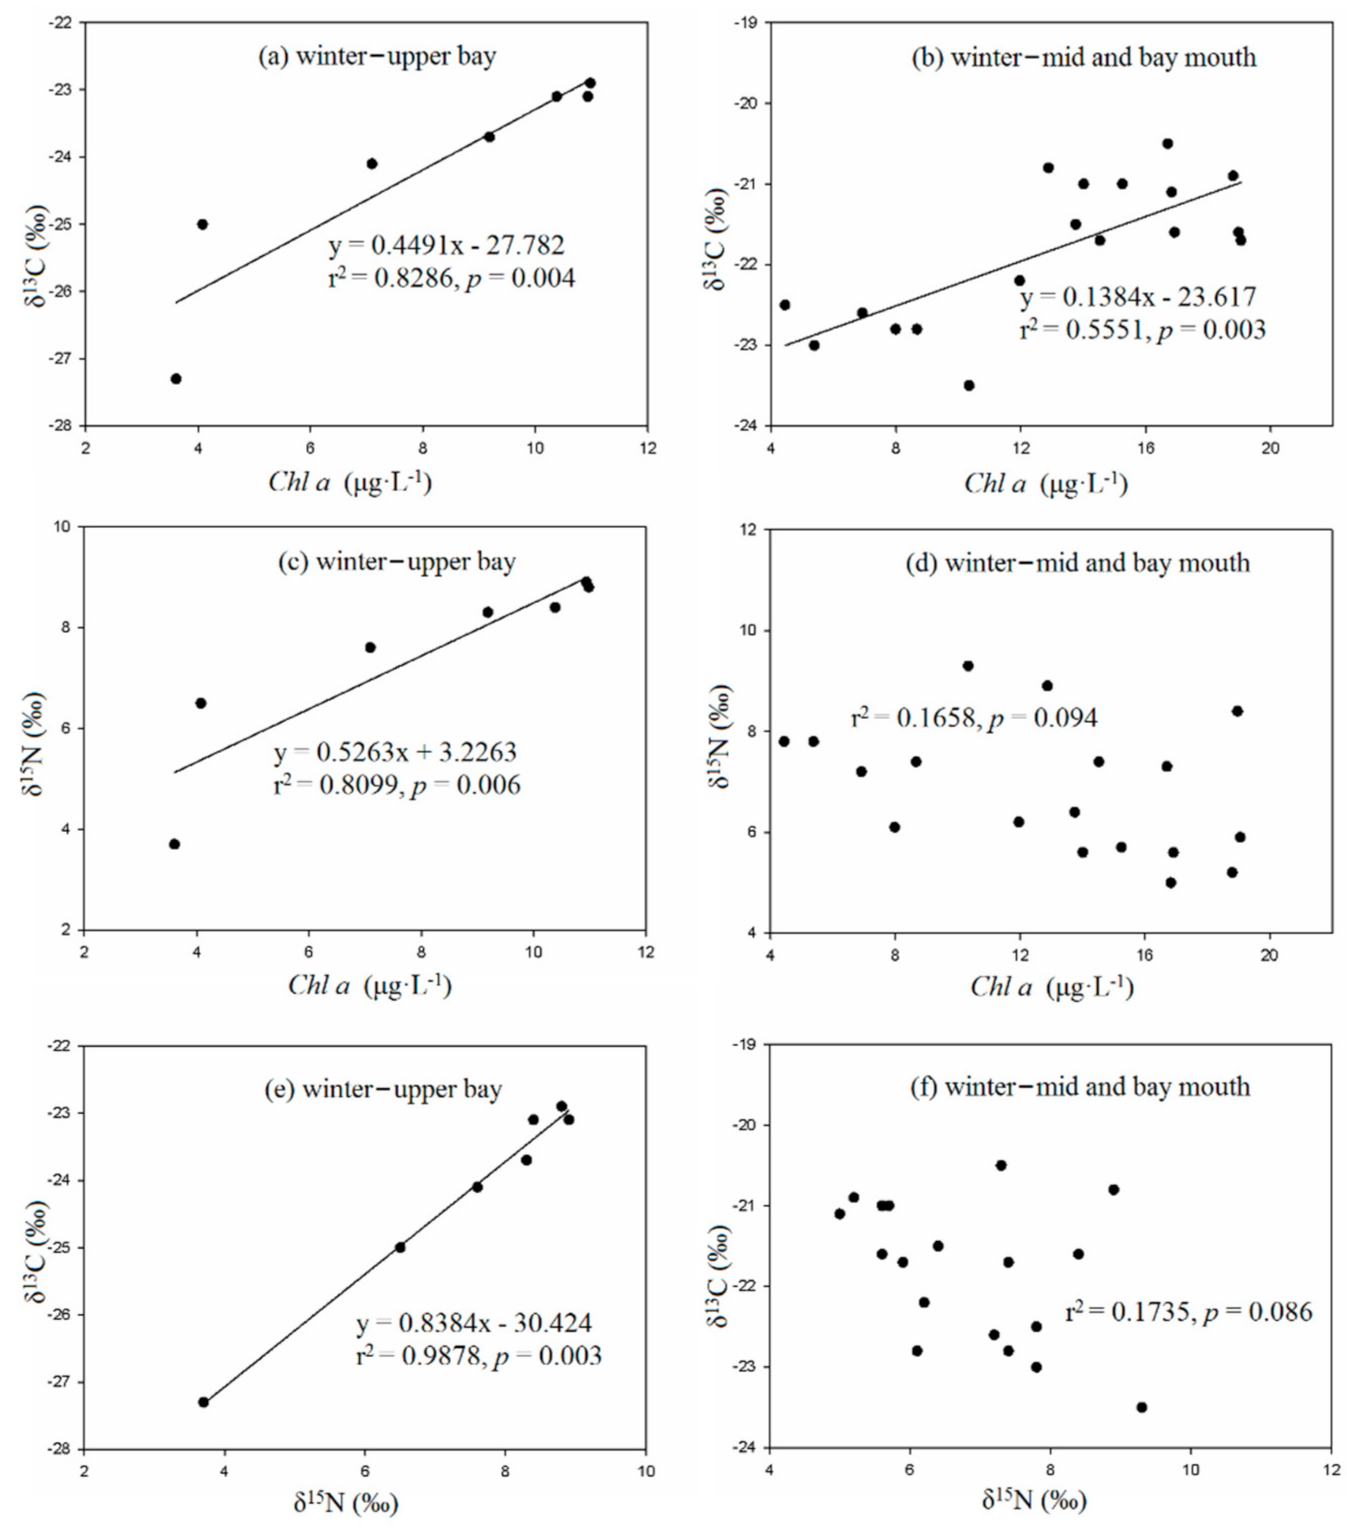
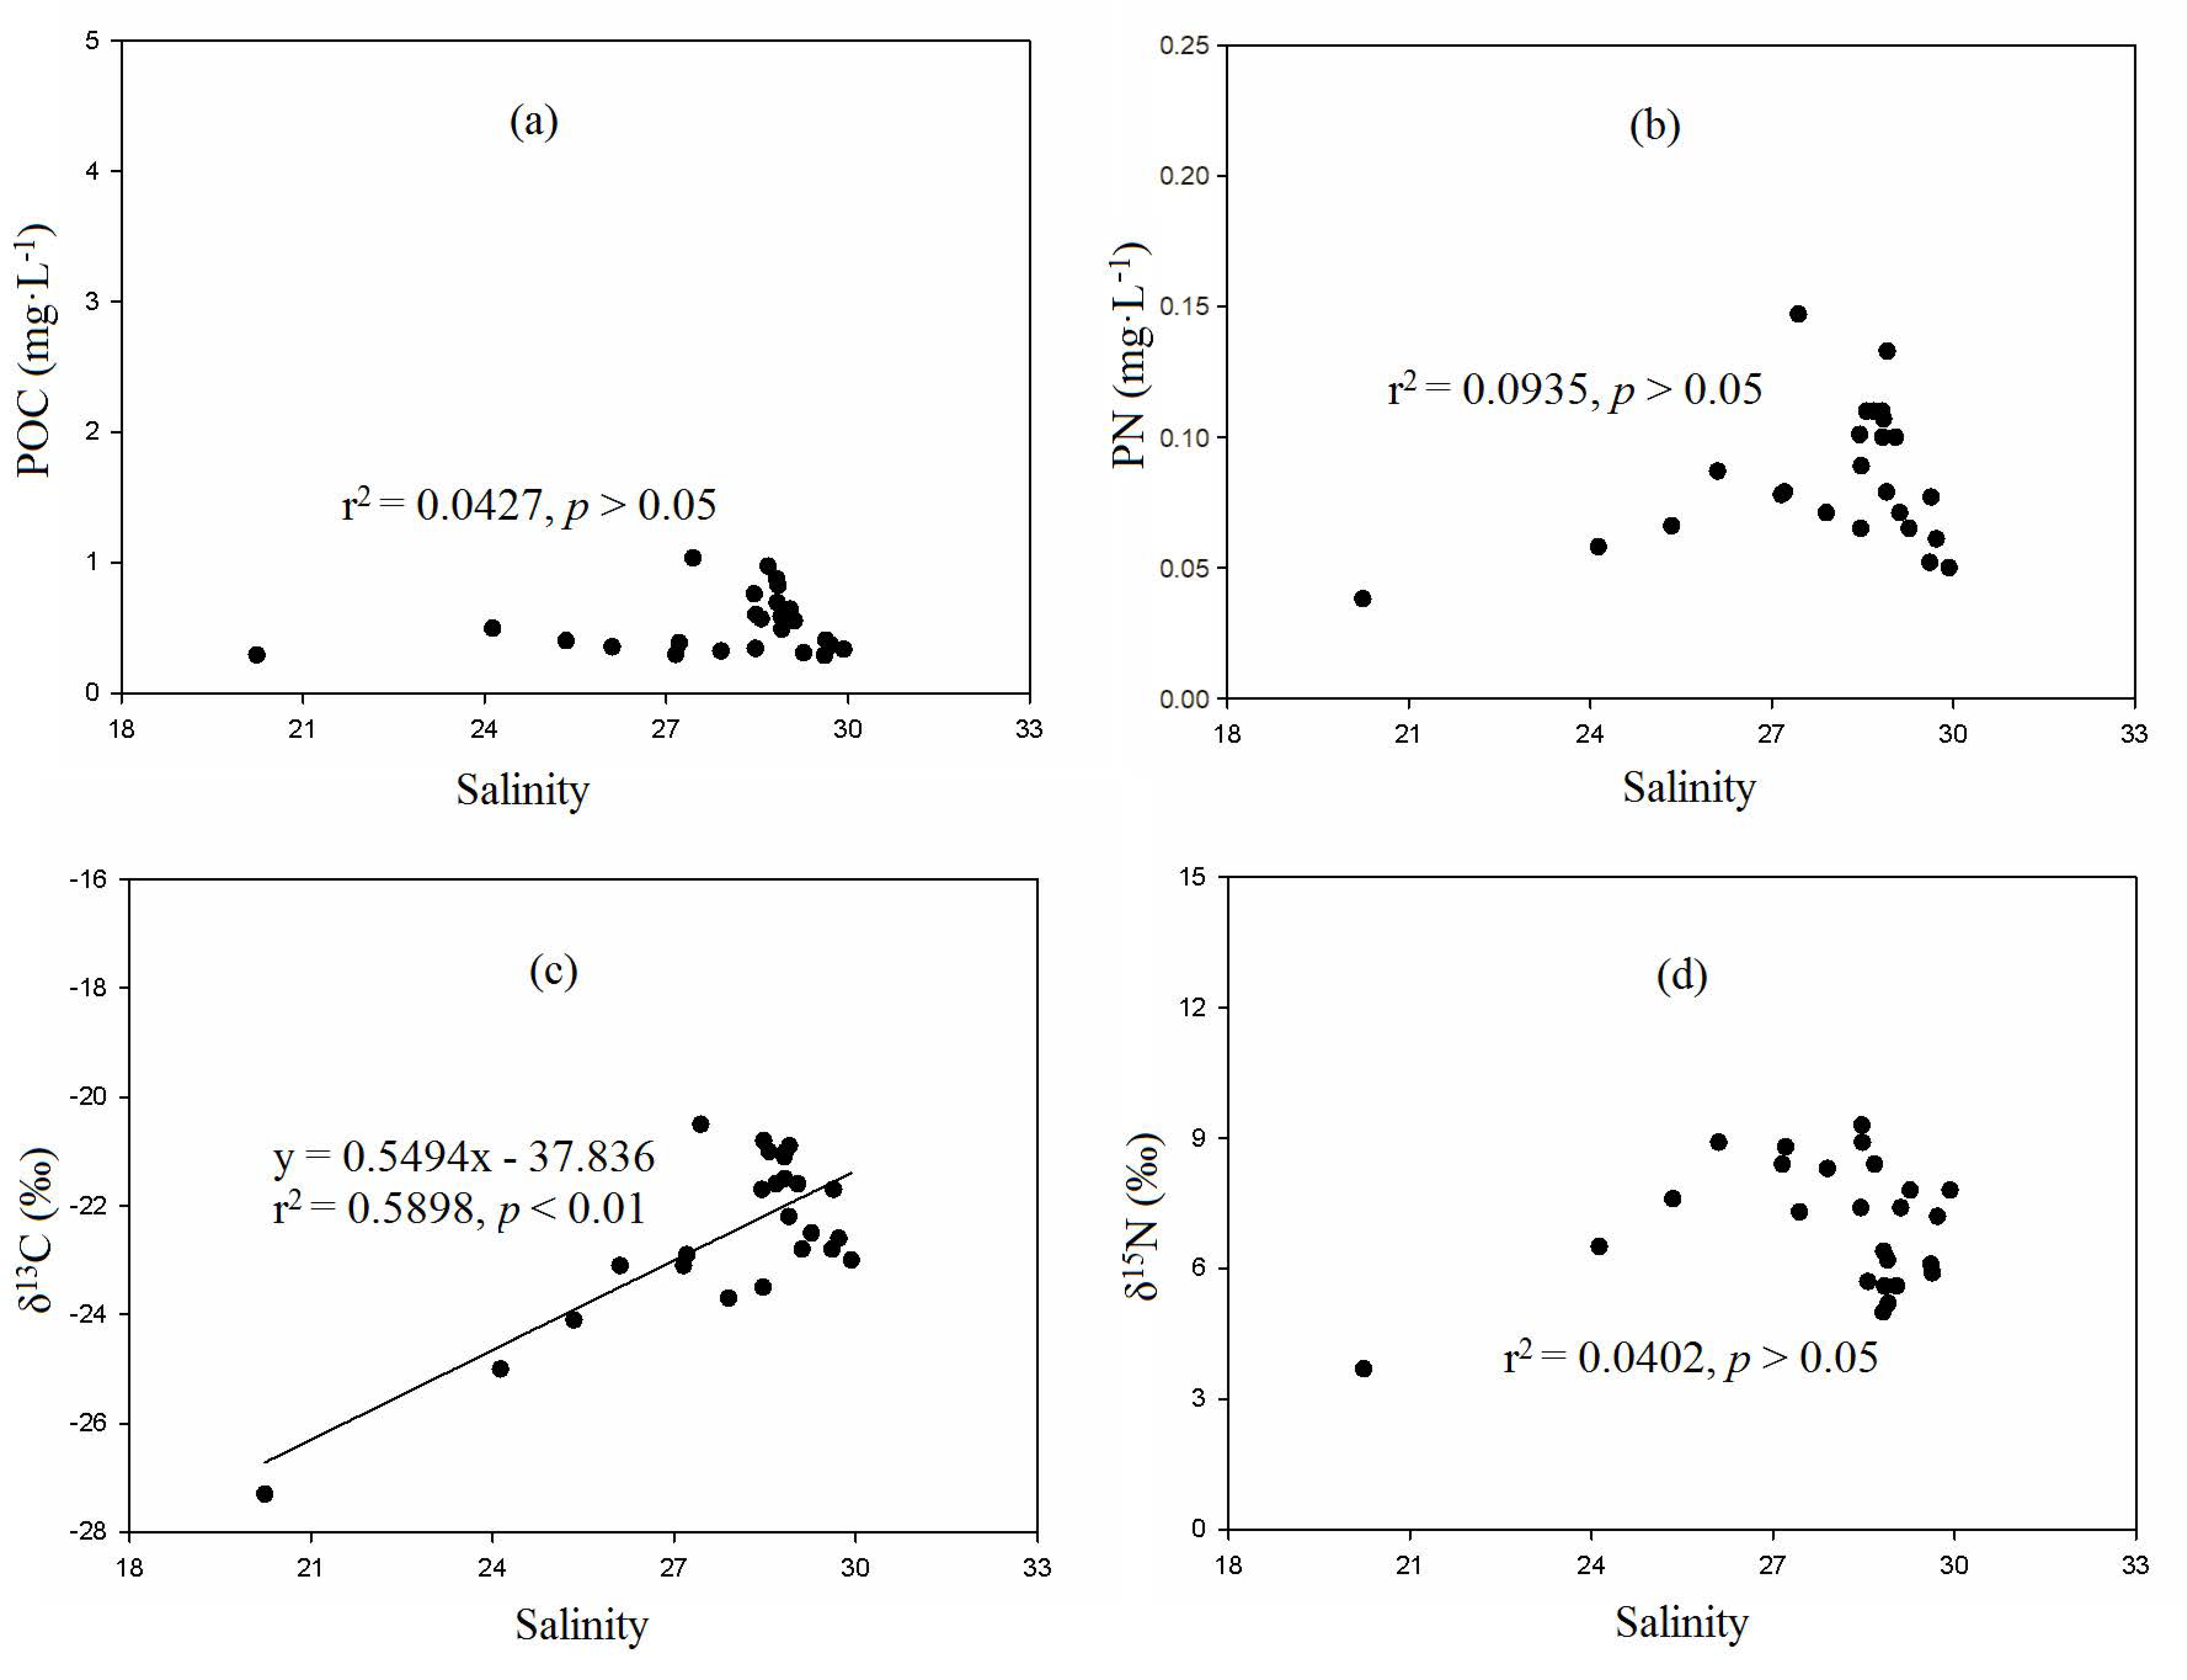
3.5. Correlation Analysis

In summer, in upper bay, the δ13C were related significant positive with the δ15N, POC and nutrients. The salinity was significantly correlated with nutrients, Chl a, POC, and δ13C (Table 1). In the middle bay and bay mouth, the δ13C was related significant positive with the δ15N (Table 2).
In winter, in upper bay, the δ15N and δ13C values were related significantly with related environmental parameters, and POC had weak correlations with related environmental parameters (Table 3). In the middle bay and bay mouth, the δ15N and δ13C values were related significantly with related environmental parameters, and the Chl a was related significantly with POC, PN, and δ13C (Table 4).

4. Discussion

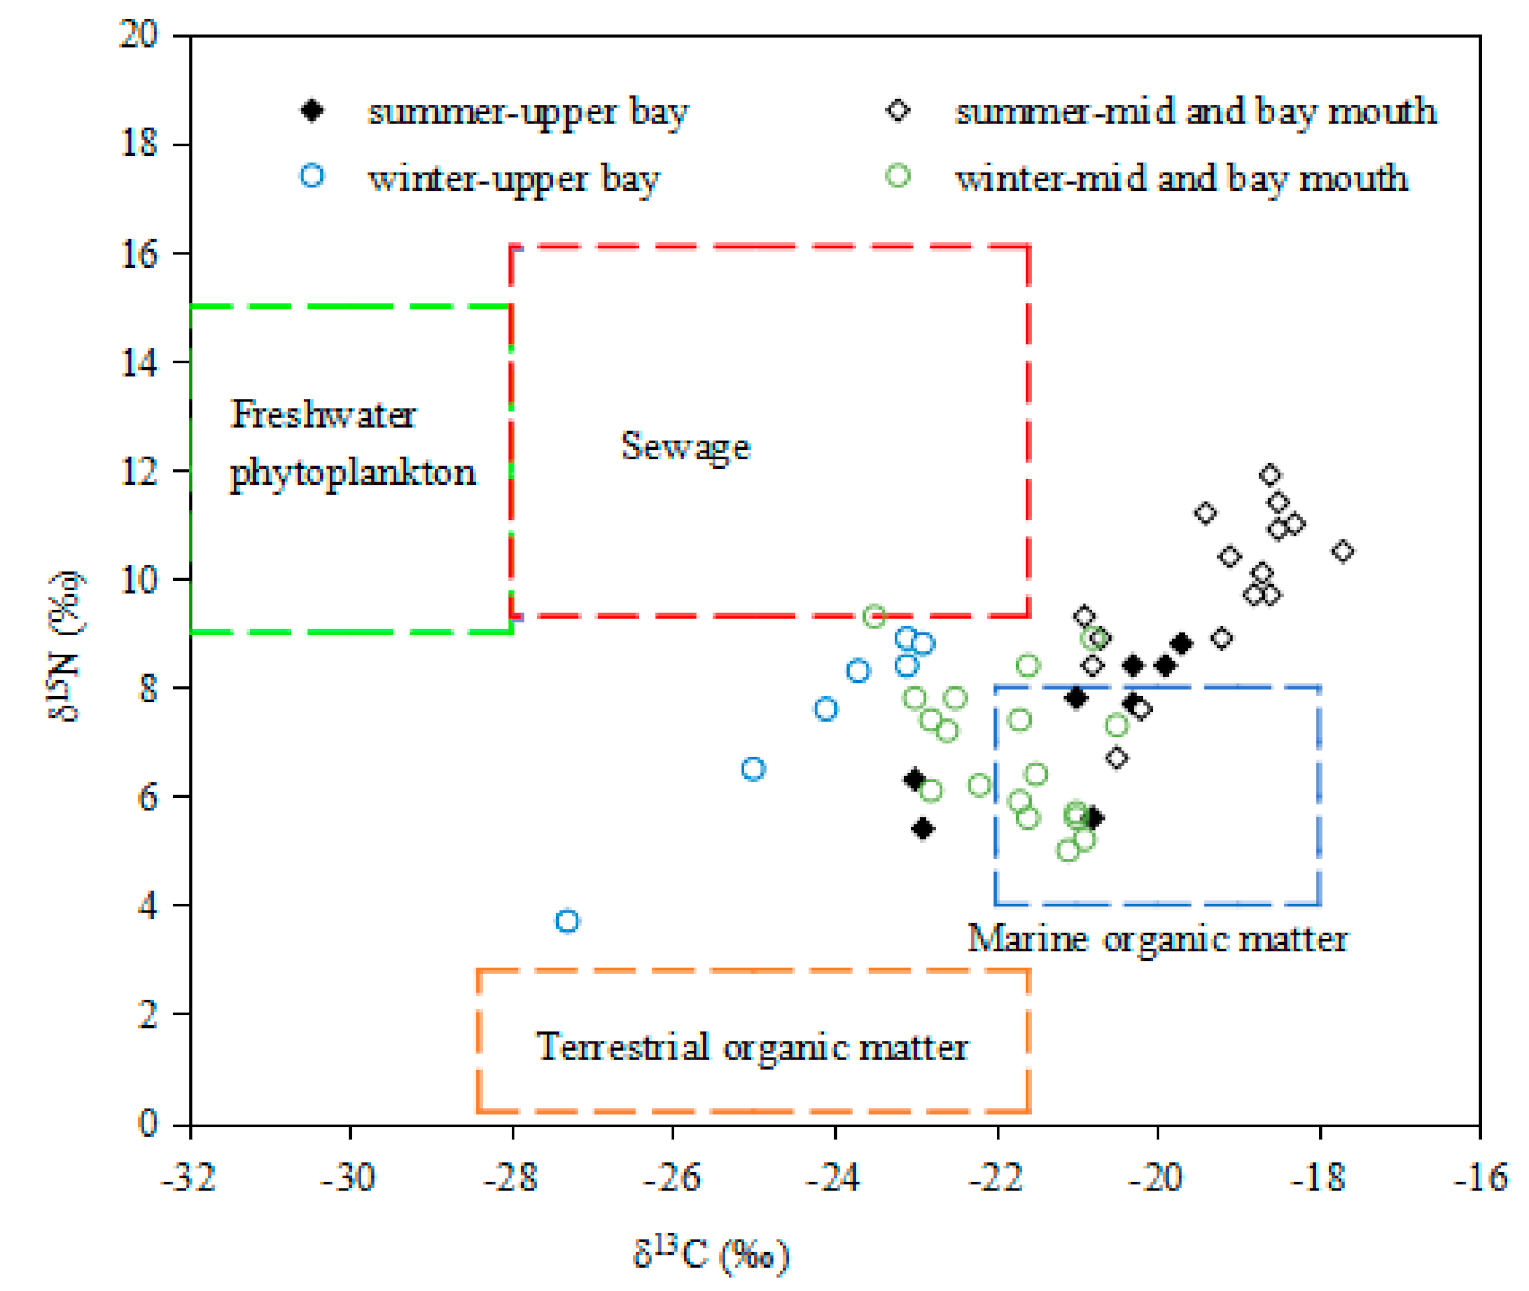
4.1. Sources of POM in the Surface Water of Zhanjiang Bay in Summer

The POM in the offshore water is composed of a mixture of terrestrial and marine organic materials [3]. The POC/Chl a ratio can be used as a potential tool for tracing the sources of the organic matter. The POC/Chl a ratios of in situ phytoplankton vary from 40 to 200; whereas those of terrestrial sources and heterotrophic biomass tend to be greater than 200 [5,6,31]. In this study, during the summer, the ratios ranged from 37 to 384 (average of 100) with lower ratios (37 to 138, average of 80) in the middle bay and bay mouth and higher values in the upper bay (76 to 384, average of 140), suggesting that precipitation runoff brought more terrigenous POM in summer, especially at stations Z1–Z3. This was further evidenced by the weak correlations between Chl a and POC and PN in summer (Figure 6), which suggest that the higher POC and PN contents may be due to the increased terrigenous input in summer.
In addition, the C/N ratio has been widely used to identify the sources of organic matter in aquatic ecosystems [13,33,34,35]. Herein, the C/N ratios usually decreased from the upper bay to the bay mouth, suggesting a decreasing contribution of terrigenous sources. The high values and positive correlations between POC and SPM, concurrently with relatively high δ13C values, indicated that POM may be the result of the erosion of soil organic matter. Previous studies have also concluded that soil erosion is an important mechanism for POC import into river systems [5,6]. Similar phenomena were discovered in the northern Gulf of Mexico, the Congo, and the Western Indian continental shelf [20,36,37]. Because the C/N ratios of soil organic matter are similar to those of marine phytoplankton, the C/N ratio alone cannot be used to differentiate between marine resources produced in situ and terrestrial sources.
Compared with other regions, the mean C/N ratios of the POM in summer (7.2) in Zhanjiang Bay were lower than those observed in the major rivers of the world (8.1–12.9; [38]), suggesting that diagenetic processes had modified the C/N ratios extensively. Moreover, since the C/N ratios indicate the organic matter source, it is expected that they should have a significant negative correlation with δ13C, that is, high ratios of C/N correspond to light δ13C values [39]. However, there is no significant relationship between the C/N ratios and δ13C values in the upper bay, middle bay, or bay mouth in summer (Figure 6). These results suggest that C/N ratios are not a robust indicator of organic matter. In previous studies, it was found that C/N ratios cannot be directly used to distinguish between organic matter sources in the Pearl River Estuary [4,5,40], the coastal part of the Bohai Bay [10], along the Zhejiang coast [41], and elsewhere in the world [13,31,42]. This may be due to the breakdown processes (e.g., microbial mineralization, leaching, autolysis) of the POM [15,39] and/or anthropogenic disturbances [43]. The C/N ratios of the litter of higher plants tend to decrease as a result of the assimilation of dissolved inorganic nitrogen via bacterial and nitrogen retention, whereas the C/N ratios of algal detritus tend to increase after diagenesis [44,45]. These modifications prevent the use of C/N ratios to differentiate between organic matter sources.
Nevertheless, the δ13C and δ15N values can provide better information regarding POM sources [21,39,46]. The characteristics of the δ13C and δ15N values in Zhanjiang Bay indicate variable sources of organic matter (Figure 6a,c). The δ13C values generally increased seaward in the upper bay (−23.0‰ to −19.7‰, average of −21.0‰) and exhibited an increasing trend (−20.9‰ to −17.7‰, average of −19.3‰) in the middle bay and bay mouth in summer. Similarly, the δ15N values increased seaward, with lower values in the upper bay and higher values in the middle bay. The significant positive correlation between δ13C and δ15N and their similar spatial distributions indicate that the biogeochemical processes causing the fractionation of these isotopes to the water column were the same (Figure 7). Thus, the higher values of δ13C may be caused by CO2 limitation due to the high elementary productivity of phytoplankton and eutrophication [47]. During C absorption, phytoplankton preferentially take up 12C, making the dissolved inorganic carbon (DIC) pond rich in 13C. The limitation of the CO2 supply and the absorption of bicarbonate instead of CO2 both result in a decrease in the steady carbon isotope composition, which further enriches the 13C content of the phytoplankton [48,49]. However, the low Chl a values observed in the middle bay and bay mouth indicated that marine phytoplankton was not the main source of POM. The relatively high values of Chl a observed in the upper bay can be caused by riverine nutrient inputs, promoting phytoplankton growth [25]. Moreover, the OM with predominantly soil origins in summer may have experienced a change that persisted during and before the water transfer. These high δ13C values in summer may be due to the mixing of soil OM with higher δ13C from neighboring outlets. Due to the sudden increase in rainfall and runoff, a large amount of POM accumulated from basin soil during the previous summer was washed away [50,51,52]. Moreover, Zhanjiang Bay is strongly influenced by the monsoons, resulting in large amounts of water being discharged and causing suspended particulates to be transported to the oceans during the rainy season (April to September). Since Zhanjiang Bay is a semi-enclosed bay connected to the South China Sea, the impact of terrestrial matter on the POM should decrease from the upper bay to the bay mouth. This is consistent with the variations in salinity, SPM, POC, and PN in summer. The positive correlations between salinity and POC or PN, and the negative correlations between salinity and δ13C or δ15N during summer (Figure 8) can also support this interpretation. In the upper bay, low salinity and δ13C, but high POC, PN, and Chl a, indicates the accumulation of high phytoplankton biomass in this area. In contrast, the δ15N and δ13C values have weak correlations with related environmental parameters (Table 2), and the relatively high δ13C values in the middle bay suggest a continuous accumulation of soil organic matter transported by the river. More importantly, the increasing population and rapid economic development in Zhanjiang have resulted in an abundance of sewage and feces entering Zhanjiang Bay [25]. Thus, it was concluded that the POM mainly originated from terrigenous inputs. However, the δ15N values exhibit a complex spatial distribution relative to the corresponding δ13C values (Figure 6), and the higher POM δ15N values were observed in the middle bay in summer. This may be due to the degradation of particulate matter, the preferential loss of lighter 14N, and the retention of heavier 15N [53]. We speculate that the speed of the local economic development and the increase in human activities in Zhanjiang has intensified the heterotrophic bacterial processes [54,55], thereby further modifying the particulate organic nitrogen composition in summer. Therefore, in spite of phytoplankton as the main source in the upper bay, terrigenous sources were dominant in Zhanjiang bay in summer.

4.2. Sources of POM in the Surface Water of Zhanjiang Bay in Winter

In this study, the POC/Chl a ratios ranged from 21 to 122 (average of 50) in Zhanjiang Bay, with higher values in the upper bay (32 to 122, average of 56) in winter and lower ratios (21 to 70, average of 48) in the middle bay and bay mouth, indicating that marine organic materials played an important role in the POM in winter. This phenomenon indicates that the in situ phytoplankton contributions were relatively important in winter. In the upper bay, the POC was uncorrelated with the Chl a concentrations in winter (Figure 9a), indicating that one source of organic matter may be terrigenous material input. This is supported by the changes in the salinity in the upper bay in winter (Figure 2d). However, the POC and PN values were correlated with the Chl a concentrations in the middle bay and bay mouth in winter (Figure 9b,d), suggesting that the POM distribution in the surface water was mainly dominated by the phytoplankton biomass rather than by terrigenous material input. The C/N ratios provide further evidence that the phytoplankton biomass contributed more to the POM (Figure 4). In winter, the C/N ratios ranged from 3.7 to 8.9 (average of 6.3), with lower ratios in the upper bay (average of 5.7) and higher ratios in the middle bay and bay mouth (average of 6.5). The C/N ratios in Zhanjiang Bay were similar to the C/N ratios of phytoplankton, but they are much lower than those of terrestrial organic matter, indicating that the main source of organic matter may be phytoplankton production rather than terrigenous input.
The δ13C values generally increased seaward in the upper bay (−27.3‰ to −22.9‰, average of −24.2‰) and decreased from the middle bay to bay mouth (−23.5‰ to −20.5‰, average of −20.8‰) in winter. The δ15N values ranged from 3.70‰ to 9.30‰ (average of 7.02‰) in winter. In the upper bay, a strong positive correlation was found between the δ13C and Chl a concentrations (Figure 10a,b), indicating that there was a greater contribution from the phytoplankton biomass. Similarly, the δ13C values were related to the concentrations of Chl a in the middle bay and bay mouth in winter (Figure 10). These results suggest that the distribution of the δ13C values of the surface seawater of Zhanjiang Bay were primarily dominated by phytoplankton biomass. A significant positive correlation between δ15N and Chl a was found in the upper bay, while no relationship was found between the two in the middle bay and bay mouth (Figure 10; Table 3 and Table 4). This suggests that biological processes had a strong impact in the upper bay, while other factors were responsible for the δ15N variations in the middle bay and bay mouth. Moreover, since Zhanjiang Bay is greatly affected by monsoons, during the dry season (from October to March), due to the dryness and coldness of the winter monsoon, the subsurface nutrients are transported to the surface, thereby promoting plant growth. This is supported by the variations in the Chl a content in winter. This is in agreement with relationships between salinity and POC, PN, δ15N, and δ13C in the different areas of Zhanjiang Bay during the winter (Figure 11). Salinity has a low correlation with nutrients, POC, PN, and δ15N, showing that land-based input is not the main source of POM (Figure 11; Table 4). Thus, we can reasonably conclude that the contributions from in situ phytoplankton were relatively important. Furthermore, we found that the POM δ15N values were lower in the middle bay and bay mouth in winter. This also suggests that there was a lower input of 15N rich sewage from domestic, and the contributions from in situ phytoplankton were relatively important.

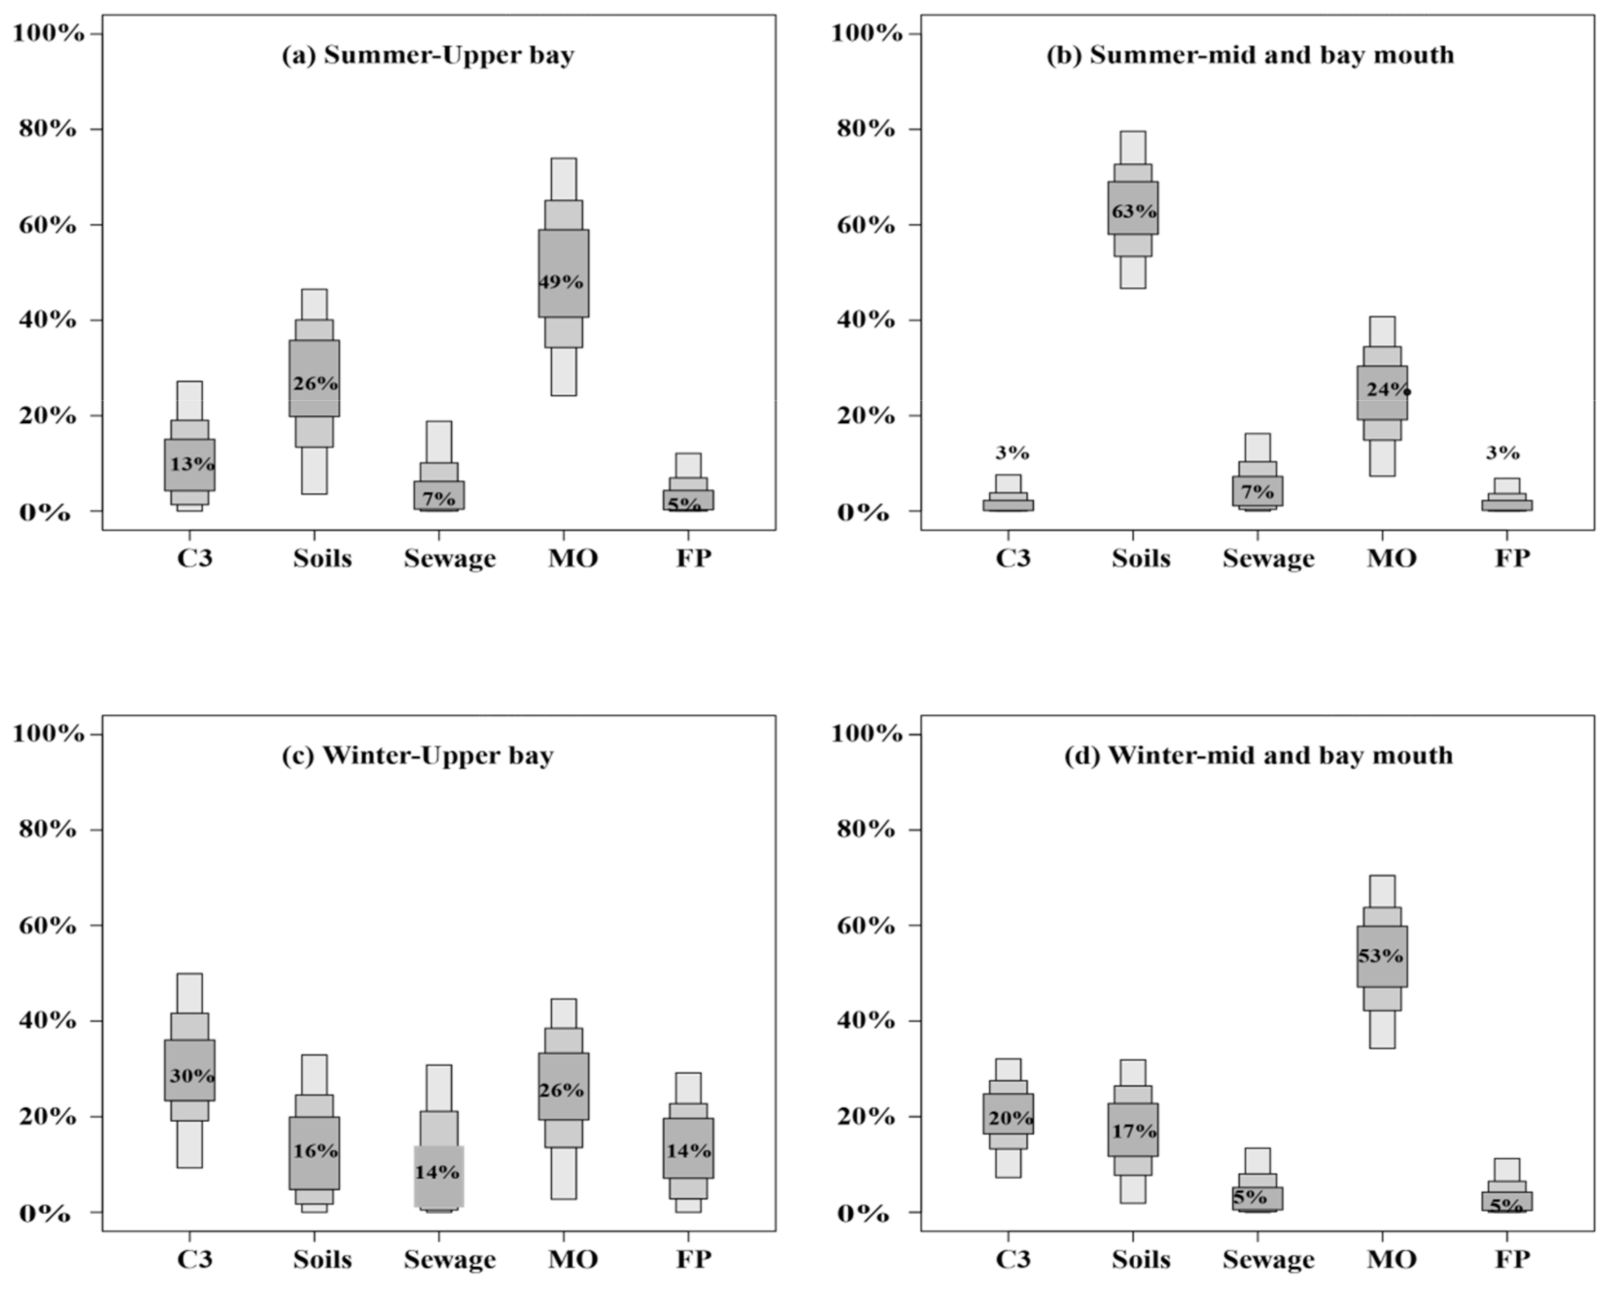
4.3. Quantification of the Sources of the Organic Matter in Zhanjiang Bay

The relative contributions of POM from distinct sources, including terrestrial organic matter, freshwater algae, and marine organic matter, were estimated using the SIAR model. Here, the terrestrial organic matter can include C3 and C4 plants, soil organic matter, and sewage. C4 plants are not common in the area surrounding Zhanjiang Bay since the main cultivated botany are C3 plants (such as rice) and the subtropical forest is mainly a natural ecosystem. Thus, the contribution of the C4 plants to the POM in Zhanjiang Bay can be ignored [26]. According to the isotopic ranges of potential sources, the ranges of the δ15N and δ13C values in summer and winter indicate that terrestrial organic matter and marine organic matter may be the main POM sources in the study area, respectively (Figure 12). In addition, the POM δ13C and δ15N values of each potential source area are summarized in Table 5. The contributions of potential sources were calculated using a Bayesian mixing model. The contributions of the soil organic matter, C3 plants, sewage, marine organic matter, and freshwater algae are presented in Figure 13. In the upper bay, the POM sources originated from C3 plants (13%), soil organic matter (26%), sewage (7%), marine organic matter (49%), and freshwater algae (5%) during the summer (Figure 13a), whereas, in winter, the POM in the upper bay originated from C3 plants (30%), freshwater algae (14%), marine organic matter (26%), sewage (14%), and soil organic matter (16%) (Figure 13c). In the middle bay and bay mouth, the main contributions of POM were from soil organic matter (63%), marine organic matter (24%), sewage (7%), freshwater algae (3%), and C3 plants (3%) in summer (Figure 13b), indicating the main source was upstream basin runoff. In winter, the dominant contributions of POM were from marine organic matter (53%), C3 plants (20%), soil organic matter (17%), freshwater algae (5%), and sewage (5%) (Figure 13d), indicating that the source was mainly dominated by phytoplankton biomass. The cause for the large credibility intervals obtained for each source component in the Bayesian analysis might be that the spatial difference of land use in Zhanjiang bay is obvious due to the different natural conditions and economic level [25,26,27,55]. However, we believe that this estimation can at least help us understand the source of nitrogen in Zhanjiang Bay to a certain extent. In the future, more systematic and in-depth work is needed to monitor spatial and temporal variations in the contributions of each source to clarify this issue.
The contributions of the marine organic matter, terrestrial organic matter, and freshwater algae to the POM in each season varied. The contributions in winter were obviously higher than those in summer, while the contribution rate of the soil organic matter in summer exceeded that in winter. During the dry season (winter), which was less affected by basin runoff and rainwater and by the influence of monsoons, the nutrients imported by the runoff and the bottom nutrients were more efficiently utilized by the phytoplankton to promote growth. Thus, the POM contribution from the marine organic matter was obviously higher in winter than in summer. Thus, the POM sources were predominantly affected by both local activities and the monsoon. Conversely, during the rainy season, the input of rainstorms and powerful rivers may have brought more terrestrial material from the basin, thus transforming the sources of the local POM. Therefore, the contribution of SPM should be very low during the dry season. In addition, the rainstorms and powerful river inputs increased suddenly, washing away a large quantity of the POM gathered in the drainage basin soils during the previous dry season [50,51,52]. Thus, the POM from the soil organic matter in summer was significantly higher than that in winter. These results indicate that basin runoff has a significant effect on the transfer of POM between the upstream basin and local sources in each season.

5. Conclusions

In this study, the seasonal and spatial distributions of the POC and PN in the surface waters of Zhanjiang Bay, which is a semi-enclosed bay with concentrated human activities situated in Southern China, were investigated. In summer, the seasonal and spatial distributions of the POC and the PN were similar, with both exhibiting seaward decreases and higher concentrations in the upper bay. Moreover, in winter, both the PN and POC contents exhibited the opposite pattern, with lower values at the bay mouth. The δ13C and δ15N values were more enriched in summer than in winter. In addition, they had a lower correlation with Chl a in summer, suggesting a lower contribution from in situ phytoplankton but significant terrigenous input. In the upper bay, the POC was not correlated with the Chl a in winter, indicating that one source of the organic matter may be terrigenous material. However, the POC and PN values were correlated with Chl a in the middle bay and bay mouth in winter, suggesting that the POM distribution in the surface seawater was mainly dominated by phytoplankton biomass rather than by terrigenous materials. Moreover, the δ13C values exhibited a significant correlation with Chl a during the winter, indicating that the contributions of the in situ phytoplankton were relatively important and were affected by the winter monsoon. The δ15N values exhibited complex spatial distributions relative to the δ13C values. Based on the SIAR model results, in the upper bay, the source of POM was mainly from marine organic matter (49%) in summer, and almost an equilibrated contribution of all sources in winter. In the middle bay and bay mouth, the POM contribution mainly originated from marine organic matter (53%) during the winter. In contrast, the POM source was mainly soil organic matter (63%) in summer, suggesting that the POM was sourced from the runoff from the upstream basin. This indicates that the POM source was mainly controlled by the phytoplankton biomass and was affected by the monsoon in winter, whereas in summer, it was mostly influenced by the upstream basin runoff.

Author Contributions

All authors contributed to the data assessment and analysis strategy. S.Z. and J.L. conceived and designed the study, and also wrote the manuscript. C.C., F.Z., J.W., G.J. and Q.Z. performed sample collection and contributed to the experiment and measurement. F.C. and C.H. collaborated in discussing the manuscript and modifying the manuscript. All authors have read and agreed to the published version of the manuscript.

Funding

This work was supported by the Scientific Research Start-Up Foundation of Shantou University (NTF20006), the National Natural Science Foundation of China (U1901213), the Guangdong Natural Science Foundation of China (2016A030312004), the Foundation for Young Talents in the General Colleges and Universities of Guangdong, China (2019KQNCX044), the Project of Enhancing School with Innovation of Guangdong Ocean University (GDOU2016050260 and 230419097), and the Program for Scientific Research Start-Up Funds of Guangdong Ocean University (R19007).

Institutional Review Board Statement

Not applicable.

Informed Consent Statement

Not applicable.

Data Availability Statement

To access the data published in this manuscript, refer to the corresponding author ([email protected]).

Acknowledgments

We thank LetPub (www.letpub.com (accessed on 9 March 2021)) for its linguistic assistance during the preparation of this manuscript.

Conflicts of Interest

The authors declare no conflict of interest.

References

  1. Lotze, H.K.; Lenihan, H.S.; Bourque, B.J.; Bradbury, R.H.; Jackson, J.B.C. Depletion, Degradation, and Recovery Potential of Estuaries and Coastal Seas. Science 2006, 312, 1806–1809. [Google Scholar] [CrossRef] [PubMed]
  2. Tesi, T.; Miserocchi, S.; Goñi, M.; Langone, L.; Boldrin, A.; Turchetto, M. Organic matter origin and distribution in suspended particulate materials and surficial sediments from the western Adriatic Sea (Italy). Estuar. Coast. Shelf Sci. 2007, 73, 431–446. [Google Scholar] [CrossRef]
  3. Harmelinvivien, M.; Loizeau, V.; Mellon, C.; Beker, B.; Arlhac, D.; Bodiguel, X.; Ferraton, F.; Hermand, R.; Philippon, X.; Salenpicard, C. Comparison of C and N stable isotope ratios between surface particulate organic matter and microphytoplankton in the Gulf of Lions (NW Mediterranean). Cont. Shelf Res. 2008, 28, 1911–1919. [Google Scholar] [CrossRef] [Green Version]
  4. Chen, F.-R.; Zhang, L.; Yang, Y.-Q.; Zhang, D.-R. Chemical and isotopic alteration of organic matter during early diagenesis: Evidence from the coastal area off-shore the Pearl River estuary, south China. Acta Oceanol. Sin. 2008, 74, 372–380. [Google Scholar] [CrossRef]
  5. Guo, W.; Ye, F.; Xu, S.; Jia, G. Seasonal variation in sources and processing of particulate organic carbon in the Pearl River estuary, South China. Estuar. Coast. Shelf Sci. 2015, 167, 540–548. [Google Scholar] [CrossRef]
  6. Ye, F.; Guo, W.; Shi, Z.; Jia, G.; Wei, G. Seasonal dynamics of particulate organic matter and its response to flooding in the Pearl River Estuary, China, revealed by stable isotope (δ13C and δ15N) analyses. J. Geophys. Res. Ocean. 2017, 122, 6835–6856. [Google Scholar] [CrossRef]
  7. Zhang, R.; Chen, M.; Ma, Q.; Cao, J.; Qiu, Y. Latitudinal distribution of nitrogen isotopic composition in suspended particulate organic matter in tropical/subtropical seas. Isot. Environ. Health Stud. 2011, 47, 489–497. [Google Scholar] [CrossRef]
  8. Zhang, R.; Chen, M.; Guo, L.; Gao, Z.; Ma, Q.; Cao, J.; Qiu, Y.; Li, Y. Variations in the isotopic composition of particulate organic carbon and their relation with carbon dynamics in the western Arctic Ocean. Deep Sea Res. Part II Top. Stud. Oceanogr. 2012, 81–84, 72–78. [Google Scholar] [CrossRef]
  9. Zhang, J.; Wu, Y.; Jennerjahn, T.C.; Ittekkot, V.; He, Q. Distribution of organic matter in the Changjiang (Yangtze River) Estuary and their stable carbon and nitrogen isotopic ratios: Implications for source discrimination and sedimentary dynamics. Mar. Chem. 2007, 106, 111–126. [Google Scholar] [CrossRef]
  10. Gao, X.; Yang, Y.; Wang, C. Geochemistry of organic carbon and nitrogen in surface sediments of coastal Bohai Bay inferred from their ratios and stable isotopic signatures. Mar. Pollut. Bull. 2012, 64, 1148–1155. [Google Scholar] [CrossRef]
  11. Kanaya, G.; Nakamura, Y.; Koizumi, T.; Yamada, K.; Koshikawa, H.; Kohzu, A.; Maki, H. Temporal changes in carbon and nitrogen stable isotope ratios of macrozoobenthos on an artificial tidal flat facing a hypertrophic canal, inner Tokyo Bay. Mar. Pollut. Bull. 2013, 71, 179–189. [Google Scholar] [CrossRef]
  12. O’Leary, M.H. Carbon isotope in photosynthesis. BioScience 1988, 38, 328–336. [Google Scholar] [CrossRef]
  13. Meyers, P.A. Preservation of elemental and isotopic source identification of sedimentary organic matter. Chem. Geol. 1994, 114, 289–302. [Google Scholar] [CrossRef] [Green Version]
  14. Middelburg, J.J.; Herman, P.M.J. Organic matter processing in tidal estuaries. Mar. Chem. 2007, 106, 127–147. [Google Scholar] [CrossRef]
  15. Thornton, S.F.; Mcmanus, J. Application of Organic Carbon and Nitrogen Stable Isotope and C/N Ratios as Source Indicators of Organic Matter Provenance in Estuarine Systems: Evidence from the Tay Estuary, Scotland. Estuar. Coast. Shelf Sci. 1994, 38, 219–233. [Google Scholar] [CrossRef]
  16. Middelburg, J.J.; Nieuwenhuize, J. Carbon and nitrogen stable isotopes in suspended matter and sediments from the Schelde Estuary. Mar. Chem. 1998, 60, 217–225. [Google Scholar] [CrossRef]
  17. Maksymowska, D.; Richard, P.; Piekarek-Jankowska, H.; Riera, P. Chemical and Isotopic Composition of the Organic Matter Sources in the Gulf of Gdansk (Southern Baltic Sea). Estuar. Coast. Shelf Sci. 2000, 51, 585–598. [Google Scholar] [CrossRef]
  18. Wada, E.; Hattori, A. Nitrogen in the Sea: Forms, Abundance, and Rate Processes; CRC Press: Boca Raton, FL, USA, 1990; p. 224. [Google Scholar]
  19. Mcclelland, J.W.; Valiela, I.; Michener, R.H. Nitrogen-stable isotope signatures in estuarine food webs: A record of increasing urbanization in coastal watersheds. Limnol. Oceanogr. 1997, 42, 930–937. [Google Scholar] [CrossRef]
  20. Gordon, E.S.; Goñi, M.A. Sources and distribution of terrigenous organic matter delivered by the Atchafalaya River to sediments in the northern Gulf of Mexico. Geochim. Cosmochim. Acta 2003, 67, 2359–2375. [Google Scholar] [CrossRef]
  21. Ke, Z.; Tan, Y.; Huang, L.; Zhao, C.; Jiang, X. Spatial distributions of δ13C, δ15N and C/N ratios in suspended particulate organic matter of a bay under serious anthropogenic influences: Daya Bay, China. Mar. Pollut. Bull. 2017, 114, 183–191. [Google Scholar] [CrossRef]
  22. Sheng, K.E.; Li-Rong, Z.; Sheng-Li, S. Distribution characteristics and sources of PAHs in sea water of the land-based outlet of Zhanjiang Bay. Mar. Environ. Sci. 2014, 33, 71–77. [Google Scholar]
  23. Jibiao, Z.; Fengxia, Z.; Chunliang, C.; Xingli, S.; Yuzhen, S.; Hui, Z.; Fajin, C.; Yiguo, H. Spatial distribution and correlation characteristics of heavy metals in the seawater, suspended particulate matter and sediments in Zhanjiang Bay, China. PLoS ONE 2018, 13, e0201414. [Google Scholar]
  24. Yuzhen, S.; Yubin, Z.; Xingli, S. Spatiotemporal Distribution of Eutrophication and Its Relationship with Environmental Factors in Zhanjiang Sea Bay Area. Environ. Sci. Technol. 2015, 38, 90–96. [Google Scholar]
  25. Li, J.; Cao, R.; Lao, Q.; Chen, F.; Zhu, Q. Assessing Seasonal Nitrate Contamination by Nitrate Dual Isotopes in a Monsoon-Controlled Bay with Intensive Human Activities in South China. Int. J. Environ. Res. Public Health 2020, 17, 1921. [Google Scholar] [CrossRef] [Green Version]
  26. Lu, X.; Zhou, F.; Chen, F.; Lao, Q.; Zhu, Q.; Meng, Y.; Chen, C. Spatial and Seasonal Variations of Sedimentary Organic Matter in a Subtropical Bay: Implication for Human Interventions. Int. J. Environ. Res. Public Health 2020, 17, 1362. [Google Scholar] [CrossRef] [Green Version]
  27. Peng, Z.; Ru, W.L.; Yu, L.J. Concentrations, compositions and fluxes of nitrogen and phosphorus pollutants from land to sea in Zhanjiang Bay in summer. J. Guangdong Ocean Univ. 2019, 39, 63–72. [Google Scholar]
  28. Chen, F.; Lao, Q.; Jia, G.; Chen, C.; Zhu, Q.; Zhou, X. Seasonal variations of nitrate dual isotopes in wet deposition in a tropical city in China. Atmos. Environ. 2019, 196. [Google Scholar] [CrossRef]
  29. Lorenzen, C.J. Determination of chlorophyll and pheopigments: Spectrophotometric equations. Limnol. Oceanogr. 1967, 12, 343–346. [Google Scholar] [CrossRef]
  30. Kayanne, Y.H. Rapid Direct Determination of Organic Carbon and Nitrogen in Carbonate-Bearing Sediments with a Yanaco MT-5 CHN Analyzer. Limnol. Oceanogr. 1995, 40, 1001–1005. [Google Scholar]
  31. Sarma, V.V.S.S.; Krishna, M.S.; Prasad, V.R.; Kumar, B.S.K.; Naidu, S.A.; Rao, G.D.; Viswanadham, R.; Sridevi, T.; Kumar, P.P.; Reddy, N.P.C. Distribution and sources of particulate organic matter in the Indian monsoonal estuaries during monsoon. J. Geophys. Res. Biogeoences 2015, 119, 2095–2111. [Google Scholar] [CrossRef]
  32. Lao, Q.; Chen, F.; Liu, G.; Chen, C.; Jin, G.; Zhu, Q.; Wei, C.; Zhang, C. Isotopic evidence for the shift of nitrate sources and active biological transformation on the western coast of Guangdong Province, South China. Mar. Pollut. Bull. 2019, 142, 603–612. [Google Scholar] [CrossRef]
  33. Graham, M.C.; Eaves, M.A.; Farmer, J.G.; Dobson, J.; Fallick, A.E. A Study of Carbon and Nitrogen Stable Isotope and Elemental Ratios as Potential Indicators of Source and Fate of Organic Matter in Sediments of the Forth Estuary, Scotland. Estuar. Coast. Shelf Sci. 2001, 52, 375–380. [Google Scholar] [CrossRef]
  34. Hedges, J.I.; Oades, J.M. Comparative organic geochemistries of soils and marine sediments. Org. Geochem. 1997, 27, 319–361. [Google Scholar] [CrossRef]
  35. Lamb, A.L.; Wilson, G.P.; Leng, M.J. A review of coastal palaeoclimate and relative sea-level reconstructions using δ13C and C/N ratios in organic material. Earth Sci. Rev. 2006, 75, 29–57. [Google Scholar] [CrossRef]
  36. Holtvoeth, J.; Kolonic, S.; Wagner, T. Soil organic matter as an important contributor to late Quaternary sediments of the tropical West African continental margin. Geochim. Cosmochim. Acta 2005, 69, 2031–2041. [Google Scholar] [CrossRef]
  37. Maya, M.V.; Karapurkar, S.G.; Naik, H.; Roy, R.; Shenoy, D.M.; Naqvi, S.W.A. Intra-annual variability of carbon and nitrogen stable isotopes in suspended organic matter in waters of the western continental shelf of India. Biogeosciences 2011, 8, 3441–3456. [Google Scholar] [CrossRef] [Green Version]
  38. Ittekkot, V.; Zhang, S. Pattern of particulate nitrogen transport in world rivers. Glob. Biogeochem. Cycles 1989, 3, 383–391. [Google Scholar] [CrossRef]
  39. Wu, Y.; Zhang, J.; Li, D.J.; Wei, H.; Lu, R.X. Isotope variability of particulate organic matter at the PN section in the East China Sea. Biogeochemistry 2003, 65, 31–49. [Google Scholar] [CrossRef]
  40. Jia, G.; Peng, P.A. Temporal and spatial variations in signatures of sedimented organic matter in Lingding Bay (Pearl estuary), southern China. Mar. Chem. 2003, 82, 47–54. [Google Scholar] [CrossRef]
  41. Xu, G.; Liu, J.; Hu, G.; Jonell, T.N.; Chen, L. Distribution and source of organic matter in surface sediment from the muddy deposit along the Zhejiang coast, East China Sea. Mar. Pollut. Bull. 2017, 123, 395–399. [Google Scholar] [CrossRef]
  42. Sarma, V.V.S.S.; Arya, J.; Subbaiah, C.V.; Naidu, S.A.; Gawade, L.; Kumar, P.P.; Reddy, N.P.C. Stable isotopes of carbon and nitrogen in suspended matter and sediments from the Godavari estuary. J. Oceanogr. 2012, 68, 307–319. [Google Scholar] [CrossRef]
  43. Ying, W.; Dittmar, T.; Ludwichowski, K.U.; Kattner, G.; Jing, Z.; Zhu, Z.Y.; Koch, B.P. Tracing suspended organic nitrogen from the Yangtze River catchment into the East China Sea. Mar. Chem. 2007, 107, 367–377. [Google Scholar]
  44. Herman, P.M.; Heip, C.H. Biogeochemistry of the MAximum TURbidity Zone of Estuaries (MATURE): Some conclusions. J. Mar. Syst. 1999, 22, 89–104. [Google Scholar] [CrossRef]
  45. Hedges, J.I.; Keil, R.G.; Benner, R. What happens to terrestrial organic matter in the ocean? Org. Geochem. 1997, 27, 195–212. [Google Scholar] [CrossRef]
  46. Hu, J.; Peng, P.; Jia, G.; Mai, B.; Zhang, G. Distribution and sources of organic carbon, nitrogen and their isotopes in sediments of the subtropical Pearl River estuary and adjacent shelf, Southern China. Mar. Chem. 2006, 98, 274–285. [Google Scholar] [CrossRef]
  47. Voß, M.; Struck, U. Stable nitrogen and carbon isotopes as indicator of eutrophication of the Oder river (Baltic sea). Mar. Chem. 1997, 59, 35–49. [Google Scholar]
  48. Gu, B. Factors controlling seasonal variations in stable isotope composition of particulate organic matter in a softwater eutrophic lake. Limnol. Oceanogr. 2006, 51, 2837–2848. [Google Scholar] [CrossRef]
  49. Gu, B.; Schelske, L. Temporal and spatial variations in phytoplankton carbon isotopes in a polymictic subtropical lake. J. Plankton Res 1996, 18, 2081–2092. [Google Scholar] [CrossRef] [Green Version]
  50. Chen, F.; Jia, G. Spatial and seasonal variations in δ13C and δ15N of particulate organic matter in a dam-controlled subtropical river. River Res. Appl. 2009, 25, 1169–1176. [Google Scholar] [CrossRef]
  51. Yu, F.; Zong, Y.; Lloyd, J.M.; Huang, G.; Leng, M.J. Bulk organic δ13C and C/N as indicators for sediment sources in the Pearl River delta and estuary, southern China. Estuar. Coast. Shelf Sci. 2010, 87, 618–630. [Google Scholar] [CrossRef]
  52. Zhang, Y.; Kaiser, K.; Li, L.; Zhang, D.; Yong, R.; Benner, R. Sources, distributions, and early diagenesis of sedimentary organic matter in the Pearl River region of the South China Sea. Mar. Chem. 2014, 158, 39–48. [Google Scholar] [CrossRef]
  53. Kumar, S.; Ramesh, R.; Bhosle, N.B.; Sardesai, S.; Sheshshayee, M.S. Natural isotopic composition of nitrogen in suspended particulate matter in the Bay of Bengal. OALib J. 2004, 1, 63–70. [Google Scholar]
  54. Tieqiang, M.; Hongpo, D.; Fajin, C. Abundance, diversity and distribution of denitrifying and anammox bacteria in sediments of Zhanjiang Bay. Mar. Limnol. 2020, 51, 63–78. [Google Scholar]
  55. Wenna, Y.; Hongpo, D.; Qinghua, H. Abundance, diversity and distribution characteristics of ammonia oxidizing microorganisms in sediments of Zhanjiang Bay. J. Guangdong Ocean Univ. 2018, 38, 37–46. [Google Scholar]
  56. Barros, G.V.; Martinelli, L.A.; Novais, T.M.O.; Ometto, J.P.H.B.; Zuppi, G.M. Stable isotopes of bulk organic matter to trace carbon and nitrogen dynamics in an estuarine ecosystem in Babitonga Bay (Santa Catarina, Brazil). Sci. Total Environ. 2010, 408, 2226–2232. [Google Scholar] [CrossRef]
  57. Andrews, J.E.; Greenaway, A.M.; Dennis, P.F. Combined carbon isotope and C/N ratios as indicators of source and fate of organic matter in a poorly flushed, tropical estuary. Estuar. Coast. Shelf Sci. 1998, 46, 756. [Google Scholar] [CrossRef]
Figure 1. Map of the sampling sites in Zhanjiang Bay, which is divided into three main sections: the upper bay, the middle bay, and the bay mouth. Note that the aquaculture activities mainly occur in the upper and middle bay areas and are primarily related to shipping. WM: winter monsoon; SM: summer monsoon.
Jmse 09 00541 g001
Figure 2. Seasonal and spatial changes in the temperature and salinity of the surface water in Zhanjiang Bay.
Jmse 09 00541 g002
Figure 3. Seasonal and spatial distributions of chlorophyll a (Chl a) and lg(SPM) in the surface water of Zhanjiang Bay.
Jmse 09 00541 g003
Figure 4. Seasonal and spatial distributions of the POC, PN, and C/N ratios in the surface water of Zhanjiang Bay.
Jmse 09 00541 g004
Figure 5. Seasonal and spatial distributions of δ13C and δ15N in the surface water of Zhanjiang Bay.
Jmse 09 00541 g005
Figure 6. Relationships between chlorophyll a (Chl a) and POC and PN in the different areas of Zhanjiang Bay during the summer.
Jmse 09 00541 g006
Figure 7. Relationships between chlorophyll a (Chl a) and δ15N and δ13C in the different areas of Zhanjiang Bay during the summer.
Jmse 09 00541 g007
Figure 8. Relationships between salinity and POC (a), PN (b), δ13C (c), and δ15N (d), of Zhanjiang Bay during the summer.
Jmse 09 00541 g008
Figure 9. Relationships between chlorophyll a (Chl a) and POC and PN in the different areas of Zhanjiang Bay during the winter.
Jmse 09 00541 g009
Figure 10. Relationships between chlorophyll a (Chl a) and δ15N and δ13C in the different areas of Zhanjiang Bay during the winter.
Jmse 09 00541 g010
Figure 11. Relationships between salinity and POC (a), PN (b), δ13C (c), and δ15N (d) of Zhanjiang Bay during the winter.
Jmse 09 00541 g011
Figure 12. Mixing plots of the carbon (δ13C) and nitrogen (δ15N) values of the particulate organic matter (POM) from three potential sources for all of the sampling stations in Zhanjiang Bay. The endmember POM sources include freshwater phytoplankton, marine organic matter, sewage, and terrestrial organic matter.
Jmse 09 00541 g012
Figure 13. Contributions of the potential sources of the particulate organic matter (POM) in Zhanjiang Bay. MO denotes marine organic matter; FP denotes freshwater phytoplankton.
Jmse 09 00541 g013
Table 1. Correlation matrix (r) for particulate organic matter concentrations and isotopic compositions, and related environmental parameters in the surface water of the upper bay in Zhanjiang Bay during the summer.
SalinityNO2NO3NH4+PO43−SiO3Chl aPOCPNδ15Nδ13C
Salinity1.00−0.960 **−0.985 **−0.754 *−0.939 **−0.447−0.709 *−0.757 *−0.0860.5110.874 **
NO2 1.000.981 **0.732 *0.922 **0.5430.730 *0.6280.033−0.432−0.793 *
NO3 1.000.787 *0.950 **0.4560.752 *0.725 *0.106−0.429−0.816 *
NH4+ 1.000.866 **0.4230.3890.647−0.153−0.58−0.696
PO43− 1.000.5520.5910.807 *−0.08−0.549−0.891 **
SiO3 1.000.1330.453−0.533−0.713 *−0.659
Chl a 1.000.5020.6830.06−0.383
POC 1.000.063−0.551−0.849 **
PN 1.000.5410.251
δ15N 1.000.787 *
δ13C 1.00
p < 0.05; ** p < 0.01.
Table 2. Correlation matrix (r) for particulate organic matter concentrations and isotopic compositions, and related environmental parameters in the surface water of the middle bay and bay mouth in Zhanjiang Bay during the summer.
SalinityNO2-NO3NH4+PO43−SiO3Chl aPOCPNδ15Nδ13C
Salinity1.00−0.963 **−0.921 **−0.831 **−0.572 *−0.968 **0.349−0.123−0.3520.0580.167
NO2 1.000.901 **0.798 **0.580 *0.974 **−0.2570.2140.378−0.117−0.248
NO3 1.000.931 **0.708 **0.966 **−0.443−0.0210.202−0.131−0.135
NH4+ 1.000.806 **0.891 **−0.528 *−0.291−0.039−0.377−0.253
PO43− 1.000.668 **−0.532 *−0.229−0.117−0.479−0.253
SiO3 1.00−0.4230.0540.238−0.132−0.16
Chl a 1.000.4980.574 *−0.057−0.465
POC 1.000.803 **0.336−0.024
PN 1.000.298−0.19
δ15N 1.000.756 **
δ13C 1.00
p < 0.05; ** p < 0.01.
Table 3. Correlation matrix (r) for particulate organic matter concentrations and isotopic compositions, and related environmental parameters in the surface water of the upper bay in Zhanjiang Bay during the winter.
SalinityNO2NO3NH4+PO43−SiO3Chl aPOCPNδ15Nδ13C
Salinity1.00−0.930 **−0.978 **−0.895 **−0.979 **−0.6720.848 *0.0060.880 **0.954 **0.948 **
NO2 1.000.978 **0.990 **0.983 **0.584−0.694−0.311−0.842 *−0.932 **−0.919 **
NO3 1.000.949 **0.999 **0.695−0.816 *−0.123−0.897 **−0.972 **−0.963 **
NH4+ 1.000.959 **0.505−0.655−0.402−0.837 *−0.915 **−0.907 **
PO43− 1.000.674−0.803 *−0.155−0.891 **−0.969 **−0.962 **
SiO3 1.00−0.778 *0.259−0.651−0.695−0.717
Chl a 1.00−0.3060.933 **0.900 **0.910 **
POC 1.00−0.0040.0770.059
PN 1.000.973 **0.973 **
δ15N 1.000.994 **
δ13C 1.00
p < 0.05; ** p < 0.01.
Table 4. Correlation matrix (r) for particulate organic matter concentrations and isotopic compositions, and related environmental parameters in the surface water of the middle bay and bay mouth in Zhanjiang Bay during the winter.
SalinityNO2NO3NH4+PO43−SiO3Chl aPOCPNδ15Nδ13C
Salinity1.000.3550.359−0.1720.812 **−0.634 **−0.484 *−0.711 **−0.751 **−0.174−0.574 *
NO2 1.000.985 **0.4060.769 **0.371−0.298−0.388−0.629 **0.478 *−0.532 *
NO3 1.000.3760.790 **0.375−0.399−0.411−0.685 **0.576 *−0.604 **
NH4+ 1.000.0840.521 *0.110.1030.0110.482 *0.093
PO43- 1.00−0.23−0.623 **−0.769 **−0.927 **0.292−0.774 **
SiO3 1.000.3070.470 *0.2710.594 **0.093
Chl a 1.000.650 **0.798 **−0.4070.745 **
POC 1.000.797 **−0.1280.702 **
PN 1.00−0.3420.876 **
δ15N 1.00−0.417
δ13C 1.00
p < 0.05; ** p < 0.01.
Table 5. Carbon (δ13C) and nitrogen (δ15N) values of the possible sources of the particulate organic matter (POM) in Zhanjiang Bay.
Sourcesδ13Cδ15NReferences
C3 plants−27.0 ± 3.05.1 ± 2.1[31,56]
Terrestrial soils−19.2 ± 2.410.3 ± 2.7[31]
Sewage−24.8 ± 3.212.7 ± 3.4[57]
Marine organic matter−20.0 ± 2.06.0 ± 2.0[6]
Freshwater phytoplankton−30.0 ± 2.012.0 ± 2.0[6]
Publisher’s Note: MDPI stays neutral with regard to jurisdictional claims in published maps and institutional affiliations.

