Article

Optimization of the Propulsive Efficiency of a Fast Catamaran

by
Yan Xing-Kaeding
1,* and
Apostolos Papanikolaou
2,*
1
Hamburg Ship Model Basin (HSVA), D-22305 Hamburg, Germany
2
National Technical University of Athens (NTUA), 15773 Athens, Greece
*
Authors to whom correspondence should be addressed.
J. Mar. Sci. Eng. 2021, 9(5), 492; https://doi.org/10.3390/jmse9050492
Submission received: 7 April 2021 / Revised: 26 April 2021 / Accepted: 28 April 2021 / Published: 1 May 2021
(This article belongs to the Special Issue Zero Emission Shipping)

Abstract

:
The present study deals with the local optimization of the stern area and of the propulsive efficiency of a battery-driven, fast catamaran vessel. The adopted approach considers a parametric model for the catamaran’s innovative transom stern and a QCM (Quasi-Continuous Method) body-force model for the effect of the fitted propellers. Hydrodynamic calculations were performed by the CFD code FreSCO+, which also enabled a deep analysis of the incurring unique propulsive phenomena. Numerical results of achieved high propulsive efficiency were verified by model experiments at the Hamburgische Schiffbau Versuchsanstalt (HSVA), proving the feasibility of the concept.

1. Introduction

The design and hydrodynamics of fast catamarans (and of multi-hull vessels in general) has been a favorite subject of scientific research and of innovative naval architectural engineering for many decades [1]. The complex hydrodynamics both in calm water and in waves are related to both the generated waves at higher speeds and to the interaction between the buoyant demihulls carrying the ship’s superstructure. The generally adopted slenderness of the demihulls eases, to a certain degree, the numerical modeling of the associated physical phenomena, enabling the application of simplified slender body or thin ship theory methods [2]. It is well established that the demihull interaction effects, which have, in general, a negative effect on calm water resistance. It is less well established that under certain conditions related to the optimization of the lengthwise distribution of the catamaran’s displacement and speed of advance, the interaction effect on resistance may be positive, thus reducing the sum of the demihulls single hull resistance [2]. In any case, the interaction effects in general decrease with the increase in the demihulls’ separation distance, at the expense of an increased structural weight of the catamaran due to the increase in weight of the unsupported deck structure. Even more, the increase of the separation distance leads to a drastic increase in the waterplane’s transverse moment of inertia and of the catamaran’s transverse metacentric height; thus, decreasing its natural roll period, resulting in large transverse and vertical accelerations and unpleasant seakeeping comfort for people onboard and cargo.
To enable high speeds for any type of vessel (and even more of catamarans) operating around and beyond a Froude number of 0.50, it is essential to conduct a hydrodynamic optimization of the ship’s hull form and its propulsive devices for the least power and of the overall design for the least structural and lightship weight. While we deal, in the present paper, only with the calm water hydrodynamic optimization, it may be of interest to study additional works on the optimization of the overall design of twin-hull vessels [3,4] and on the analysis of their seakeeping and wave-induced motions and loads [5].
The optimization of a catamaran’s main dimensions and its hull form for the least resistance needs to account for its basic constituents, namely the wave and viscous resistance, while considering that a catamaran’s wetted surface (and at least the frictional component of the viscous resistance) will be inherently larger than that of a monohull of equal displacement, in view of the demihull’s double inside surface. Thus, the main effort is to reduce the catamaran’s wave resistance, while the associated wave wash will be also of importance when the catamaran is operating in coastal areas [6]. The reduction of the catamaran’s (and that of multihulls, in general) wave resistance is well established and is associated with the slenderness of the demihulls and their least separation distance to avoid undesired negative interaction effects on the wave resistance value, whereas a variety of methods were employed for the determination of wave resistance. These methods range from simplified thin and slender body theory methods [7,8], to 3D Boundary Element (BEM) and traveling source panel methods [2] and advanced CFD methods [9]. Regarding the employed optimization methods, they range from Lagrange multiplier methods (in relation to thin ship theory approaches to the wave resistance) [7] to parametric modeling and genetic algorithm optimization methods [4,10]. While the optimization of the catamaran’s hull form for least resistance is well established, this is not so with its propulsive efficiency that requires the proper account of the hull–propeller–shaft–rudder interaction that will be the focus of the present paper and is inspired and supported by the EU funded project TrAM [11].
The aim of the TrAM project is to develop battery-driven zero emission fast passenger vessels for coastal areas and inland waterways. The innovations of the project are in the introduced marine batteries and associated technology, in the design and in the manufacturing, namely the application and development of modular methods in the marine industry. An essential constraint for the success of the project is that the developed electric-powered vessels should be fast transport vehicles and competitive in terms of offered services to conventional vessels, have a very low environmental footprint and sustainable life-cycle cost. In the frame of the project, in-depth numerical and experimental research was carried out on the hydrodynamic optimization of a battery-driven catamaran’s hull form and its propulsion system, minimizing the power requirements and energy consumption, which are essential for a battery-driven marine vehicle. A review of the unique problems related to the design of battery-driven fast catamarans is given in [10].
The present paper deals with the unique propulsive efficiency of a fast, battery-driven catamaran, the so-called Stavanger demonstrator of the TrAM project. It includes the analysis of all contributing propulsive factors (transom stern tunnel, wake and thrust deduction factors, and open water propeller efficiency), as determined by an advanced CFD solver (FreSCo+, [12]) and verified by model experiments at HSVA.

2. The Propulsive Efficiency Optimization Problem

2.1. The Approach

Assuming that the catamaran’s main dimensions and hull form have been optimized for least total resistance in the frame of a global optimization procedure, as elaborated in [9], it remains to optimize the stern area of the hull for the least propulsive power for the catamaran to achieve the specified service speed. This optimization includes the shaping of the transom stern, the propeller sizing/design and the inclination of the shaft lines (including their brackets).
The herein applied optimization approach consists of the parametric modeling of the ensuing stern hull geometry, in which a propeller of maximum diameter is fitted and the inclination of the shaft line is introduced through a maximum inclination angle constraint. The computational method applied is a coupled RANS-BEM method. Though the propeller can, nowadays, be geometrically modeled by RANS codes through Sliding Interface (SI) or overlapping grid methods, a more practical and efficient approach, applied herein, is to simulate the propeller effect through a 3D body-force model, as this allows the quick evaluation of a large number of design variants. The body forces are obtained in this study from a Propeller Vortex Lattice Method (QCM), which is coupled in an iterative manner to the RANS method to enable numerical self-propulsion simulations. More details of these methods are explained below.

2.2. RANSE Method

The HSVA in-house code FreSCo+ is a finite volume fluid flow solver, which is the result of a joint development between the Institute of Fluid Dynamics and Ship Theory (FDS) of the Hamburg University of Technology (TUHH) and the Hamburg Ship Model Basin (HSVA). Emphasis is thereby placed on an important element of maritime problems, namely the prediction of the free surface flow around ships, which is expressed in the name FreSCo, standing for Free Surface Computation.
The computational method in ‘FreSCo+’ is based on a finite-volume method and allows both structured-grid and unstructured-grid discretization. FreSCo+’s mathematical model is essentially the Reynolds-averaged Navier-Stokes (RANS) equations, supplemented with a series of turbulence models based on the eddy viscosity concept and a treatment of multi-phase flows using the volume-of-fluid approach. The FreSCo+ code solves the incompressible, unsteady Navier-Stokes equations (RANSE). The transport equations are discretized with the cell-centered finite volume method. Using a face-based approach, the method is applied to fully unstructured grids using arbitrary polyhedral cells or hanging nodes.
The governing equations are solved in a segregated manner, utilizing a volume-specific pressure correction scheme to satisfy the continuity equation, [13]. To avoid an odd–even decoupling of pressure and velocity, a third-order pressure smoothing is employed along a route outlined in [14]. The solution is iterated to convergence using a SIMPLE-type pressure-correction scheme. The fully implicit algorithm is second order accurate in space and time. The approximation of the integrals is based on the mid-point rule. Diffusion terms are approximated using second-order central differences, whereas advective fluxes are approximated based on blends between high-order upwind-biased schemes (e.g., QUICK), first order upwind and second order central differences schemes. The latter are applied in scalar form by means of a deferred-correction approach.
The method is applied to fully unstructured grids using arbitrary polyhedral cells or hanging nodes. In addition, features such as sliding interface or overlapping grid techniques have been implemented into the code [12]. Various turbulence-closure models are available for application, such as k-ε (Standard, RNG, Chen), k-ω (Standard, BSL, SST), Menter’s One Equation model and the Spalart-Allmaras turbulence model. In this paper, the k-ω SST model has been mainly used.

2.3. Propeller Vortex Lattice Method QCM

The method implemented in the “QCM” code is a vortex lattice method (VLM). The blades of the propeller are reduced to lifting surfaces, which account for camber and angle of attack. The lifting surfaces are built up by section mean lines. The thickness effect is accounted for by prescribed source densities on the lifting surfaces.
To calculate the load distribution on a lifting surface, a system of rectilinear vortices is introduced. This system is further divided into ‘bound’ vortices in span-wise direction and ‘shed’ vortices in chord-wise direction. This procedure can be considered a special type of a Boundary Element Method. The solution technique follows the standard procedure of boundary element methods in hydrodynamics: the prescribed normal component of the inflow velocity has to be compensated by the downwash due to the vortex system. Demanding this kinematic condition for a set of control points, one gets a system of linear equations. From this system, the strength of every rectilinear bound vortex is calculated. The system of vortices of known strength is now sufficient to derive the pressure and the forces on the blade surfaces. The typical vortex structure in the propeller wake in QCM is illustrated in Figure 1. More details on the method can be found in [15,16].
QCM can be used to compute the propeller flow under both steady and unsteady inflow conditions. The drawback of the method is that the flow is considered potential flow and the modeling of the propeller hub is critical. Viscous effects on the drag of the propeller blades are treated in QCM via empirical corrections based on the 2D profile viscous resistance. Good results can be obtained at the propeller design point. In the case of large oblique inflow angles to the propeller, however, larger errors are expected since the free vortex transport direction in the propeller wake is aligned with the propeller shaft without consideration of the actual inflow direction.

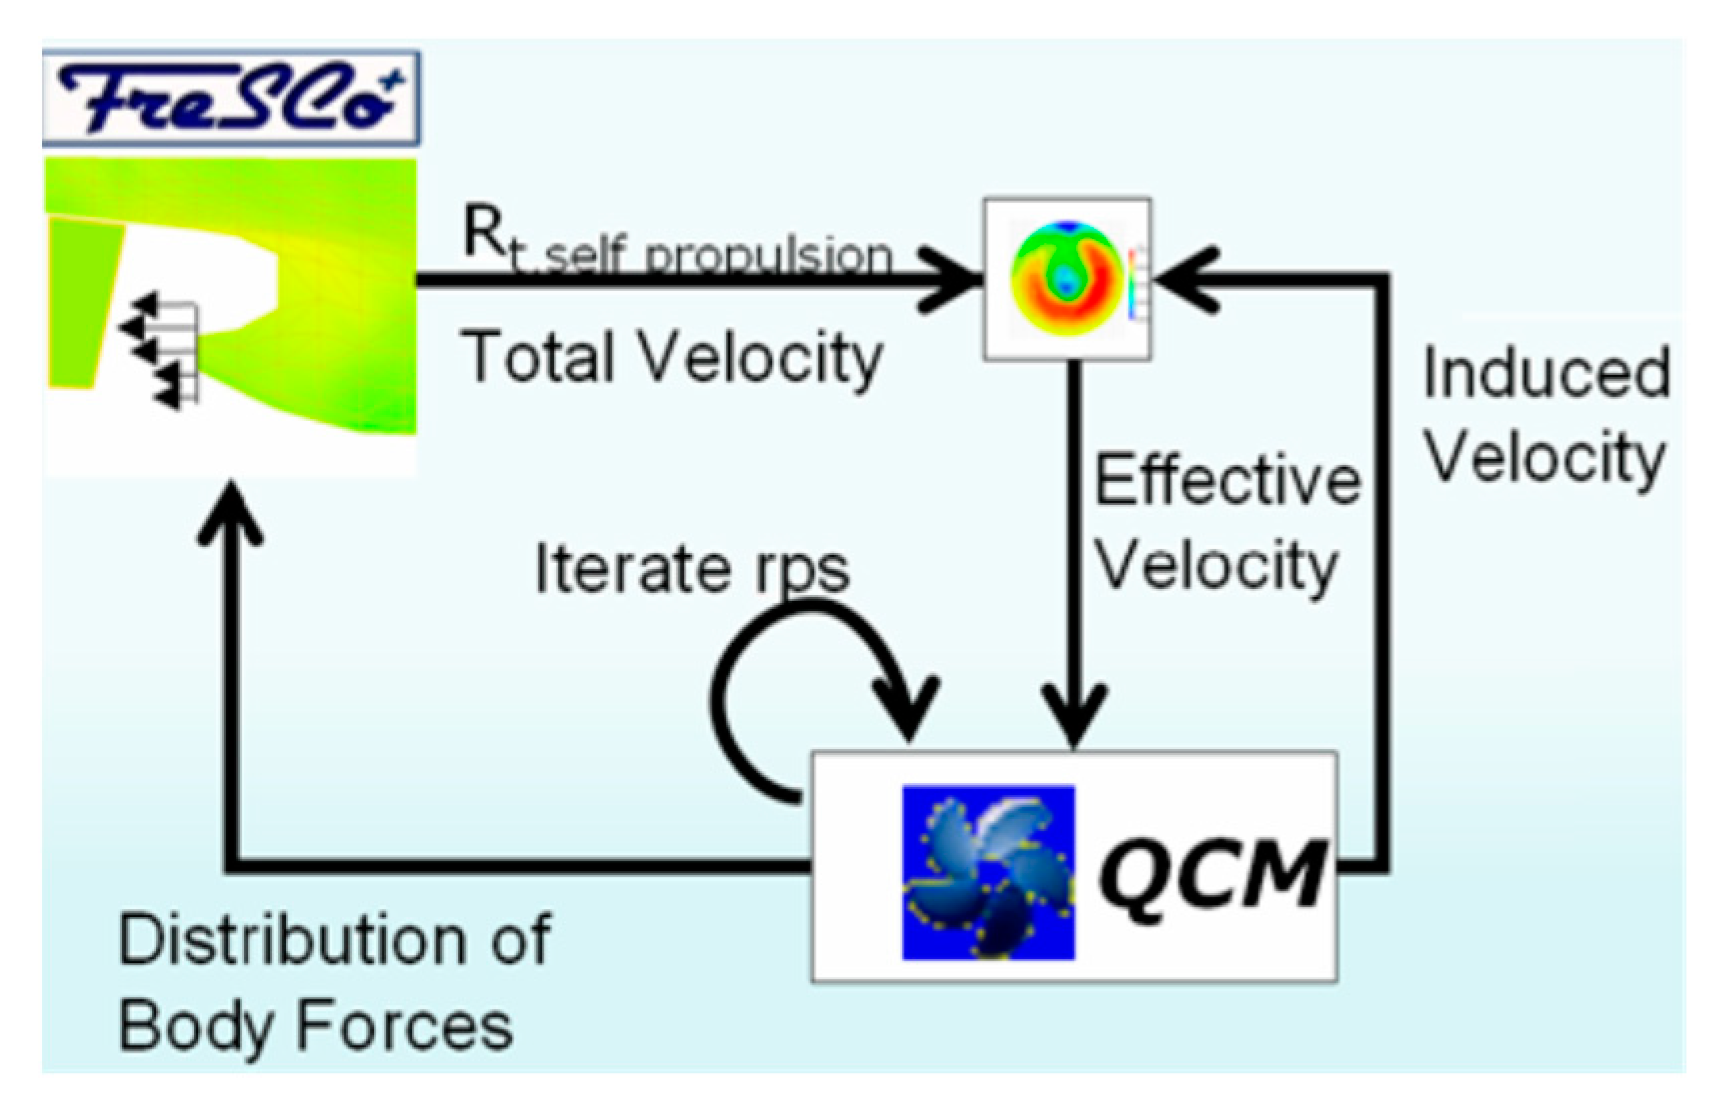
2.4. Numerical Self-Propulsion Using RANS-QCM Coupling

The present local stern form optimization studies, aiming at very high propulsive efficiency, have been conducted using the RANS-QCM coupling approach of HSVA to perform the numerical self-propulsion test. To this end, the code FreSCo+ is coupled with QCM in an iterative manner as shown in Figure 2.
At the start of the simulation, a nominal wake distribution is extracted on the propeller plane from the converged RANS solution without the propeller effect. This velocity distribution and an estimated turning rate are used as inputs for the QCM code to compute the forces on the propeller blades (thrust and torque). The hydrodynamic forces of the propeller are converted in the form of 3D body forces (source terms) assigned to cells, which represent the propeller disk. The turning rate in QCM is iteratively adjusted until the propeller thrust required to overcome the ship resistance (in self-propulsion mode) is obtained.
The resulting distribution of the body forces is used as an input to the next RANS calculation loop. The RANS computation is continued in the next iteration cycle and a new total velocity field is created. The propeller-induced velocities of the previous cycle, which are an output of the QCM code, are subtracted from the total velocity field. The resulting effective wake distribution is used as input in the subsequent QCM calculation. The iteration is repeated until the equilibrium between the resistance of the ship under the self-propulsion condition and the propeller thrust is reached. Normally, around 10–15 loops are needed to reach the equilibrium. Since the QCM computation is very fast, the computational time due to QCM is almost negligible compared to the required RANS simulation time. More details of this method can be found in [17].

2.5. Local Optimization Studies

The conducted global optimization [9] refers to the determination of the main dimensions and of the integrated hull form characteristics minimizing the calm water resistance, while the local hull form optimization takes into account not only the calm water resistance, but also the propulsive speed–power performance. Thus, the local hull form optimization study has focused on the optimization of the stern tunnel area and of the propulsive efficiency.
The stern hull form area was mathematically captured by six local form parameters, such as transom and tunnel width, height of centerline/chine at tunnel and transom positions. In addition, four parameters were incorporated related to the main propeller characteristics, such as propeller diameter, position and shaft inclination [9]. The involved ten local optimization variables are listed in Table 1. The parametric model for the stern hull form and propulsive arrangement is illustrated in Figure 3. In the present study case, the propeller, its shaft and brackets, as well as the rudder, were specified by the propeller manufacturer, thus their characteristics were not a subject of this study; however, their interaction with the catamaran’s hull form was fully considered in the transom stern optimization. There are, in total, eight constraints related to the propeller, shaft brackets and electric motor installation and class specification requirements (see Table 2). These constraints have a certain impact on the design space exploration and have been implemented before the design optimization procedure starts, which allows the evaluation of valid designs only and makes the whole procedure more efficient. The applied optimization procedure and the details of the design variables and constraints are elaborated in [9].
The identified best design with respect to the required delivered power (DHP) was found to be about 6% lower than the baseline design. It was further fine-tuned to minimize the risk of air suction by ensuring that no air enters into the propeller tunnel during operation. Additionally, the hull pressure fluctuations and amplitudes have been assessed by use of a vortex-lattice code with respect to the cavitation risk, which will not be elaborated in this paper [18]. Figure 4 compares the computed pressure coefficient Cp distribution in the resistance mode (without propeller action) and in the self-propulsion mode (with the acting propeller). As can be observed, a slight change in the pressure field can be detected on the tunnel surface in front of the propeller once the propeller is activated; at the same time, a slightly lower pressure is visible on the tunnel surface behind the propeller, which leads to a small thrust deduction factor.
The propeller-loading simulated herein via a body force method can be observed in Figure 5, together with the streamlines passing through the propeller discs.

3. Experimental Verification and Validation of Numerical Results

For the validation of the numerical predictions of the calm water performance of the TrAM Stavanger demonstrator, a prototype of which is presently in the production stage, a large model of 5.34 m in length (scale 1:5.6) was tested in the large towing tank of HSVA (300 m length × 18 m width × 5.6 m depth). The tested large model allowed very precise measurements, while minimizing scale effects. The large width of the towing basin minimized wall refection effects on the catamarans wave resistance. The model test results were analyzed by use of HSVA’s Standard Correlation Method, which is in accordance with Froude’s method. The demihull models were manufactured out of thin layer wood and were cross-connected by high-strength metal beams. A view of the tested model under way at Froude 0.69 (23 knots full scale speed) and a close-up of a demihull’s stern area with the fitted CP propeller, shaft, brackets and (twisted) rudder is shown in Figure 6.

3.1. Computational Setup

The computational domain used herein for the resistance and propulsion simulation (both taking into account the free surface effect) extends to 2 Lpp in front of, 5 Lpp behind, 3 Lpp to the side of, and 3 Lpp below the vessel, and is shown in Figure 7. A symmetry boundary condition was applied to the symmetry-plane of the catamaran. Local grid refinement was applied to the tunnel, propeller, appendages and free surface region. The generated numerical mesh is shown in Figure 8. The total number of used cells counts 5.7 M.
Both the computational domain and the mesh generation comply with the HSVA internal best practice guidelines, which are based on a large number of past numerical grid studies. Therefore, no specific grid study was made for this case.
To simulate the dynamic trim and sinkage motion of the catamaran, the free-form deformation method was applied to adapt the grid for the ship motion.

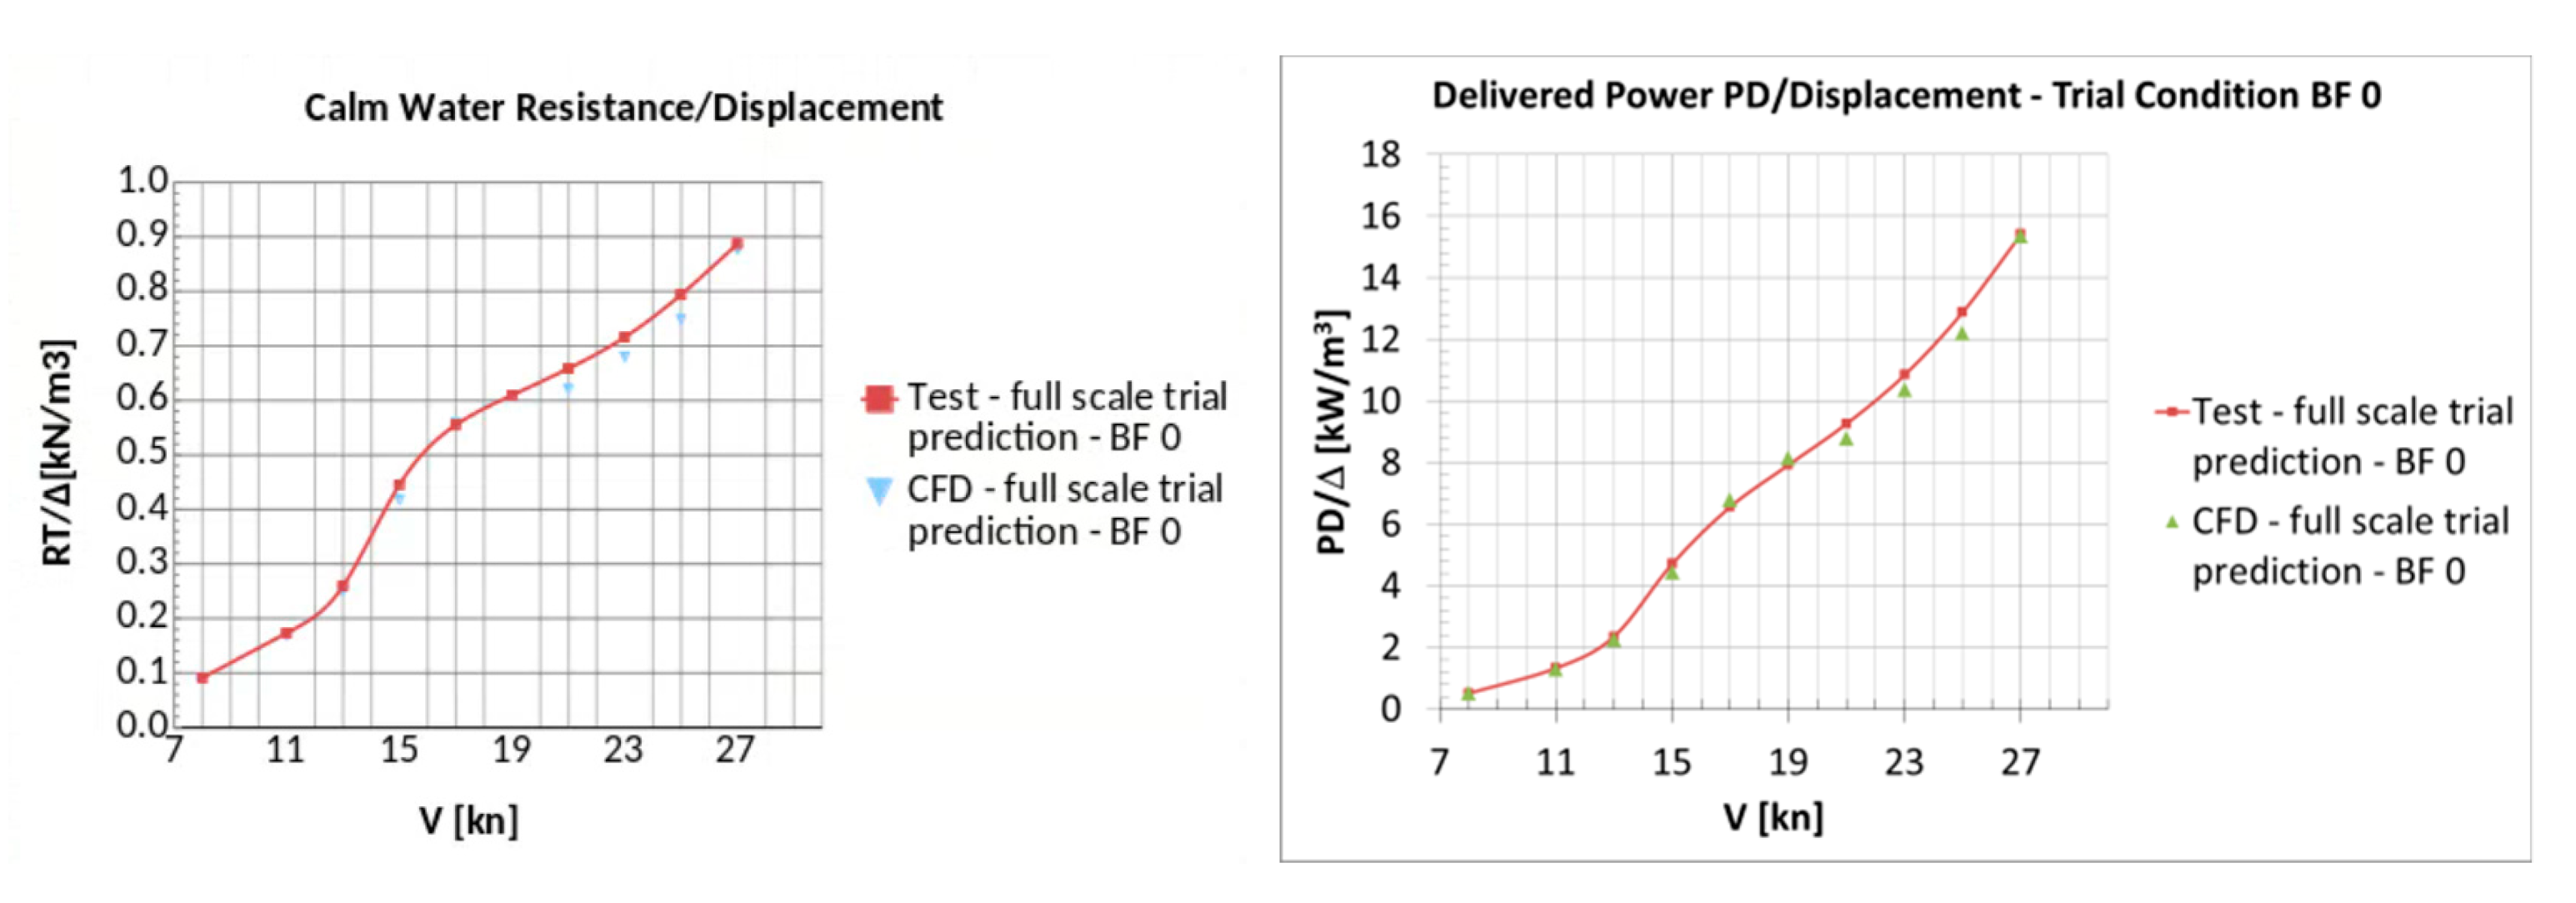
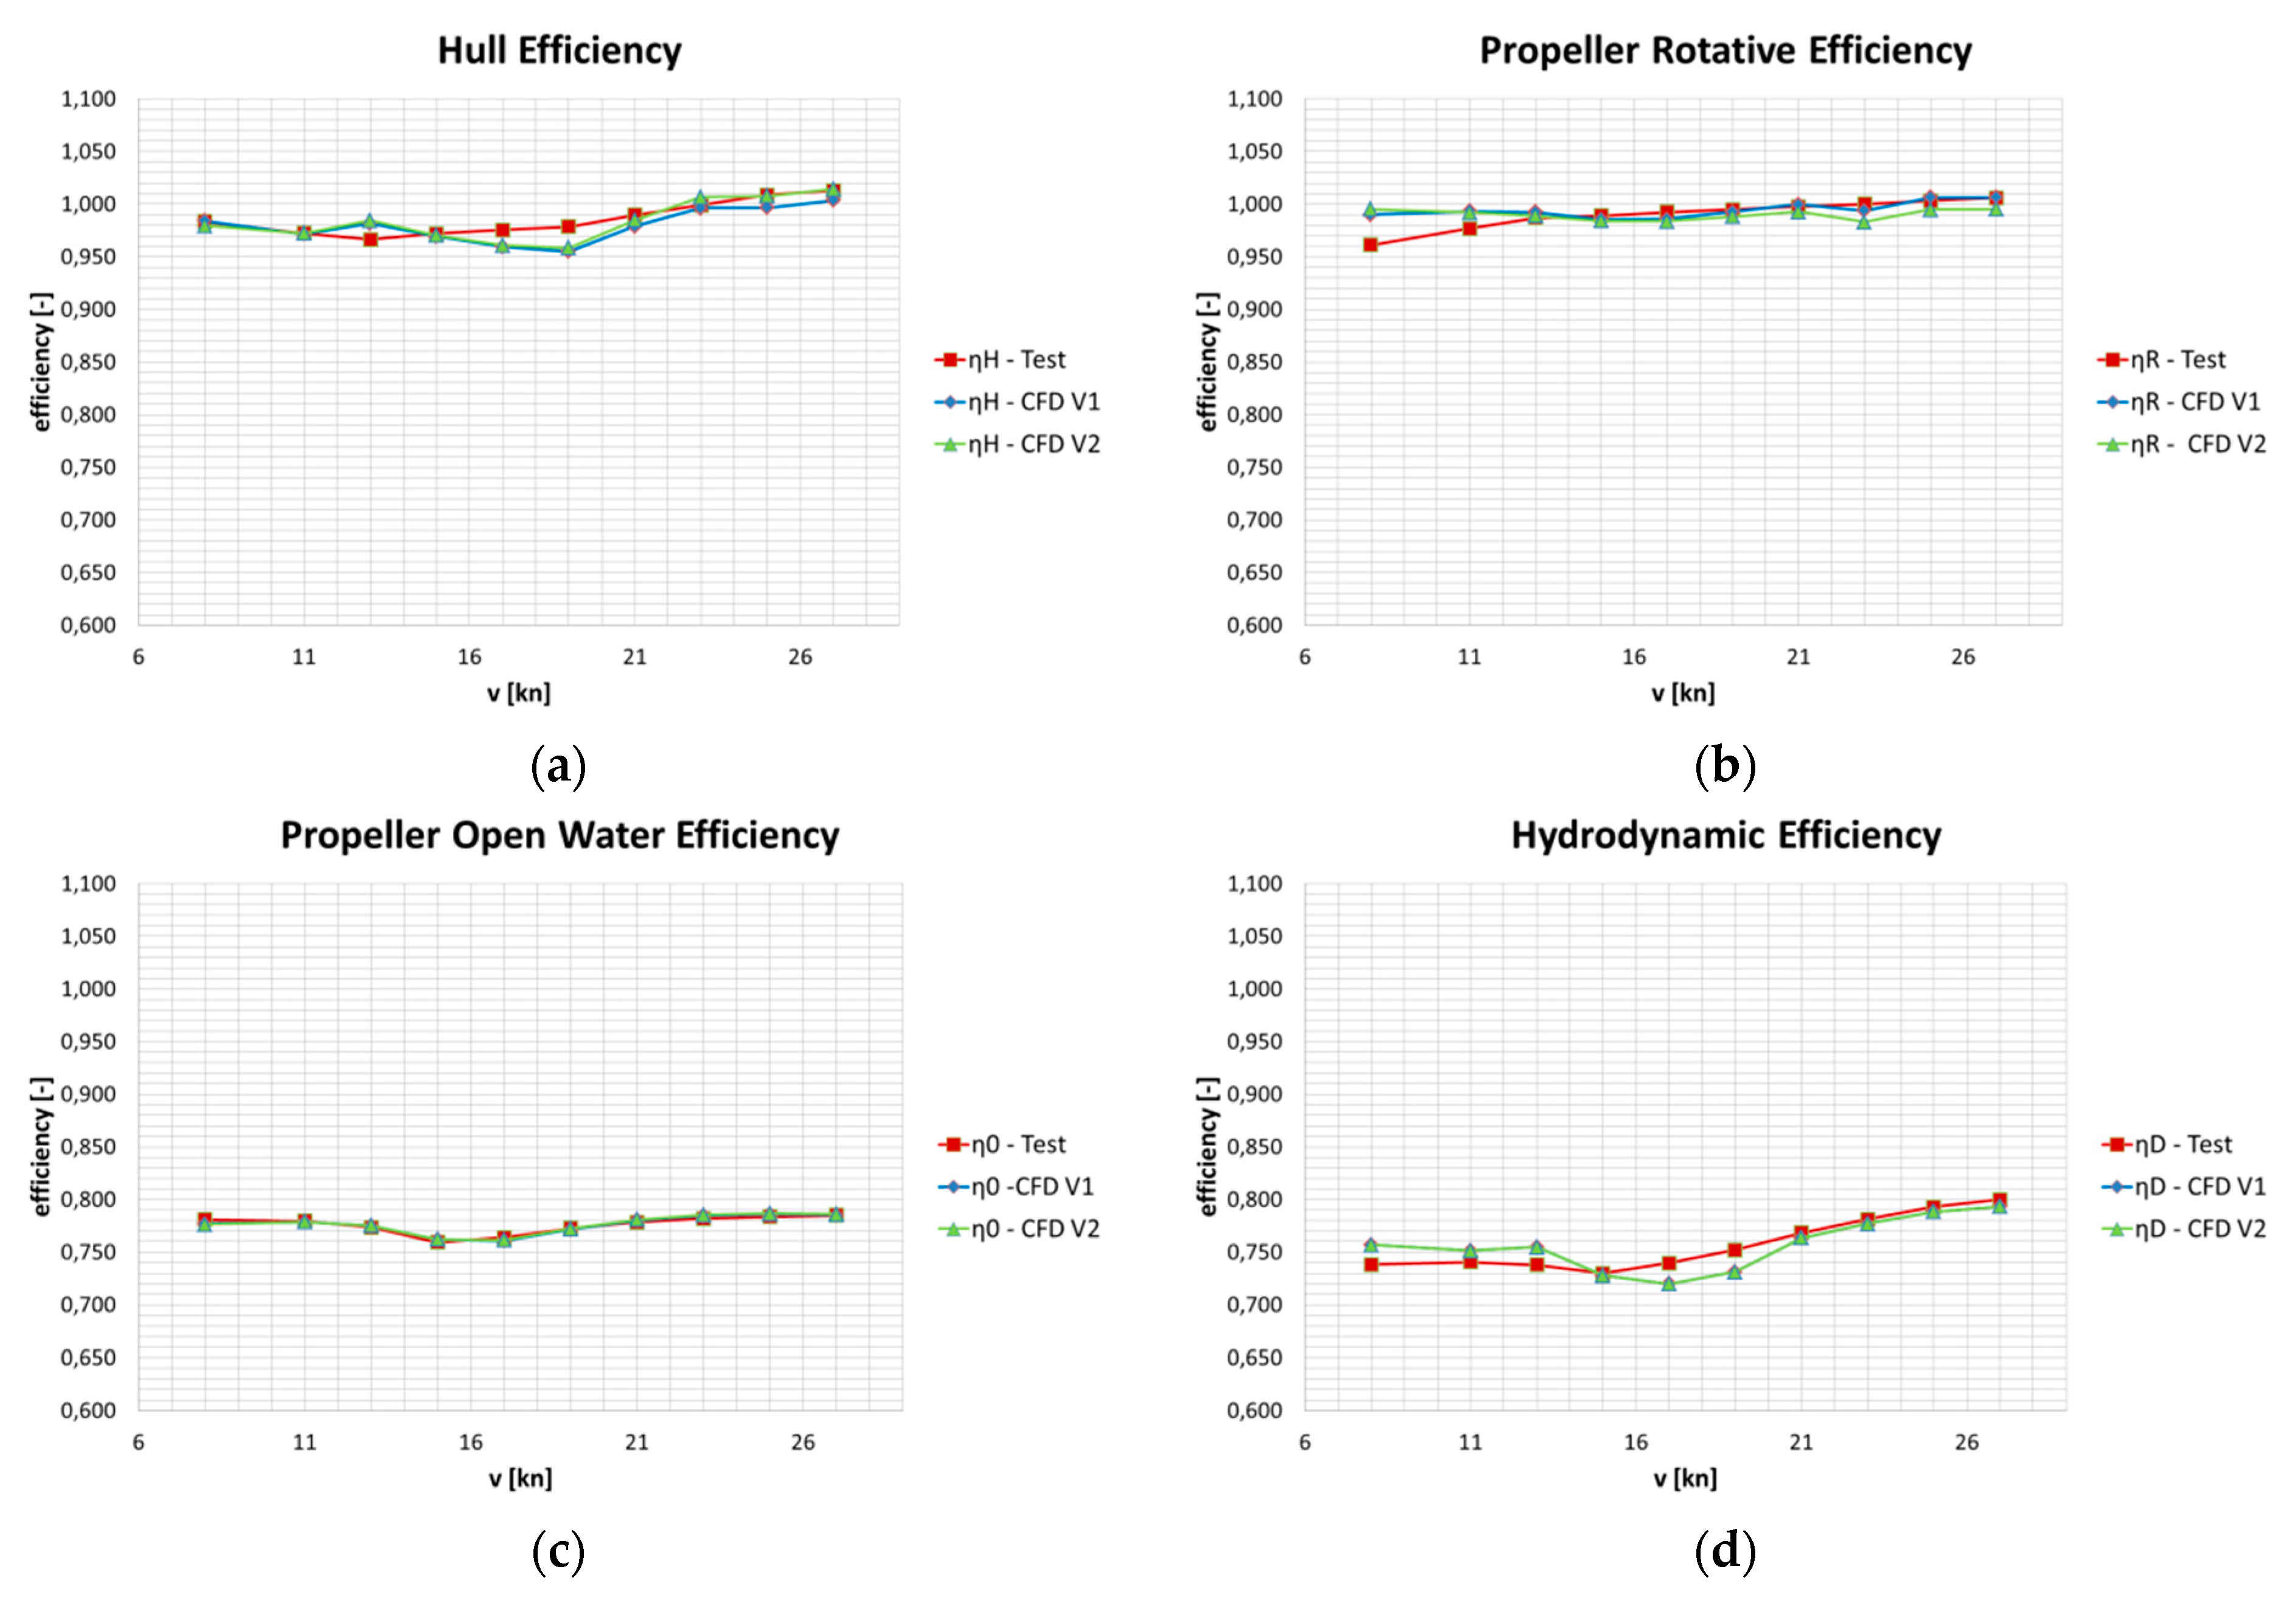
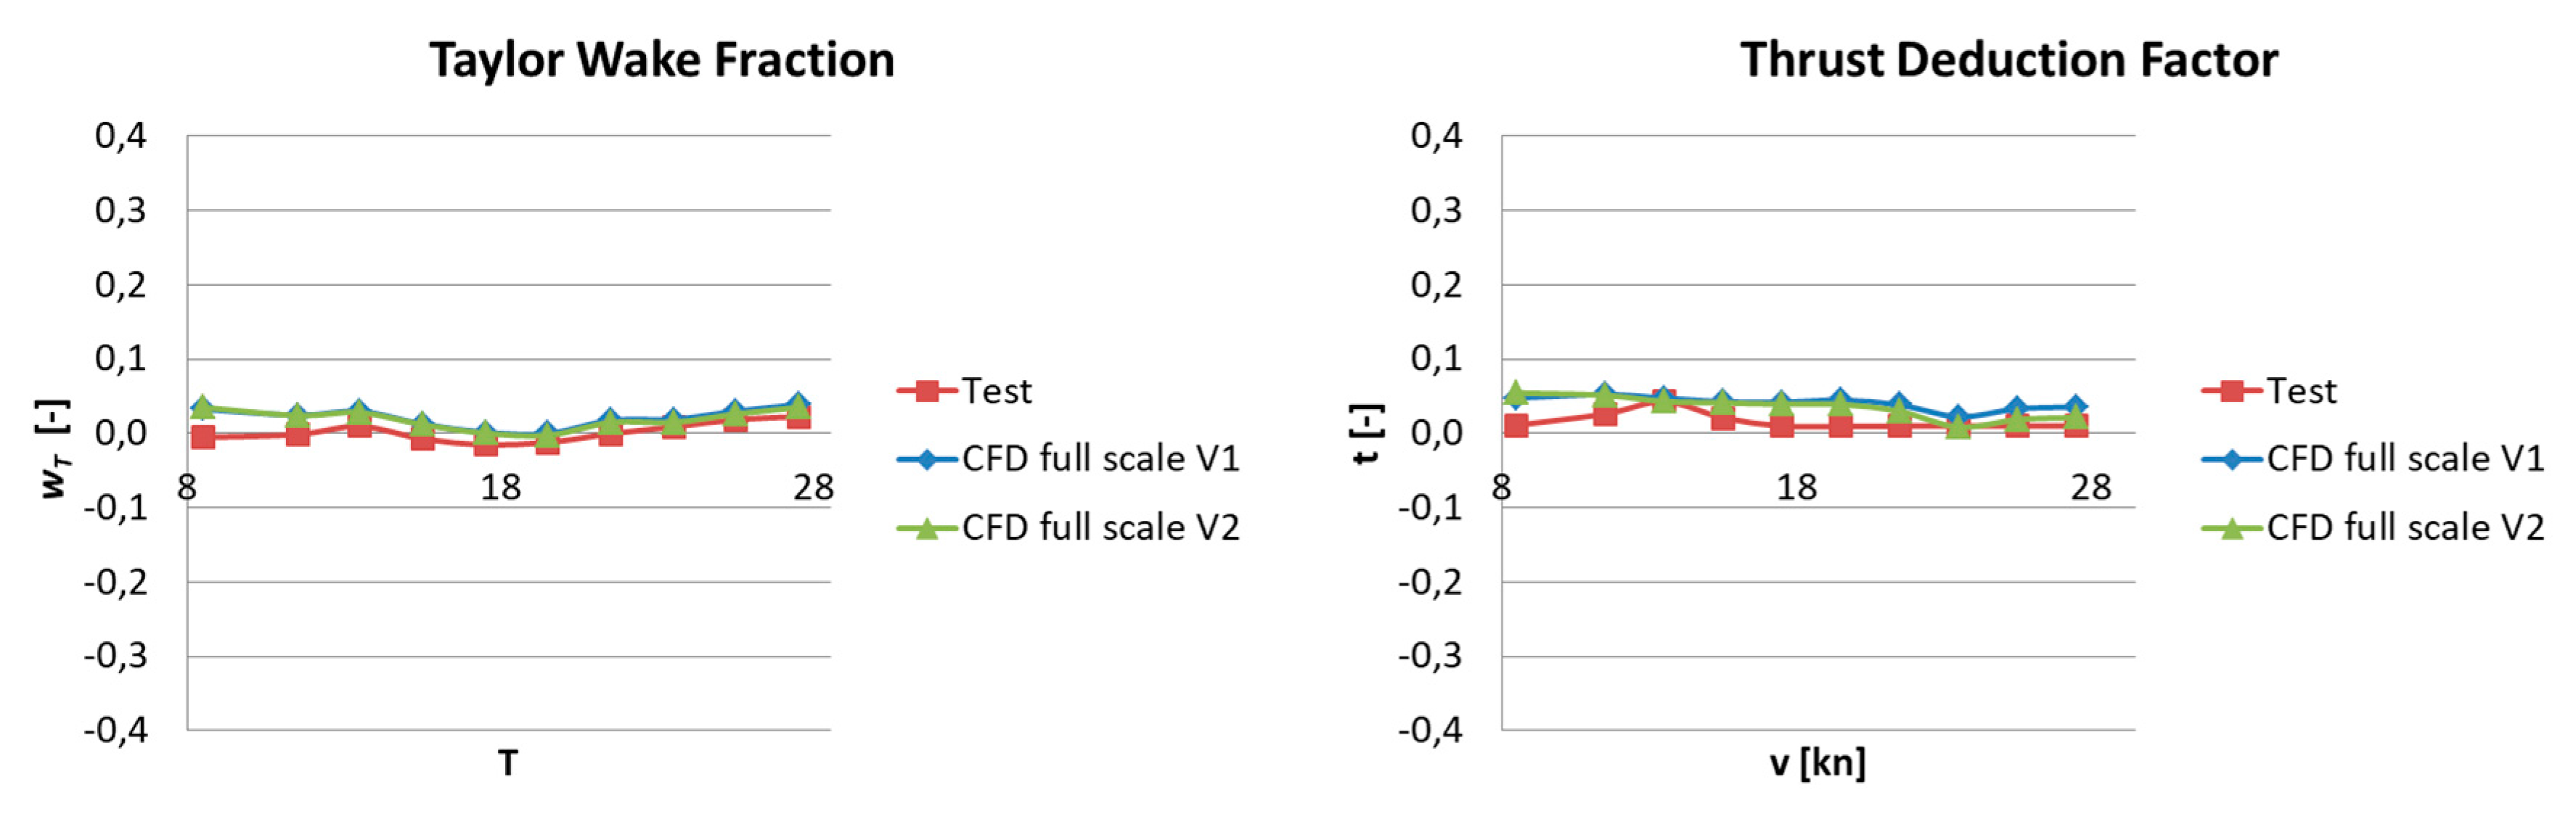
3.2. Discussion of Results

The predicted full-scale values obtained by CFD simulations could be very well confirmed by the physical test campaigns. The numerically predicted resistance and propulsion power in full scale were well verified by the model experiments, with an error margin of 3% on average (see Figure 9).
The predicted dynamic trim and sinkage by full scale CFD also show good agreement with the model experiments (see Figure 10). The observed stern-down trim of about one degree at the planned service speed of 23 knots is moderate, while the associated dynamic sinkage at the same speed is practically zero.
A remarkable result of the conducted model tests was the achieved very high propulsive efficiency. Notably, the high propulsive efficiency is not only achieved for the design condition, but also kept for off-design conditions (see Table 3).
We will be discussing in the following section the contributing factors to this high propulsive efficiency. The propeller open-water efficiency of the model tested is shown in Figure 11. It reaches an efficiency of about 80% at a speed advance ratio J of about 1.40.
The variation of the hull, the propeller rotative, and the open-water and the delivered power efficiency with speed are shown in Figure 12, as obtained from model tests and CFD calculations. In the present study, two different post-processing methods were applied in the analysis of the CFD results. The CFD V1 applies the conventional CFD processing procedure, in which the calculated QCM Propeller Blades Force leads to the propeller thrust and torque; in the second method, CFD V2 considers that the propeller thrust/torque are the sum of the propeller blades’ force (coming from QCM) and the propeller hub force (coming from the RANS computation). It proves that the second method is closer to the model experiment values, as can be seen in Figure 12 and Figure 13, especially in the prediction of the thrust deduction factor.
The very high open-water efficiency in view of the fitted propeller with a large diameter and relatively low thrust loading factor is at a speed of over 16 knots, further enhanced by the unique transom stern achieving a relative rotative efficiency (ηR) of over 100% and a total propulsive efficiency (ηD) of close to 80% at 27 knots speed.
The optimized unique transom stern with a longitudinal and transverse curvature creates almost perfect inflow conditions for the propeller, as indicated by the very low values of wake and thrust deduction from model tests and CFD results (Figure 13).
The calculated pressure field in the transom stern area, when looking from the bottom and the side, is depicted in Figure 14, showing the small shift of the pressure isolines for the resistance (black isolines) and propulsion (red isolines). This is in line with the observed very small values of the thrust deduction factor that, per definition, represents the augment of the catamaran’s resistance in towing conditions. The reduction of the pressure in the stern area by the propeller action in accelerating the flow in the self-propulsion mode is herein kept at low values as the thrust to propel the ship at a given speed.
The computed nominal wake is presented in axial velocity contours and transversal velocity vectors in Figure 15, illustrating and confirming again the minimal wake fraction factor. The nominal axial wake is very homogeneous except for a small region close to 178 degrees, where the wake of the shaft bracket is visible.
At this point, a comment is due on the notion of hull efficiency, commonly used in the assessment of ship’s hull–propeller interaction. Recalling the definition of the hull efficiency ηH = (1 − t)/(1 − w), it is evident that a large value of the wake factor w (typical for full type ships) leads to high hull efficiency values of well over 100%. This is, however, a deceptive indication of the quality of a ship’s hull–propeller interaction. A large wake fraction factor will lead to an inferior inflow to the propeller and to low propeller efficiency. In addition, large wake fraction factors (of full type ships) are associated with large thrust deduction factors and, thus, an increased augment of the resistance that needs to be overcome by the propeller thrust. In the present study, we detected measured (and calculated) thrust deduction and wake fraction factors close to zero at certain speeds and very high total propulsive efficiency due to close to ideal hull–propeller interaction conditions. At speeds at or above the design speed, the rotative propulsive efficiency ηR becomes higher than one, and the total propulsive efficiency ηD is even higher than the open water propulsive efficiency ηO. Thus, the traditional hull efficiency factor needs to be always assessed with caution and never separately from the other propulsive efficiency factors. It is noted that similarly low wake and thrust deduction factors are observed for fast twin-screw naval ships of the destroyer type, namely wake fractions between −0.02 and +0.02 for propeller shafts supported by struts and between 0.04 and 0.08 for those supported by brackets. The thrust deduction factors are, in this case, also very small and take similar values [18].
Finally, a systematic variation of a static pre-trim of the vessel delivered valuable information for the arrangement of the ship’s weight distribution in terms of power reduction, suggesting that keeping a moderate stern-down trim of less than 30 cm in full scale would lead to a small power increase or even decrease at higher speeds, while a bow-down trim would only be beneficial at lower speeds as indicated by CFD predictions (Figure 16).

4. Conclusions

The hydrodynamic optimization of fast ships is imperative for the feasibility of the design concept, even more so if the designer is dealing with the feasibility of a battery-driven, fast catamaran, for which the tradeoff between the required propulsion power for a certain speed and the weight of the energy source provider, namely the batteries, is governing the feasibility of the whole design concept.
In the present study, we focused on the analysis of the propulsive efficiency of a fast, battery-driven catamaran, a prototype of which is presently under construction and will start operations in 2022 in Stavanger, Norway. Next to the hull optimization with respect to resistance, it was the achieved high propulsive efficiency of close to 80% that proved the feasibility of the concept. This was enabled by the unique transom stern form with longitudinal and transverse curvature, the high open-water propeller efficiency associated with the fitted large diameter propeller in the stern’s tunnel, the very low values of wake and thrust deduction factors and the optimization of the concurrent hull, propeller, and shaft arrangements.

Author Contributions

Conceptualization, A.P. and Y.X.-K.; methodology, Y.X.-K.; software, Y.X.-K.; validation, Y.X.-K.; formal analysis, Y.X.-K. and A.P. investigation, A.P. and Y.X.-K.; resources, Y.X.-K.; data curation, Y.X.-K.; writing—original draft preparation, A.P.; writing—review and editing, A.P. and Y.X.-K.; visualization, Y.X.-K.; supervision, A.P.; project administration, Y.X.-K.; funding acquisition, A.P. All authors have read and agreed to the published version of the manuscript.

Funding

The TrAM project has received funding from the European Union’s Horizon 2020 research and innovation program under grant agreement No 769303.

Institutional Review Board Statement

Not applicable.

Informed Consent Statement

Not applicable.

Conflicts of Interest

The authors declare no conflict of interest.

References

  1. Papanikolaou, A. Review of Advanced Marine Vehicles Concepts. In Proceedings of the 7th International High Speed Marine Vehicles Conference (HSMV05), Naples, Italy, 21–23 September 2005. [Google Scholar]
  2. Papanikolaou, A.; Kaklis, P.; Koskinas, C.; Spanos, D. Hydrodynamic Optimization of Fast Displacement Catamarans. In Proceedings of the 2lst International Symposium on Naval Hydrodynamics, ONR’ 96, Trondheim, Norway, 24–26 June 1996. [Google Scholar]
  3. Papanikolaou, A.; Zaraphonitis, G.; Androulakakis, M. Preliminary Design of a High-Speed SWATH Passenger Car/ Ferry. Mar. Technol. 1991, 28, 129–141. [Google Scholar]
  4. Skoupas, S.; Zaraphonitis, G.; Papanikolaou, A. Parametric Design and Optimisation of High-Speed Ro-Ro Passenger Ships. Ocean Eng. 2019, 189, 106346. [Google Scholar] [CrossRef]
  5. Papanikolaou, A.; Schellin, T.H. On Estimating Dynamic Wave Loads for Global Strength Analysis of α Catamaran Ferry. In Proceedings of the 7th Congress of the IMAM, Dubrovnik, Croatia, 26–30 April 1995. [Google Scholar]
  6. Zaraphonitis, G.; Papanikolaou, A.; Mourkoyiannis, D. Hull Form Optimization of High-Speed Vessels with Respect to wash and Powering. In Proceedings of the 8th International Marine Design Conference (IMDC), Athens, Greece, 5–8 May 2003. [Google Scholar]
  7. Papanikolaou, A.; Androulakakis, M. Hydrodynamic Optimization of High-Speed SWATH. In Proceedings of the 1st FAST ’91 Conference, Trondheim, Norway, 17–21 June 1991. [Google Scholar]
  8. Mittendorf, M.; Papanikolaou, A. Hydrodynamic hull form optimization of fast catamarans using surrogate models. Ship Technol. Res. 2021, 68, 14–26. [Google Scholar] [CrossRef]
  9. Papanikolaou, A.; Xing-Kaeding, Y.; Strobel, H.; Kanellopoulou, A.; Zaraphonitis, G.; Tolo, E. Numerical and Experimental Optimization Study on a Fast, Zero Emission Catamaran. J. Mar. Sci. Eng. 2020, 8, 657. [Google Scholar] [CrossRef]
  10. Papanikolaou, A. Review of the Design and Technology Challenges of Zero-Emission Battery-Driven Fast Marine Vehicles. J. Mar. Sci. Eng. 2020, 8, 941. [Google Scholar] [CrossRef]
  11. TrAM—Transport: Advanced and Modular, H2020 EU Research Project, Grant Agreement No 769303, H2020, (2018–2022). Available online: https://tramproject.eu/ (accessed on 25 August 2020).
  12. Hafermann, D. The New RANSE Code FreSCo for Ship Application. In Proceedings of the Jahrbuch der Schiffbautechnischen Gesellschaft (STG), Hamburg, Germany, 9 October 2007; Volume 101. [Google Scholar]
  13. Ferziger, J.H.; Peric, M. Computational Methods for Fluid Dynamics, 3rd ed.; Springer: Berlin/Heidelberg, Germany, 2002. [Google Scholar]
  14. Rhie, C.M.; Chow, W.L. A numerical study for the turbulent past an isolated airflow with trailing edge separation. AIAA J. 1983, 17, 1525–1532. [Google Scholar] [CrossRef]
  15. Xing-Kaeding, Y.; Streckwall, H.; Gatchell, S. ESD Design and Analysis for validation bulk carrier. Int. Shipbuild. Prog. 2017, 63, 137–168. [Google Scholar] [CrossRef]
  16. Chao, K.Y.; Streckwall, H. Berechnung der Propellerumstroemung mit einer Vortex-Lattice Method. Jahrb. Schiffbautech. Ges. 1989, 83, 1989. [Google Scholar]
  17. Xing-Kaeding, Y.; Gatchell, S.; Streckwall, H. Towards Practical Design Optimization of Pre-Swirl Device and its Life Cycle Assessment. In Proceedings of the Fourth International Symposium on Marine Propulsors, SMP’15, Austin, TX, USA, 31 May–4 June 2015. [Google Scholar]
  18. Van Manen, J.D.; van Oossanen, P. Propulsion, Chapter VI in Principles of Naval Architecture; Lewis, E.L., Ed.; Publ. SNAME: Jersey, NJ, USA, 1988; ISBN 0-939773-01-05. [Google Scholar]
Figure 1. Vortex structure in the propeller wake in QCM for a typical propeller in a homogeneous inflow.
Jmse 09 00492 g001
Figure 2. Numerical self-propulsion test scheme by FreSCo+ and QCM.
Jmse 09 00492 g002
Figure 3. Side view of the geometry of parametric model for transom stern optimization.
Jmse 09 00492 g003
Figure 4. Comparison of computed pressure field in the portside demihull’s stern tunnel region; top, without propeller action at 23 knots; and bottom, with propeller action at 23 knots.
Jmse 09 00492 g004
Figure 5. Computed streamlines in the stern tunnels and passing the propellers discs.
Jmse 09 00492 g005
Figure 6. Stavanger demonstrator model at Froude number 0.69 (up) and close-up of its stern area (down) with fitted propellers, shafts, brackets and rudders.
Jmse 09 00492 g006
Figure 7. Computational domain of FreSCo+ and 5.7 M mesh used for the resistance and propulsion simulation.
Jmse 09 00492 g007
Figure 8. Generated mesh for the demihull with local refinements (cross sectional, lateral and bottom-up views).
Jmse 09 00492 g008
Figure 9. Comparison on calm water resistance (left) and delivered power (right) per displacement between model tests and full scale CFD for the Stavanger Demonstrator.
Jmse 09 00492 g009
Figure 10. Comparison of dynamic trim (left) and sinkage (right) between model tests and full scale CFD for the Stavanger Demonstrator.
Jmse 09 00492 g010
Figure 11. Propeller open-water efficiency test results.
Jmse 09 00492 g011
Figure 12. Full scale propulsive efficiencies as predicted from model tests (left) and CFD (right) for the Stavanger Demonstrator; (a) hull efficiency, (b) propeller rotative efficiency, (c) propeller open water efficiency, (d) total propulsive (hydrodynamic) efficiency
Jmse 09 00492 g012
Figure 13. Taylor wake fraction (left) and thrust deduction factors (right) from model tests and full scale CFD (two analysis methods) for the Stavanger Demonstrator.
Jmse 09 00492 g013
Figure 14. Isolines of computed pressure field in ship’s stern tunnel region for resistance (black isolines) and propulsion (red isolines) condition at 23 knots: view from bottom (up) and view from side (down).
Jmse 09 00492 g014
Figure 15. Computed nominal axial velocity contours and transversal velocity vectors at the (port side) propeller plane for ship speed at 23 knots (view from behind).
Jmse 09 00492 g015
Figure 16. Results of trim variation studies from model tests and CFD.
Jmse 09 00492 g016
Table 1. Local optimization variables.
CLZ_ATS0Z coordinate of the centerline at transom
CLZ_ATX1_7mZ coordinate of the centerline at tunnel
CHINEDZ_ATS0Z coordinate of the chine relative to centerline at transom
CHINEZ_AST2Z coordinate of the chine relative to Centerline at tunnel
CHINEY_ATS0Transom width definition
CHINEY_ATS2Tunnel width definition
D_PropellerPropeller diameter
X_Propeller
Z_Propeller
Beta_Propeller
X coordinate of the propeller position
Z coordinate of the propeller position
Propeller inclination angle
Table 2. Design constraints defined for the local optimization.
Propeller Tip Clearance Greater than 20% of Diameter of Propeller
Propeller Shaft Forward End Above the Hull
Propeller Shaft Entry Above the Hull
Greater than certain value to guarantee the propeller shaft, gearbox and electric motor installation
Propeller Shaft Inclination Less than 5°
Z_max_propPropeller submergence at smallest displacement
LWL at Largest DisplacementLess than certain value
Height of Shaft Bracket Lead Less than certain value to guarantee the propeller shaft installation
Height of Shaft Bracket TailLess than certain value to guarantee the propeller shaft installation
Longitudinal Position of Electric Motor Forward End Less than certain value to guarantee the space for electric motor installation
Table 3. Experimentally measured hull and propulsive efficiencies at trial condition BF 0 for the design and off-design displacements of the Stavanger demonstrator (full scale). V: speed in knots; Fn: Froude number; ηD: propulsive efficiency.
VFnηD at Δ1ηD at Δ2ηD at Δ3
[KTS][-][-][-][-]
13.000.390.7360.7420.733
15.000.450.7280.7310.723
17.000.510.7380.7390.731
19.000.570.7510.7530.748
21.000.630.7680.7690.767
23.000.690.7810.7840.783
25.000.750.7930.7950.793
27.000.810.8000.8020.798
Publisher’s Note: MDPI stays neutral with regard to jurisdictional claims in published maps and institutional affiliations.

