Article

Differential Physiological Responses of Small Thalassiosira pseudonana and Large Thalassiosira punctigera to the Shifted-High Light and Nitrogen

1
Key Laboratory of Tropical Marine Bio-resources and Ecology, South China Sea Institute of Oceanology, Chinese Academy of Sciences, No. 164, Xingangxi Road, Guangzhou 510301, China
2
Southern Marine Science and Engineering Guangdong Laboratory, Guangzhou 510301, China
3
University of Chinese Academy of Sciences, Beijing 100049, China
*
Author to whom correspondence should be addressed.
J. Mar. Sci. Eng. 2021, 9(5), 450; https://doi.org/10.3390/jmse9050450
Submission received: 5 March 2021 / Revised: 8 April 2021 / Accepted: 15 April 2021 / Published: 21 April 2021
(This article belongs to the Special Issue Marine Phytoplankton and Their Evolution)

Abstract

:
With global warming, the intensity and frequency of extreme episodic weather events such as typhoons are rising in tropical and subtropical regions, disturbing the water column and shifting phytoplankton therein from deep to surface layers, and exposing them to high light as well as nutrients. To explore how phytoplankton respond to such environmental changes, we tracked the growth, cell compositions and physiology of small Thalassiosira pseudonana and large Thalassiosira punctigera from simulated ambient to upward-shifted light and nitrogen (N) conditions. Shifting to high levels of light caused a limited effect on the growth of small T. pseudonana, but reduced that of large T. punctigera by 36%, with supplemental N alleviating the light-caused growth reduction. The upward-shifted light reduced the cellular pigments contents in small T. pseudonana, but not in large T. punctigera. The upward-shifted light reduced the photosynthetic capability (FV/FM) of both species, as well as the light utilization efficiency (α) and maximal relative electron transport rate (rETRmax), but it enhanced their dark reparations. Moreover, the upward-shifted light did not affect the superoxide dismutase (SOD) activity of small T. pseudonana, but it did enhance that of large T. punctigera. In addition, the supplemental N showed a limited effect on cellular pigments and the dark respiration of T. pseudonana, but it reduced that of T. punctigera. Our results showed that the growth responses of Thalassiosira to upward-shifted light and nitrogen vary with species and possibly with cell size, indicating that the field species composition might change after the occurrence of extreme weather events.

1. Introduction

Global warming has increased the intensity and frequency of the most extreme episodic weather events such as typhoons in tropical and subtropical regions [1,2]. These extreme weather events can not only damage human property and coastal infrastructures [3], but also trigger intense turbulence in the surface ocean [4,5], wherein phytoplankton cells dwell to obtain photosynthetically active light in order to energize photosynthesis [6,7]. The upward mixing will certainly bring phytoplankton up the water column, and expose them to a sudden shift to high light intensity [8]. Such upward-shifted light has been shown to cause the photoinactivation of photosystem II [9,10], bleach cellular pigments [11], reduce photosynthetic carbon fixation [4], and consequently decrease cell growth [12,13]. Apart from light intensity changes, the upward mixing also increases the nutrients, e.g., the nitrogen level in surface water, in particular in the areas where stratification is severe [4,5,6]. Data from remote sensing showed that increased surface chlorophyll concentrations often occur following the passage of typhoons in, e.g., the South China Sea [2,6,14], the East China Sea [15,16] and the northwest Pacific [1,2]. This phenomenon is usually explained by the upward transport of nutrients into the surface layer, which then activates the phytoplankton bloom [14,15,16], because the nutrients such as nitrogen (N) are a major component of cellular protein, DNA and RNA [17] and govern phytoplankton growth [13,18]. Understanding how phytoplankton respond to the synergistic changes in the upward-shifted light and nutrient is crucial for understanding the impacts of extreme weathers such as typhoons on marine ecosystems.
Diatoms account for approximately 20% of global primary productivity [19] and over 50% of the organic carbon exported into deep oceans [20], and are one of the most diverse phytoplankton groups [21,22], with the large diversity relating to the changes in cell size [23]. Cell size of diatoms varies from less than 2 μm to over 200 μm in equivalent spherical diameters, with over nine orders of magnitude in biovolume [24,25]. The cell size often affects the diatom’s physiological processes, including nutrients absorption and utilization efficiencies [13,26,27], photosynthetic capacity [28,29], growth response [30,31,32], and ability to adapt to the nutrients and light variables [33,34,35]. For example, small diatoms that have a high surface-to-volume ratio usually have faster growth rates and higher photosynthetic abilities than large ones, and usually dominate in oligotrophic waters [27,36], although some very large-celled diatoms like Ethmodiscus and Rhizosolenia also survive in the oligotrophic waters by undergoing a periodic vertical migration between surface waters, where they photosynthesize, and deeper waters, where they take up nutrients at the chemocline [37]. On the other hand, larger diatoms have heavier pigment packages, dropping their light-absorbing efficiency per unit of pigment–protein complex [28,33,38], outcompeting their smaller counterparts to endure variable lights, and thus dominating widely in coastal or estuarine areas [18,34]. Moreover, larger volumes, enabling them to reserve more nutrients inside [39], and lower metabolic expenditures, allowing them to endure or utilize fluctuating lights [28], also endow larger cells with more advantages over smaller ones. As a result, the synergistic changes in field lights and nutrients may differentially affect the physiologies of diatoms with different cell sizes [13], and influence their species compositions.
It is of general interest to clarify how the different-sized diatoms respond to the combined light and nutrient changes, considering the increasing frequency and intensity of extreme weather that can disrupt the water column stability. However, it is impossible, although of significance, to launch an in situ study, because of the great dangers involved. The diatoms genus Thalassiosira is widespread across the global oceans, in oligotrophic, mesotrophic and eutrophic areas [21]. Therefore, we cultured two representatively central diatom strains with over four orders of magnitude difference in cell biovolume, a small Thalassiosira pseudonana (~40 μm3) and a large Thalassiosira punctigera (~300,000 μm3), in laboratory, under low light intensity (LL) and low nitrogen (LN) to mimic the growth conditions close to the maximum chlorophyll layer in the field, with high nitrogen (HN) conditions as the control. We then shifted them to high light (or plus N) to mimic cells being stirred up and exposed to high light (or N) in the surface layer, and tracked their growth, cell compositions, photosynthetic capacity and antioxidant capability. In this paper, we aimed to explore the underlying mechanisms linking growth with cell size, upward-shifted light, and nutrient levels. This study provides new insights into how differently cell-sized phytoplankton respond to the abrupt light and nutrient changes caused by extreme weather such as typhoons.

2. Material and Methods

2.1. Culture Protocol

In this study, two species of temperate marine-centric diatoms, a smaller Thalassiosira pseudonana (CCMP 1335, ~40 μm3) and a larger T. punctigera (CCAP 1085/19, ~300,000 μm3), initially obtained from the Procasoli-Guilard National Center of Marine Phytoplankton, were semi-continuously cultured in sterilized f/2-enriched natural seawater or f/2-enriched seawater with only N being diminished to one-tenth [40], at 18 °C in 175 mL transparent flasks. The seawater for media preparation was collected from the surface near the Zhongsha Islands (114°53.23′ E, 16°11.55′ N) of the South China Sea, with measured combined nitrogen of less than 1.0 μM. During the cultivations, all flasks were randomly distributed in a growth chamber and manually shaken 2 to 3 times per day. Light in the chamber was provided by a panel of fluorescence tubes (Sylvania 17W T8 4100K) that were automatically turned on at 7:00 a.m. and turned off at 7:00 p.m. to maintain a 12:12 h light:dark cycle, and the light intensity was measured with a microspherical quantum sensor (ULM-500, Walz, Effeltrich, Germany) in a bottle filled with seawater.

2.2. Experiment Design

We initially cultured both T. pseudonana and T. punctigera at low light (LL, ~35 μmol photons m−2 s−1, close to light intensity of the bottom of the euphotic zone) and under high nitrogen (HN, ~882 μM, f/2 medium) and low nitrogen conditions (LN, ~88.2 μM, f/2 medium with N diminished) for at least 8 days to acclimatize the cells to the growth conditions (Figure 1). After approximately 6 generation’s growth, we shifted the low light-acclimated cells to high light (HL, ~250 μmol photons m−2 s−1) or HL+HN (for LN growth cultures) to mimic the turbulence-caused changes that phytoplankton experience in field condition, and semi-continuously cultured them for another 5–7 days. The light intensity within the upper 10% of the euphotic zone can reach 250 μmol photons m−2 s−1 in the South China Sea [29]. We grew 3 replicates of each species in each combination of light and nitrogen levels, for a total of 30 independent cultures. During the cultivations, we tracked the growth status of cells with an indicator of the maximal quantum yield (FV/FM) of photosystem II (PSII), which showed that the cultured duration length is enough for cells to acclimate to pre- and post-growth conditions (Figure 1). At the end of the cultivations, we took samples to determine cellular biochemical compositions, chlorophyll fluorescence, dark respiration, and superoxide dismutase (SOD) activity, as follows.

2.3. Growth Rate

During the cultivations, we tracked the growth of the small T. pseudonana by measuring the chlorophyll fluorescence of the cultures with a fluorometer (Trilogy, Turner design, San Jose, CA, USA), with excitation and emission wavelengths of 450 nm and 680 nm, at every 9:00 a.m. (2 h after light on), before and after dilutions with fresh medium. The fluorescence level was maintained at 493.94 ± 195.29 throughout the cultivation period, with a cell density of (6.00 ± 3.15) × 10−5 cells mL−1 and a chlorophyll a content of 1.23 ± 0.4 μg mL−1.
To track the growth of the larger T. punctigera, we took duplicate 2 mL aliquots every morning before and after dilutions with fresh medium, fixed them with Lugol’s solution to a final concentration of 1.5%, and counted the cells in a Sedgwick Rafter chamber under an inverted microscope (CKX41, Olympus, Tokyo, Japan). Cell density was maintained at 1385 ± 659 cell mL−1, with similar Chl a content as in the T. pseudonana cultures.
We estimated the specific growth rate (µ, d−1) as:
µ = [ln(Nt) − ln(N0)]/(t − t0)
where Nt and N0 indicate fluorescence or cell numbers at times t and t0, respectively. We performed at least 9 transfers of semi-continuous dilution with fresh media for each independent culture. During the cultivations, we found that the growth status seems to be steady during the last 3–4 cycles of dilution; therefore, we averaged them as a final µ. In addition, we found no significant change in the cell volume of either species grown under different light or nutrient conditions.

2.4. Pigment Content

At the end of cultivation, we vacuum-filtered 50 mL cultures onto a Whatman GF/F glass fiber filter (25 mm in diameter), instantly froze the filters, and stored them at −20 °C for later extraction and analyses. The filter with cells was extracted in 4.5 mL methanol for 4 h in darkness at room temperature. After centrifuging at 5000× g for 10 min, we measured the absorbance of supernatant at 750 nm, 665 nm, 652 nm and 470 nm using a UV–VIS photospectrometer (Shimadzu model UV 2501-PC, Kyoto, Japan). We calculated the chlorophyll a (Chl a) and carotenoids (Car) contents (μg mL−1) as [41]:
[Chl a] = 16.29 × (A665 − A750) − 8.54 × (A652 − A750)
[Car] = [1000 × (A470 − A750) − 2.05 × Chl a]/245
In addition, we took duplicate 5 mL aliquots of each species in each light or nutrient treatment and fixed them with Lugol’s solution; then, we measured small T. pseudonana cell density with a Counterstar BioMarine counter (IA1000, Counter star, Shezhen, China) and large T. punctigera cell density with an inverted microscope.

2.5. Chrolophyll Fluorescence

At each time-point of cultivation, we took 2 mL aliquots from each flask, and dark-acclimated them for 5 min. After this, we measured the maximal chlorophyll fluorescence (FM) of the dark-adapted cells under saturating blue light pulse (3000 μmol photons m−2 s−1, 1 s) and minimal fluorescence (FO) in the presence of a weak modulated measuring light, with a fluorometer (AquaPen-C AP-C 100, Photon Systems Instruments, Prague, Czech Republic). We calculated the maximum photochemical quantum yield (FV/FM) of photosystem II (PSII) [42] as:
F V F M = F M F O F M
At the same time, we measured the relative electron transport rate (rETR) after 60 s exposure to each actinic light of 0, 10, 20, 50, 100, 300 and 500 μmol photon m−2 s−1 to obtain a rapid light curve (RLC). The rETR was estimated [43] as:
rETR = F M F t F M × 0.5 × P A R
where F′M and Ft represent maximal and instantaneous fluorescence under each of the 7 actinic lights (PAR, μmol photons m−2 s1).
We calculated the RLC-derived photosynthetic parameters, light utilization efficiency (α, initial slope), maximal rETR (rETRmax) and saturating irradiance (EK, μmol photons m−2 s−1) [44] as:
rETR = P A R a × P A R 2 + b × P A R + c
α = 1 c ,   rETR max   = 1 b + 2 × a × c   , E K = c b + 2 × a × c
where a, b and c are adjusted parameters.

2.6. Dark Respiration

At the end of the cultivations, we took 5 mL aliquots of each species from each light or nutrient treatment, and dispensed them into a 15 mL volume chamber that was equipped with an oxygen sensor and temperature sensor (OXR230, PyroScience, Aachen, Germany), and was encircled by a water jacket connected to a circulating thermostatted bath (MaXircuTM CR-8, DaiHan Scientific Co., Incheon, South Korea) to maintain temperature at the growth condition. After 5 min incubation in the dark, when the temperature in the chamber was stable, we recorded the decline in oxygen concentration with incubated time and calculated the dark respiration rate (fmol O2 µm−3 min−1) by dividing the decline rate by {cells ml−1 × biovolume cell−1} [45].

2.7. Carbon and Nitrogen Contents

To measure the carbon (C) and nitrogen (N) in the cells, we vacuum-filtered a 50–100 mL culture of each species from each light or nutrient treatment onto a pre-combusted (460 °C, 5 h) GF/F glass fiber filter (Whatman, 25 mm), washed the filter with 10 mL 50 mM HCl to remove inorganic carbon, dried them in an oven at 60 °C overnight, and stored them in a desiccator for later analyses. We then measured the cellular C and N contents with a Vario EL III elemental analyzer (Elementar, Hanau, Germany). In addition, we filtrated in parallel an aliquot volume of medium through a pre-combusted GF/F filter as a blank, measured the blank filters, and subtracted the blanks from the culture’s C and N measurements.

2.8. Protein Content and Superoxide Dismutase Activity

At the end of cultivation, we took 100 mL aliquots and vacuum-filtered them onto a GF/F glass fiber filter. We then put the filter into a 2.0 mL pre-cooling buffer (pH 8.0) that contains 20 mM Tris, 1 mM EDTA, 10 mM MgCl2, 50 mM NaHCO3 and 5 mM β-mercaptoethanol, and the cells were broken through oscillating with grinding beads for 20 min at 4 °C using a vortex mixer (G560E, Scientific Industries, Bohemia, NY, USA). After 10 min centrifugation at 10,000× g, we quantified the total proteins in the supernatant with a bicinchoninic acid (BCA) method [46] using a protein assay kit (A045-3, Nanjing Jiancheng Biological Engineering Co., Nanjing, China) [45,47]. Simultaneously, we spectrophotometrically measured the superoxide dismutase (SOD) activity at 450 nm with a xanthine oxidase method following the protocol of an assay kit (A001-3, Nanjing Jiancheng Biological Engineering Co., Nanjing, China) [48].

2.9. Data Analysis

We present the data with mean and standard deviations (mean ± sd), and we used one-way ANOVA with Bonferroni post-tests (Prism 5, Graphpad Software, San Diego, CA, USA) at a confidence level of 0.05 for the statistical tests.

3. Results

Under a low light of 35 µmol photons m−2 s−1, the growth rates (µ) of small T. pseudonana and large T. punctigera were 0.25 ± 0.01 d−1 and 0.33 ± 0.01 d−1, respectively, under N-limitation, and the repleted N enhanced the µ by 100% and 18%, respectively (Figure 2). In T. pseudonana, shifting to the high growth light of 250 µmol photons m−2 s−1 had no significant effect on the growth under N-limitation, even when N was supplemented again (p > 0.05), but the µ was reduced by 12% under N-replete condition (Figure 2A). In T. punctigera, however, this upward-shifted light reduced the growth by 36% under N-limitation, but insignificantly affected µ under the N-replete condition (p > 0.05), whereas under such a high light, the µ was enhanced by 81% when N was supplemented (Figure 2B).
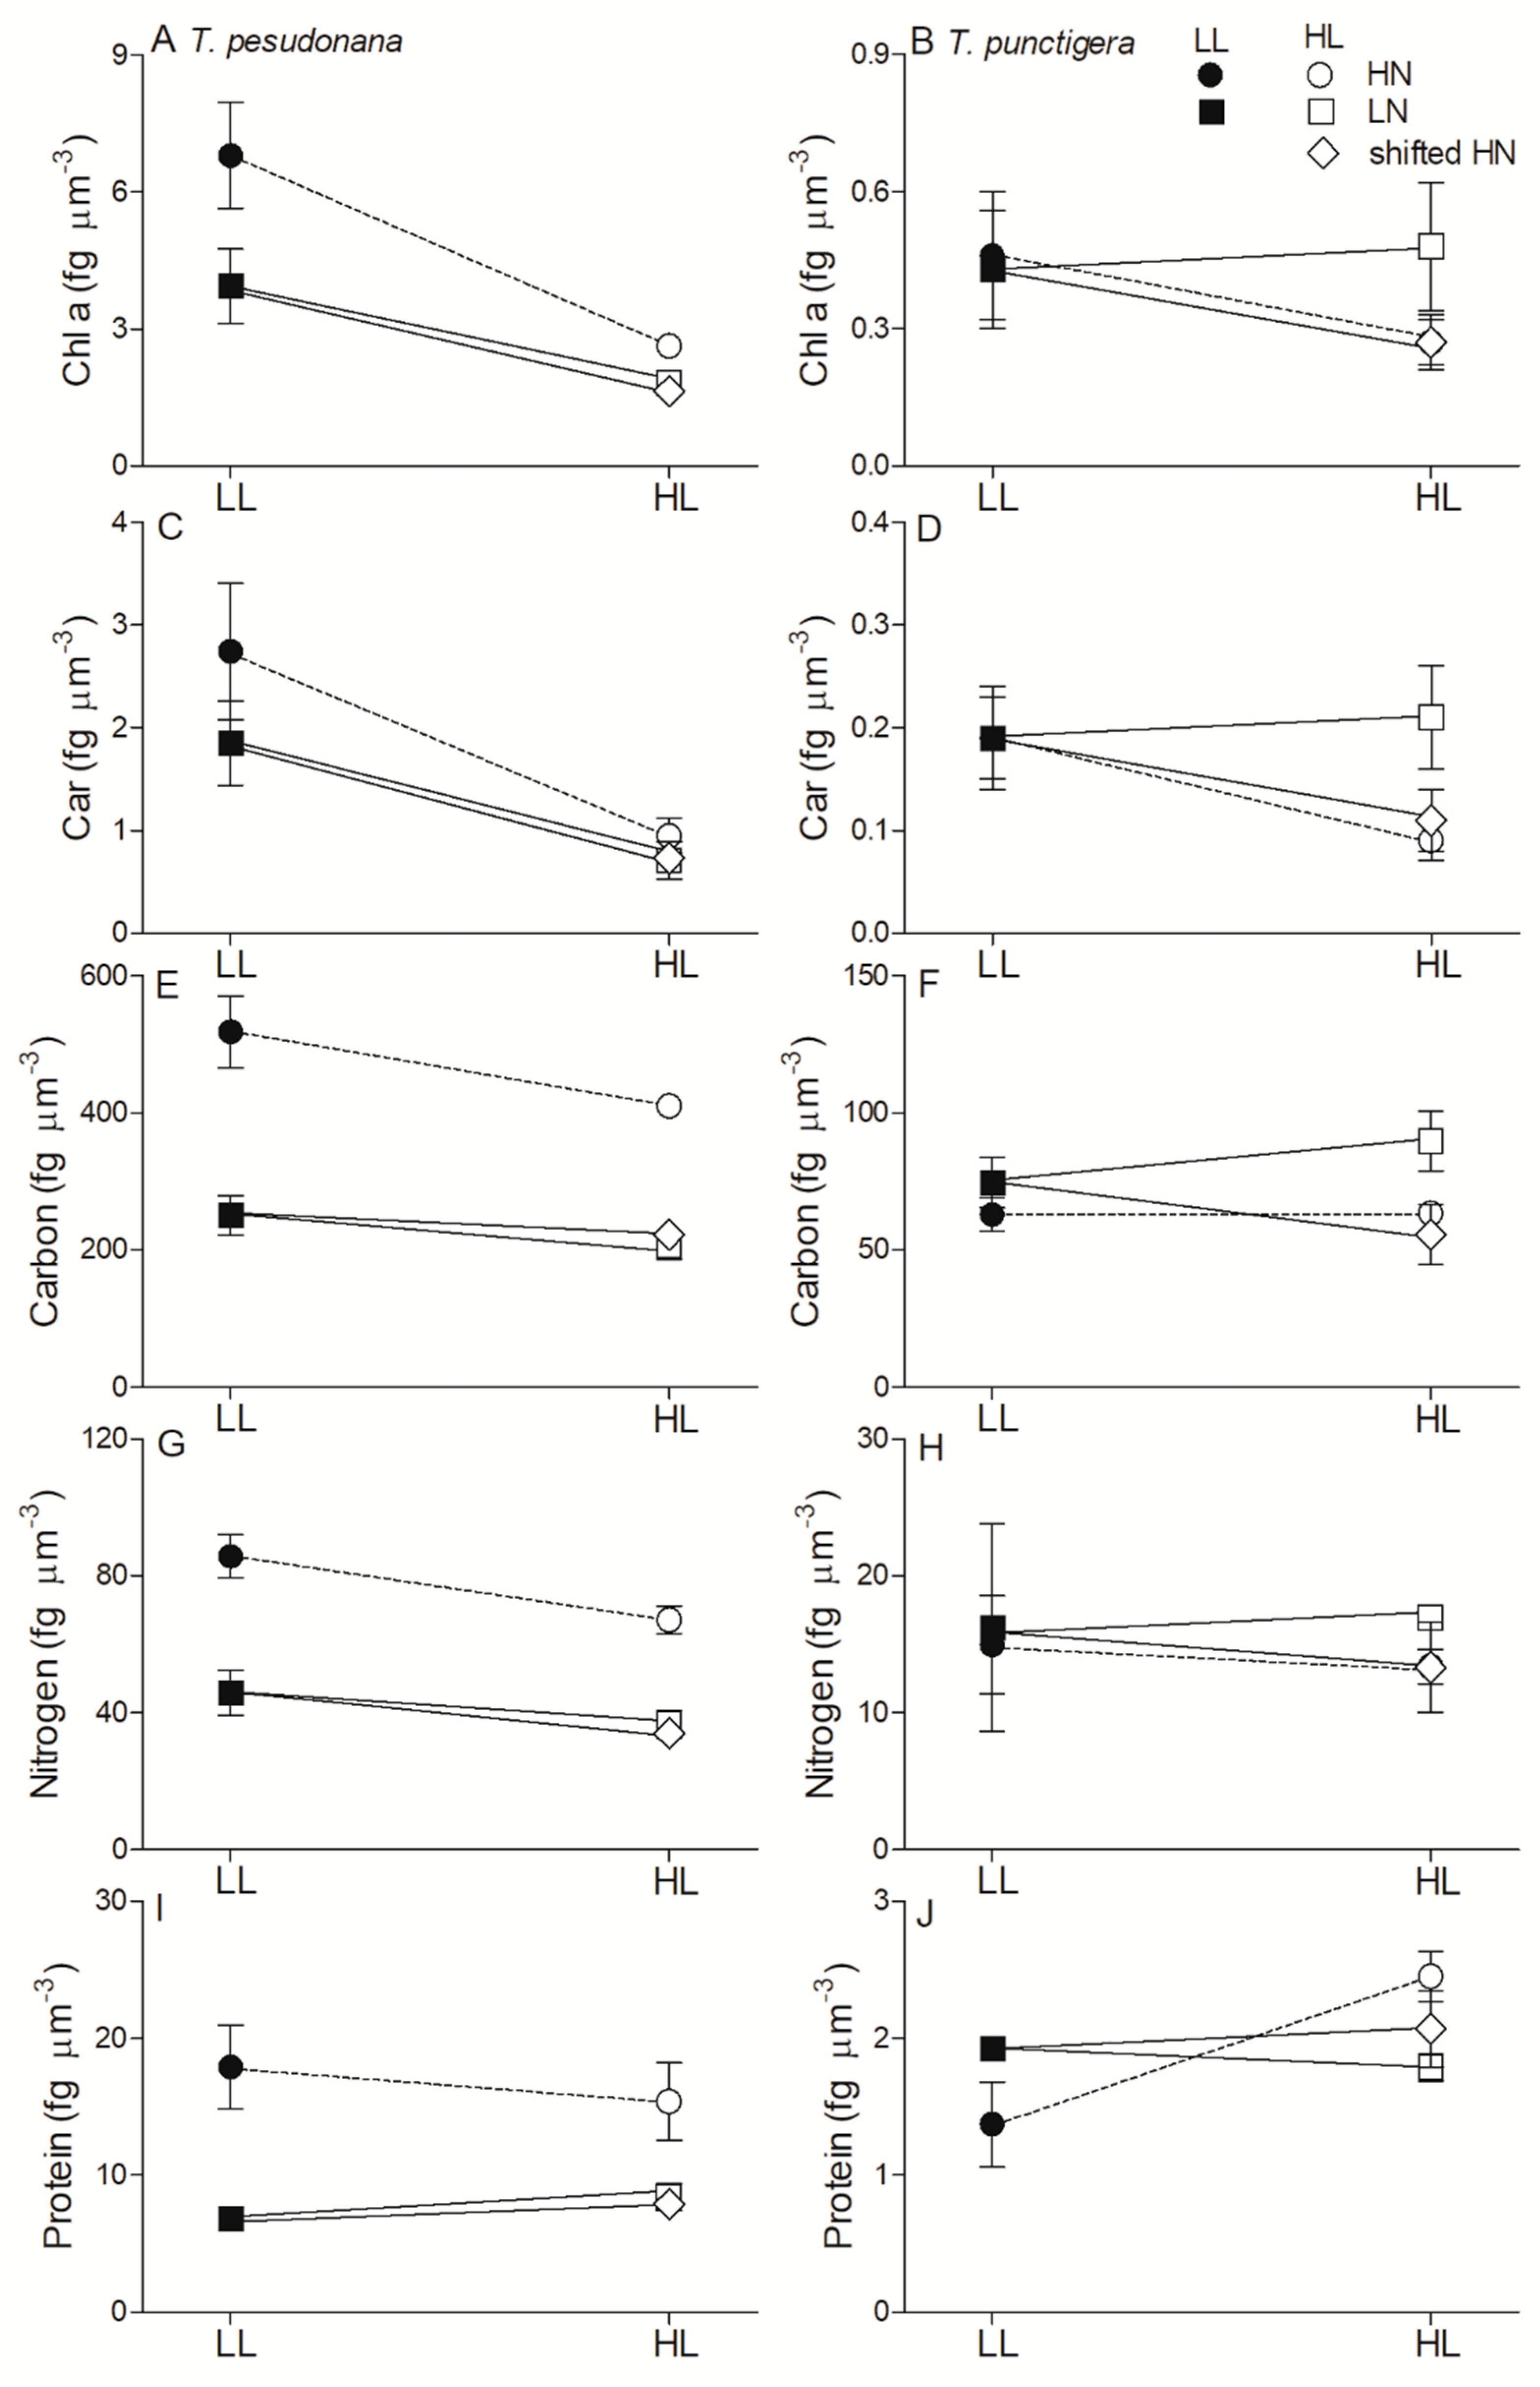
To understand the mechanisms underlying these contrasting growth responses to the upward-shifted light and N levels, we measured the cellular compositions and photosynthetic performance. In T. pseudonana, the cell volume-based contents of Chl a, carotenoids (Car), carbon (C), nitrogen (N) and total proteins under low growth light conditions were 3.93 ± 0.81, 1.85 ± 0.41, 251 ± 28.7, 45.8 ± 6.72 and 6.84 ± 0.07 fg µm−3 under N-limitation, and these were enhanced by 73%, 48%, 106%, 87% and 161% under N-replete conditions, respectively (Figure 3A,C,E,G,I). Shifting to high light reduced Chl a by 54% under N-limitation and by 61% under N-replete conditions, and reduced Car by 62% and 65%, respectively. Such upward-shifted light had no significant effect on C and N contents under N-limited conditions (p > 0.05) or on proteins content under both N-limited and N-replete conditions (p > 0.05), but reduced C and N by 21% and 22% under the N-replete conditions, respectively. In T. punctigera, the pigments, N and proteins contents per unit volume were about one-tenth of those in T. pseudonana, and the C and protein contents were about one-fourth (Figure 3). Supplemental N had limited effects on cellular pigments and CN contents in T. punctigera (Figure 3B,D,F,H), but reduced proteins by 29% (Figure 3J). Unexpectedly, the N compensation reduced the Chl a, Car, C and N contents of T. punctigera by 44%, 52%, 38% and 21%, respectively, but increased proteins by 16% under upward-shifted light conditions.
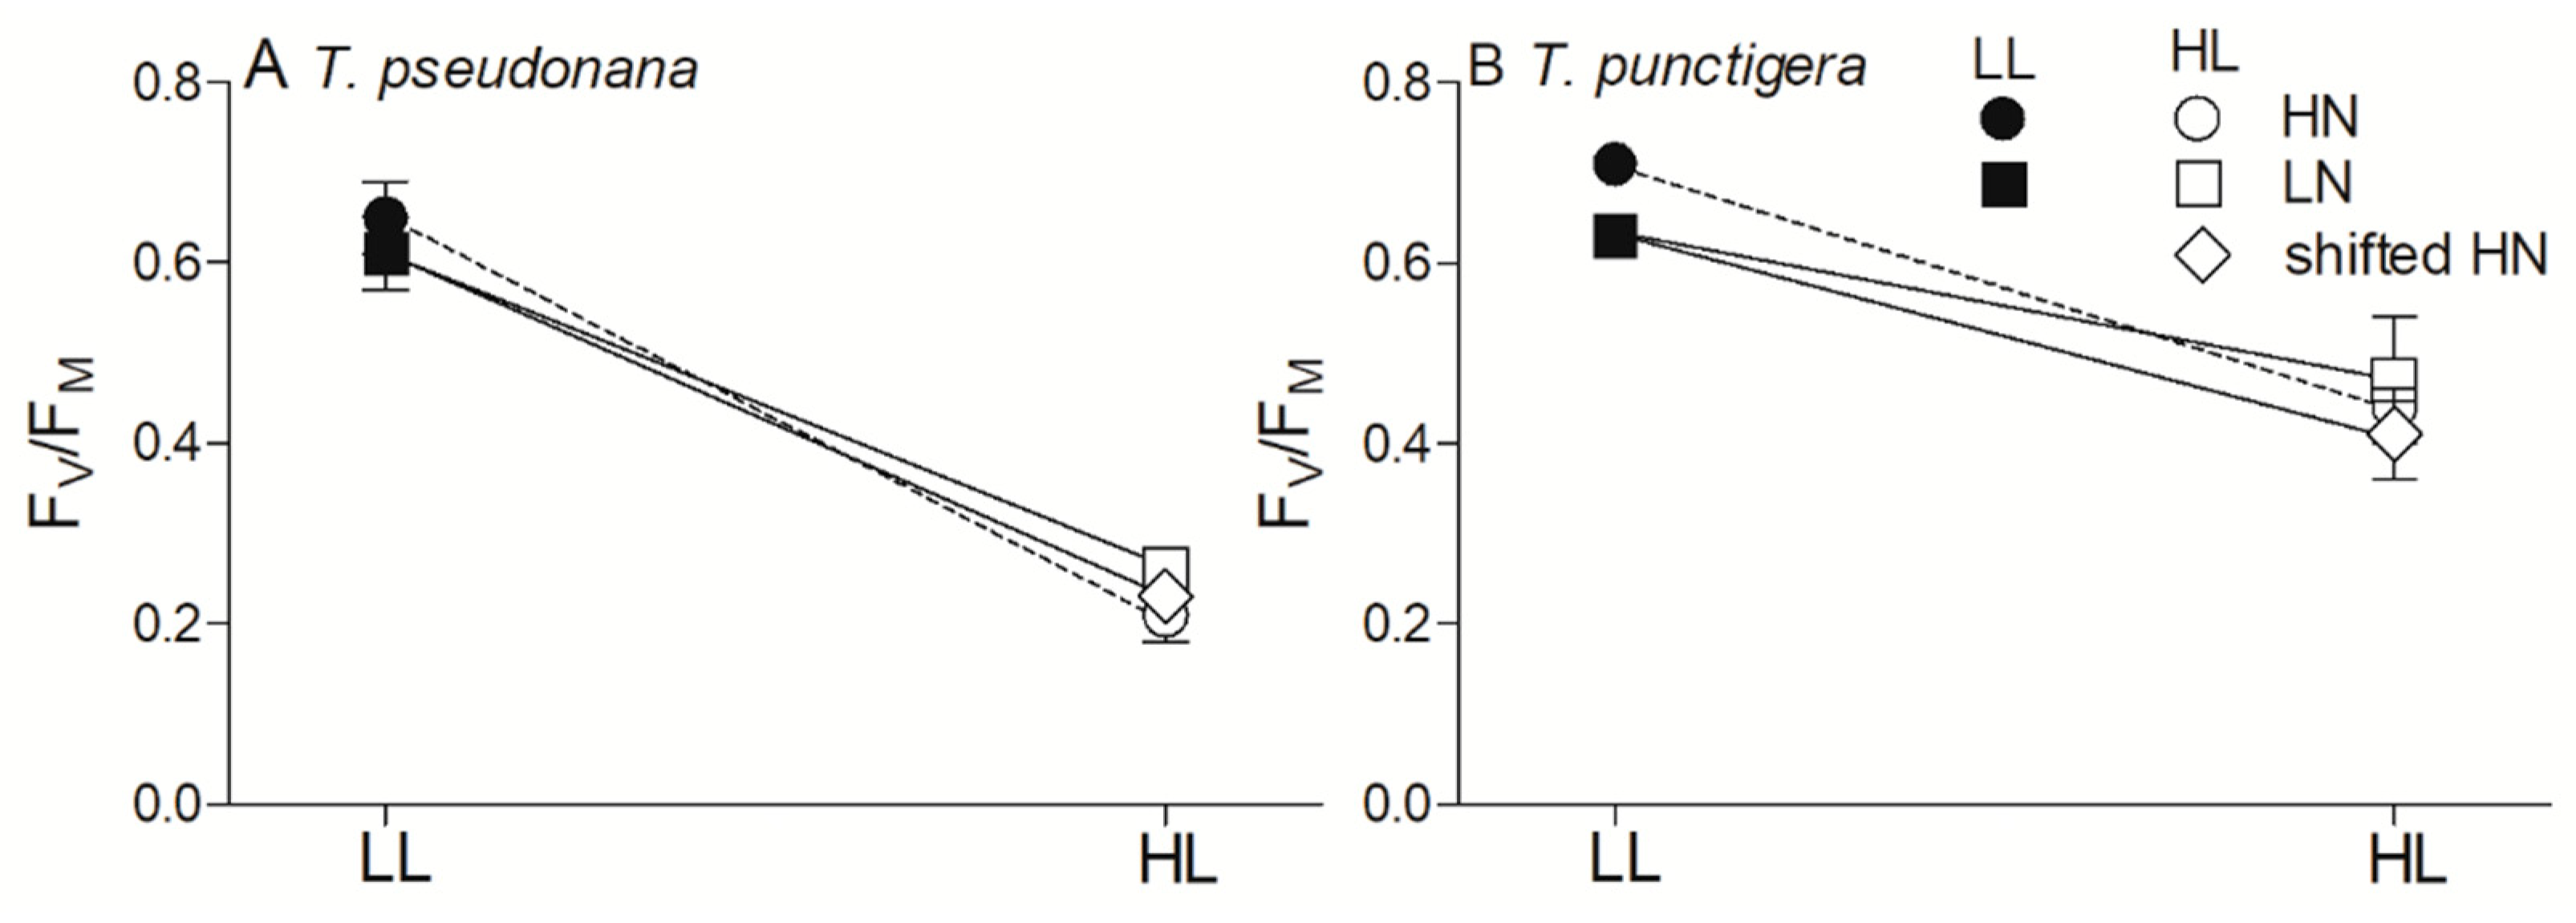
To estimate the potential photosynthetic capacity, we obtained the maximal PSII photochemical quantum yield (FV/FM) (Figure 4), as well as the parameters (i.e., α, EK and rETRmax) derived from rapid light curves (Table 1). In T. pseudonana, the FV/FM under low growth light was 0.61 ± 0.04 under N-limitation, with an insignificant effect of extra N addition (p > 0.05), and the upward-shifted light reduced the FV/FM by 60% under both N-limited and N-repleted conditions (Figure 4A). In T. punctigera, the FV/FM under low light was 0.63 ± 0.02 under N-limitation, which was enhanced by 11% under N-replete conditions, and the upward-shifted light reduced the FV/FM by 25% and 38% under N-limitation and N-repletion, respectively (Figure 4A). The N compensation had a limited effect on the FV/FM of both T. pseudonana and T. punctigera (p > 0.05). Moreover, N-limitation drastically reduced the light-utilization efficiency (α) and maximal rETR (rETRmax) of both species (p < 0.05), but insignificantly affected the saturation irradiance (EK) (p > 0.05) (Table 1). The upward-shifted light significantly decreased the α of both species in all N treatments, as well as the EK or rETRmax under N-repletion (p < 0.05); however, such a light shift had a limited effect on the rETRmax under N-limitation (p > 0.05). Finally, N compensation reduced all the photosynthetic parameters (i.e., α, EK and rETRmax) of both species, except for the α of T. punctigera.
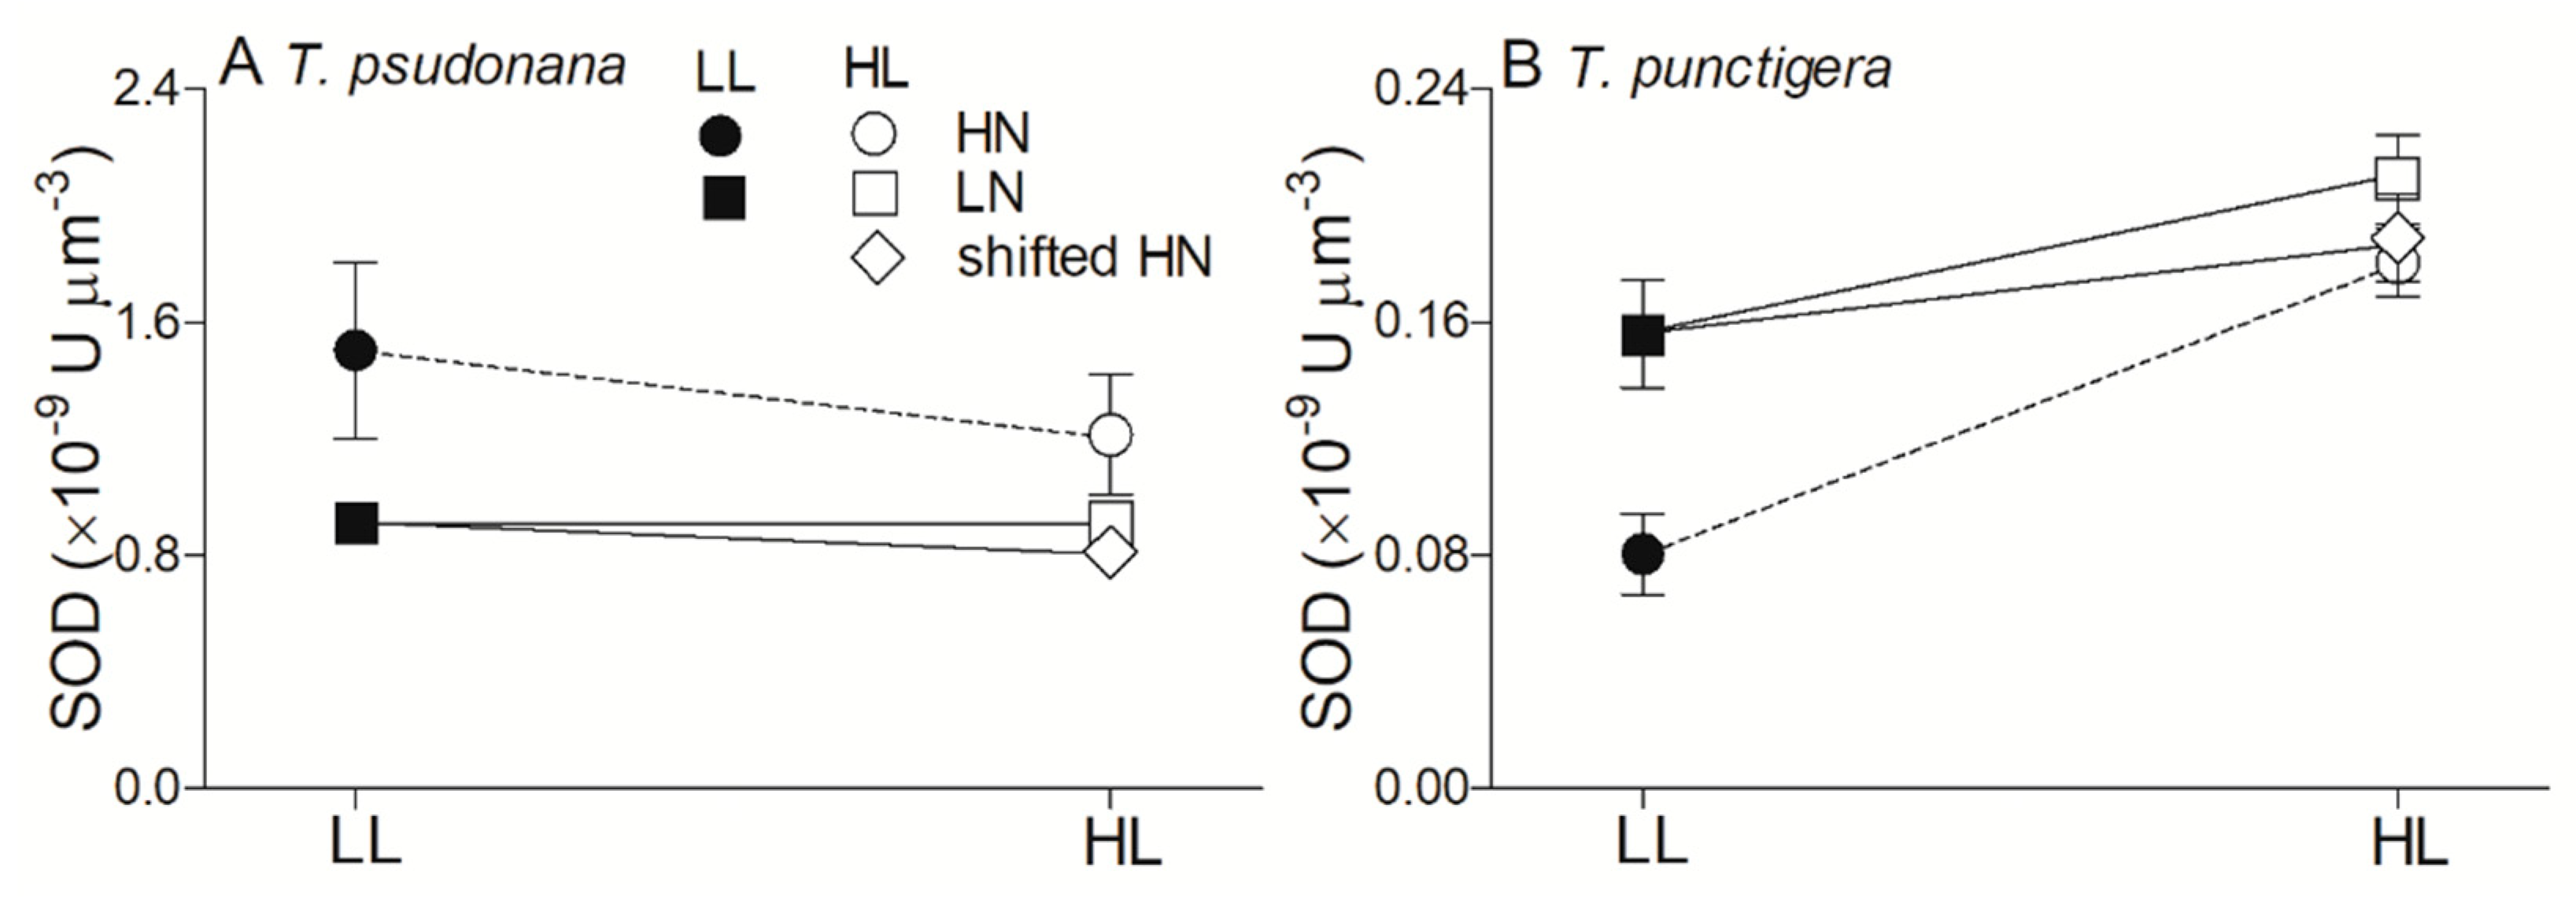
Under N-limitation, the biovolume-based dark respiration rates (Rd) of T. pseudonana and T. punctigera under low light were (4.06 ± 0.45) × 10−3 and (0.24 ± 0.06) × 10−3 fmol O2 µm−3 min−1, respectively (Figure 5). The Rd of T. pseudonana was enhanced by 221% under N-replete conditions, whereas that of T. punctigera was unchanged (p > 0.05). The upward-shifted light significantly increased the Rd of both species under N-limitation (p < 0.05), but not under N-repletion (p > 0.05). Moreover, under N-limitation, the superoxide dismutase (SOD) activities of T. pseudonana and T. punctigera under low light were (0.91 ± 0.03) × 10−9 and (0.15 ± 0.02) × 10−9 U µm−3, respectively, which were respectively enhanced by 39% and reduced by 48% under N-repletion (Figure 6). The upward-shifted light insignificantly affected the SOD activity in T. pseudonana (p > 0.05), but enhanced it by 34% in T. punctigera under N-limited conditions; under N-repletion, the upward-shifted light had a limited effect on the SOD activity of both T. pseudonana and T. punctigera (p > 0.05).

4. Discussion

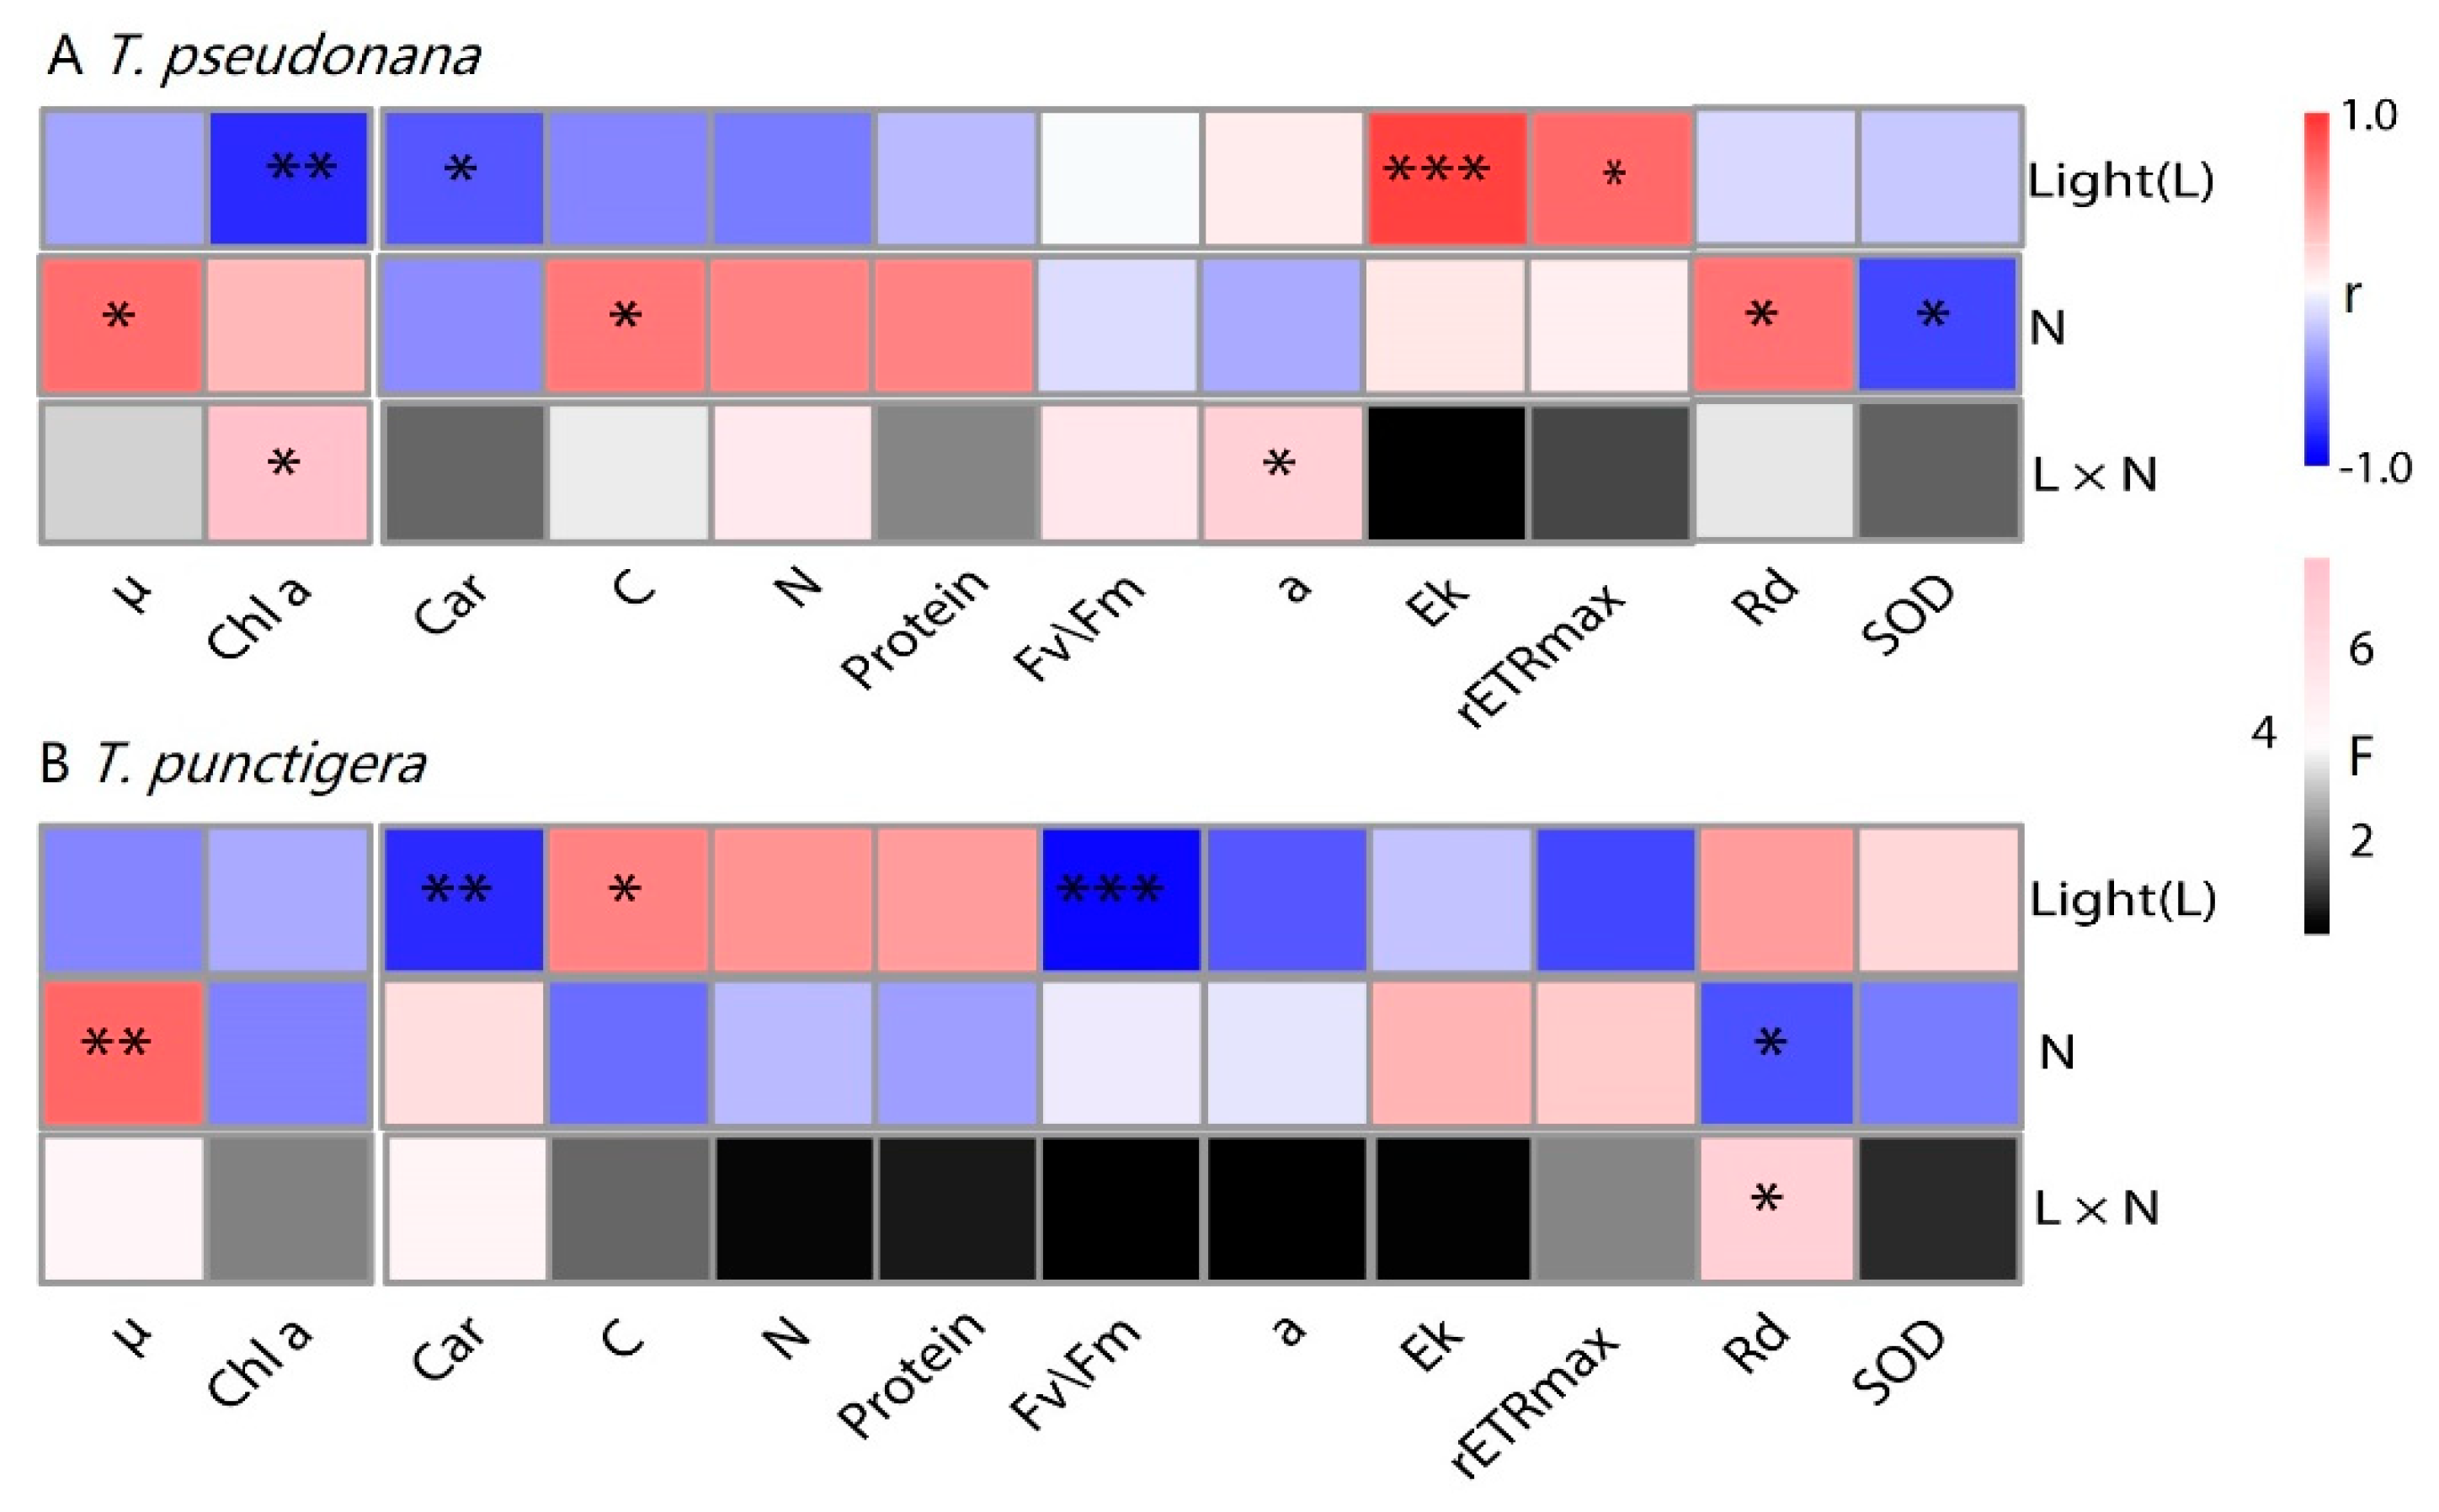
In the field, differently cell-sized phytoplankton assemblies usually have differential responses to environmental variables, including nutrients [18,34], light [4,29], and their interactions [49]. Here, we showed that the upward-shifted light insignificantly affected the growth of the small T. pseudonana, but reduced that of the large T. punctigera, resulting from the differential effects upon the cellular compositions, photosynthesis, and antioxidant abilities (Figure 7). Supplemental N alleviated the significantly light-caused reduction in the growth of T. punctigera by lowering the respiratory and antioxidant defense consumptions. Our results also indicated that the growth responses of Thalassiosira species to the upward-shifted light and nitrogen vary with species, and possibly with cell size.
Generally, light and nutrient levels govern phytoplankton growth and shape their distributions within the water column, resulting in the maximal cell density present at a certain depth of e.g., 40 to 80 m in the South China Sea [50]. In this layer, however, nutrients including N are not always sufficient for phytoplankton growth, as indicated by the growth stimulation after typhoon-induced nutrient replenishment [6,16]. Here, we thus cultured the Thalassiosira species at a lower N status to mimic the field condition, and shifted the cultures to high N to mimic the upward transport of nutrients into the surface layer (Figure 1). Moreover, variations in nutrient and light often influence phytoplankton cell size by interrupting the balance between cell division and the accumulation of organic matters [27]. In this study, we did not detect statistical cell-size changes in all light and N treatments among these two Thalassiosira species; therefore, we normalized their interspecific biochemical and physiological parameters to cell biovolume to make the data more comparable.
The upward-shifted light insignificantly affected the growth of the small T. pseudonana, but reduced that of the large T. punctigera (Figure 2). As previously mentioned, the smaller cells have higher surface to volume ratios [26,27]; they can thus be predicted to acclimate more quickly to environmental changes by adjusting their physiological traits, as compared to larger ones [25,32,40]. As indicated by Li and Campbell [13], the smaller T. pseudonana demonstrate a larger effective cross-section of photochemistry than their larger T. punctigera counterpart, which endows them with more efficient light-absorbing or -utilizing capabilities. Accordingly, the smaller cells are more susceptible to high light levels, and can be more easily photoinhibited by harvesting more damaging photons, as found in this study (Figure 4 and Table 1) or in others [9,10,35]. However, under the high light conditions in this study, no photoinhibition of the growth of smaller T. pseudonana cells was detected (Figure 2). This can be explained by the fact that the smaller cells sacrificed their growth to balance photoprotection by metabolically repairing, for example, the photoinactivated PS II [10,28], as indicated by an increase in the respiration rate (Figure 5A). At the same time, the greater decrease in the pigment contents of the smaller species when exposed to high light conditions as compared to the larger species (Figure 3A–D) confirms the potential of smaller cells to acclimatize faster to environmental changes [25,33]. The cellular pigment contents and components usually decreased under stressful light [13,35,47], to lessen the risk of the surplus energy derived by the light-harvesting system. This surplus energy often generates more reactive oxygen species (ROS) that can inhibit the synthesis of PSII core protein D1, thereby lowering the repair cycle of PSII [51], thus reducing photosynthetic capacity (Figure 4 and Table 1). To scavenge ROS, phytoplankton cells usually improve their antioxidant defense ability to survive under light stress [10,45,47,52,53], through promoting, e.g., the activity of superoxidase dismutase (SOD) (Figure 6B) and the efficiency of the anti-resistance energized by increasing respiration (Figure 5B). On the contrary, the SOD activity in smaller T. pseudonana showed no change, and even decreased when exposed to high light (Figure 6A), although the gene expression was reported to be up-regulated [53]. If the PS II suffer enormous damage under supersaturated light conditions (Figure 4A), then the cells have to allocate most of the energy derived from, e.g., increasing respiration (Figure 5A) to sustain their basic growth, and not to synthesize proteins (Figure 3I), including antioxidant enzymes [54]. In addition, under high light, the smaller T. pseudonana might dissipate excess energy through non-photochemical quenching (NPQ) [9,10], enabling them to survive under stressful light conditions.
Supplemental N alleviated the light-caused reduction in the growth of the large T. punctigera under the upward-shifted light, whereas this trend did not occur in the small T. pseudonana (Figure 2). It is understandable that larger cells have lower nutrient-absorbing and -utilization efficiencies than smaller ones [26,30], and thus the effect of N-limitation on the growth of the large T. punctigera appeared to be more severe than that on the small T. pseudonana when the light was sufficient (Figure 2). Consistently, the supplemental N varied the cellular components of larger T. punctigera more significantly than those of smaller T. pseudonana (Figure 3), as well as the respiration (Figure 4) and SOD activity (Figure 6). Li and Campbell [13] also showed that the larger T. punctigera is less effective in exploiting high nitrogen to sustain its growth than the smaller T. pseudonana. Moreover, we did not predict that supplemental N would have no alleviating effect on the high light-caused growth reduction in smaller T. pseudonana (Figure 2). Perhaps the culture time was still not long enough for the smaller T. pseudonana to adapt completely to such a harsh light shift, although the photosynthetic capacity was already steady (Figure S1). Yi et al. [34] also recognized that the small cell-dominated phytoplankton assemblages respond much slower to nutrient addition than large cell-dominated phytoplankton assemblages.

5. Conclusions

We found the synergistic light and nitrogen upward-shifts differentially alter the growth and physiologies of the differently cell-sized Thalassiosira species. Shifting to high light insignificantly affected the growth of the smaller T. pseudonana, but reduced that of the larger T. punctigera, and the upward-shifted light reduced the cellular pigments in the smaller cells, but not in the larger ones. Moreover, the upward-shifted light did not affect the SOD activity of the smaller T. pseudonana, but it enhanced that of the larger T. punctigera. Supplemental N alleviated the light-caused reduction in growth of the larger T. punctigera, but not of the smaller T. pseudonana, by lowering cellular pigments and respiration. Our results complement those of others (e.g., [13]) in showing that the environmental disturbance caused by extreme weather conditions, such as typhoons, might alter the species composition of phytoplankton in the field, because different taxa show differential growth responses to drastic light and nitrogen changes when cells are rapidly moved into new light regimes and nutrient conditions.

Supplementary Materials

The following are available online at https://www.mdpi.com/article/10.3390/jmse9050450/s1, Figure S1: Maximum photochemical quantum yield (FV/FM) of Photosystem II (PSII) of culture grown during low light (35 µmol photons m−1 s−1) and after an upward light shift (250 µmol photons m−1 s−1). Points show averages of the FV/FM of three independently grown cultures, and error bars show the standard deviations (n = 3).

Author Contributions

Z.Q., G.M. and G.L. contributed to performing the experiment. Z.Q., X.X. and G.L. contributed to the experimental designs and data analysis. Z.Q., G.L. and Y.T. contributed to the paper writing. All authors have read and agreed to the published version of the manuscript.

Funding

This study was funded by National Key Research and Development Program of China (grant number 2019YFA0606704), Key Special Project for Introduced Talents Team of Southern Marine Science and Engineering Guangdong Laboratory (Guangzhou) (grant number GML2019ZD0407), National Natural Science Foundation (grant numbers 41890853, 41676156), Special Foundation for National Science and Technology Basic Research Program of China (grant number 2018FY100104), Natural Science Foundation of Guangdong Province (grant number 2019B121202001).

Institutional Review Board Statement

Not applicable.

Informed Consent Statement

Not applicable.

Data Availability Statement

The data that support the findings of this study are available from the corresponding author upon reasonable request.

Acknowledgments

We thanked Zhixin Ke and Yongli Gao for experimental assistance.

Conflicts of Interest

There is no conflict of interest.

References

  1. Ho, C.-H.; Baik, J.-J.; Kim, J.-H.; Gong, D.-Y.; Sui, C.-H. Interdecadal changes in summertime typhoon tracks. J. Clim. Chang. 2004, 17, 1767–1776. [Google Scholar] [CrossRef]
  2. Pan, J.; Huang, L.; Devlin, A.T.; Lin, H. Quantification of typhoon-induced phytoplankton blooms using satellite multi-sensor data. Remote Sens. 2018, 10, 318. [Google Scholar] [CrossRef] [Green Version]
  3. Mas, E.; Bricker, J.; Kure, K.; Adriano, B.; Yi, C.; Suppasri, A.; Koshimura, S. Field survey report and satellite image interpretation of the 2013 Super Typhoon Haiyan in the Philippines. Nat. Hazards Earth Syst. Sci. 2015, 15, 805–816. [Google Scholar] [CrossRef] [Green Version]
  4. Li, G.; Wu, Y.; Gao, K. Effects of typhoon Kaemi on coastal phytoplankton assemblages in the South China Sea, with special reference to the effects of solar UV radiation. J. Geophys. Res. 2009, 114, G04029. [Google Scholar] [CrossRef] [Green Version]
  5. Qiu, D.; Zhong, Y.; Chen, Y.; Tan, Y.; Song, X.; Huang, L. Short-term phytoplankton dynamics during typhoon season in and near the Pearl River estuary, South China Sea. J. Geophys. Res. 2019, 124, 274–292. [Google Scholar] [CrossRef]
  6. Lin, I.I.; Liu, W.T.; Wu, C.C.; Wong, G.T.F.; Hu, C.; Chen, Z.; Liang, W.D.; Yang, Y.; Liu, K.K. New evidence for enhanced ocean primary production triggered by tropical cyclone. Geophys. Res. Lett. 2003, 30, 1718. [Google Scholar] [CrossRef] [Green Version]
  7. Serra, T.; Vidal, J.; Casamitjana, X.; Soler, M.; Colomer, J. The role of surface vertical mixing in phytoplankton distribution in a stratified reservoir. Limnol. Oceanogr. 2007, 52, 620–634. [Google Scholar] [CrossRef] [Green Version]
  8. Lee, J.H.; Moon, J.H.; Kim, T. Typhoon-triggered phytoplankton bloom and associated upper-ocean conditions in the northwestern Pacific: Evidence from satellite remote sensing, Argo profile, and an ocean circulation model. J. Mar. Sci. Eng. 2020, 8, 788. [Google Scholar] [CrossRef]
  9. Wu, H.; Cockshutt, A.M.; McCarthy, A.; Campbell, D.A. Distinctive photosystem II photoinactivation and protein dynamics in marine diatoms. Plant Physiol. 2011, 156, 2184–2195. [Google Scholar] [CrossRef] [PubMed] [Green Version]
  10. Wu, H.; Roy, S.; Alami, M.; Green, B.R.; Campbell, D.A. Photosystem II photoinactivation, repair, and protection in marine centric diatoms. Plant Physiol. 2012, 160, 464–476. [Google Scholar] [CrossRef] [Green Version]
  11. Anning, T.; Harris, G.; Geider, R.J. Thermal acclimation in the marine diatom Chaetoceros calcitrans (Bacillariophyceae). Eur. J. Phycol. 2001, 36, 233–241. [Google Scholar] [CrossRef]
  12. Li, G.; Campbell, D.A. Rising CO2 interacts with growth light and growth rate to alter Photosystem II photoinactivation of the coastal diatom Thalassiosira pseudonana. PLoS ONE 2013, 8, e55562. [Google Scholar] [CrossRef]
  13. Li, G.; Campbell, D.A. Interactive effects of nitrogen and light on growth rates and RUBISCO content of small and large centric diatoms. Photosynth. Res. 2017, 131, 93–103. [Google Scholar] [CrossRef] [PubMed] [Green Version]
  14. Zhao, H.; Tang, D.; Wang, Y. Comparison of phytoplankton blooms triggered by two typhoons with different intensities and translation speeds in the South China Sea. Mar. Ecol. Prog. Ser. 2008, 365, 57–65. [Google Scholar] [CrossRef] [Green Version]
  15. Zhao, H.; Shao, J.; Han, G.; Yang, D.; Lv, J. Influence of typhoon matsa on phytoplankton chlorophyll-a off East China. PLoS ONE 2015, 10, e0137863. [Google Scholar] [CrossRef]
  16. Tsai, A.Y.; Gong, G.C.; Chiang, K.P. Increase in phytoplankton production and consumption in response to a typhoon passing through the southern East China Sea. Aquat. Microb. Ecol. 2020, 84, 121–126. [Google Scholar] [CrossRef]
  17. Li, G.; Brown, C.M.; Jeans, J.A.; Donaher, N.A.; McCarthy, A.; Campbell, D.A. The nitrogen costs of photosynthesis in a diatom under current and future pCO2. New Phytol. 2015, 205, 533–543. [Google Scholar] [CrossRef]
  18. Song, X.; Tan, M.; Xu, G.; Su, X.; Liu, J.; Ni, G.; Tan, Y.; Huang, L.; Shen, P.; Li, G. Is phosphorus a limiting factor to regulate growth of phytoplankton in Daya Bay, northern South China Sea: A mesocosm experiment. Ecotoxicology 2019, 28, 559–568. [Google Scholar] [CrossRef] [PubMed]
  19. Field, C.B.; Behrenfeld, M.J.; Randerson, J.T.; Falkowski, P. Primary production of the biosphere: Integrating terrestrial and oceanic components. Science 1998, 281, 237–240. [Google Scholar] [CrossRef] [Green Version]
  20. Tréguer, P.; Bowler, C.; Moriceau, B.; Dutkiewicz, S.; Gehlen, M.; Aumont, O.; Bittner, L.; Dugdale, R.; Finkel, Z.; Iudicone, D.; et al. Influence of diatom diversity on the ocean biological carbon pump. Nat. Geosci. 2018, 11, 27–37. [Google Scholar] [CrossRef]
  21. Round, F.E.; Crawford, R.M.; Mann, D.G. The diatoms: Biology and morphology of the genera. Aquat. Bot. 1991, 40, 301–302. [Google Scholar]
  22. Bowler, C.; Vardi, A.; Allen, A.E. Oceanographic and biogeochemical insights from diatom genomes. Annu. Rev. Mar. Sci. 2010, 2, 333–365. [Google Scholar] [CrossRef]
  23. von Dassow, P.; Petersen, T.W.; Chepurnov, V.A.; Armbrust, E.V. Inter- and intra-specific relationships between nuclear DNA content and cell size in selected members of the centric diatom genus Thalassiosira (Bacillariophyceae). J. Phycol. 2008, 44, 335–349. [Google Scholar] [CrossRef]
  24. Beardall, J.; Allen, D.; Bragg, J.; Finkel, Z.V.; Flynn, K.J.; Quigg, A.; Rees, T.A.V.; Richardson, A.; Raven, J.A. Allometry and stoichiometry of unicellular, colonial and multicellular phytoplankton. New Phytol. 2009, 181, 295–309. [Google Scholar] [CrossRef] [PubMed]
  25. Litchman, E.; Klausmeier, C.A.; Yoshiyama, K. Contrasting size evolution in marine and freshwater diatoms. Proc. Natl. Acad. Sci. USA 2009, 106, 2665–2670. [Google Scholar] [CrossRef] [PubMed] [Green Version]
  26. Raven, J.A. Small is beautiful: The picophytoplankton. Funct. Ecol. 1998, 12, 503–513. [Google Scholar] [CrossRef]
  27. Finkel, Z.V.; Beardall, J.; Flynn, K.J.; Quigg, A.; Rees, T.A.V.; Raven, J.A. Phytoplankton in a changing world: Cell size and elemental stoichiometry. J. Plankton Res. 2010, 32, 119–137. [Google Scholar] [CrossRef] [Green Version]
  28. Key, T.; McCarthy, A.; Campbell, D.A.; Six, C.; Roy, S.; Finkel, Z.V. Cell size trade-offs govern light exploitation strategies in marine phytoplankton. Environ. Microbiol. 2010, 12, 95–104. [Google Scholar] [CrossRef] [PubMed]
  29. Li, G.; Gao, K. Cell-size dependent effects of solar UV radiation on primary production in coastal waters of the South China Sea. Estuar. Coast. 2013, 36, 728–736. [Google Scholar] [CrossRef]
  30. Marañón, E.; Cermeño, P.; López-Sandoval, D.C.; Rodríguez-Ramos, T.; Sobrino, C.; Huete-Ortega, M.; Blanco, J.M.; Rodríguez, J. Unimodal size scaling of phytoplankton growth and the size dependence of nutrient uptake and use. Ecol. Lett. 2013, 16, 371–379. [Google Scholar] [CrossRef]
  31. Wu, Y.; Campbell, D.A.; Irwin, A.J.; Suggett, D.J.; Finkel, Z.V. Ocean acidification enhances the growth rate of larger diatoms. Limnol. Oceanogr. 2014, 59, 1027–1034. [Google Scholar] [CrossRef]
  32. Wu, Y.; Jeans, J.; Suggett, D.J.; Finkel, Z.V.; Campbell, D.A. Large centric diatoms allocate more cellular nitrogen to photosynthesis to counter slower RUBISCO turnover rates. Front. Mar. Sci. 2014, 1. [Google Scholar] [CrossRef] [Green Version]
  33. Yan, D.; Beardall, J.; Gao, K. Variation in cell size of the diatom Coscinodiscus granii influences photosynthetic performance and growth. Photosynth. Res. 2018, 137, 41–52. [Google Scholar] [CrossRef] [PubMed]
  34. Yi, R.; Tan, Y.; Wang, S.; Shen, P.; Ke, Z.; Huang, L.; Song, X.; Li, G. Cell size dependent responses of phytoplankton assemblages to nitrate and phosphate additions in surface waters of the northern South China Sea. J. Mar. Sci. 2014, 4, 61–67. [Google Scholar] [CrossRef] [Green Version]
  35. Li, G.; Talmy, D.; Campbell, D.A. Diatom growth responses to photoperiod and light are predictable from diel reductant generation. J. Phycol. 2017, 53, 95–107. [Google Scholar] [CrossRef]
  36. Li, W.K.W. Macroecological patterns of phytoplankton in the northwestern North Atlantic Ocean. Nature 2002, 419, 154–157. [Google Scholar] [CrossRef]
  37. Raven, J.A.; Doblin, M.A. Active water transport in unicellular algae: Where, why, and how. J. Exp. Bot. 2014, 65, 6279–6292. [Google Scholar] [CrossRef] [PubMed] [Green Version]
  38. Clark, J.R.; Lenton, T.M.; Williams, H.T.P.; Daines, S.J. Environmental selection and resource al-location determine spatial patterns in picophytoplankton cell size. Limnol. Oceanogr. 2013, 58, 1008–1022. [Google Scholar] [CrossRef] [Green Version]
  39. Grover, J.P. Resource storage and competition with spatial and temporal variation in resource availability. Am. Nat. 2011, 178, 124–148. [Google Scholar] [CrossRef] [PubMed]
  40. Guillard, R.R.; Ryther, J.H. Studies of marine planktonic diatoms.1. Cyclotella nana Hustedt and Detonula confervacea (Cleve) Gran. Can. J. Microbiol. 1962, 8, 229–239. [Google Scholar] [CrossRef]
  41. Porra, R.J. The chequered history of the development and use of simultaneous equations for the accurate determination of chlorophylls a and b. Photosynth. Res. 2002, 73, 149–156. [Google Scholar] [CrossRef] [PubMed]
  42. Van Kooten, O.; Snel, J.F.H. The use of chlorophyll fluorescence nomenclature in plant stress physiology. Photosynth. Res. 1990, 25, 147–150. [Google Scholar] [CrossRef]
  43. Genty, B.; Briantais, J.-M.; Baker, N.R. The relationship between the quantum yield of photosynthetic electron transport and quenching of chlorophyll fluorescence. BBA Gen. Subj. 1989, 990, 87–92. [Google Scholar] [CrossRef]
  44. Eilers, P.H.C.; Peeters, J.C.H. A model for the relationship between light intensity and the rate of photosynthesis in phytoplankton. Ecol. Modell. 1998, 42, 199–215. [Google Scholar] [CrossRef]
  45. Wang, H.; Zhang, B.; Song, X.; Jian, X.; Tang, C.; Campbell, D.A.; Li, G. High antioxidant capability interacts with respiration to mediate two Alexandrium species growth exploitation of photoperiods and light intensities. Harmful Algae 2019, 82, 26–34. [Google Scholar] [CrossRef]
  46. Smith, P.K.; Krohn, R.I.; Hermanson, G.T.; Mallia, A.K.; Gartner, F.H.; Provenzano, M.D.; Fujimoto, E.K.; Goeke, N.M.; Olson, B.J.; Klenk, D.C. Measurement of protein using bicinchoninic acid. Anal. Biochem. 1985, 150, 76–85. [Google Scholar] [CrossRef]
  47. Xu, G.; Liu, J.; Chen, B.; Li, G. Photoperiod mediates the differential physiological responses of smaller Thalassiosira pseudonana and larger Thalassiosira punctigera to temperature changes. J. Appl. Phycol. 2020, 32, 2863–2874. [Google Scholar] [CrossRef]
  48. Sun, Y.; Oberley, L.W.; Li, Y. A simple method for clinical assay of superoxide-dismutase. Clin. Chem. 1988, 34, 497–500. [Google Scholar] [CrossRef] [PubMed]
  49. Marcoval, M.A.; Villafañe, V.E.; Helbling, E.W. Interactive effects of ultraviolet radiation and nutrient addition on growth and photosynthesis performance of four species of marine phytoplankton. J. Photochem. Photobiol. B Biol. 2007, 89, 78–87. [Google Scholar] [CrossRef] [PubMed]
  50. Chen, Y.L. Spatial and seasonal variations of nitrate-based new production and primary production in the South China Sea. Deep-Sea Res. I 2005, 52, 319–340. [Google Scholar] [CrossRef]
  51. Takahashi, S.; Murata, N. How do environmental stresses accelerate photoinhibition? Trends Plant. Sci. 2008, 13, 178–182. [Google Scholar] [CrossRef] [PubMed]
  52. Waring, J.; Klenell, M.; Bechtold, U.; Underwood, G.J.C.; Baker, N.R. Light-induced responses of oxygen photoreduction, reactive oxygen species production and scavenging in two diatom species. J. Phycol. 2010, 46, 1206–1217. [Google Scholar] [CrossRef]
  53. Dong, H.; Dong, Y.; Cui, L.; Balamurugan, S.; Gao, J.; Lu, S.; Jiang, T. High light stress triggers distinct proteomic responses in the marine diatom Thalassiosira pseudonana. BMC Genom. 2016, 17, 994. [Google Scholar] [CrossRef] [PubMed] [Green Version]
  54. Hazzard, C.; Lesser, M.P.; Kinzie, R.A. Effects of ultraviolet radiation on photosynthesis in the subtropical marine diatom, Chaetoceros gracilis (Bacillariophyceae). J. Phycol. 1997, 33, 960–968. [Google Scholar] [CrossRef]
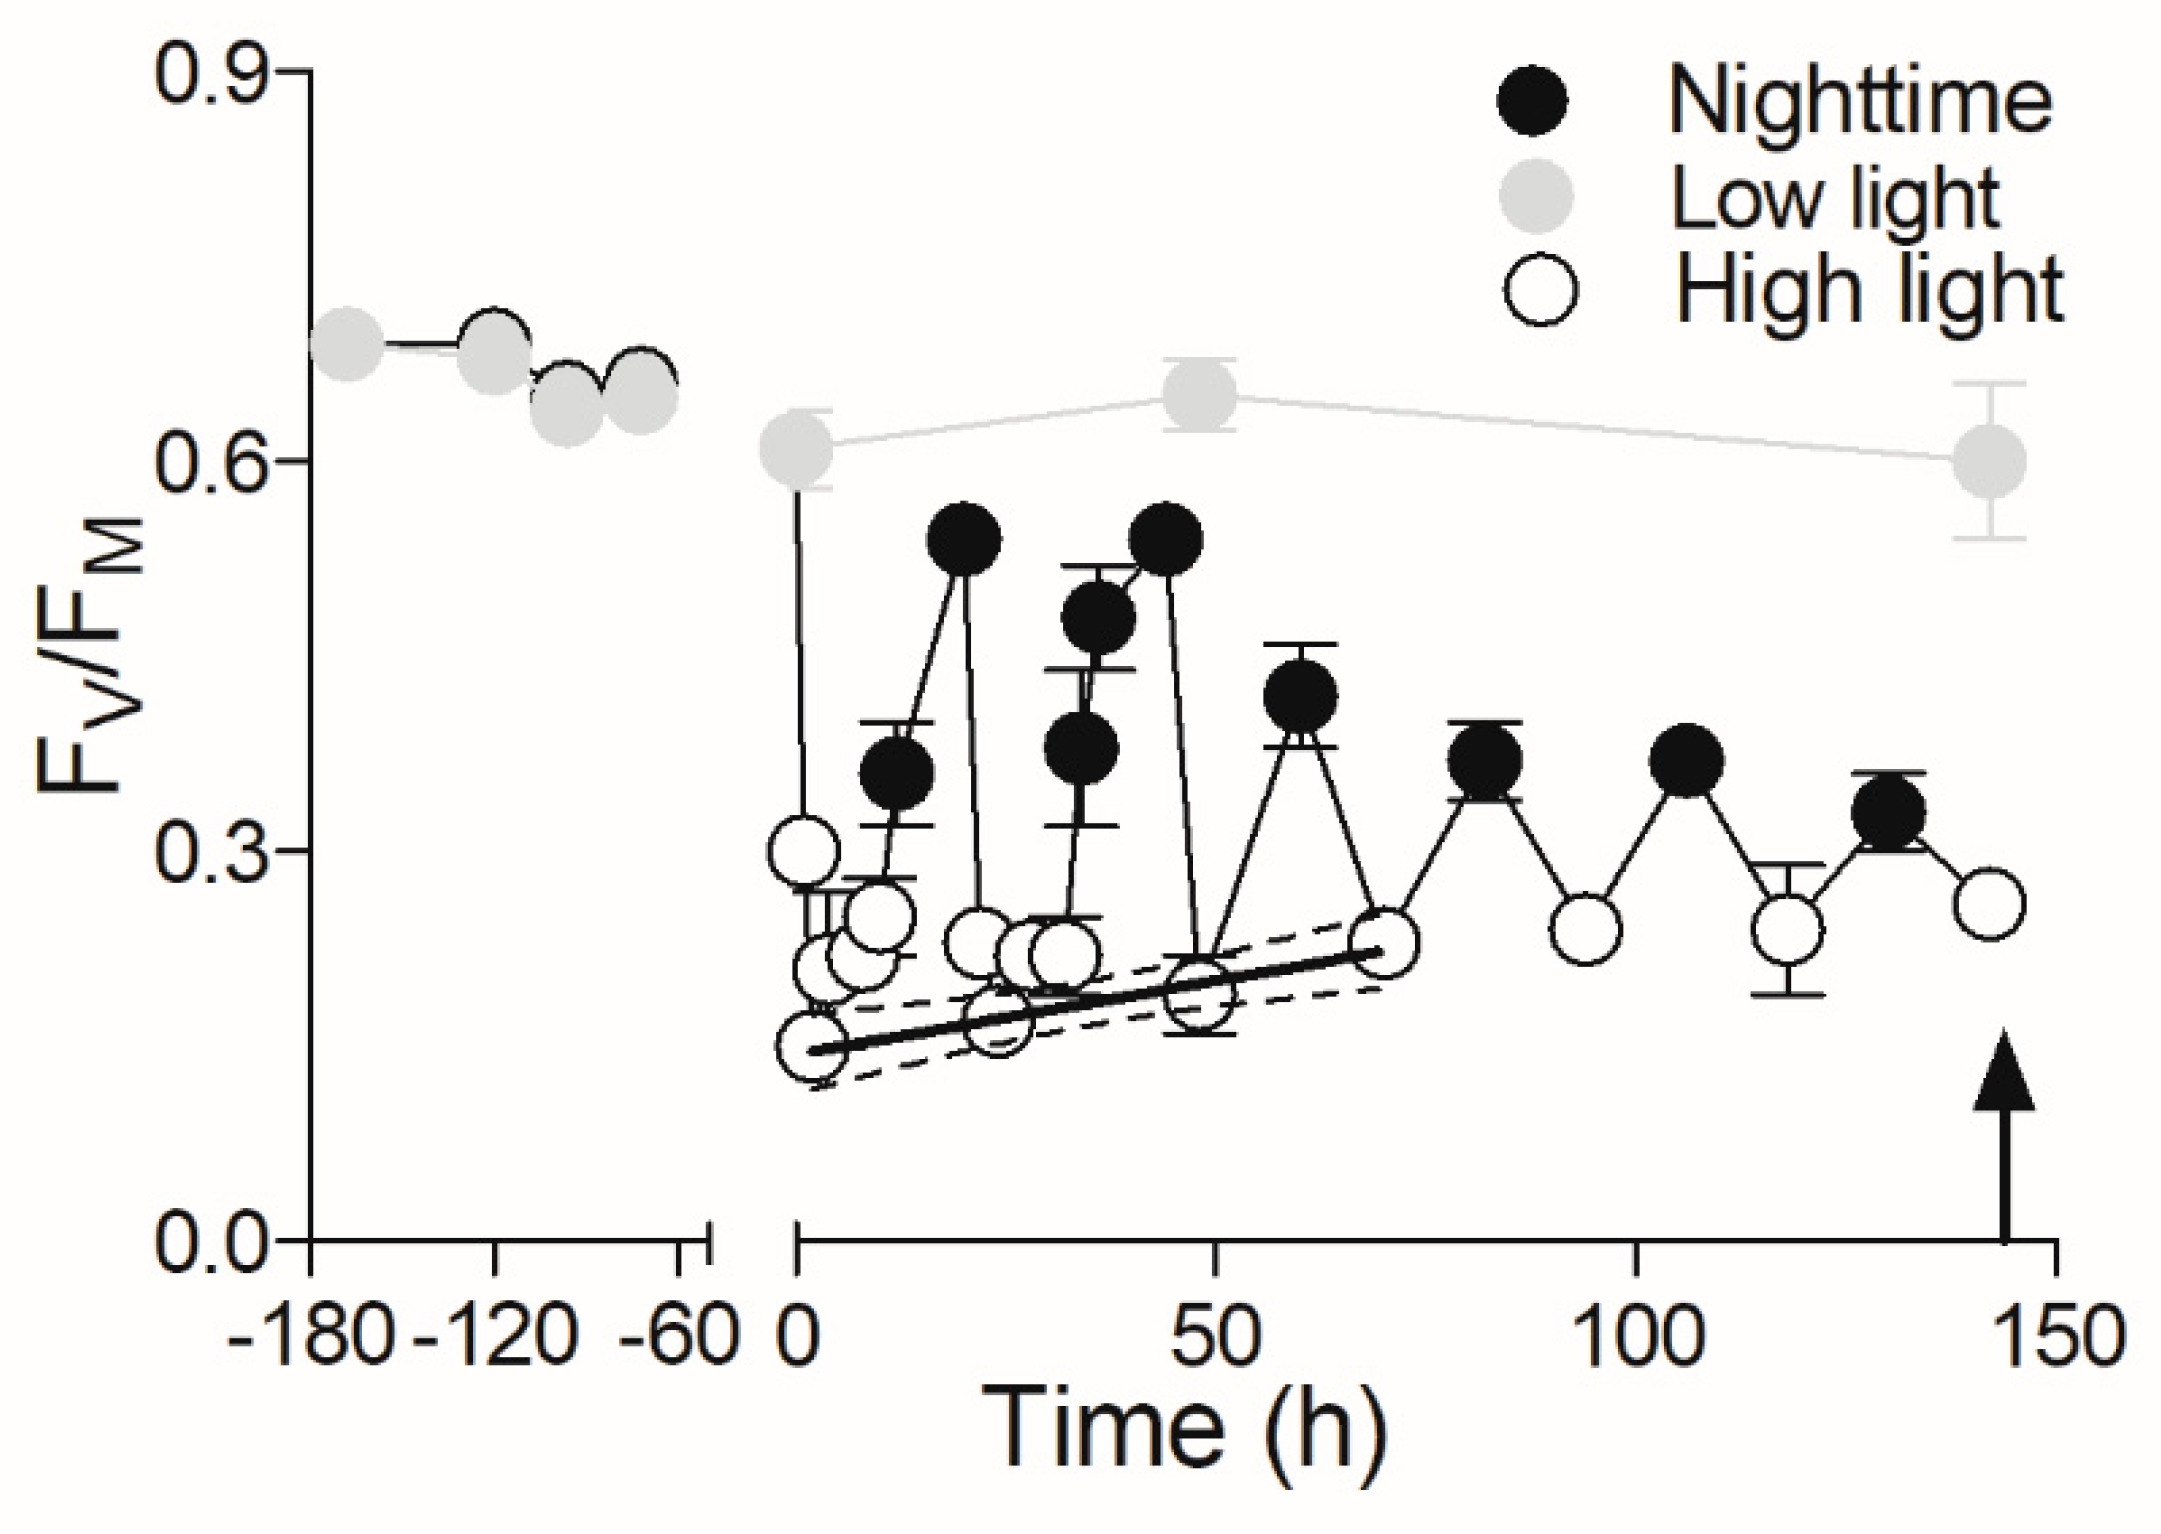
Figure 1. Diagram of an exemplary change in maximum photochemical quantum yield (FV/FM) of photosystem II (PSII) of a culture grown in low light (35 µmol photons m−1 s−1) and after an upward-shift light (250 µmol photons m−1 s−1). The fitted line of FV/FM obtained 2 h after the light being turned on with 95% confidential intervals indicates the recovery of cells from stressful high light. Points show the averages of the FV/FM of three independently grown cultures, and error bars show the standard deviations (n = 3), often within symbols. The arrow indicates the timepoint of taking samples for biological and chemical measurements. This example of FV/FM variation was taken from a culture of T. pseudonana growing in an 88.2 µM nitrogen concentration.
Jmse 09 00450 g001
Figure 2. Growth rate (μ, day−1) of small Thalassiosira pseudonana (A) and large T. punctigera (B) grown under low (35 μmol photons m−2 s−1) and shifted-high lights (250 μmol photons m−2 s−1), and under low (88.2 μM) and high/shifted-high nitrogen conditions (882 μM). Points show the averages of three growth replicates grown on independent cultures, and error bars show the standard deviations (n = 3), often within the symbols.
Jmse 09 00450 g002
Figure 3. Cell biovolume-based contents (fg μm−3) of chlorophyll a (A,B, Chl a), carotenoids (C,D, Car), carbon (E,F, C), nitrogen (G,H, N) and proteins (I,J) for small T. pseudonana (A,C,E,G,I) and large T. punctigera (B,D,F,H,J) grown under low and shifted-high lights, and under low and high/shifted-high nitrogen conditions. Points show averages of measurements on three independently grown cultures, and error bars show the standard deviations (n = 3), often within symbols.
Jmse 09 00450 g003
Figure 4. Maximum PSII photochemical quantum yield (FV/FM) of small T. pseudonana (A) and large T. punctigera (B) grown under low and shifted-high lights, and under low and high/shifted-high nitrogen conditions. Points show averages of measurements on three independently grown cultures, and error bars show the standard deviations (n = 3), often within symbols.
Jmse 09 00450 g004
Figure 5. Cell biovolume-based dark respiration rate (fmol O2 μm−3 min−1) of small T. pseudonana (A) and large T. punctigera (B) grown under low or shifted-high lights, and under low and high/shifted-high nitrogen conditions. Points show averages of measurements on three independently grown cultures, and error bars show the standard deviations (n = 3), often within symbols.
Jmse 09 00450 g005
Figure 6. Cell biovolume-based superoxide dismutase (SOD) activity (×10−9 U µm−3) of small T. pseudonana (A) and large T. punctigera (B) grown under low and shifted-high lights, and under low and high/shifted-high nitrogen conditions. Points show averages of measurements on three independently grown cultures, and error bars show the standard deviations (n = 3), often within symbols.
Jmse 09 00450 g006
Figure 7. Effects of upward-shifted light and N on biochemical and physiological parameters, with the color gradient denoting the r values of Pearson’s rank correlation coefficients and the F values of the interaction of light and N. (*: p < 0.05, **: 0.01 < p < 0.05, ***: p < 0.01).
Jmse 09 00450 g007
Table 1. The rapid light curve (RLC)-derived photosynthetic parameters, i.e., light utilization efficiency (α), saturation irradiance (EK, μmol photons m−2 s−1), and maximal relative electron transport rate (rETRmax) for T. pseudonana and T. punctigera grown under low (35 μmol photons m−2 s−1) and shifted-high lights (250 μmol photons m−2 s−1), and under low (88.2 μM) and high/shifted-high nitrogen (882 μM). Data are presented as mean and standard deviations (mean ± SD, n = 3). Different letters indicate significant differences (p < 0.05).
NLightT. pseudonanaT. punctigera
αEKrETRmaxαEKrETRmax
882350.20 ± 0.009 a348 ± 47.3 a70.5 ± 10.42 a0.24 ± 0.023 a524 ± 57.2 a125 ± 12.4 a
2500.09 ± 0.026 b264 ± 68.4 a8.15 ± 4.39 b0.13 ± 0.034 b263 ± 46.2 b30.8 ± 5.85 b
88.2350.23 ± 0.023 a136 ± 17.9 b31.0 ± 4.58 c0.23 ± 0.022 a352 ± 34.3 c81.2 ± 14.04 c
2500.14 ± 0.011 c440 ± 62.4 c57.4 ± 7.64 a,d0.16 ± 0.020 b341 ± 73.2 c52.6 ± 11.40 b
8822500.11 ± 0.014 b,c342 ± 36.7 a,c35.8 ± 2.42 c0.16 ± 0.014 b218 ± 24.3 b34.7 ± 3.33 b
Publisher’s Note: MDPI stays neutral with regard to jurisdictional claims in published maps and institutional affiliations.