Article

Severity Scoring of Behavioral Responses of Sperm Whales (Physeter macrocephalus) to Novel Continuous versus Conventional Pulsed Active Sonar

1
Acoustics Group, Cerema-University Gustave Eiffel, UMRAE, F-67035 Strasbourg, France
2
Sea Mammal Research Unit, University of St. Andrews, St. Andrews, Fife KY16 8LB, UK
3
Marine Science & Communication, Bosstraat 123, NL-3971 XC Driebergen-Rijsenburg, The Netherlands
4
Falculty of Life and Environmental Sciences, University of Iceland, 101 Reykjavik, Iceland
5
Department of Ecosystem Acoustics, Institute of Marine Research, P.O. Box 1870 Nordnes, NO-5817 Bergen, Norway
6
Department of Biosciences; University of Oslo, Marine Biological Station, Biologveien 2, NO-1440 Drøbak, Norway
7
Sensor and Surveillance Systems, Norwegian Defense Research Establishment FFI, NO-3191 Horten, Norway
8
Acoustics & Sonar Research Group, Netherlands Institute for Applied Scientific Research TNO, Oude Waalsdorperweg 63, NL-2597 AK The Hague, The Netherlands
*
Author to whom correspondence should be addressed.
J. Mar. Sci. Eng. 2021, 9(4), 444; https://doi.org/10.3390/jmse9040444
Submission received: 30 March 2021 / Revised: 13 April 2021 / Accepted: 15 April 2021 / Published: 19 April 2021
(This article belongs to the Special Issue Ocean Noise: From Science to Management)

Abstract

:
Controlled exposure experiments (CEEs) have demonstrated that naval pulsed active sonar (PAS) can induce costly behavioral responses in cetaceans similar to antipredator responses. New generation continuous active sonars (CAS) emit lower amplitude levels but more continuous signals. We conducted CEEs with PAS, CAS and no-sonar control on free-ranging sperm whales in Norway. Two panels blind to experimental conditions concurrently inspected acoustic-and-movement-tag data and visual observations of tagged whales and used an established severity scale (0–9) to assign scores to putative responses. Only half of the exposures elicited a response, indicating overall low responsiveness in sperm whales. Responding whales (10 of 12) showed more, and more severe responses to sonar compared to no-sonar. Moreover, the probability of response increased when whales were previously exposed to presence of predatory and/or competing killer or long-finned pilot whales. Various behavioral change types occurred over a broad range of severities (1–6) during CAS and PAS. When combining all behavioral types, the proportion of responses to CAS was significantly higher than no-sonar but not different from PAS. Responses potentially impacting vital rates i.e., with severity ≥4, were initiated at received cumulative sound exposure levels (dB re 1 μPa2 s) of 137–177 during CAS and 143–181 during PAS.

1. Introduction

All marine mammals and particularly cetacean species use sound as a primary sensory modality to perform vital functions such as finding prey, communicating with their congeners (e.g., for mating or maintaining group cohesion) and detecting predators [1,2]. Facing the urgent need to quantify the impacts of anthropogenic noise on cetacean species, the last decades have seen a growing number of controlled exposure experiment (CEE) studies in which animals are exposed to an acoustic stimulus to assess their behavioral and/or physiological responses. Information collected during CEEs in the field is used to calculate dose–response functions [3] and in modeling frameworks that have the ultimate goal to determine population-level impacts of the noise source [4,5]. Among the anthropogenic sound sources potentially impacting cetaceans, there has been a particular concern with long-range anti-submarine sonars since their use has been spatiotemporally correlated to various cetacean stranding events [6,7,8]. These naval sonars are very powerful sources, generating sound within 1–10 kHz and thus overlapping with the hearing sensitivity and sounds of most cetacean species [9]. Beside the risk of direct physical injuries (e.g., hearing impairment) [10], behavioral responses (e.g., avoidance responses) may contribute to the chain of events leading to lethal strandings [5].
CEEs have been a key experimental approach to get a better understanding of the impacts of anthropogenic noise sources such as naval sonar on free-ranging cetacean behavior. Their goal is to record short-term individual or group behavioral changes, specify the dose (e.g., received sound pressure level and received sound exposure level) and source proximity at which responses occurred, and to extrapolate the effects judged to have a relevant impact on individual fitness to long-term population effects [11]. The basic procedure involves monitoring individual behavior, before, during and after sonar exposure, in order to identify potential behavioral changes and quantify response duration to sonar. The development of animal-borne archival tags carrying various sensors provided a key tool for CEEs to track animals and to directly measure their behavior through the dive cycle (movement and sound recordings tags [12]). CEEs have been carried out to characterize behavioral responses to sonar and to investigate the factors driving those responses such as the particular ecological and/or social context of the exposure [13], the received level thresholds of response onset (by conducting CEE with a controlled escalating RL dose [14]), the sonar signal characteristics (e.g., the frequency range: CEE with 1–2 kHz or 6–7 kHz naval sonar [14]), or the animal–source distance [15].
Previous work focused on assessing behavioral responses of various cetacean species to conventional pulsed active sonar (PAS) systems that transmit short pulses separated by relatively long pauses for listening to returning echoes. PAS exposures in the 1–2 kHz frequency band induced costly behavioral responses in sperm whales [14,16]. Indeed, behavioral responses such as cessation of feeding indicated a potential for impacting individual vital rates if sonar exposures were sufficiently common and if animals continued to respond to the exposures. Comparing behavioral responses to sonar with how animals of the same species react when they detect a known natural high-level threat such as increased predation risk (simulated by predator sound exposures) provided a useful approach to interpret the biological significance of responses to sonar [17]. In sperm whales in particular, responses to 1–2 kHz PAS sonar were highly concordant with the observed antipredator behavioral template, including horizontal avoidance, interruption of foraging and increase of social sound production, providing evidence that sonar is perceived as a high-level threat [16,17].
Since then, new generation Continuous Active Sonar (CAS) systems transmitting almost continuously have been developed by navies as an alternative to traditional PAS in order to improve the opportunities of target detection. CAS sonar can be operated at lower source levels than PAS, potentially leading to less environmental impact compared to PAS. However, the higher duty cycle of CAS might increase the disturbance and risk of masking with smaller temporal gaps without sonar transmission. Therefore, the potential future use of CAS by navies raised further concerns on potential impacts of such new types of sonar on animals and how different those effects are compared to PAS sonar. To address this question, we conducted CEEs using both 1–2 kHz CAS and 1–2 kHz PAS exposures, and no-sonar (NS) controls on sperm whales (Physeter macrocephalus) in Northern Norway [18]. Using this dataset, Isojunno and colleagues [19] focused on quantifying the effects of CAS and PAS on sperm whale foraging behavior and movement effort. The authors found that responses to CAS were similar to responses to PAS as long as the energy levels of the transmissions were similar, even though the peak pressure levels of PAS were much higher. This highlights the cumulative sound energy (received sound exposure level) rather than the received sound pressure level as a main driver of behavioral responses to sonar in feeding sperm whales.
In the present work, using established procedures to score putative responses [4,14,20], we aimed to identify the nature and severity of responses to CAS versus PAS, and to test whether CAS can lead to significant effects on the behavior repertoire of sperm whales in a different way than PAS. In particular, we investigated potential avoidance responses, cessation of feeding or resting behaviors, and exhibition of social responses. These responses have the potential to reduce individual fitness if expressed for a biologically relevant duration, and ultimately may have negative impacts at the population level. The basic principle of severity scoring is expert examination of multivariate timeseries of behavioral observations to assess potential changes across a range of predefined behavioral response categories (e.g., changes in diving behavior, changes in vocal behavior etc.). Such severity scores are attributed by experts using an existing qualitative severity scale ranging from no effect (0), to effects potentially impacting (4–6) or likely to impact vital rates (7–9) [4]. Previously, this severity scoring method was used consistently with a range of cetacean species that were subjected to sonar CEEs, (e.g., long-finned pilot whales, sperm whales and killer whales [14]; humpback whales, bottlenose whales and minke whales [15,20], and blue whales [21]). The present work adds to this list, presenting a unique dataset on sperm whales which increases comparison perspective across different sound exposures and species.

2. Materials and Methods

2.1. Animal Welfare Considerations

All animal research activities were licensed under permit provided by the Norwegian Animal Research Authority (Permit n° 2015–223 222) and were approved by the Animal Welfare Ethics Committee of the University of St Andrews (UK). Our experimental protocol followed a safety plan, designed to protect the welfare of our research subjects and to reduce risk to any other animals present in the studied area [22,23]. Expert marine mammal observers visually scanned continuously for research subjects and other cetaceans throughout the experimental exposures, with a detailed plan in place to stop sonar transmission if potentially hazardous responses occurred i.e., response which might bring the animal in danger of direct harm (e.g., animals showing signs of panic and fast swimming towards the shore or into confined areas) or if any animal came too close to the sonar source. The stand-off range between source and animals during full-power transmission was 100 m. If any animals were to approach this safety zone, an emergency shut-down of sonar transmission would be ordered. Transmission would cease immediately if any animals showed any signs of pathological effects, disorientation, severe behavioral reactions, or if any animals swam too close to the shore or entered confined areas that might limit escape routes. Moreover, other aspects of our protocol design also reduced the risk of harm to experimental subjects, such as the limited duration of the sound exposure periods, the limited number of tested whales, and the change of whales and area between the experiments.

2.2. Study Species and General Protocol

This study was conducted in two boreal summers (3–17 May 2016 and 22 June to 14 July 2017) on free-ranging sperm whales encountered on their feeding grounds in Northern Norway between 69–70.5° northern latitude and 12.5–19.5° eastern longitude. There, sperm whales are mostly solitary males typically spending ~80% of their time foraging and ~20% of their time resting and engaging in other activities [24,25,26].
The experiments were designed and conducted by the 3S (Sea mammals, Sonar, Safety) research consortium and detailed protocols used in the experiments can be found in two dedicated cruise reports [22,23]. Fieldwork was carried out from the 55 m FFI research vessel R/V H.U. Sverdrup II (hereafter “research vessel”), hosting scientists and crew members. The general protocol consisted of the following phases: (1) searching for the target species using both visual observers posted on the flying bridge of the research vessel and acoustic monitoring by the mean of a towed hydrophone array (DELPHINUS) developed by TNO [27]; (2) tagging operations from a dedicated 8 m workboat launched from the research vessel followed by a post-tagging period of at least 30 min to allow the animal to recover from any potential effects of the tagging procedure; (3) baseline data collection of the tagged animals for about 4h; (4) controlled exposure experiments; (5) end of tracking once the tag released, and tag recovery. Once the tag was recovered, the vessel transited at least 20 nautical miles away from the exposed area before tagging another whale and conducting the next set of experimental sessions.
The tag was a noninvasive multisensor suction-cup tag (DTAG) [12] attached to the whales using a cantilever pole or a pneumatic airgun [28] and was set to release after approximately 15 h. In all but two cases, only one whale was tagged, becoming the “focal animal” for which visual observations were collected throughout the following period of the tag deployment using the radio tracking of the VHF-beacon on the tag when the whale surfaced. In two cases, a second whale was tagged but not tracked visually (hereafter “non-focal animal”).

2.3. Experimental Exposures

Our aim was to expose each whale to a no-sonar control (abbreviated ‘NS’), followed by three sonar exposures conducted in an alternated order. The three sonar exposures consisted of the repetition of a 1–2 kHz hyperbolic upsweep signal. CAS had a 95% duty cycle (repetition of a 19-s signal + 1-s silence, Figure S1) and was generated with a maximum sound pressure level (SPL) of 201 dB re. 1 μPa m, and a maximum sound exposure level (SEL19s) of 214 dB re. 1 μPa2 m2 s. PAS had a duty cycle of 5% (1-s signal + 19-s silence, Figure S1) and was transmitted either at a medium source level (signal MPAS) matching the SPL of CAS, (201 dB re. 1 μPa·m), or at a higher source level (signal HPAS) matching the SEL of CAS (214 dB re. 1 μPa·m).
Before each exposure session, the sonar source (SOCRATES) was deployed and towed by the research vessel at an average depth of 55 m (range 35–100 m). At the start of exposure, the vessel was positioned at 4 nautical miles (7.4 km) from the focal whale to approach from the front at an angle of about 45° relative to the animal’s estimated course of travel. Each exposure session lasted 40min and consisted of the vessel approaching and then sometimes passing the whale, at a constant speed of 8 knots while either transmitting sonar or not transmitting sonar (NS). Sonar transmissions always started with a 20min ramp-up procedure, consisting of a gradual increase of the source level starting at a level of 60 dB below the maximum level and increasing in 1 dB steps per pulse. For the remaining 20 min of exposure, the sonar transmitted at maximum level. The vessel approach and sonar transmissions scheme aimed to achieve dose escalation, with a gradual increase of the sound levels received by the focal whales. This protocol was specifically designed to determine the received levels (RL) thresholds associated with response onsets. The NS sessions allowed separating the effects of the sonar from possible effects of the approaching vessel. When present, the NS session was always conducted as the first session for each set of experimental exposures, in order to test the effect of the vessel approach before any potential sensitization to the vessel if the whales had been previously exposed to the vessel towing a transmitting sonar.
The successive exposure sessions were separated by a minimum of 1 h 20 min allowing the animal to return to normal behavior following any behavioral response, and to plan the geometry of the next exposure session by relocating the research vessel relative to the expected course of the focal whale.
The goal was to expose each focal whale to all four exposure types (NS, CAS, MPAS, HPAS), however, due to logistical issues (e.g., tag released prematurely or whale track lost), some individuals were not exposed to all four experimental sessions. Two whales (sw16_126a and sw17_179a) were not exposed to NS. In two cases (NS session of sw16_134a and HPAS session of sw17_182b), the tag came off prematurely during the exposure, leading to an interruption of the behavioral response data collection during exposure. In one case (sw16_134b exposed to MPAS), visual contact to the whale was temporarily lost, reducing the number of whale geographical positions and leading to a particularly low quality track that prevented assessment of movement response.

2.4. Data Recording and Processing

Whale subjects were tagged with movement and sound recording DTAGs (version 3). These tags carry a suite of sensors, enabling the monitoring of the behavior of whales throughout their dive cycle [12]. All tags were equipped with a pressure sensor, temperature sensor, and three-axis accelerometer and magnetometer sensors sampling at 50 Hz. Moreover, they contained hydrophones that recorded stereo sound with 16-bit resolution at 96kHz sampling rate. A VHF beacon on the tags was used to identify, localize, and visually track the focal whale when it surfaced. In addition to the DTAG in its standard housing, the ‘mixed-DTAG’ was used which contained the DTAG version-3 core unit (i.e., all sensors of DTAG version-3) and VHF beacon, a GPS sensor (Fastloc2, Sirtrack, New Zealand) and an Argos transmitter (SPOT, Wildlife Computers, Redmond, WA).
Depth, heading, and pitch were calculated using established techniques [12]. The swim speed during dives of each tagged animal was calculated by regressing the acoustic flow noise in the 22.4–28.2 Hz frequency band to kinematic speed estimates during ascent and descent periods (|pitch| > 60°) [29]. The horizontal turning angle was calculated as a centered moving circular average of heading with a +/- 1 min window size.
Horizontal tracks of the tagged whales were reconstructed to 1 s resolution based on (1) the tag-derived movement data and visual and GPS position fixes using a state-space model implemented in a Bayesian framework [29], or (2) linear interpolations between visual and GPS position fixes when tag-derived heading data were not available due to failure of the magnetometer (lower-resolution method).
The acoustic recordings from the DTAGs were aurally and visually inspected via spectrograms using Adobe Audition software (Blackman-Harris window, FFT length: 4096) to identify sounds produced by the tagged sperm whale, sounds produced by conspecifics or other species present in the area, and sonar sounds received by the tagged whale. Typical sperm whale vocalizations were identified and included regular echolocation clicks and buzzes associated with foraging behavior [24], and other types of sounds associated with social behavior (slow echolocation clicks, codas, clangs and trumpet sounds) [30,31].
Moreover, incidental anthropogenic sonar, as well as sounds produced by other whale species in the research area, i.e., typically killer whales or long-finned-pilot whales (hereafter grouped as “blackfish” species), were annotated. Killer and pilot whales are considered as potential threatening stimuli for sperm whales as they represent a potential food competitor and/or a predator species [32,33].
The acoustic dose of the experimental sonar received by the tagged whales was quantified from the tag recordings of those sonar signals (see detailed method [14,20]). For each sonar pulse, the received maximum sound pressure levels (SPLmax) was determined using a sliding window of 200 ms, and the received cumulative sound exposure level (SELcum) was measured since the start of the sonar exposure session. Both received level metrics were analyzed in the 890–2240 Hz frequency band as it included the fundamental frequencies of the transmitted signal (the contribution of the harmonic frequencies on the broadband levels was determined to be negligible to the sound metrics we quantified, [34]).
Simultaneously with visual recording of the tagged whale positions at the surface, the best estimate of group size, defined as the number of individuals within 200 m of the focal animal during the surfacing period [35], was recorded. Visual data collection including the geographic position of whale resightings and group size was recorded using the software Logger. Moreover, sightings of blackfish species present in the area were reported (time and geographic position recorded).

2.5. Scoring Severity of Expert-Identified Behavioral Responses

Expert scoring of putative responses was used to assess the severity of identified behavioral responses on a numeric scale [4] ranging from no effect (0), effects not likely to influence vital rates (scores 1–3), effects that could impact vital rates (scores 4–6), to effects that are likely to impact vital rates (scores 7–9). The severity score of an identified response depends on the type of response and its duration relative to the duration of the exposure. The scale provided by Southall et al. [4] was further modified slightly to add some behavioral changes that were not covered in the original scale (Table 1). Each of the experimental exposures was visualized using a series of standardized data plots (available in [18]) where the exposure period was indicated but the experimental condition i.e., whale ID, type and order of exposure, was hidden (see one example of data plots on Figure S2). Data plots included a geographic track of the tagged whale and the research vessel, and time-series data plots of group size, swim speed, heading and turning angle, pitch, depth and whale sounds. Based on examination of those data plots, behavioral changes likely to be responses to the experimental exposures were identified. This was based upon a clearly visible behavioral change not observed during baseline periods. The severity was scored based upon the type of response and its duration by two independent groups of experts in accordance with the severity scale (Table 1). All scorers were part of the field team or familiar with the process of data collection, and seven out of eight coauthors had participated in previous similar scoring work [14,15,17,20]. One group consisted of authors C.C., L.S., P.W., B.B., and the second of authors M.S., R.R., P.K. and F-P.L. Each group conducted separate scoring, blind to the other team’s scoring. Thereafter, the two groups met and assimilated their results in the presence of an adjudicator (author P.J.O.M.) to reach a consensus scoring.
One methodological improvement in the present study compared to the previous ones was that scorers were blind to the experimental conditions (NS, CAS, MPAS or HPAS). This blind procedure was applied to ensure that unconscious biases of panel members would not result in differences in scoring across different exposure types. Data plots were presented to the scorers as shown on one example presented in Figure S2, for the baseline period (i.e., period between end of post-tagging period until start of the 60 min of pre-exposure of the first experimental exposure) and the period covering 60 min of pre-exposure until 60 min of post-exposure, but excluding the full time track and full time series per tag deployment. Given the minimum period of 1 h 20 min between two successive exposure sessions, the remaining 20-min period between the end of a 60-min post-exposure and the start of the next 60-min pre-exposure was not shown on the plots, making the time series disconnected for the scorers. A random exposure number (RE#) was attributed to each experimental exposure session. For each RE’s set of plots, the scorers evaluated whether the behavior exhibited during the exposure was different compared to the 60 min immediately preceding the exposure period and to the baseline period.
The behavioral response assessment was conditional to the studied species and context, i.e., solitary male sperm whales in their feeding grounds. Therefore, and similarly to the scoring methodology previously applied on sperm whales studied in this area, the scores of severity of the following eight behavioral response categories were systematically recorded for each experimental exposure (Figure 1): avoidance (vertical and/or horizontal), change in orientation other than avoidance (based on horizontal turns, pitch and vertical movements such as wiggles), change in locomotion (speed and directivity) not related to avoidance, change in dive behavior (based on dive profile), cessation of feeding (based on cessation of buzzing), cessation of resting (based on previous observations that sperm whales rest with a sharp pitch, i.e., with head up or down), modification of vocal behavior (including production of foraging and social sounds) and change in group distribution (group size). Other potential behavioral response categories existing in the severity scale, e.g., associated to reproduction, mother–calf association or aggressive behavior, were not assessed because they are not relevant to the behavioral context of the tested population’s subjects (Table 1).
Typical feeding and resting behaviors were clearly identified based on characteristics of the dive profile and vocal behavior (e.g., presence of buzzes indicating feeding activity) [24,25]. Scorers also assessed whether the behavior of the whale during the 60-min pre-exposure period and the quality of the collected data allowed for a proper assessment of all behavioral response categories. For instance, the assessment of cessation of resting or feeding was conditional to whether the whale was resting or feeding at the time the exposure started. Moreover, the whale’s geographic positions (visual or GPS fixes) and group size data could be collected only when the whale was at surface (between dive cycles). Therefore, the ability to assess potential ‘avoidance’ responses depended on the resolution of the whale track, and, the evaluation of potential changes in group distribution could be achieved only if group size data was recorded over the pre- and during-exposure phases. Non-focal whales were not tracked visually, preventing data collection on group size.
To account for cases of inability to assess potential behavioral changes, we differentiated a score “zero” (i.e., scorable, but no identified behavioral change judged to be response to the exposure) from the absence of a score (i.e., impossible to assess because data were missing or the behavioral context of the animal did not allow for it).
Once the two teams had reached a consensus on the scored putative responses, the experimental conditions of all RE were revealed and the received levels of the onset times of responses were identified. All unblinded data plots are published in Kvadsheim et al. 2021 [18].

2.6. Behavioral Response Analyses

A descriptive analysis was conducted in order to assess whether the scorability of the experiments, i.e., the ability to assess potential responses, was homogeneous across the panel of behavioral response categories and exposure types, and to reveal the distribution of the different behavioral response categories and magnitude (severity of scored responses) across the exposure types.
For each exposure session, we calculated two variables. The first was the proportion of scored behavioral responses (%), expressed as the total number of behavioral response categories for which a non-zero score was attributed (i.e., scored responses), normalized to the maximum number of potential scored responses (i.e., number of scorable behavioral response categories for which potential scores could be assessed). The second was the maximum score of severity among the different scored behavioral response categories.
Statistical analyses were carried out to model the proportion of scored responses (of all behavioral response categories combined) and the maximum score of severity per exposure session, in order to test the null hypothesis that the response variable was randomly assigned with respect to the exposure types. Since the whales were exposed to several exposure sessions, we used Generalized Estimating Equation (GEE) models that accounted for repeated measures in R v.3.0.2 for binomial response variables (geepack [36] in R Development Core Team 2013) and SAS 9.4 for categorical response variables (genmod procedure in SAS Institute 2011). GEE models also tested for potential influence of the first sonar exposure presentation compared to the subsequent sonar exposures (covariate Order) as well as for the previous presence of blackfish (covariate Blackfish) on the response variables.
Given that the protocol of exposures (range and direction of the approaching vessel relative to the animal) was specifically designed in relation to the focal whale position, the two non-focal whales (Table 2, sw17_182a and sw17_186a) received lower exposure levels at greater distances than the focal whales. Consequently, the behavioral response scoring data of the two non-focal whales were excluded from the statistical analyses.

2.6.1. Quantitative Analysis of the Proportion of Scored Responses and the Maximum Score Per Session Variables

For both severity scoring response variables (i.e., Proportion of scored responses and Maximum score per session) the full model tested whether the three covariates Signal, Order and Blackfish had an effect on the response variable. The covariate Signal was assigned with two factor levels, no-sonar and sonar, aiming at testing effect of sonar, or with four factor levels, CAS, HPAS, MPAS and NS, that aimed at testing potential effect of the sonar exposure type on the response variables. The covariate Order had two factor levels: one noted « 1st » including the NS and first sonar exposure sessions, and one noted « diff_1st » for which all subsequent sonar exposure sessions following the first sonar session were assigned. The Blackfish covariate was encoded as a variable that linearly decreases with time after a detected blackfish event (visually sighted and/or acoustically detected from the tag recordings). Specifically, it corresponds to the duration needed to recover at the start of exposure since the last identified blackfish event. We assumed that a full recovery from a detected blackfish event lasted a maximum 15 h because this corresponded approximately to the duration of data collection (i.e., programmed release time of the tag) [19]. Therefore, the more recently the whale was exposed to blackfish, the higher the value of the Blackfish covariate. If at start of exposure the whale had not been exposed to blackfish for more than 15 h, then the Blackfish covariate was given a zero value (blackfish event was considered as “absent”). If a blackfish event was detected within the 15 h preceding the start of exposure, the Blackfish covariate was 15 minus the number of hours since the event (blackfish event defined as “present”). If the blackfish event was detected during the exposure, the Blackfish was applied the maximum value of 15.
For the multiple GEE models (i.e., with two or four factor levels for the covariate Signal) applied on the two severity scoring variables, the full model with all three candidate explanatory variables was first run. Hypothesis-based model selection using p-values given by ANOVA (sequential Wald test) and backwards selection was conducted. After fitting each model, an ANOVA was conducted and the covariate with the highest p-value was removed and the GEE model refitted (for detailed method, see [37]). This was repeated until all terms retained in the ANOVA were significant at 5% level. The best fitted GEE models were then fitted to obtain results.

2.6.2. Dose–Response Function Analysis

To obtain probabilistic relationships of received level and response onset, we generated dose–response functions by fitting marginal stratified Cox proportional hazards models to the severity scoring data (see [38], for full details of this approach). This form of recurrent event survival analysis allowed us to combine the results from individual CEE to estimate the likelihood of response as a function of the acoustic dose while accounting for contextual covariates. Models were stratified by severity level (i.e., low for severity 1–3, moderate for severity 4–6, high for severity > 6) to produce the dose–response functions for different severity levels from the same fitted model.
The input data for the stratified Cox models was the received SELcum of the sonar at the first occurrence of each response level within each sonar exposure session. In the case of a severity score of 0 (no response), we allocated the received SELcum of the entire exposure session and labeled the data as right-censored. Statistical analyses were carried out to model the dose–response function in order to test the null hypothesis that the response variable (low or medium severity level) was randomly assigned with respect to the received level and exposure types. The full candidate model consisted of the covariate Stimulus with three factor levels (CAS, MPAS, HPAS) in addition to covariates Order and Blackfish (as defined previously). All possible model combinations including the null model were fitted and AIC-based model selection was used. The standard errors of the model estimates were corrected for the correlations within individuals using a grouped jack-knife procedure [39]. For the selected model, we verified the assumptions of proportional hazards, no influential outliers, and no interaction between covariates and strata [38,40]. Analyses were conducted in R version 3.6.1 (R Core Team 2019) and the dose–response functions were generated as survival curves using the survfit function package [41].

3. Results

In total we recorded behavioral data of 14 focal whales and two non-focal whales. All whales were exposed from one to four exposure sessions except for whale sw17_188a which was exposed to a 5th exposure (repeat CAS, see Table 2). The focal whale dataset consisted of 46 exposure sessions including 12 NS control, 12 CAS, 11 MPAS and 11 HPAS exposures, and the non-focal whale dataset included 2 NS, 2 CAS, 1 MPAS and 2 HPAS exposures (Table 2).

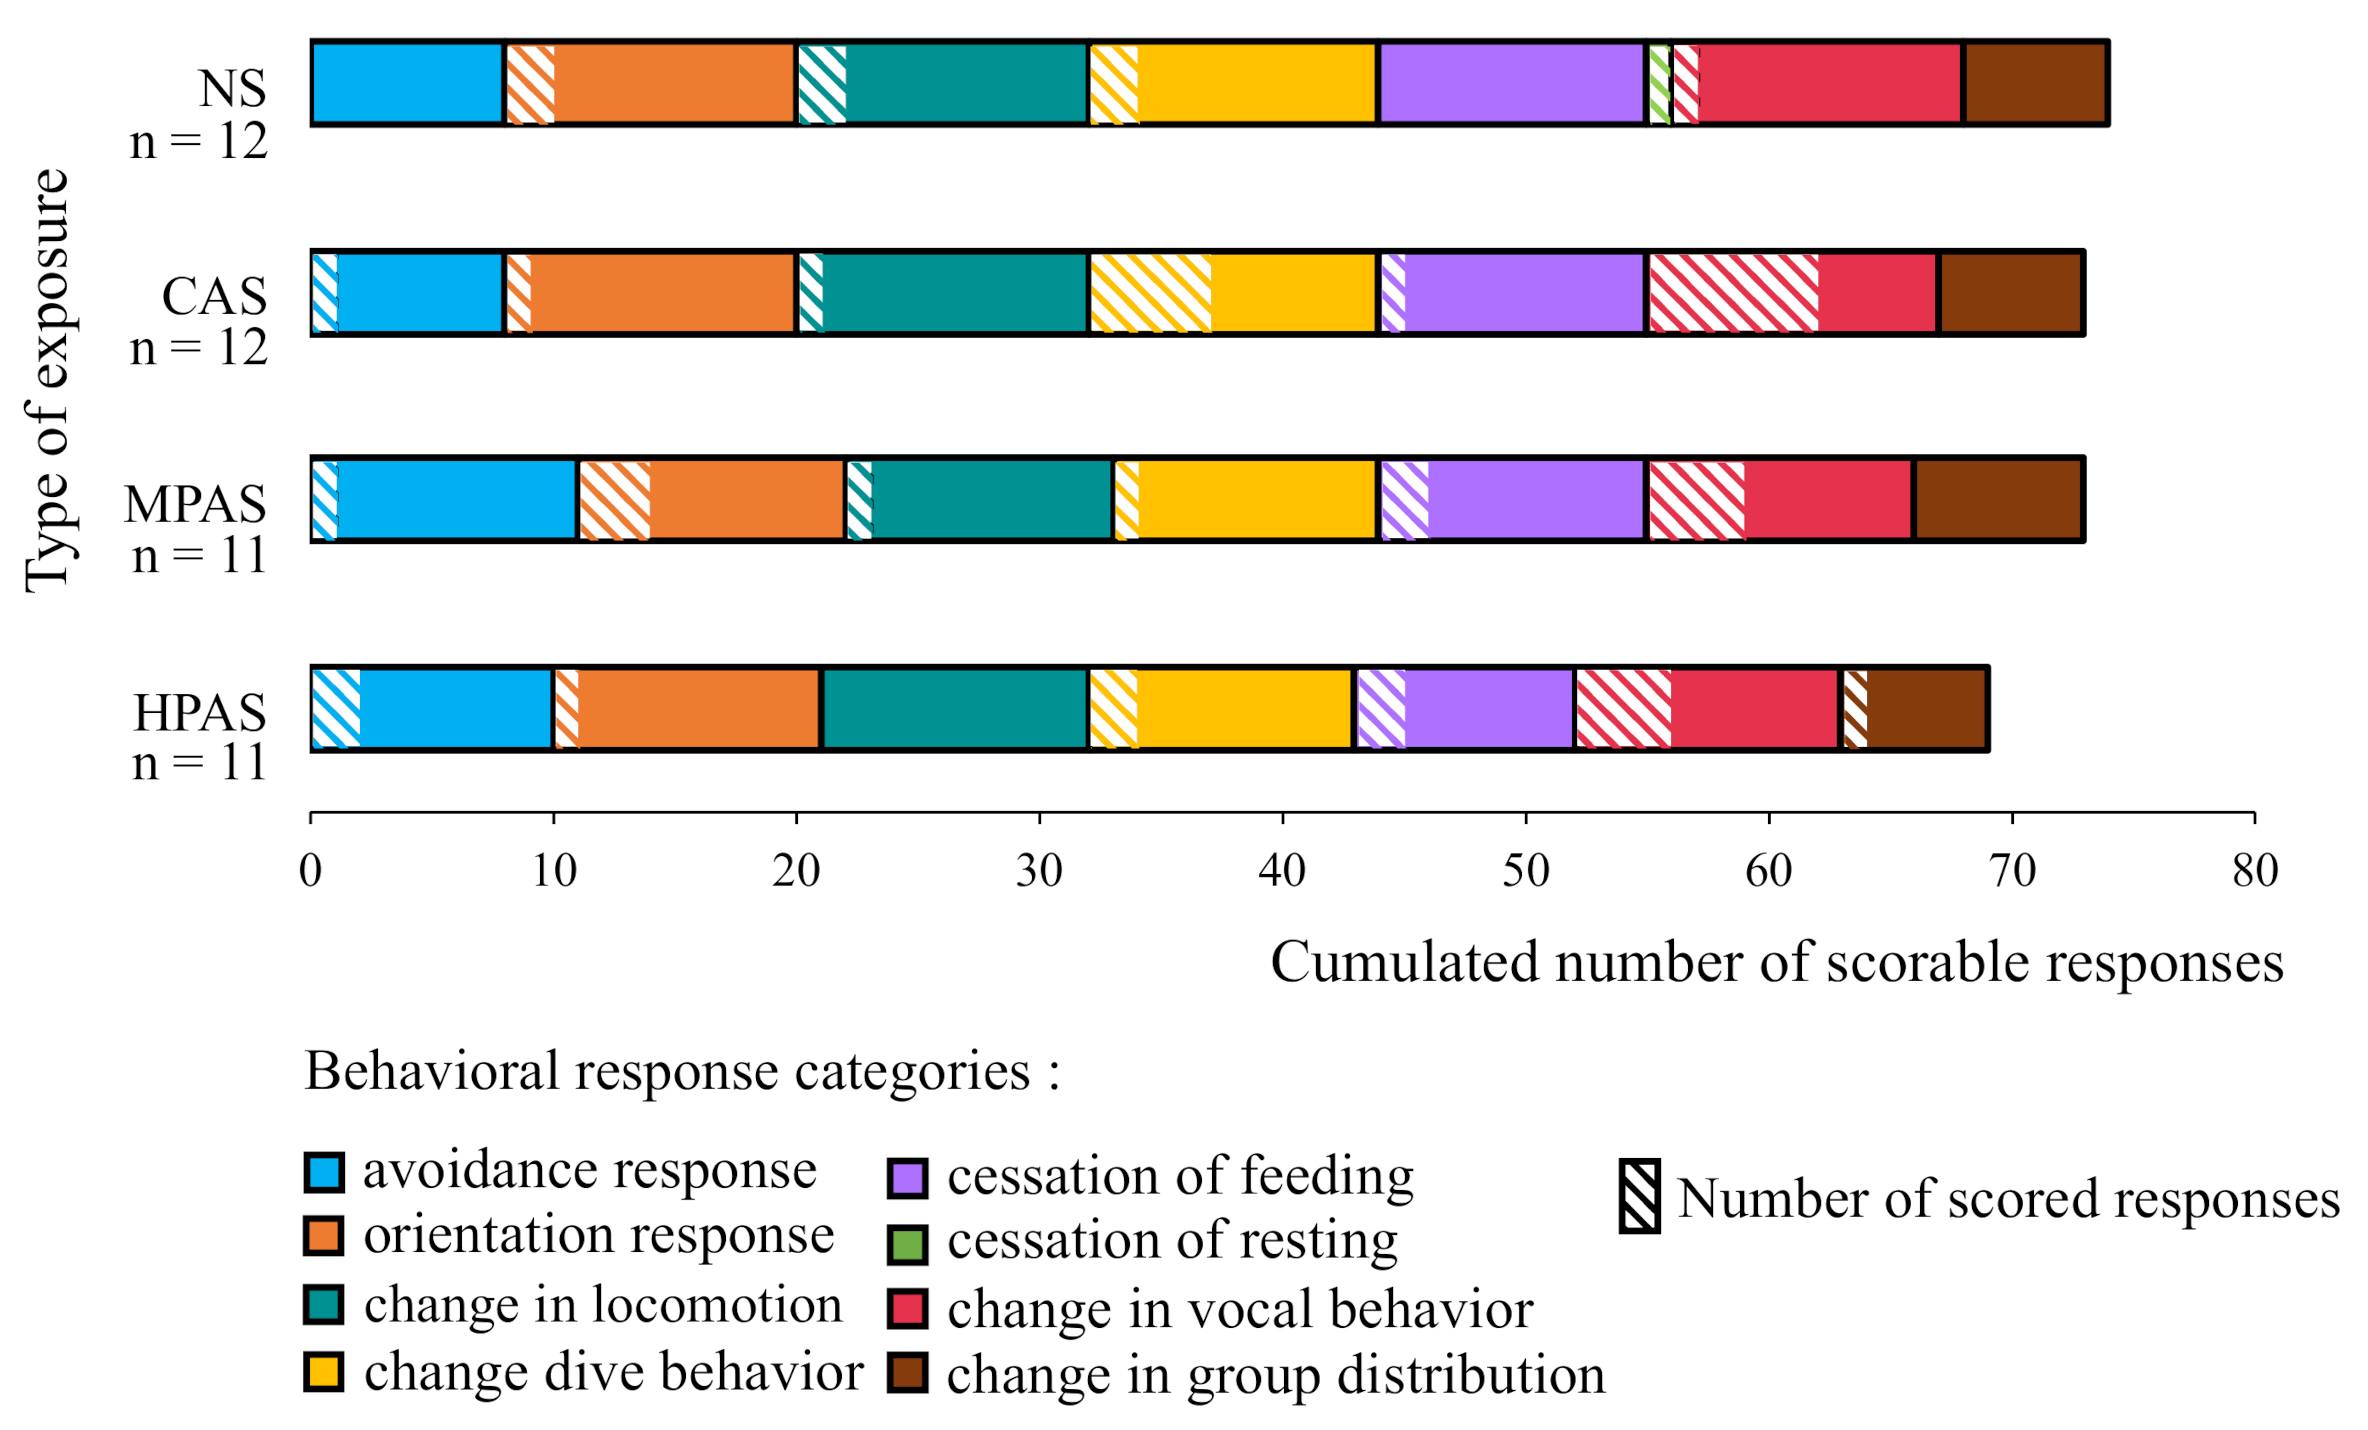
3.1. Scorability of the Data Across the Behavioral Response Categories and Exposure Types

In order to investigate potential differences in the ‘proportion of scored responses’ and ‘maximum score per session’ variables across the exposure types, we first inspected whether the scorability of experimental sessions, i.e., our ability to assess potential responses, were similar for all behavioral response categories and across the four exposure types (Figure 1).
Most behavioral response categories (orientation response, change in locomotion, change in dive profile, and change in vocal behavior) were scorable in all sessions, i.e., we were able to assess whether a potential behavioral change occurred (non-zero score) or not (zero score). In the focal whale dataset, for the four exposure types, the change in group distribution was scorable for half of the exposure sessions and the avoidance response category was scorable for two-thirds of the exposure sessions (Table S1). As predicted by the location of the studied population (on their feeding grounds), most whales were foraging immediately before an exposure session, making a potential cessation of feeding scorable for most exposure sessions. By contrast, it happened twice that a whale was in a resting mode at the start of an experimental session, making a potential cessation of resting scorable only for these two cases, one in the focal whale dataset (sw16_134a exposed to NS) and one in a non-focal whale dataset (sw17_182a exposed to MPAS). Therefore, the cessation of resting category of behavioral response could not be investigated across exposure types and was excluded from the statistical analyses.
The distribution of scorable sessions among all behavioral response categories except cessation of resting, was homogeneous across the four experimental conditions (NS, CAS, MPAS, HPAS), making the comparison of scored responses across the exposure types suitable for the remaining seven behavioral response categories.

3.2. Overview of the Scoring of Behavioral Responses

3.2.1. Expert Scoring Process

The scores of severity of responses made by the two teams of expert scorers were mostly the same and the adjudicator was needed only in two cases to achieve consensus (Table S1). For four identified behavioral scored responses of the focal whale dataset (sw16_126a exposed to MPAS: foraging and vocal behavior, sw17_191a exposed to NS: dive profile and sw16_130a exposed to MPAS: locomotion) and one of the non-focal whale dataset (sw17_182a exposed to HPAS: vocal behavior,), it was difficult to determine whether the change in behavior was a response to the exposure or a coincidental change. For instance, one focal whale (sw16_126a) was attributed a scored ‘cessation of feeding’ in response to MPAS although the scorers reported a low confidence in assigning this scored response given that an interruption of buzzing had occurred also during the baseline period. For those potential false positive cases, the scores of severity were noted as being of “low confidence” (Table S1), with provided justification. For two exposures, sw17_182b exposed to HPAS and sw16_134a subjected to NS, the tag came off prematurely about halfway into the exposure, precluding assessment of the duration of identified responses and of other behavioral changes that might have occurred over the remaining duration, thus leading to minimum estimates of severity.

3.2.2. Summary of Scored Behavioral Responses

Only two out of 14 focal whales and one out of two non-focal whales were judged not to have responded to any of the exposure types (i.e., no scored behavioral changes): sw16_131 (exposed only to NS), sw17_184 (exposed to NS, CAS and HPAS) and non-focal sw17_186a (exposed to NS, HPAS and CAS) (Table 2). Half of the 46 experimental sessions in the focal whale dataset elicited at least one scored behavioral response, i.e., a score different than zero attributed at least for one of the behavioral response categories assessed. Specifically, scored behavioral responses were obtained in response to 5 out of 12 NS trials, 7 out of 12 CAS trials, 4 out of 11 HPAS trials and 7 out of 11 MPAS trials. A total of 48 putative scored responses were assigned, of which 31 had a severity 1–3 (24 in response to sonar and 7 to NS) corresponding to responses considered not likely to influence vital rate, and 17 had severity 4–6 (16 in response to sonar, and 1 in response to NS), thus considered to have the potential to impact vital rates (Table 1). No behavioral response of severity higher than 6 was identified in this data set.

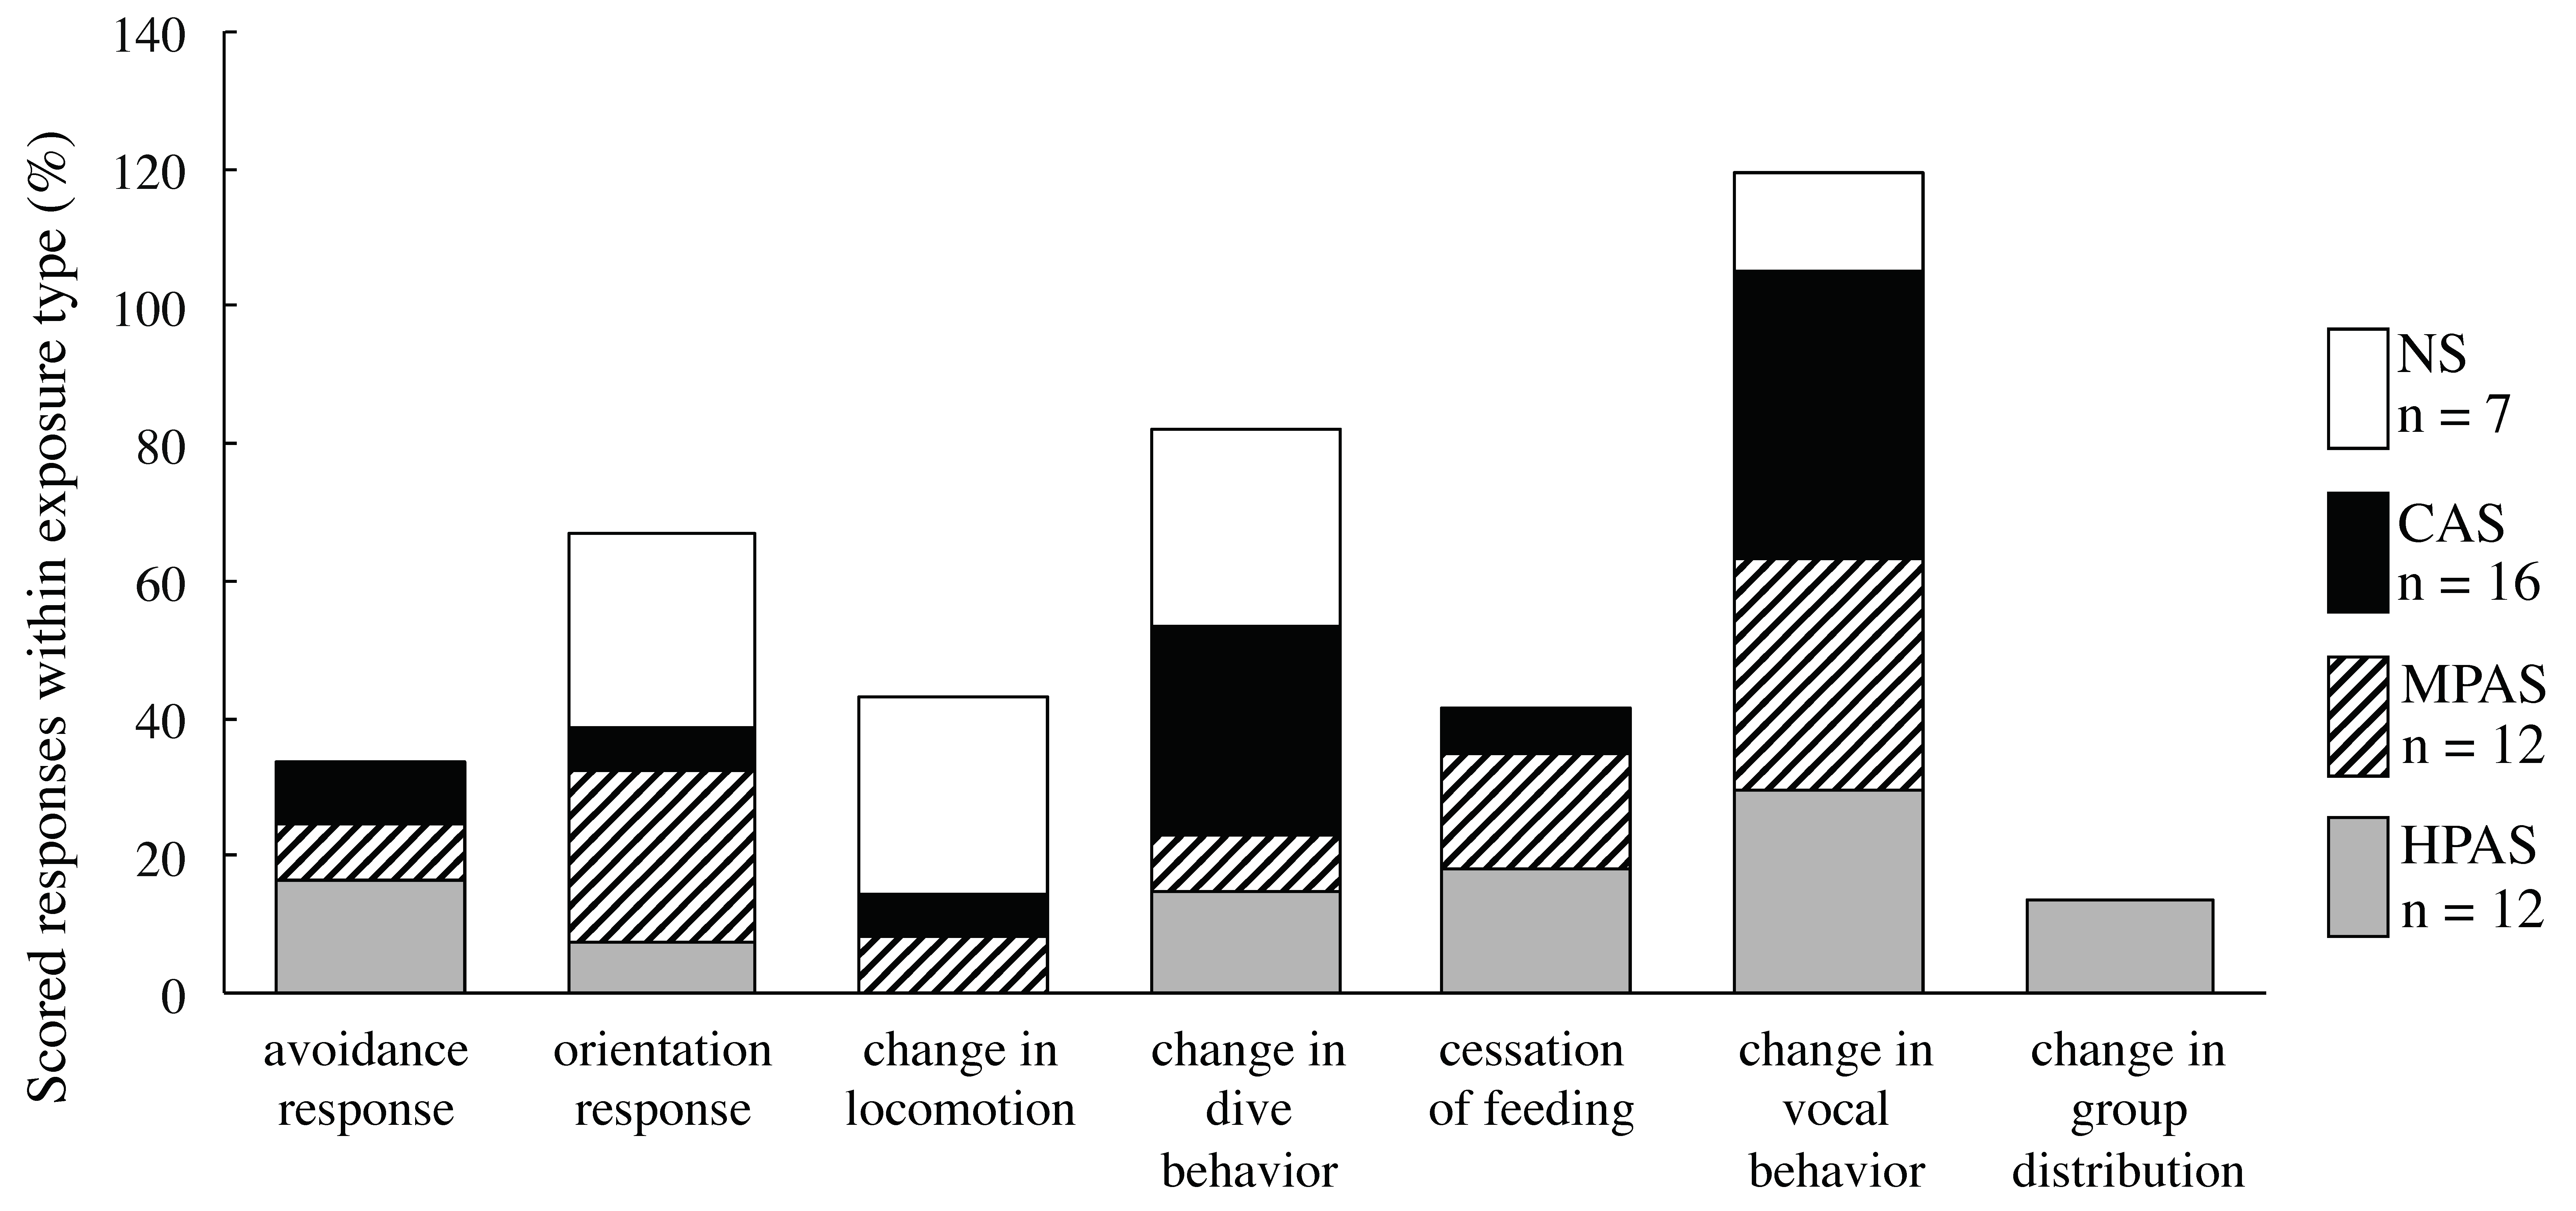
3.3. Description and Distribution of the Types of Behavioral Responses within Exposure Type

There was a high diversity of scored behavioral response categories assigned to the experimental exposures, with all behavioral response categories represented at least once in the total set of scored responses (Figure 1). The two scorable ‘cessation of resting’ cases were scored: one focal whale interrupted resting at least briefly in response to a NS exposure session (severity ≥ 4), and one non-focal whale ceased resting in response to MPAS for about the duration of the exposure (severity 6) (Table S1). The distribution of the other scored behavioral response categories varied across the experimental conditions (Figure 2). Scored behavioral responses to NS were mainly represented by orientation and locomotion responses of low severity and changes in the dive profile (together representing 86% of the scored responses), and to a lesser extent, by modifications in vocal behavior. Putative responses were also observed during sonar exposure sessions (Figure 2). Most of them had severities ranging from 1 to 3 (i.e., not likely to impact vital rates), and only two reached a severity 4 (i.e., that could impact vital rate) during CAS sessions (moderate change in the dive profile or moderate change in the vocal behavior).
Overall, changes in locomotion were mostly represented by a heading turn towards the source, orientation responses included primarily vertical wiggles, and changes in the dive profile corresponded mainly to switching to shallower and shorter dives (Table S1). Changes in vocal behavior represented a large part of the scored responses to the sonar exposures (30% for HPAS, 33% for MPAS, and 42% for CAS) compared to the NS (only 14%). They involved modifications in the production of foraging sounds and/or social sounds, and were scored more often in response to CAS (in 7 out of 12 CAS trials) compared to other exposure types (4 out of 11 for both HPAS and MPAS trials, and only 1 out of 12 NS trials). Modifications of social sound production included unusual occurrences of slow clicks, codas or other types of social sounds (trumpet sounds, clangs).
The scores of severity associated with changes in the production of social sounds had a maximum severity 4, obtained once during a CAS exposure session, whereas they were always ≤ severity 3 during HPAS, MPAS or NS sessions (Table S1). The production of codas occurred in response to all three sonar exposure types but never during NS. Moreover, for CAS sessions, 30% of the scored behavioral responses corresponded to changes in the dive profile (Figure 2), during 5 out of 12 CAS sessions (Figure 1, Table S1). Most of these changes in the dive profile were not accompanied with a scored cessation of feeding (i.e., the animal was still buzzing while diving). By contrast, changes in the dive profile contributed to less than 15% of the total scored behavioral responses for MPAS (only 1 out of 11 MPAS trials) and for HPAS (2/11 HPAS) and were always associated with concomitant cessation of feeding, i.e., interruption of buzzing (Figure 1 and Figure 2).
In addition to these types of behavioral changes, the sonar exposures were scored to have triggered changes in group distribution, and minor to moderate avoidance and cessation of feeding responses. These represented 45% of the scored responses to HPAS, 25% for MPAS and 19% of responses to CAS (Figure 2). These categories of behavioral response were never assigned a score in response to NS, indicating that these types of behavioral changes were specifically induced in response to sonar transmissions and not the vessel approach.
Avoidance and cessation of feeding were scored in response to all three sonar exposure types and represented the highest levels of severity of responses with a maximum score up to 5 for minor responses to CAS and up to 6 for moderate responses to both MPAS and HPAS (Figure S3). Change in group distribution was scored only in response to one sonar exposure session, a HPAS exposure (Figure 1 and Figure 2), during which a solitary whale (sw16_135a) grouped with another whale for at least the duration of one surfacing phase during the exposure (severity ≥ 3, Table S1). The portion of the dive immediately preceding the start of that exposure session coincided with sightings of killer whales (at about 5 min before the exposure started).

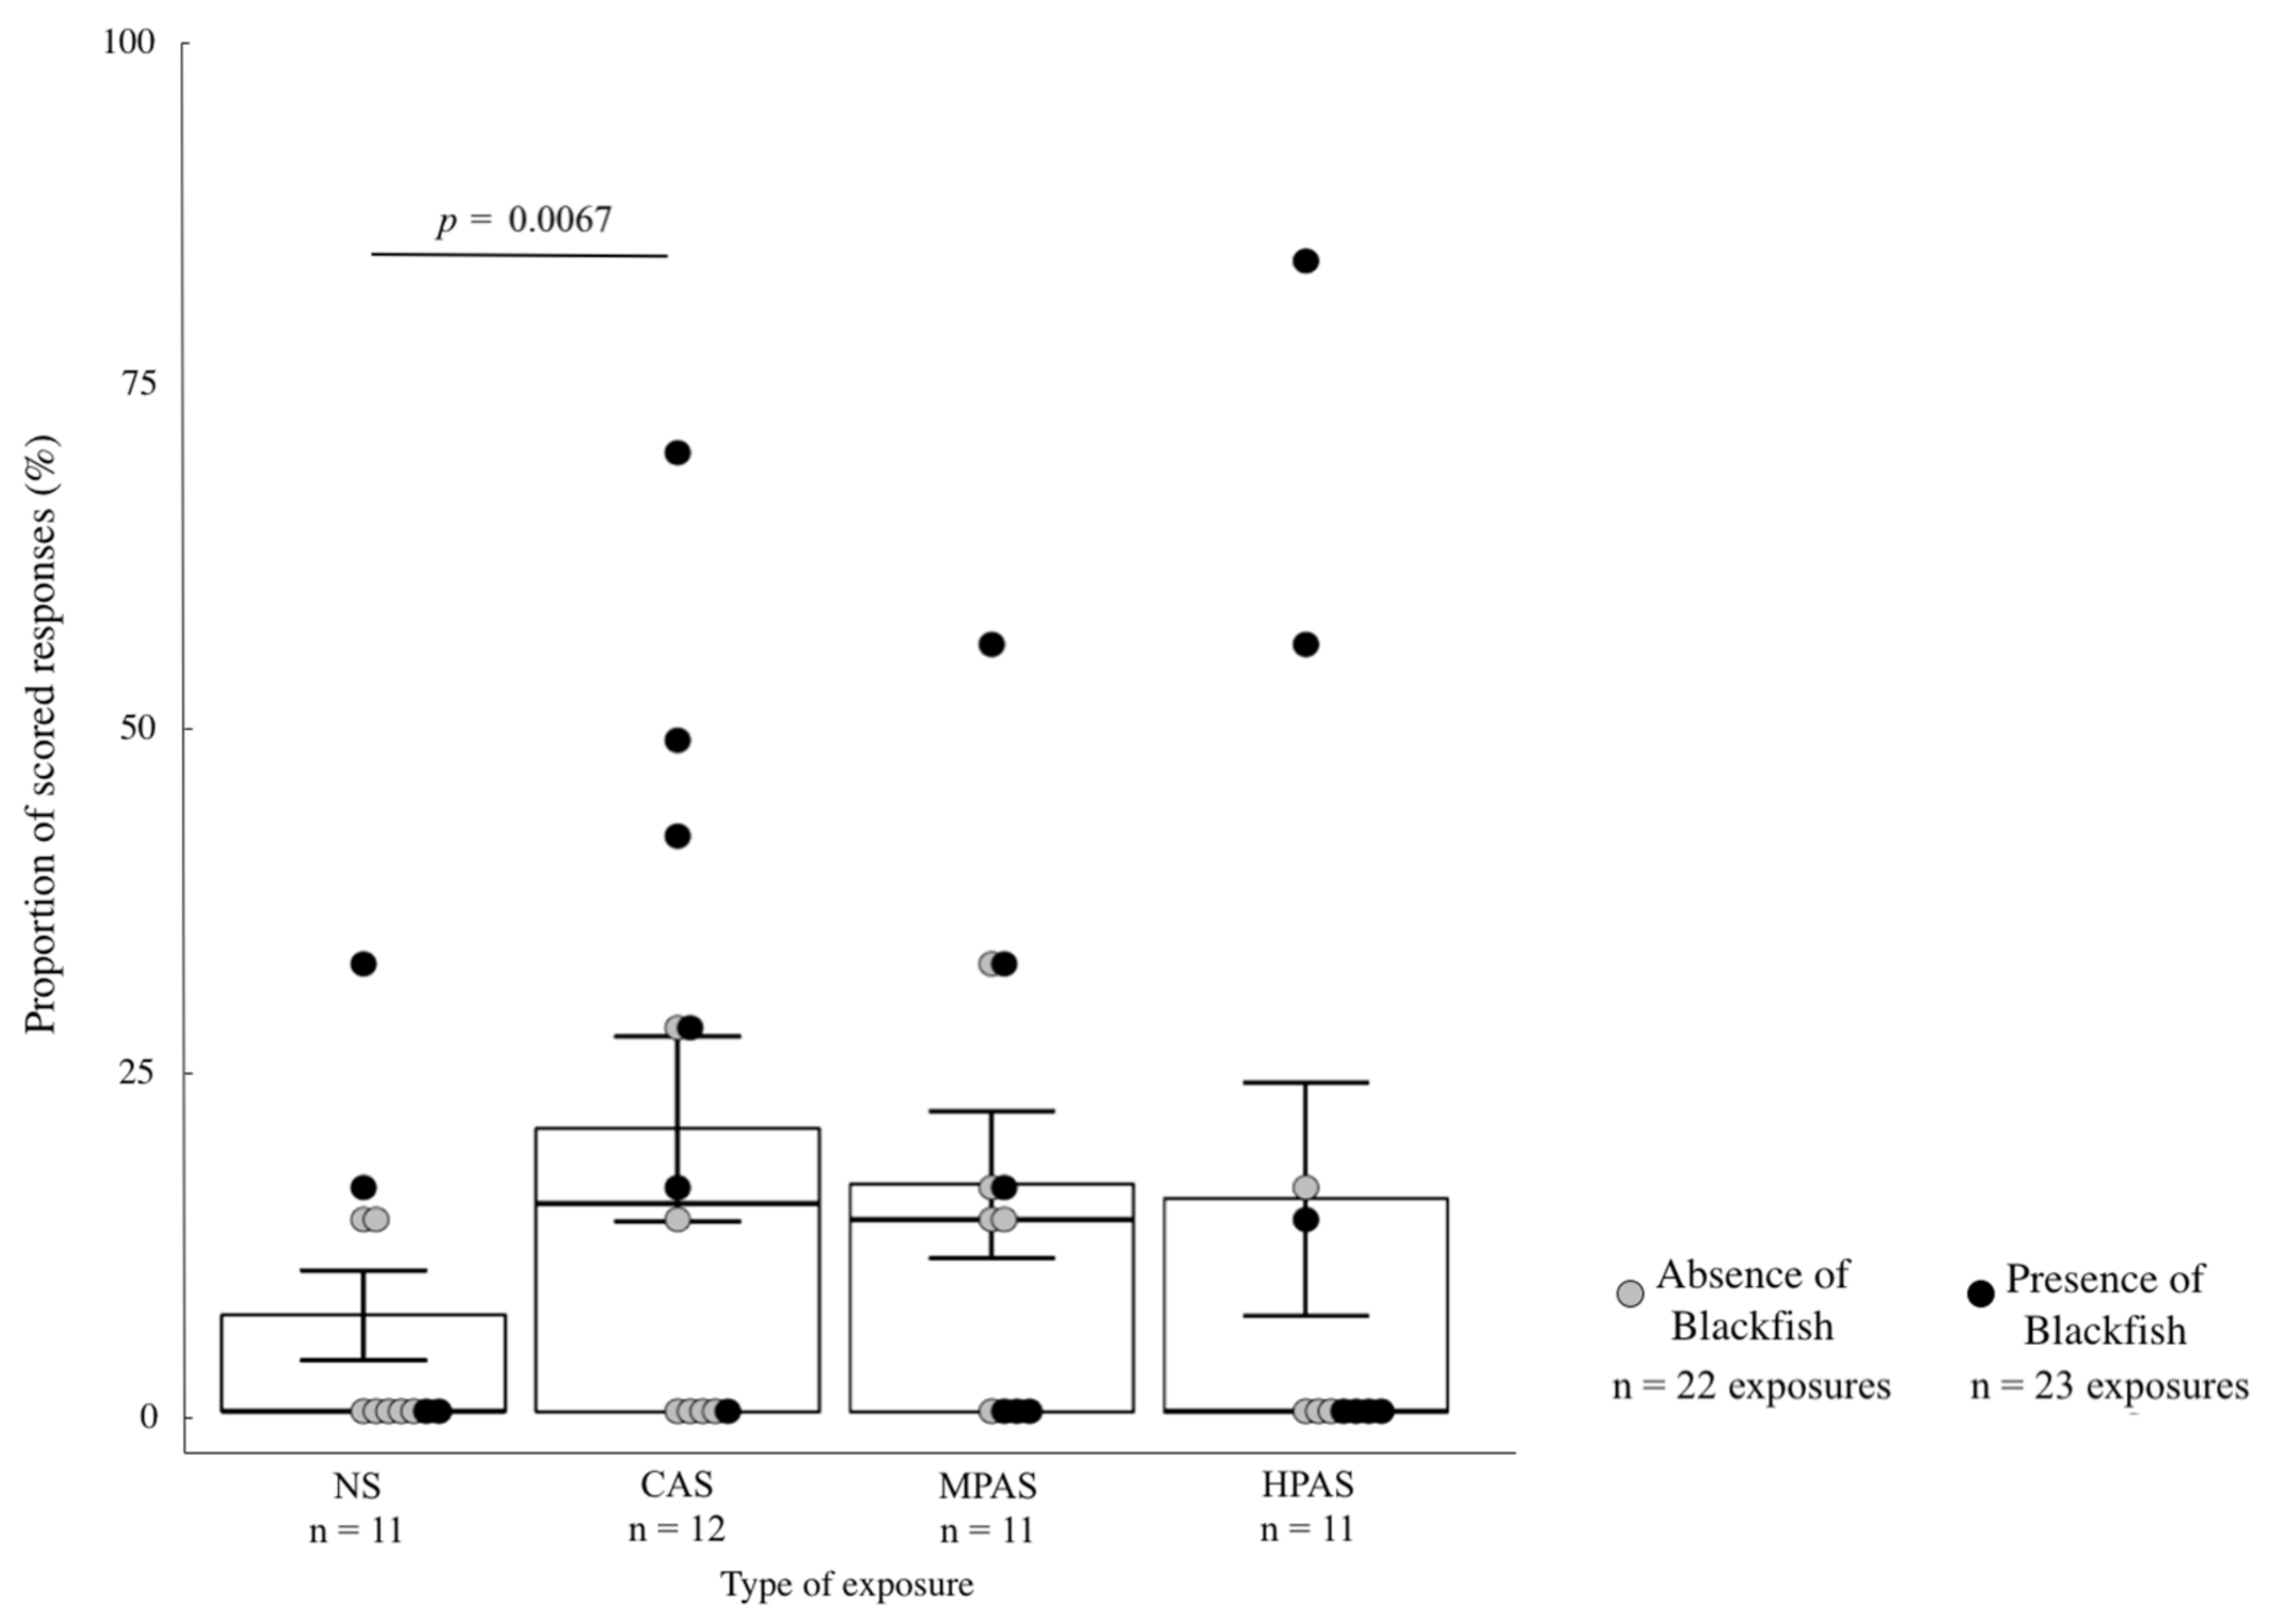
3.4. Quantitative Analysis of the Severity Scoring Variables in Relation to Exposure Type, Order and Recent Exposure to Blackfish

Each of the three sonar exposure types (CAS, HPAS, and MPAS) was presented as the first sonar exposure session four times, providing a well-balanced dataset for testing the potential influence of the first sonar session compared to the subsequent sonar exposure sessions (Table 2). Moreover, for about half of the total exposures of the focal whale dataset (four NS, and six of each of the three sonar exposure types), the whales had been subjected to a blackfish event within the 15 h preceding the start of exposure or during the exposure, allowing for investigation of the potential influence of blackfish exposure on the response variables.
The quantitative analysis was conducted on the focal dataset including the low confidence scores and responses of potentially under-estimated severity (e.g., when the tag had come off before the end of exposure, Table S1). Twelve out of the 14 focal whales were judged to have changed behavior in response to at least one of the exposure types (Table 2). Among the 10 responding focal whales exposed to both NS and sonar exposures, four were attributed scored behavioral changes in response to both NS and at least one of the sonar exposure sessions. In those four cases, the maximum of severity of scored responses ranged from 2 to 6 in response to sonar, versus 1 to 3 in response to NS (Figure S3). The six other whales were judged not to have responded to NS (severity 0 for all behavioral response categories) but were identified as having responded to one or more of the sonar exposure types, with a maximum severity score of up to 5.
The ANOVA conducted on the GEE models for the maximum score per session did not support any of the factors Signal, Order and Blackfish at 5% significance level, indicating that none of them substantially explained the variation in the dataset, precluding any further quantitative analysis on this response variable.
For the proportion of scored responses, the ANOVA applied to the GEE models retained the factors Signal (with Signal having two or four factor levels) and Blackfish in the best fitted model (p < 0.05 for each factor, Table S2). However, the ANOVA did not support Order in any of the models, indicating that there was no main effect of the first exposures compared to the subsequent sonar exposures on the proportion of scored responses (Table S2). GEE model with factor Signal represented by the two factor levels NS and Sonar (i.e., including all sonar types) showed that the proportion of scored responses was significantly higher in response to sonar exposures (18 ± 23%) compared to NS (7 ± 3%) (Table S3), meaning that the whales were more likely to respond to the approaching vessel towing a transmitting sonar than to the approaching vessel without sonar transmission. The results of GEE models with Signal represented by four factor levels (NS, CAS, MPAS, HPAS) showed that CAS led to a significantly greater proportion of scored responses (21 ± 7%) compared to NS (7 ± 3%). The mean proportion of scored responses were similar between MPAS (17 ± 5%) and HPAS (16 ± 9%), intermediate values compared to the lowest and highest proportion of scored responses represented by NS and CAS, respectively. However, MPAS and HPAS were not significantly different from CAS or NS (p > 0.2 for the pairwise comparisons HPAS vs. NS, HPAS vs. CAS, MPAS vs. NS and MPAS vs. CAS, Figure 3, Table S3).
For these GEE models (factor Signal with two or four levels), the Blackfish covariate had a significant main effect on the response, showing that the proportion of scored responses was more likely to be increased if whales had been recently exposed to blackfish, independent of the exposure type (Figure 3).

3.5. Severity of Scored Response in Relation to Received sound Pressure Level

Changes in behavior were scored with response thresholds over a large range of received sound pressure levels, from 86 to 175 dB re 1 μPa (SPLmax) and from 82 to 189 dB re 1 μPa2 s (SELcum) (Figure S4). The most severe scored responses (severity ≥ 4) were initiated by the tagged animal at received levels of 119–159 dB re 1 μPa (SPLmax) and 137–177 dB re 1 μPa2 s (SELcum) during CAS, and of 138–175 dB re 1 μPa (SPLmax) and 143–181 dB re 1 μPa2 s during PAS (HPAS and MPAS combined).
Stratified Cox models were fitted to the SELcum for responses of low (score 1–3) and moderate severity (score 4–6), as responses of high severity (score 7–9) were not observed. The selected model retained none of the covariates (Stimulus, Order or Blackfish). This null model had a slightly higher AIC (ΔAIC = 0.03) than the candidate model with only Stimulus, but two fewer degrees of freedom. All four candidate models with Blackfish violated the proportional hazards assumption (global p-value from χ2 test < 0.05), indicating a significant relationship between the Blackfish estimate and SELcum. They were thus excluded on that basis during model selection, although those models had the lowest AICs. Dose–response functions generated from the null model never reached a response probability of 0.5 for responses of moderate severity (Figure 4). For responses of low severity, a response probability of 0.5 was predicted to occur at a received SELcum of 173 dB re 1 μPa2 s (Figure 4).

4. Discussion

The primary goals of the present study were to assess whether CAS leads to significant effects on free-ranging sperm whale behavior, and to investigate whether these effects differ in type and severity from previously reported effects of PAS (e.g., [14]). Using visual observations and acoustic-movement tag data, we identified and described behavioral responses of sperm whales to experimental exposure to CAS and PAS as well as to NS, and scored their level of severity (depending on their type and duration) by the mean of an objective scale [4].
Sonar exposures induced a higher diversity of scored responses across behavioral categories, more scored responses, and greater severities of scored responses (up to severity 6) compared to NS (maximum severity 4 assigned in only one case). Avoidance and cessation of feeding, typically associated with moderately higher severity scores (5–6) than the other behavioral response categories, were only induced in response to sonar and not to NS. Most other scored categories of behavioral response were common between CAS and PAS but with a distribution that did differ across the sonar types. The proportion of exposure sessions with scored responses was significantly higher during CAS compared to NS—indicating that CAS transmissions led to a significant change in sperm whale behavior beyond any effect of the approaching vessel. This higher proportion of scored responses to CAS was not significantly different from the proportion of scored responses to PAS.

4.1. Responses to NS

Behavioral responses to NS allow separating the components of the responses specifically exhibited in response to sonar from those that could occur in response to the approaching vessel alone. Previous CEEs carried out on several cetacean species including sperm whales, and using the same basic experimental design as the one conducted in the present study but for which NS and sonar exposures order were randomized, showed that animals hardly changed behavior to NS, whether conduced as first or following previous sonar exposures [14,16,17,26]. Results of these previous studies showed more severe behavioral responses to sonar than to NS, and even more severe responses to predatory sounds exposures compared to sonar (humpback whales [19], sperm whale [16,17]). Responses to the predatory killer whale sounds playbacks conducted in 2008–2009 [14] and 2010 [17] were used as a positive control for characterizing sperm whales’ responses to a natural threatening stimulus, thus representing a yardstick of aversive reactions.
In the present study, NS was always conducted first allowing characterization of the response to NS excluding the effect of any potential sensitization to the vessel if the whales had been previously exposed to the vessel towing a transmitting sonar. When responding to NS, the focal whales made slight changes in horizontal and vertical movements, scored to be low severity responses. Such responses, ranging from severity 1 to 3, are unlikely to impact vital rate, and thus unlikely to lead to significant population effect. The fact that NS triggered some responses indicates that either the approaching vessel was perceived as a type of disturbance by the whales, and/or tendency of human observers to interpret and attribute behavior changes in relation to the exposure, when in fact these changes could be elicited by factors other than the experimental protocol.
In one single case of NS, a focal whale was attributed a scored response of moderate severity (score ‘≥ 4′), for an identified interruption of resting with potential under-estimated duration because the tag came off prematurely, ceasing data collection. Cessation of resting is, similarly to cessation of feeding, considered to potentially impact fitness if repeated with sufficient duration. The probability of whales to be in a resting state at start of an exposure was lower than to be in a feeding mode, given their time budget predicted about 80% of time spent in foraging mode versus 20% in resting and other activities [26]. There was a second case of scored cessation of resting obtained in a non-focal whale exposed to MPAS (severity 6). Proximity to the sea surface during shallow resting dives [25] could be a factor driving responsiveness to an approaching vessel, and further data would be needed to compare the effects (probability and duration of response) of sonar and NS on this behavioral response category.

4.2. Responses to Sonar and Influence of Exposure Type

Response durations to sonar were identified as brief (<5min) to moderate (i.e., 30–60 min), with scored response severities ranging from 1–3 (not likely to impact vital rates) to 4–6 (considered to have potential to impact vital rates). No high-severity responses (7–9, likely to impact vital rates) were identified. A high diversity in behavioral response categories was found in response to all types of sonar: changes in the dive profile, changes in vocal behavior, orientation and/or locomotion responses, as well as avoidance and cessation of feeding. The two latter behavioral response categories were specific to sonar (they never occurred in response to NS) and had the highest severity scores (5–6) in the whole dataset. These two behavioral response categories carry a potential to impact fitness even for relatively short-term responses (severity 4 for brief duration in the scale) and they are typically part of an antipredator strategy. This highlights their biological relevance and indicates that they represent higher level disturbance similar to immediate predation risk.
The distribution of the other behavioral change categories varied with sonar exposure type. In particular, changes in vocal behavior including changes in the production of social sounds were more frequently observed in response to CAS than to PAS signals. Given the high duty cycle of CAS, it is possible that animals need more adjustment in their vocal behavior than when they are exposed to PAS, which leaves more time without sound masking between the sonar pulses. Further studies could focus on vocal responses to CAS to investigate masking effect and potential effects on the efficiency of foraging (regular clicks and buzzes) and communicating with congeners (social sounds). Moreover, changes in the dive profile in response to CAS were scored more often than for PAS, and those changes were not always associated with a cessation of feeding response scored for PAS sessions.
Four HPAS exposures were previously conducted in 2008 and 2009 (named as ‘LFAS’ exposures in [14]) using a similar experimental protocol as the HPAS exposures of the present study except that the ramp-up period lasted 10 min followed by 30 min full-power transmission and the vessel approach could turn towards the whale during the exposure until it was 1km away from the whale (instead of 20 min followed by 20 min full power in the present study, with the source vessel driven in a straight course throughout). The suite of behavioral change types identified in response to HPAS conducted in the present study was comparable to the one described to previously conducted HPAS exposures [14], except for one HPAS session in our dataset that obtained a scored change in group distribution. The grouping behavioral response had previously only been observed in response to predatory sound exposures, not to sonar, thus had been interpreted as a specific response component of the antipredator strategy [17]. It could be that some individuals perceive HPAS as a particularly high level of threat, leading to potential behavioral response components similar to antipredator behavioral strategy, such as the grouping behavior response. The presence of killer whales during the pre-exposure period of this HPAS session, might have sensitized those whales’ responsiveness to sonar, resulting in social cohesion.
Overall, 10 out of 12 focal whales responded during at least one exposure session, however, half of the total exposure sessions obtained no scored responses i.e., they were judged not to have induced any behavioral changes. This observation indicates the relatively low probability of responses in the sample of tested subjects which concurs with the observation made by Isojunno et al. [19] who pointed out that the current study’s (2016–2017) sperm whale subjects appear less responsive than the subjects tested in the same area 7–8 years ago with controlled PAS exposures (2008–2009, [14]). Moreover, the maximum scores per session in the present study had broad ranges for all sonar types: from 2 to 6 in response to HPAS, 1–6 in response to MPAS and from 2 to 5 in response to CAS). This finding indicates interindividual or other interdeployment contextual variability within exposure type, which contrasted to the consistent maximum score of 6 represented by moderate avoidance or cessation of feeding responses obtained in the four subjects that responded to the HPAS exposures conducted in 2008–2009.
In addition to the changes in exposure protocols detailed above, a possible explanation of this apparent reduced sensitivity to sonar in the 2016–2017 individuals dataset could be that these animals have been more exposed and habituated to the lower frequencies used by modern naval sonars. Naval sonar in the 5–10 kHz band has been commonly used in this area since the 1960s, but low frequency sonars in the 1–2 kHz band are a fairly recent technological development only used frequently the last 10 years. The 1–2 kHz sonar exposures conducted in 2008–2009 might have been perceived as a more novel stimulus for the whale populations, than in the current dataset. Such apparent tolerance to sonar could lead to underestimation of responses in a population living in a more pristine habitat devoid of naval sonar exercises. Novelty has been indeed suggested to potentially influence the probability of responses in marine mammals [42], including cetacean species (e.g., long-finned pilot whales [43] and bottlenose whale [15]).
There were no clear trends of individuals responding with a higher probability to one or the other sonar exposure types. The statistical analysis of the proportion of scored responses confirmed this observation: the proportion of scored responses was not significantly different between CAS and PAS. However, the proportion of behavioral scored responses to CAS was significantly higher compared to NS showing that CAS has a significant effect on sperm whale behavior. The proportion of scored response was not found to have been significantly different between PAS and NS. While our analysis accounted for Blackfish presence, other contextual variability across exposure sessions is likely to explain this result.
The motivation to include three sonar types (CAS, MPAS and HPAS) in the experimental design was to disentangle the effects of duty cycle, sound energy (SEL) and sound amplitude (SPL) as the main driver of behavioral responses. Using the same dataset, Isojunno et al. [19] used quantitative state switching analysis focusing on the effects of CAS vs. PAS on foraging effort. The authors found significant and similar reduction of foraging effort in response to both CAS and HPAS, but not to MPAS. Since CAS and HPAS exposures will have the same received sound energy level, but HPAS will have much higher peak pressure level, this result led to the conclusion that received sound energy levels might be an important driver of the response [19]. Here we did not find clear evidence of whether duty cycle, sound energy or amplitude best predicted probability of response given there was no significant differences of probability of scored responses between the three sonar signals and that all of them could lead to a broad range of max scores ranging from low (1–3) to moderate severities (4–6). The main difference between Isojunno et al. 2020 [19], and this study is that Isojunno et al. 2020 focused on feeding behavior, whereas our analysis combines different behavioral response types into one metric of response.
Given only CAS led to significantly increased proportion of scored responses compared to NS, one could conclude that the duty cycle might be a main predictor of response. However, the proportion of scored responses was not significantly different between CAS and PAS, refuting this hypothesis. The nonsignificant results to PAS vs. NS are likely due to a combined low sample size and high interindividual variability. Comparing the behavioral types between responses to MPAS and HPAS, there was no significant differences in their proportion of scored responses, and the description of max scores per session showed comparable ranges between the two (max score 1–6 in response to MPAS, and 2–6 in response to HPAS). Since HPAS had higher SPL and SEL levels than MPAS, this result indicates that received levels of sound are not a particularly reliable metric to predict the severity of responses. Further data is needed to confirm this outcome, given the high variability between individuals of the present individual dataset. Moreover, the MPAS scores dataset contained some uncertainties (particularly with the low confidence scores) which might have overestimated the proportion of scored responses to this sonar type.
In their study, using the same dataset, Isojunno et al. [19] found more cases where individuals switched from foraging to nonforaging states compared to the number of ‘cessation of feeding’ events scored in the present study. Moreover, they found a significantly higher reduced foraging effort in response to CAS and HPAS compared to MPAS whereas we did not find any evidence of differences in the proportion of scored responses (combining all response categories) across the three sonar types. In the present study, the distribution of behavioral response categories across exposure type did not show indication of more cessation of feeding in response to CAS and HPAS compared to MPAS. The reason for such apparent differences between studies can be explained by different analytical approaches. Here we looked at various potential behavioral response categories among which a ‘cessation of feeding’, that was defined as an interruption of buzzing, whereas Isojunno et al. [19] quantified the alteration of foraging effort (activity time budget) and two proxies (i.e., fluke stroke rate and buzz presence, given an activity state, indicating locomotion costs and foraging success, respectively). Movement behavior and the concurrent presence of echolocation (irrespective of type—regular or buzz clicks) were used to inform about the activity state of the whales, whereas here, buzzes were used as the primary indicator for cessation of feeding; indeed, Isojunno et al. [19] did not find differences in buzz rates between CAS vs. PAS exposure either. Moreover, in the present study, we tested for the proportion of scored responses combining all types of behavioral response categories, not only the cessation of feeding. With this analysis, we expect that the greater an individual will be impacted, the higher the number of exhibited behavioral change types, so the higher the proportion of scored responses (independently of their nature).
Previous meta-analysis study showed the importance and complementarity of different analytical approaches to fully describe behavioral responses of whales to sonar or other stimuli [17]. Similarly, the present study brings complementary information to the one of Isojunno et al. [19].

4.3. Severity of Response to Sonar Related to RL Thresholds

It is useful to correlate responses to sonar with the dose of acoustic level received by the whale, as this information can be used by navies and other anthropogenic noise producers to predict the behavioral disturbance impact of their activities. Severity of scored responses to sonar ranged from unlikely (1–3) to potentially (4–6) affecting vital rates, with response onsets occurring over a broad range of received levels for all sonar types (Figure S4). Overall, thresholds of RLs were higher for responses of moderate severity (4–6) than for responses of low severity (1–3). Response thresholds in terms of SELcum ranged from 114 to 181 dB in response to HPAS, from 82 to 166 dB in response to MPAS, and from 114 to 189 dB in response to CAS. By comparison, previous studies with HPAS also showed a broad range of response threshold SELcum ranging from 120 to 168 dB re 1 μPa2 s [14].
The dose–response functions derived from our data predicted a low severity response probability of 0.5 at a received SELcum of 173 dB re 1 μPa2 s whereas there was no prediction to reach a probability of 0.5 for moderate severity responses. Using the same type of analysis, Harris et al. 2015 [38] found 0.5 probability of moderate severity responses around 140 dB SELcum in feeding sperm whales in the same area. The fact that sperm whales seem less sensitive in our study could be explained by a habituation over time to low frequency sonar or the combination of an insufficient sample size for the responses of moderate severity (the dose–response analysis only considered the first response onset of the session irrespective of category) and interindividual variability of responses that together prevented to reach the probability of 0.5. Our data suggested that the severity of responses cannot be accurately predicted by the RL alone, because of large variability in response threshold for most severity scores (Figure S4), which was also observed in previous CEE studies conducted on sperm whales and other cetacean species [14,20].
Beside the potential of a higher tolerance of the sample of subjects to sonar compared to the population tested in 2008–2009, that might partly explain interindividual variation in the responses to sonar, other key questions remain regarding potential other influencing factors.
A large suite of other factors might have influenced responses to sonar: individual factors such as age, body condition, experience (e.g., habituation), environmental variation such as bathymetry, resource quality or distribution [44]. In addition, even when in the feeding grounds, sperm whales could be in a different behavioral state and at different stages of those behavioral states (at start or end of a resting phase for instance), which might lead to different perceived trade-off between the costs and benefits of interrupting their activity.

4.4. Responses Related to Order of Exposures

Previous studies pointed out potential short-term habituation or sensitization to successive exposures (i.e., respectively, an attenuation or amplification of a response over repeated exposures). For instance, Sivle et al. [20] showed that some humpback whales responded less to a second sonar session compared to the first one. However, statistical analysis did not support any order effect in previous sonar exposures conducted in sperm whales and several other cetacean species [14]. That said, a small reduction in buzz rates was found during and post repeated exposures when the first exposure was received at high sound exposure levels [19].
Similarly, we show here that the order of exposure was unlikely to influence neither the proportion nor severity of scored behavioral responses. Indeed, responses of moderate severity (≥ 4) occurred during first or subsequent exposures. One individual (sw17_188a) exposed to two successive CAS exposure sessions obtained in both cases scored changes in the dive profile and in the vocal behavior showing no apparent habituation even in this case when the same stimulus was repeated. Moreover, statistical analyses showed that the proportion of scored responses was not significantly different between first and subsequent exposures. However, further data are needed to test potential effect of the interaction between the order and other covariates such as the exposure type, on the probability of responses or other response variables.

4.5. Responses Related to Blackfish Presence

Effect of anthropogenic disturbances on prey behavior by increasing their level of vigilance to predation is reviewed in [45]. However, the corollary, i.e., that increased predation risk can influence the degree of alert/reaction to other stressors such as anthropogenic disturbances or other potential predators, has been much less considered (e.g., in ungulate species: [46,47]). In the marine environment, herring (Clupea harengus) exhibit stronger antipredator responses to visual predator cues when previously exposed to predator sounds [48]. Heterospecific context could have potential influence on cetacean responsiveness to anthropogenic disturbance such as sonar. The detection of potential predatory killer whales triggers consistent and clear behavioral responses in many cetacean species including sperm whales [37,43,49]. Given blackfish species might represent potential threatening stimulus for sperm whales, we thus suspected that their presence could influence the whales’ behavior and responses to sonar.
Our results clearly showed that whales were more likely to respond to sonar when they had been recently exposed to blackfish events. These results are in line with previous analyses using the same dataset that showed that the whales exposed to blackfish species were more likely to switch from foraging to nonforaging active states during subsequent sonar exposures [19]. Finding the same potentiating effect of blackfish species on the response to sonar using two different analytical approaches and a range different response metrics substantially increased our confidence in this result.
Moreover, the only case of grouping behavior in the present study was during a HPAS exposure (sw16_135a) for which blackfish were present. Blackfish were acoustically detected during the pre-exposure dive immediately preceding the surfacing during HPAS exposure where the tagged whale was sighted together with other whales. It is possible that this rarely observed grouping behavior, thought to be a specific component of the antipredator behavioral response [49], was induced by the presence of killer whales rather than in response to sonar. Other types of behavioral changes composing the antipredator behavioral template such as the occurrence of codas production might have been also potentiated by blackfish presence.
Killer whales present in the area are mostly fish-eating killer whales which might not represent a predator threat for sperm whales. Sperm whales may be able to discriminate acoustically between mammal-eating and fish-eating killer whales as has been shown in other marine mammal species (pinnipeds: [50]; cetaceans: [43,51]). If not perceived as a risk of predation, the presence of blackfish species might still represent a type of threat associated to the competing interest with sympatric species to exploit of the same habitat [43]. Moreover, it could be that both blackfish species, i.e., pilot whales and killer whales, that we were not always able to distinguish, lead to different behavioral responses and that they influenced the response to sonar differently. Pilot whales are not predators of other cetacean species and detecting their presence might be perceived as less threatening than detecting killer whales, so we could expect less costly responses in sperm whales when exposed to pilot whales. Further studies are needed to characterize their reaction to the detection of pilot whale or fish-eating killer whale presence and to disentangle the potential different effects of the two blackfish species on sperm whale behavior.
Our results indicate that cumulating sonar exposure with natural stressors such as threatening blackfish species present in the area can potentiate the probability of response to sonar. An increased vigilance priming by predator presence or other interspecific threats might further exaggerate such effects in a synergistic, rather than additive, cumulative impact.

4.6. Remarks on the Scoring Method

Another aspect that might have introduced variability in our data, and thus uncertainty in the estimated sonar–response relationships, was some low confidence scores which could have actually been no-responses, and the potentially underestimated scores (noted as ≥). All these cases of uncertain scores were obtained for PAS sessions (mainly for MPAS) and to a less extent to NS but never for CAS sessions. Moreover, some behavioral changes could be caused by other factors rather than by our exposures and led also to low confidence scores.
Some heterogeneity in the quality of the collected data could increase the difficulty to identify behavioral changes. In particular, on a few occasions, the low quality of the track and limited group size data prevented the possibility to assess avoidance and group distribution behavioral response categories whereas the other behavioral response categories were almost always scorable. In order to minimize the introduction of such bias in the scoring data, the scoring protocol was supplemented by a judgment of scorable versus unscorable behavioral response categories [17] and we decided to exclude for some exposures, the behavioral response categories judged to be impossible to assess. Changes in horizontal movement and social responses are two main important aspects of behavioral responses to sound stimuli in many cetacean species including sperm whales (e.g., avoidance and grouping behavior). This highlights the importance of a sufficient quality data on the related parameters i.e., the whale track and group size.
An improvement of the scoring protocol presented here compared to previous ones [14,20] is the implementation of a blind procedure where scorers were blind to the experimental condition. One caveat we think relevant to advise though is related to the fact that NS was always the first experimental session, resulting in the pre-exposure immediately following the baseline period only for the NS sessions and never for the sonar sessions. To deal with this constraint and in order to prevent the identification of the sonar versus NS session types, we had to disconnect the pre-exposure from baseline. Despite those adjustments, the feasibility of a blinding procedure was proven in the present study, and we encourage its use in future severity scoring studies.

5. Conclusions

This study provides rich descriptive material of the behavioral responses of free-ranging sperm whales to short-term CAS and PAS naval sonar experimental exposures and no-sonar controls.
The overall low probability of the animals to respond to sonar, high variability of responses between individuals within exposure type, and the potentiating influence of blackfish presence reduced the power of statistical analysis (e.g., for ‘max score per session’ variable), weakening our ability to accurately disentangle substantial differences in responses to the different sonar types.
However, the descriptive analyses clearly show that various behavioral change types, including avoidance and cessation of feeding that are considered having some potential to impact vital rate (if the exposure is of sufficient duration or repeated), occurred in response to all sonar types, and that the distribution of the behavioral response categories could vary with sonar type. Responding animals exhibited more responses, and more severe responses, to sonar compared to no-sonar controls. Moreover, the statistical analysis showed that the proportion of scored responses (all behavioral response categories combined) was significantly greater in response to CAS compared to NS, but responses to CAS were not statistically different from responses to PAS. Further data are needed to better characterize differences in responses to CAS and PAS within each behavioral response category and to understand the underlying mechanisms of such responses.

Supplementary Materials

The following are available online at https://www.mdpi.com/article/10.3390/jmse9040444/s1, Figure S1: Amplitude (arbitrary unit) and frequency (Hz) over time (s), at top and bottom, respectively, for both PAS (left) and CAS (right) signals, Figure S2: Example of standardized data plots of the tagged sperm whale sw17_182b during the time period from 60 min prior to a CAS exposure (random exposure RE #15) to 60 min after the exposure, Figure S3: Maximum score of severity per session across the four exposure types (NS, CAS, HPAS and MPAS) for the total number of exposure sessions (N = 46), Figure S4: Severity of the 40 scored behavioral responses of the focal whale dataset versus received level thresholds of the corresponding response onsets across the three types of sonar exposures CAS (diamond), MPAS (circle) and HPAS (cross), Table S1: Severity scoring panel results, Table S2: Results of the ANOVA (sequential Wald test) showing the contribution of each factor to the final fitted GEE models applied to the ‘Proportion of scored responses’, Table S3: Results of the GEE models fitted to the ‘Proportion of scored responses’ variable.

Author Contributions

Conceptualization, C.C., S.I., M.L.S., P.J.W., P.H.K., F.-P.A.L., P.J.O.M.; methodology, C.C., S.I., M.L.S., P.J.W., P.H.K., F.-P.A.L., P.J.O.M.; formal analysis, C.C., S.I., C.B., P.J.W.; investigation, C.C., S.I., M.L.S., P.J.W., L.D.S., B.B., R.R., P.H.K., F.-P.A.L., P.J.O.M.; writing—original draft preparation, C.C.; writing—review and editing, C.C., S.I., M.L.S., P.J.W., C.B., L.D.S., B.B., R.R., P.H.K., F.-P.A.L., P.J.O.M.; visualization, C.C., S.I., P.J.W., C.B.; resources, C.C., P.H.K., F.-P.A.L., P.J.O.M.; data curation, S.I., P.J.W.; supervision, C.C., P.H.K., F.-P.A.L., P.J.O.M.; project administration, C.C., P.H.K., F.-P.A.L., P.J.O.M.; funding acquisition, C.C., P.H.K., F.-P.A.L., P.J.O.M. All authors have read and agreed to the published version of the manuscript.

Funding

This research was funded by four naval organizations: the US Navy Living Marine Resources program (LMR), the Netherlands Ministry of Defence, the UK Ministry of Defense (Dstl) and the French Ministry of Defense (DGA-TN).

Institutional Review Board Statement

The study was conducted according to the guidelines of the Declaration of Helsinki and approved by the Animal Welfare Ethics Committee of the University of St Andrews (UK). All animal research activities were licensed under permit provided by the Norwegian Animal Research Authority (Permit n° 2015–223 222).

Informed Consent Statement

Not applicable.

Data Availability Statement

All data needed to reproduce these results are available in a published data report (see [18]).

Acknowledgments

We thank all 3S (Sea mammals, Sonar, Safety) team members and captain and crew members of the FFI R/V H.U. Sverdrup II vessel for their collaborating efforts in participating to field works. We thank Sander van IJsselmuide for his contribution to Figure S1.

Conflicts of Interest

The authors declare no conflict of interest.

References

  1. Richardson, W.J.; Greene, C.R.; Malme, C.I.; Thomson, D.H. Marine Mammals and Noise; Academic Press: San Diego, CA, USA, 1995; ISBN 978-0-12-588441-9. [Google Scholar]
  2. Tyack, P.L. Convergence of Calls as Animals Form Social Bonds, Active Compensation for Noisy Communication Channels, and the Evolution of Vocal Learning in Mammals. J. Comp. Psychol. 2008, 122, 319–331. [Google Scholar] [CrossRef]
  3. Miller, P.J.O.; Antunes, R.N.; Wensveen, P.J.; Samarra, F.I.P.; Catarina Alves, A.; Tyack, P.L.; Kvadsheim, P.H.; Kleivane, L.; Lam, F.-P.A.; Ainslie, M.A.; et al. Dose-Response Relationships for the Onset of Avoidance of Sonar by Free-Ranging Killer Whales. J. Acoust. Soc. Am. 2014, 135, 975–993. [Google Scholar] [CrossRef] [PubMed]
  4. Southall, B.L.; Bowles, A.E.; Ellison, W.T.; Finneran, J.J.; Gentry, R.L.; Greene, C.R.; Kastak, D.; Ketten, D.R.; Miller, J.H.; Nachtigall, P.E.; et al. Marine mammal noise exposure criteria: Initial scientific recommendations. Aquat. Mamm. 2007, 33, 411–414. [Google Scholar] [CrossRef]
  5. Southall, B.L.; Nowacek, D.; Miller, P.J.O.; Tyack, P.L. Experimental Field Studies to Measure Behavioral Responses of Cetaceans to Sonar. Endang. Species Res. 2016, 31, 293–315. [Google Scholar] [CrossRef]
  6. Frantzis, A. Does Acoustic Testing Strand Whales? Nature 1998, 392, 29. [Google Scholar] [CrossRef] [PubMed]
  7. Balcomb III, K.C.; Claridge, D.E. A mass stranding of cetaceans caused by naval sonar in the Bahamas. Bahamas J. Sci. 2001, 8, 2–12. [Google Scholar]
  8. D’Amico, A.; Gisiner, R.C.; Ketten, D.R.; Hammock, J.A.; Johnson, C.; Tyack, P.L.; Mead, J. Beaked Whale Strandings and Naval Exercises. Aquat. Mamm. 2009, 35, 452–472. [Google Scholar] [CrossRef]
  9. Popper, A.N.; Ketten, D.R. Underwater Hearing. In The Senses: A Comprehensive Reference; Elsevier: Amsterdam, The Netherlands, 2008; pp. 225–236. ISBN 978-0-12-370880-9. [Google Scholar]
  10. Erbe, C.; Dunlop, R.; Dolman, S. Effects of Noise on Marine Mammals. In Effects of Anthropogenic Noise on Animals; Slabbekoorn, H., Dooling, R., Popper, A., Fay, R., Eds.; Springer Handbook of Auditory Research; Springer: New York, NY, USA, 2018; Volume 66, pp. 227–309. [Google Scholar] [CrossRef]
  11. New, L.; Clark, J.; Costa, D.; Fleishman, E.; Hindell, M.; Klanjšček, T.; Lusseau, D.; Kraus, S.; McMahon, C.; Robinson, P.; et al. Using Short-Term Measures of Behaviour to Estimate Long-Term Fitness of Southern Elephant Seals. Mar. Ecol. Prog. Ser. 2014, 496, 99–108. [Google Scholar] [CrossRef]
  12. Johnson, M.P.; Tyack, P.L. A Digital Acoustic Recording Tag for Measuring the Response of Wild Marine Mammals to Sound. IEEE J. Ocean. Eng. 2003, 28, 3–12. [Google Scholar] [CrossRef]
  13. Isojunno, S.; Sadykova, D.; DeRuiter, S.L.; Curé, C.; Visser, F.; Thomas, L.; Miller, P.J.O.; Harris, C.M. Individual, Ecological, and Anthropogenic Influences on Activity Budgets of Long-Finned Pilot Whales. Ecosphere 2017, 8, e02044. [Google Scholar] [CrossRef]
  14. Miller, P.J.O.; Kvadsheim, P.H.; Lam, F.-P.A.; Wensveen, P.J.; Antunes, R.; Alves, A.C.; Visser, F.; Kleivane, L.; Tyack, P.L.; Sivle, L.D. The Severity of Behavioral Changes Observed During Experimental Exposures of Killer (Orcinus Orca), Long-Finned Pilot (Globicephala Melas), and Sperm (Physeter Macrocephalus) Whales to Naval Sonar. Aquat. Mamm. 2012, 38, 362–401. [Google Scholar] [CrossRef]
  15. Wensveen, P.J.; Isojunno, S.; Hansen, R.R.; von Benda-Beckmann, A.M.; Kleivane, L.; van IJsselmuide, S.; Lam, F.-P.A.; Kvadsheim, P.H.; DeRuiter, S.L.; Curé, C.; et al. Northern Bottlenose Whales in a Pristine Environment Respond Strongly to Close and Distant Navy Sonar Signals. Proc. R. Soc. B. 2019, 286, 20182592. [Google Scholar] [CrossRef]
  16. Isojunno, S.; Curé, C.; Kvadsheim, P.H.; Lam, F.-P.A.; Tyack, P.L.; Wensveen, P.J.; Miller, P.J.O. Sperm Whales Reduce Foraging Effort during Exposure to 1-2 KHz Sonar and Killer Whale Sounds. Ecol. Appl. 2016, 26, 77–93. [Google Scholar] [CrossRef] [PubMed]
  17. Curé, C.; Isojunno, S.; Visser, F.; Wensveen, P.J.; Sivle, L.D.; Kvadsheim, P.H.; Lam, F.; Miller, P.J.O. Biological Significance of Sperm Whale Responses to Sonar: Comparison with Anti-Predator Responses. Endang. Species. Res. 2016, 31, 89–102. [Google Scholar] [CrossRef]
  18. Kvadsheim, P.H.; Isojunno, S.; Curé, C.; Siemensma, M.; Wensveen, P.; Lam, F.-P.A.; Hansen, R.R.; Benti, B.; Sivle, L.D.; Burslem, A.; et al. The 3S3 experiment data report–using operational naval sonars to study the effects of continuous active sonar, and source proximity, on sperm whales. FFI Report 2021, in press. [Google Scholar]
  19. Isojunno, S.; Wensveen, P.J.; Lam, F.-P.A.; Kvadsheim, P.H.; von Benda-Beckmann, A.M.; Martín López, L.M.; Kleivane, L.; Siegal, E.M.; Miller, P.J.O. When the Noise Goes on: Received Sound Energy Predicts Sperm Whale Responses to Both Intermittent and Continuous Navy Sonar. J. Exp. Biol. 2020, 223, jeb219741. [Google Scholar] [CrossRef]
  20. Sivle, L.D.; Kvadsheim, P.H.; Curé, C.; Isojunno, S.; Wensveen, P.J.; Lam, F.-P.A.; Visser, F.; Kleivane, L.; Tyack, P.L.; Harris, C.M.; et al. Severity of Expert-Identified Behavioural Responses of Humpback Whale, Mike Whale, and Northern Bottlenose Whale to Naval Sonar. Aquat. Mamm. 2015, 41, 469–502. [Google Scholar] [CrossRef]
  21. Southall, B.L.; DeRuiter, S.L.; Friedlaender, A.; Stimpert, A.K.; Goldbogen, J.A.; Hazen, E.; Casey, C.; Fregosi, S.; Cade, D.E.; Allen, A.N.; et al. Behavioral Responses of Individual Blue Whales (Balaenoptera Musculus) to Mid-Frequency Military Sonar. J. Exp. Biol. 2019, 222, jeb190637. [Google Scholar] [CrossRef]
  22. Lam, F.-P.A.; Kvadsheim, P.H.; Isojunno, S.; Wensveen, P.J.; van IJsselmuide, S.; Siemensma, M.L.; Dekeling, R.; Miller, P.J.O. Behavioural response study on the effects of continuous sonar on sperm whales in Norwegian waters-The 3S-2016-CAS cruise report. 2018. Available online: http://publications.tno.nl/publication/34627070/Q3bPWP/TNO-2018-R10802.pdf (accessed on 16 April 2021).
  23. Lam, F.-P.A.; Kvadsheim, P.H.; Isojunno, S.; Wensveen, P.J.; van IJsselmuide, S.; Siemensma, M.L.; Dekeling, R.; Miller, P.J.O. Behavioural response study on the effects of continuous sonar on sperm whales in Norwegian waters-The 3S-2017-CAS cruise report. 2018. Available online: http://publications.tno.nl/publication/34627071/pohdo8/TNO-2018-R10958.pdf (accessed on 16 April 2021).
  24. Miller, P.J.O.; Johnson, M.P.; Tyack, P.L. Sperm Whale Behaviour Indicates the Use of Echolocation Click Buzzes ‘Creaks’ in Prey Capture. Proc. R. Soc. Lond. B 2004, 271, 2239–2247. [Google Scholar] [CrossRef]
  25. Miller, P.J.O.; Aoki, K.; Rendell, L.E.; Amano, M. Stereotypical Resting Behavior of the Sperm Whale. Curr. Biol. 2008, 18, R21–R23. [Google Scholar] [CrossRef]
  26. Sivle, L.D.; Kvadsheim, P.H.; Fahlman, A.; Lam, F.-P.A.; Tyack, P.L.; Miller, P.J.O. Changes in Dive Behavior during Naval Sonar Exposure in Killer Whales, Long-Finned Pilot Whales, and Sperm Whales. Front. Physio. 2012, 3, 400. [Google Scholar] [CrossRef] [PubMed]
  27. von Benda-Beckmann, A.M.; Lam, F.-P.A.; Moretti, D.J.; Fulkerson, K.; Ainslie, M.A.; van IJsselmuide, S.P.; Theriault, J.; Beerens, S.P. Detection of Blainville’s Beaked Whales with Towed Arrays. Appl. Acoust. 2010, 71, 1027–1035. [Google Scholar] [CrossRef]
  28. Miller, P.J.O.; Antunes, R.; Alves, A.C.; Wensveen, P.J.; Kvadsheim, P.H.; Nordlund, N.; Lam, F.P.; Ijsselmuide, S.; Visser, F.; Tyack, P.; et al. The 3S experiments: Studying the Behavioral Effects of Sonar on Killerwhales (Orcinus orca), Sperm Whales (Physeter macrocephalus), and Long-Finned Pilot Whales (Globicephala melas) in Norwegian Waters; IQOE: Bremerhaven, Germany, 2011; p. 290. [Google Scholar]
  29. Wensveen, P.J.; Thomas, L.; Miller, P.J.O. A Path Reconstruction Method Integrating Dead-Reckoning and Position Fixes Applied to Humpback Whales. Mov. Ecol. 2015, 3, 1–16. [Google Scholar] [CrossRef]
  30. Frantzis, A.; Alexiadou, P. Male Sperm Whale (Physeter Macrocephalus) Coda Production and Coda-Type Usage Depend on the Presence of Conspecifics and the Behavioural Context. Can. J. Zool. 2008, 86, 62–75. [Google Scholar] [CrossRef]
  31. Oliveira, C.; Wahlberg, M.; Johnson, M.; Miller, P.J.O.; Madsen, P.T. The Function of Male Sperm Whale Slow Clicks in a High Latitude Habitat: Communication, Echolocation, or Prey Debilitation? J. Acoust. Soc. Am. 2013, 133, 3135–3144. [Google Scholar] [CrossRef]
  32. Weller, D.W.; Würsig, B.; Whitehead, H.; Norris, J.C.; Lynn, S.K.; Davis, R.W.; Clauss, N.; Brown, P. Observations of an interaction between sperm whales and short-finned pilot whales in the Gulf of Mexico. Mar. Mammal Sci. 1996, 12, 588–594. [Google Scholar] [CrossRef]
  33. Reeves, R.R.; Berger, J.; Clapham, P.J. Killer Whales as Predators of Large Baleen Whales and Sperm Whales. In Whales, Whaling, and Ocean Ecosystems; Estes, J., Ed.; University of California Press: Berkeley, CA, USA, 2007; pp. 174–187. ISBN 978-0-520-24884-7. [Google Scholar]
  34. von Benda-Beckmann, A.M.; Thomas, L.; Tyack, P.L.; Ainslie, M.A. Modelling the Broadband Propagation of Marine Mammal Echolocation Clicks for Click-Based Population Density Estimates. J. Acoust. Soc. Am. 2018, 143, 954–967. [Google Scholar] [CrossRef]
  35. Visser, F.; Miller, P.J.O.; Antunes, R.N.; Oudejans, M.G.; Mackenzie, M.L.; Aoki, K.; Lam, F.-P.A.; Kvadsheim, P.H.; Huisman, J.; Tyack, P.L. The Social Context of Individual Foraging Behaviour in Long-Finned Pilot Whales (Globicephala Melas). Behaviour 2014, 151, 1453–1477. [Google Scholar] [CrossRef]
  36. Højsgaard, S.; Halekoh, U.; Yan, J. The R Package geepack for Generalized Estimating Equations. Journal of Statistical Software. 2006, 15, 1–11. [Google Scholar] [CrossRef]
  37. Curé, C.; Sivle, L.D.; Visser, F.; Wensveen, P.J.; Isojunno, S.; Harris, C.M.; Kvadsheim, P.H.; Lam, F.-P.A.; Miller, P.J.O. Predator Sound Playbacks Reveal Strong Avoidance Responses in a Fight Strategist Baleen Whale. Mar. Ecol. Prog. Ser. 2015, 526, 267–282. [Google Scholar] [CrossRef]
  38. Harris, C.M.; Sadykova, D.; DeRuiter, S.L.; Tyack, P.L.; Miller, P.J.O.; Kvadsheim, P.H.; Lam, F.-P.A.; Thomas, L. Dose Response Severity Functions for Acoustic Disturbance in Cetaceans Using Recurrent Event Survival Analysis. Ecosphere 2015, 6, 1–14. [Google Scholar] [CrossRef]
  39. Therneau, T.M.; Grambsch, P.M. Multiple events per subject. In Modeling Survival Data: Extending the Cox Model; Springer: New York, NY, USA, 2000; pp. 169–230. [Google Scholar] [CrossRef]
  40. Kleinbaum, D.G.; Klein, M. Competing risks survival analysis. In Survival Analysis: A Self-Learning Text; Springer: New York, NY, USA, 2010; pp. 425–495. [Google Scholar] [CrossRef]
  41. Therneau, T. A package for survival analysis in SR package, 2014, Version 2.37-7. Available online: http://CRAN.R-project.org/package=survival (accessed on 16 March 2021).
  42. Ellison, W.T.; Southall, B.L.; Clark, C.W.; Frankel, A.S.A. New Context-Based Approach to Assess Marine Mammal Behavioral Responses to Anthropogenic Sounds. Conserv. Biol. 2012, 26, 21–28. [Google Scholar] [CrossRef]
  43. Curé, C.; Isojunno, S.; Vester, H.I.; Visser, F.; Oudejans, M.; Biassoni, N.; Massenet, M.; Barluet de Beauchesne, L.; Wensveen, P.J.; Sivle, L.D.; et al. Evidence for Discrimination between Feeding Sounds of Familiar Fish and Unfamiliar Mammal-Eating Killer Whale Ecotypes by Long-Finned Pilot Whales. Anim. Cogn. 2019, 22, 863–882. [Google Scholar] [CrossRef]
  44. Harris, C.M.; Thomas, L.; Falcone, E.A.; Hildebrand, J.; Houser, D.; Kvadsheim, P.H.; Lam, F.-P.A.; Miller, P.J.O.; Moretti, D.J.; Read, A.J.; et al. Marine Mammals and Sonar: Dose-Response Studies, the Risk-Disturbance Hypothesis and the Role of Exposure Context. J. Appl. Ecol. 2017, 55, 396–404. [Google Scholar] [CrossRef]
  45. Shannon, G.; McKenna, M.F.; Angeloni, L.M.; Crooks, K.R.; Fristrup, K.M.; Brown, E.; Warner, K.A.; Nelson, M.D.; White, C.; Briggs, J.; et al. A Synthesis of Two Decades of Research Documenting the Effects of Noise on Wildlife: Effects of Anthropogenic Noise on Wildlife. Biol. Rev. 2016, 91, 982–1005. [Google Scholar] [CrossRef]
  46. Bonnot, N.C.; Couriot, O.; Berger, A.; Cagnacci, F.; Ciuti, S.; De Groeve, J.E.; Gehr, B.; Heurich, M.; Kjellander, P.; Kröschel, M.; et al. Fear of the Dark? Contrasting Impacts of Humans versus Lynx on Diel Activity of Roe Deer across Europe. J. Anim. Ecol. 2020, 89, 132–145. [Google Scholar] [CrossRef] [PubMed]
  47. Proudman, N.J.; Churski, M.; Bubnicki, J.W.; Nilsson, J.-Å.; Kuijper, D.P.J. Red Deer Allocate Vigilance Differently in Response to Spatio-Temporal Patterns of Risk from Human Hunters and Wolves. Wildl. Res. 2020. [Google Scholar] [CrossRef]
  48. Rieucau, G.; Sivle, L.D.; Handegard, N.O. Herring perform stronger collective evasive reactions when previously exposed to killer whales calls. Behav. Ecol. 2016, 27, 538–544. [Google Scholar] [CrossRef]
  49. Curé, C.; Antunes, R.; Alves, A.C.; Visser, F.; Kvadsheim, P.H.; Miller, P.J.O. Responses of Male Sperm Whales (Physeter Macrocephalus) to Killer Whale Sounds: Implications for Anti-Predator Strategies. Sci. Rep. 2013, 3, 1–7. [Google Scholar] [CrossRef]
  50. Deecke, V.B.; Slater, P.J.B.; Ford, J.K.B. Selective Habituation Shapes Acoustic Predator Recognition in Harbour Seals. Nature 2002, 420, 171–173. [Google Scholar] [CrossRef]
  51. Benti, B.; Miller, P.J.O.; Biuw, M.; Curé, C. Indication that the behavioural responses of humpback whales to killer whale sounds are influenced by trophic relationships. Mar. Ecol. Prog. Ser. 2021, 660, 217–232. [Google Scholar] [CrossRef]
Figure 1. Scored responses (hatched) over scorable sessions across the different potential behavioral response categories and exposure types. The eight behavioral response categories (avoidance response, orientation response, change in locomotion, change in dive profile, cessation of feeding, cessation of resting, change in locomotion, change in dive profile, change in vocal behavior and change in group distribution) are represented by a color code (e.g., blue for avoidance response). For each of the four exposure types (NS, CAS, MPAS, HPAS), the total number of scorable sessions per behavioral response category is represented by the width of the box, of which the number of scored responses (i.e., non-zero value scores) is indicated as hatched. For example, for HPAS, there were a total of 69 scorable potential responses, all behavioral response categories combined. The avoidance behavioral response category was scorable in 10 out of the 11 HPAS exposure sessions, and scored responses were attributed in two of these 10 exposures. By contrast, for NS, there were no avoidance responses scored among the eight scorable sessions of the 12 conducted NS sessions. n: number of exposure sessions; CAS: Continuous Active Sonar; MPAS: Medium-level Pulsed Active Sonar; HPAS: High-level Pulsed Active Sonar; NS: No-Sonar control.
Jmse 09 00444 g001
Figure 2. Distribution of the proportion of scored responses across the behavioral response categories, summing to 100% within each exposure type. The figure includes the dataset of the focal whales tested in the present study with the four exposure types NS, CAS, HPAS, and MPAS. A potential ‘cessation of resting’ could be assessed only once, for a NS see Figure 1. because the whale was rarely resting at the start of exposure. This category of response could not be evaluated (unscorable) for any of the other exposures and was thus excluded from this figure. n: number of scored responses per exposure type. See Figure 1 for definition of abbreviations CAS, MPAS, HPAS, NS.
Jmse 09 00444 g002
Figure 3. Proportion of scored responses per exposure type for focal whales (all behavioral response categories combined), Figure 2. GEE results (detailed in Table S3) of paired comparisons between exposure types are given for 5% significance level. For each exposure type, one dot represents the value of one exposure session being labeled in black or grey in relation to, respectively, the presence or absence of detected blackfish event within the 15 h preceding the start of exposure up to the end of exposure. GEE results showed that the proportion of scored responses for CAS was significantly higher than for NS (p < 0.0067). Moreover, the covariate Blackfish had a positive effect on response occurrence (p < 0.005, Table S3), indicating that the more recently the whale had been exposed to blackfish, the highest the proportion of scored responses. n: number of exposure sessions; see Figure 1 for definition of abbreviations CAS, MPAS, HPAS, NS.
Jmse 09 00444 g003
Figure 4. Dose–response probability functions for the focal sperm whales’ dataset generated from the selected stratified Cox proportional hazards model for low severity responses (score 1–3) on the left, and moderate severity responses (score 4–6) on the right, with their 95% confidence limits in grey.
Jmse 09 00444 g004
Table 1. Severity scale used for scoring behavioral responses. The original scale provided by Southall et al. 2007 [4] was slightly modified with some added behavioral responses (in bold) by Miller et al. 2012 [14] and Sivle et al. 2015 [20], and in the present work (in bold underlined). Given the exposure scheme of 40 min, a “Brief” response was defined as to be significantly shorter than the exposures (0–5 min), a “Minor” response was shorter than the exposure but longer than Brief (5–30 min) and stopped during the exposure, a “Moderate” response lasted roughly the duration of the exposure (30–60 min) and ceased soon after the end of exposure, and a “Prolonged” response was significantly longer than the exposure (> 60 min).
ScoreBehavioral Responses
0No observable response
1Brief orientation response
2Moderate or multiple orientation responses
Brief or minor changes in respiration rates
Brief cessation/modification of vocal behavior
Brief change in dive profile
3Prolonged orientation behavior
Minor change in locomotion (speed/direction) and or dive profile but no avoidance of sound source
Minor cessation/modification of vocal behavior
Individual alert behavior
Moderate change of respiration rate
Brief shift in group distribution
4Moderate change in locomotion (speed/direction) and or dive profile but no avoidance of sound source
Brief avoidance of sound source
Minor shift in group distribution
Moderate cessation/modification of vocal behavior
Brief cessation of feeding/resting
5Extended change in locomotion (speed/direction) and or dive profile but no avoidance of sound source
Minor avoidance of sound source
Moderate shift in group distribution
Change in inter-animal distance and/or group size
Prolonged cessation or modification of vocal behavior
Minor cessation of feeding/resting
6Moderate avoidance of sound source
Extended cessation or modification of vocal behavior
Visible startle response
Moderate cessation of feeding
Prolonged shift in group distribution
Brief or minor separation of female and dependent offspring
Aggressive behavior related to noise exposure
Brief cessation of reproductive behavior
Moderate cessation of resting behavior
7Prolonged cessation of feeding
Moderate separation of female and dependent offspring
Severe and or sustained avoidance of sound source
Extensive or prolonged aggressive behavior
Clear antipredator response
Moderate cessation of reproductive behavior
Prolonged avoidance
8Obvious aversion and/or progressive sensitization
Long-term avoidance of area
Prolonged or significant separation of female and dependent offspring with disruption of acoustic reunion mechanisms
Prolonged cessation of reproductive behavior
9Outright panic, flight, stampede, or attack
Avoidance related to predator detection
Table 2. Overview of collected data. The whale ID code includes information regarding the species (“sw” for sperm whale), the year (e.g., “16” for 2016), the Julian date (e.g., 126) and a letter (e.g., “a”) identifying the tag deployed. Sixteen tagged whales were subjected to the exposure experiments, from which 11 whales were equipped with a regular DTAG (version 3) and five had a mixed-DTAG (including a GPS logger, indicated with a *). In two occasions, two whales were simultaneously tagged, one focal whale and one non-focal whale (in italic), and both were exposed to the same exposures. For one of the non-focal whales (sw17_186a), the tag came off before the last exposure session started (MPAS). For each whale ID, the exposure sessions are listed by order of exposure. Exposure sessions indicated in bold are those for which a blackfish event has been detected within the 15-h period preceding the start of exposure or during the exposure. Blackfish events were defined as acoustic and/or visual detections of blackfish presence (i.e., killer whales and/or long-finned pilot whales) based on the visual sightings and inspection of the sound recordings on the tags. The focal whale dataset includes a total of 34 sonar exposures (12 CAS, 11 MPAS, 11 HPAS) and 12 NS. See abbreviations defined in Figure 1.
Whale ID.Exposure Sessions (by Order of Exposure)
Sw16_126aCAS, MPAS, HPAS
Sw16_130aNS, MPAS, CAS
Sw16_131a NS
Sw16_134aNS
Sw16_134bNS, CAS, HPAS, MPAS
Sw16_135aNS, HPAS, CAS, MPAS
Sw16_136aNS, CAS, MPAS, HPAS
Sw17_179a * MPAS, HPAS, CAS
Sw17_180a * NS, HPAS, MPAS, CAS
Sw17_182a *
Sw17_182b
NS, MPAS, CAS, HPAS
NS, MPAS, CAS, HPAS
Sw17_184a * NS, CAS, HPAS
Sw17_186a *
Sw17_186b
NS, HPAS, CAS
NS, HPAS, CAS, MPAS
Sw17_188aNS, MPAS, HPAS, CAS, CAS
Sw17_191a NS, HPAS, MPAS
Publisher’s Note: MDPI stays neutral with regard to jurisdictional claims in published maps and institutional affiliations.

