Article

A Velocity Obstacle-Based Real-Time Regional Ship Collision Risk Analysis Method

1
School of Navigation, Wuhan University of Technology, Wuhan 430063, China
2
Hubei Key Laboratory of Inland Shipping Technology, Wuhan 430063, China
*
Author to whom correspondence should be addressed.
J. Mar. Sci. Eng. 2021, 9(4), 428; https://doi.org/10.3390/jmse9040428
Submission received: 21 March 2021 / Revised: 5 April 2021 / Accepted: 12 April 2021 / Published: 15 April 2021
(This article belongs to the Section Ocean Engineering)

Abstract

:
Maritime accidents such as ship collisions pose continuous risks to individuals and society with due to their severe consequences on human life, economic and environmental losses, etc. Supervising the maritime traffic in the different regions and maintaining its safety level is an essential task for stakeholders such as maritime safety administrations. In this research, a new ship collision risk analysis method is developed with the utilisation of AIS (Automatic Identification System) data. A velocity obstacle-based risk measurement is applied to measure the risk of collision between multiple ships from the velocity perspective, based on which, the collision risk and the complexity of the encounter situation are obtained at the same time. Secondly, a density-based clustering technique is introduced to identify the hotspots of ship traffic in the region as an indicator for maritime safety operators. A case study using historical AIS data was implemented to verify the effectiveness of the proposed approach in a manner that simulates the real-time data scenario. Furthermore, a comparison between existing risk analysis method is conducted to validate the proposed method.

1. Introduction

Maritime transportation is one of the major contributors to global cargo transportation and the development of the world economy [1]. With the increasing volume of maritime traffic, larger and faster ships have been putting pressure on maritime safety, especially for the ports and waterways where maritime traffic is intense and complicated [2]. To better analyse the risk of ship collision in waterways and facilitate maritime safety management operations, it is necessary to design real-time collision risk analysis and visualisation tools.
Various works can be found in the literature that focus on analysing collision risks from multiple perspectives, e.g., Lisowski [3,4] has conducted a series of studies on ship collision avoidance and risk analysis. Comprehensive literature reviews can be found in [5,6] Among all the collision risk analysis studies, indicator-based approaches, such as closest point of approach (CPA), etc. and domain-based approaches are frequently utilised. Zhen, et al. [7] have designed an integrated collision risk analysis method for real-time traffic surveillance using distance/time to CPA, which has also been applied in [8]. Zhang, et al. [9,10] proposed a series of vessel collision risk operators (VCROs), which consider indicators such as relative distance, relative bearing, speed, CPA, etc. to evaluate the risk of collisions between ships. For these approaches, the risk is defined as a numerical value based on integrated measurement of encounter situations using the aforementioned indicators. Besides these, ship domain, which is a concept firstly proposed in [11] to describe an area around the own ship that should be kept clear to avoid a collision, is also widely used. Szlapczynski, et al. [12,13,14] defined the time/degree to domain violation to evaluate the risk of collision during navigation. Montewka, et al. [15] proposed a minimum distance to collision (MDTC) as the criterion for collision risk to consider the ship dynamics and their influence during the risk analysis process. Zhang [16] proposed a probabilistic ship domain to evaluate the collision risk. Gil and Montewka et al. [17,18] extend the work in [15] and proposed Collision Avoidance Dynamic Critical Area (DADCA) to evaluate the collision risk and support the collision avoidance process.
The aforementioned methods have all made a great contribution to the development of risk analysis methods for ship collision. However, several issues could hinder their effectiveness: (1) for these approaches, the spatial-temporal relationships between ships are normally considered separately. In some cases, these separate indicators could provide contradictory analysis results which are difficult to analyse [19]. (2) For the indicators-based approach, the risk is normally obtained by a numerical integration of multiple indicators. With such a result it is difficult to provide a clear physical interpretation of the risk value. Besides, the sensitivity of the parameter settings could have an influence on the final results and lead to possible over/underestimation of the risk of collision. To have a continuous and comprehensive analysis on the risk of collision, in this study, the concept of time-varying collision risk (TCR) [20] has been adopted to measure the risk considering the free space in the velocity domain of the ship of interest for manoeuvres. Based on this concept, a real-time collision risk analysis and visualisation tool using AIS data are established. The contribution of this research is to combine the concept of TCR and large AIS data source in a large-scale and real-time maritime traffic environment to identify the ships with potential for collision accidents and help maritime traffic management stakeholders such as vessel traffic services (VTSs) establish the same risk situation awareness for individual ships to improve their maritime safety management capability.
The contents of the manuscript are arranged as follows: Section 2 illustrates the methodology of the research, followed by the detailed elaboration of model design in Section 3. Section 4 gives a case study on utilising the proposed method for risk analysis. A parameter setting analysis and comparison between classical risk analysis approaches are provided in Section 5. Section 6 concludes the research.

2. Methodology

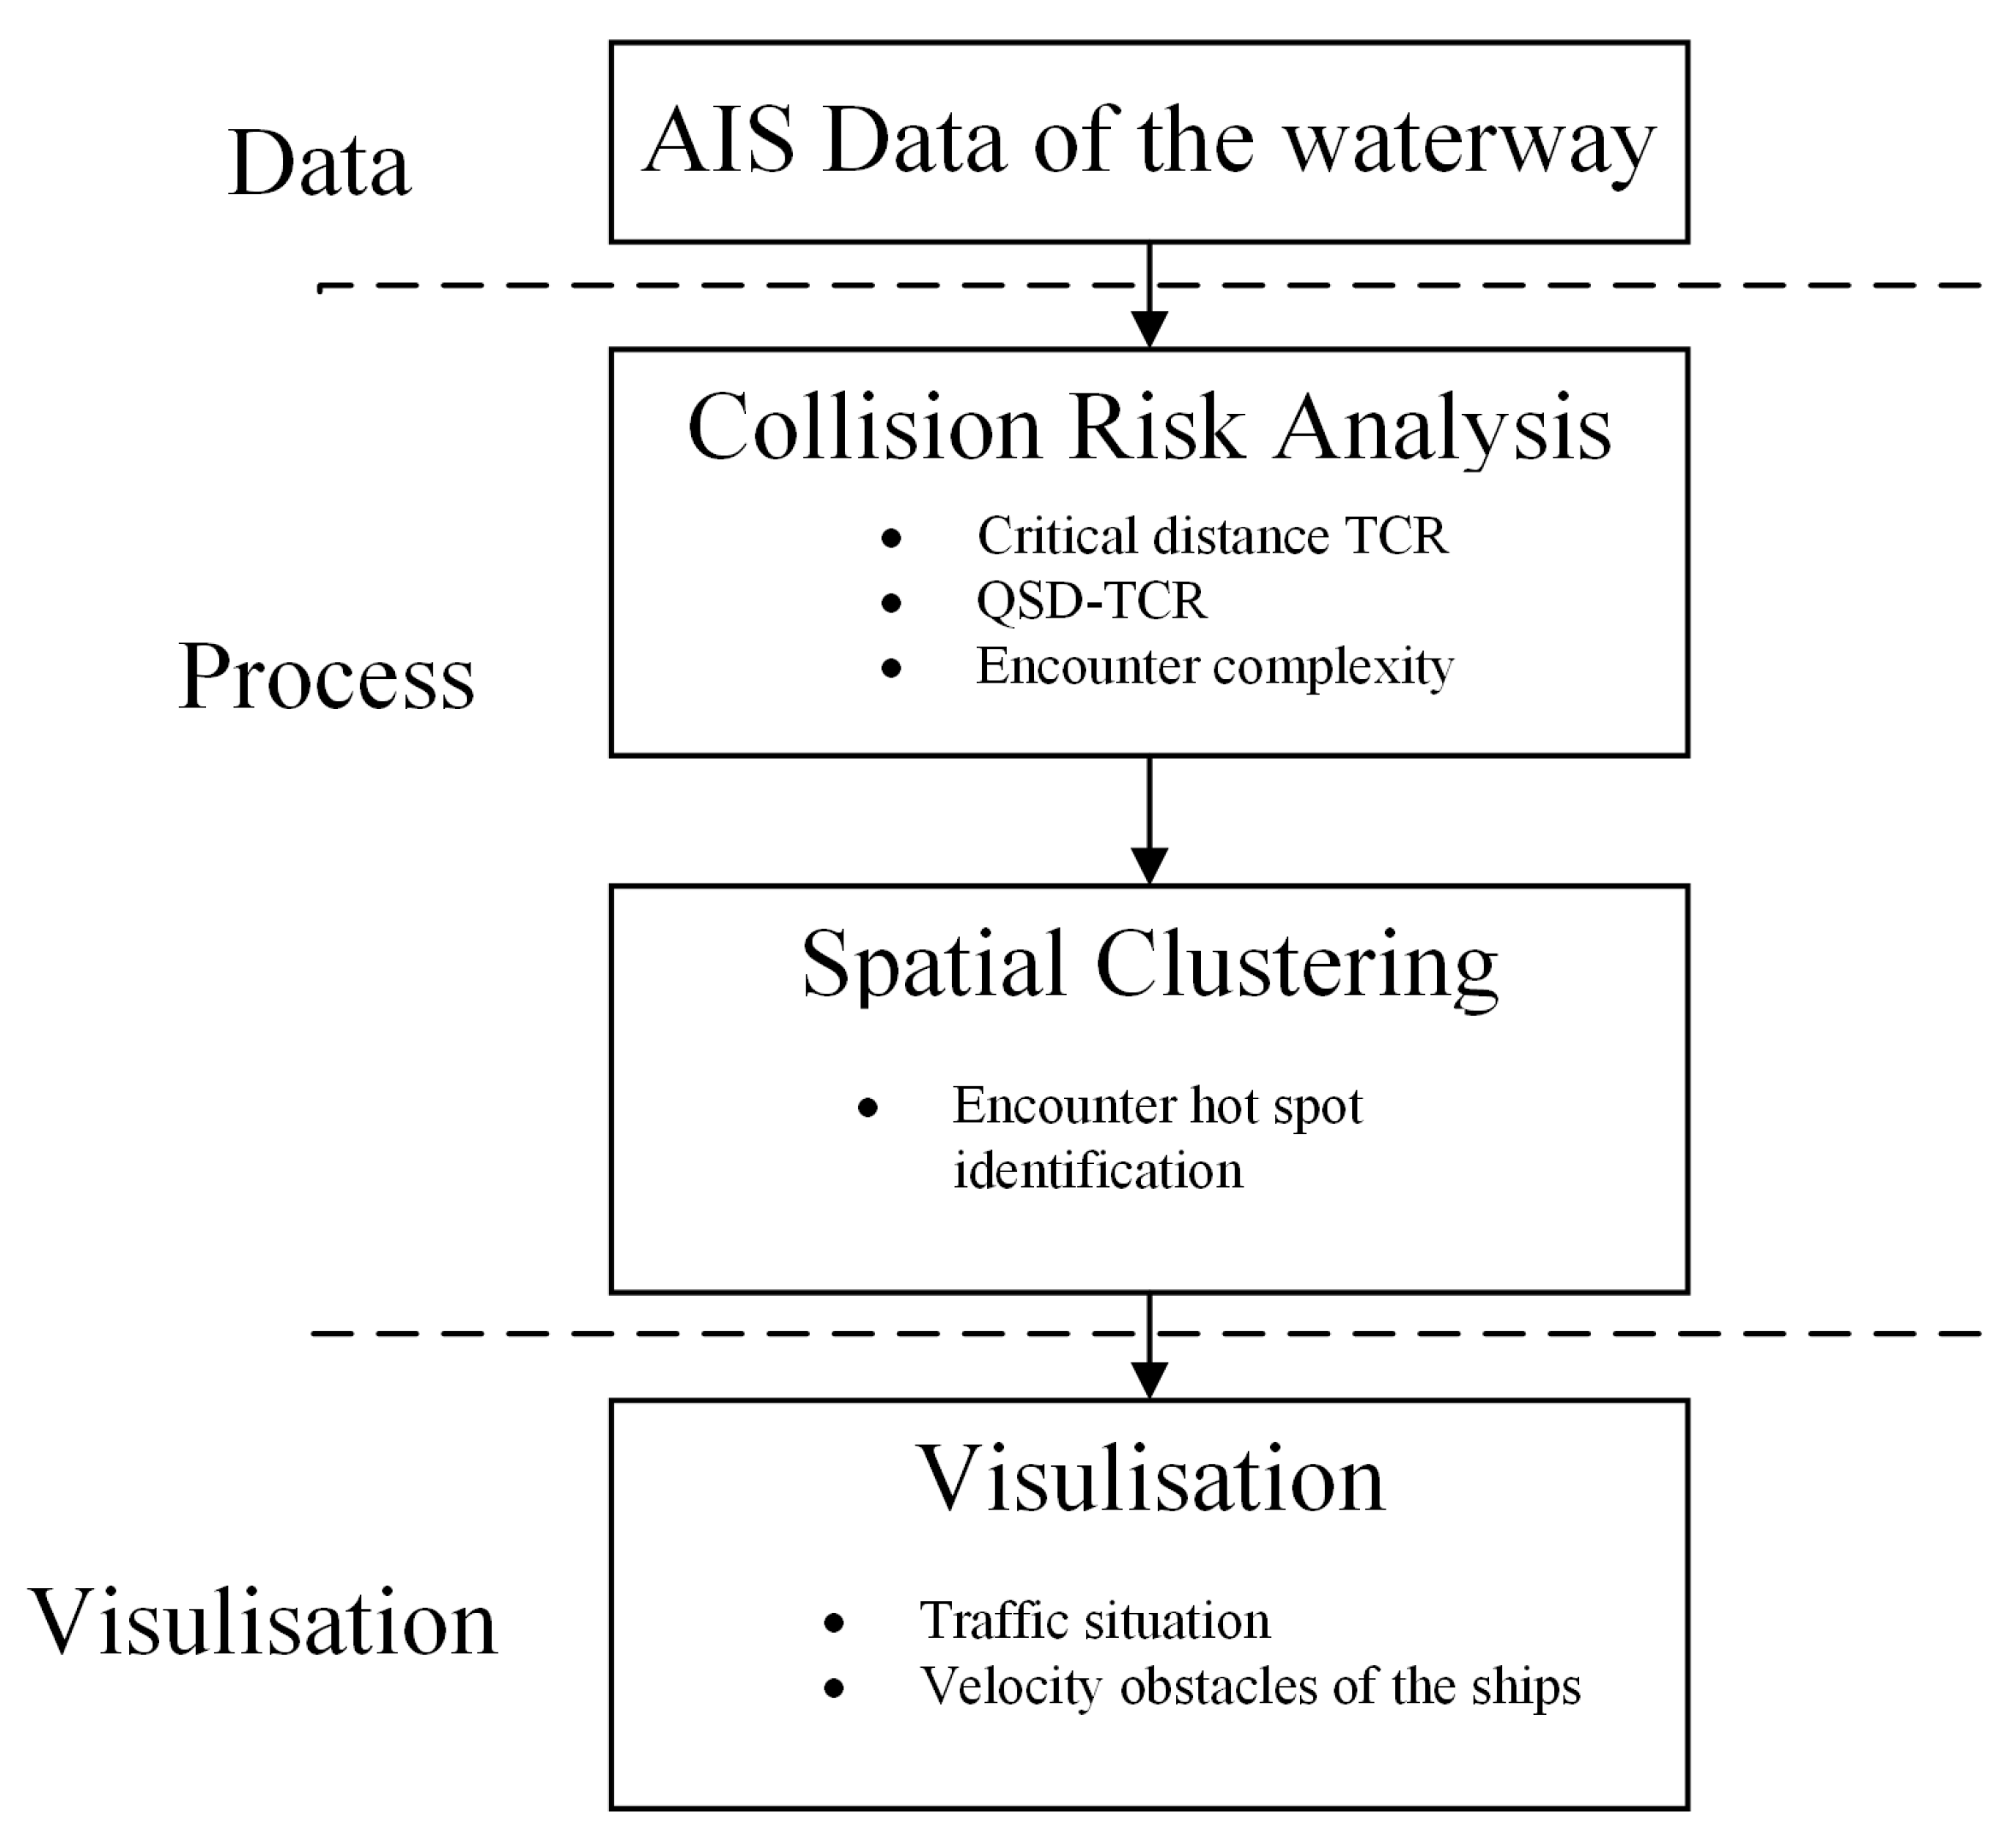
2.1. Overview of the Research

In this research, the risk of collision is defined as the proportion of the velocities in the whole velocity set of the ship of interest that could lead to a collision. This definition is considered from the perspective of the free space that the ship can maintain for collision avoidance [20]. In normal sea navigation practices, changes of course and speed reduction are frequently utilized as the main measures for collision avoidance manoeuvre [21]. Hence, the velocity sets of the ship are set to be the velocities within the ranges of the ship’s current velocity. Based on this definition, an AIS-based collision risk analysis and visualisation tool are designed: (1) Firstly, the AIS data will be collected and processed for a certain time interval for further risk analysis; (2) For each time interval, a TCR-based collision risk analysis will be conducted for every ship in the region to estimate the collision risk and their contributions to traffic complexity. Besides, ships that have potential for collision accidents, which is defined as a near-miss, will be identified and the corresponding collision risk will be estimated with the TCR approach. During this process, three different indicators: critical distance TCR, quaternion ship domain-TCR, and encounter complexity will be introduced to analyse the encounter from different perspectives; (3) Following the risk analysis, a spatial clustering method will be implemented to identify the traffic hotspots for maritime traffic management; (4) Finally, a visualisation step will be conducted to demonstrate the traffic safety situation and results of the collision risk analysis. The framework of the research is shown in Figure 1. The details of the methods incorporated in the research are elaborated in the following sections.

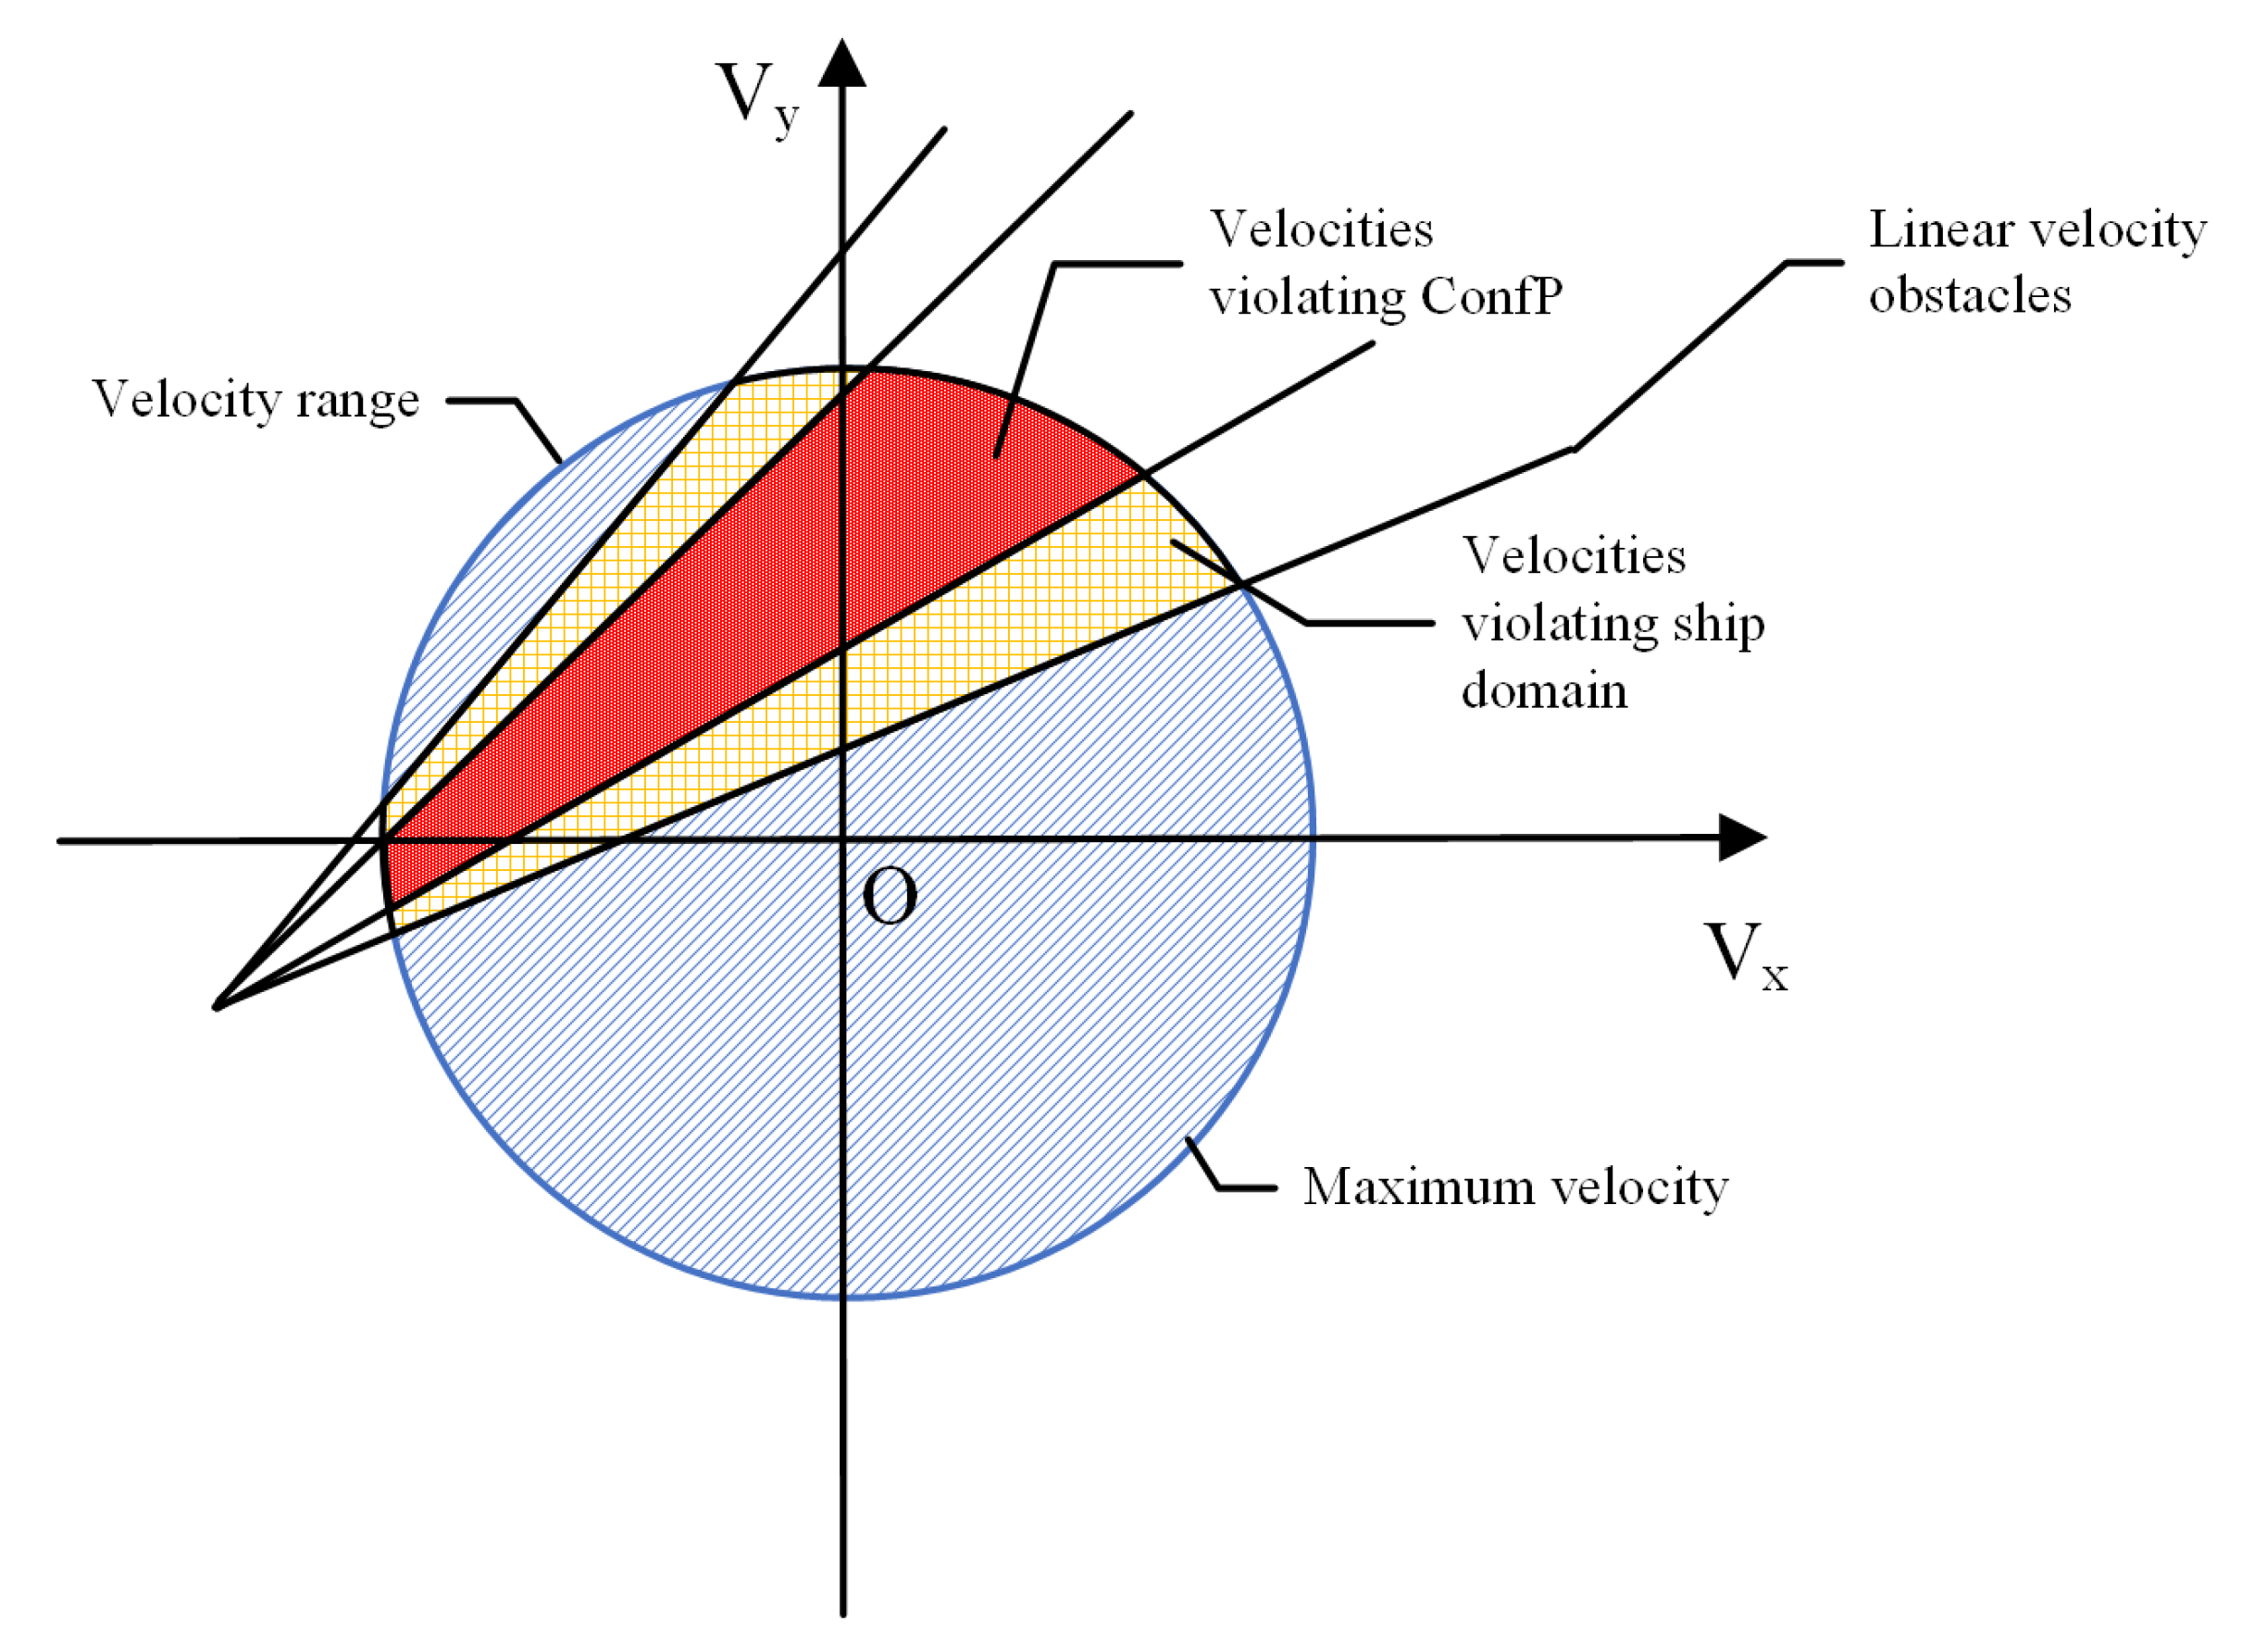
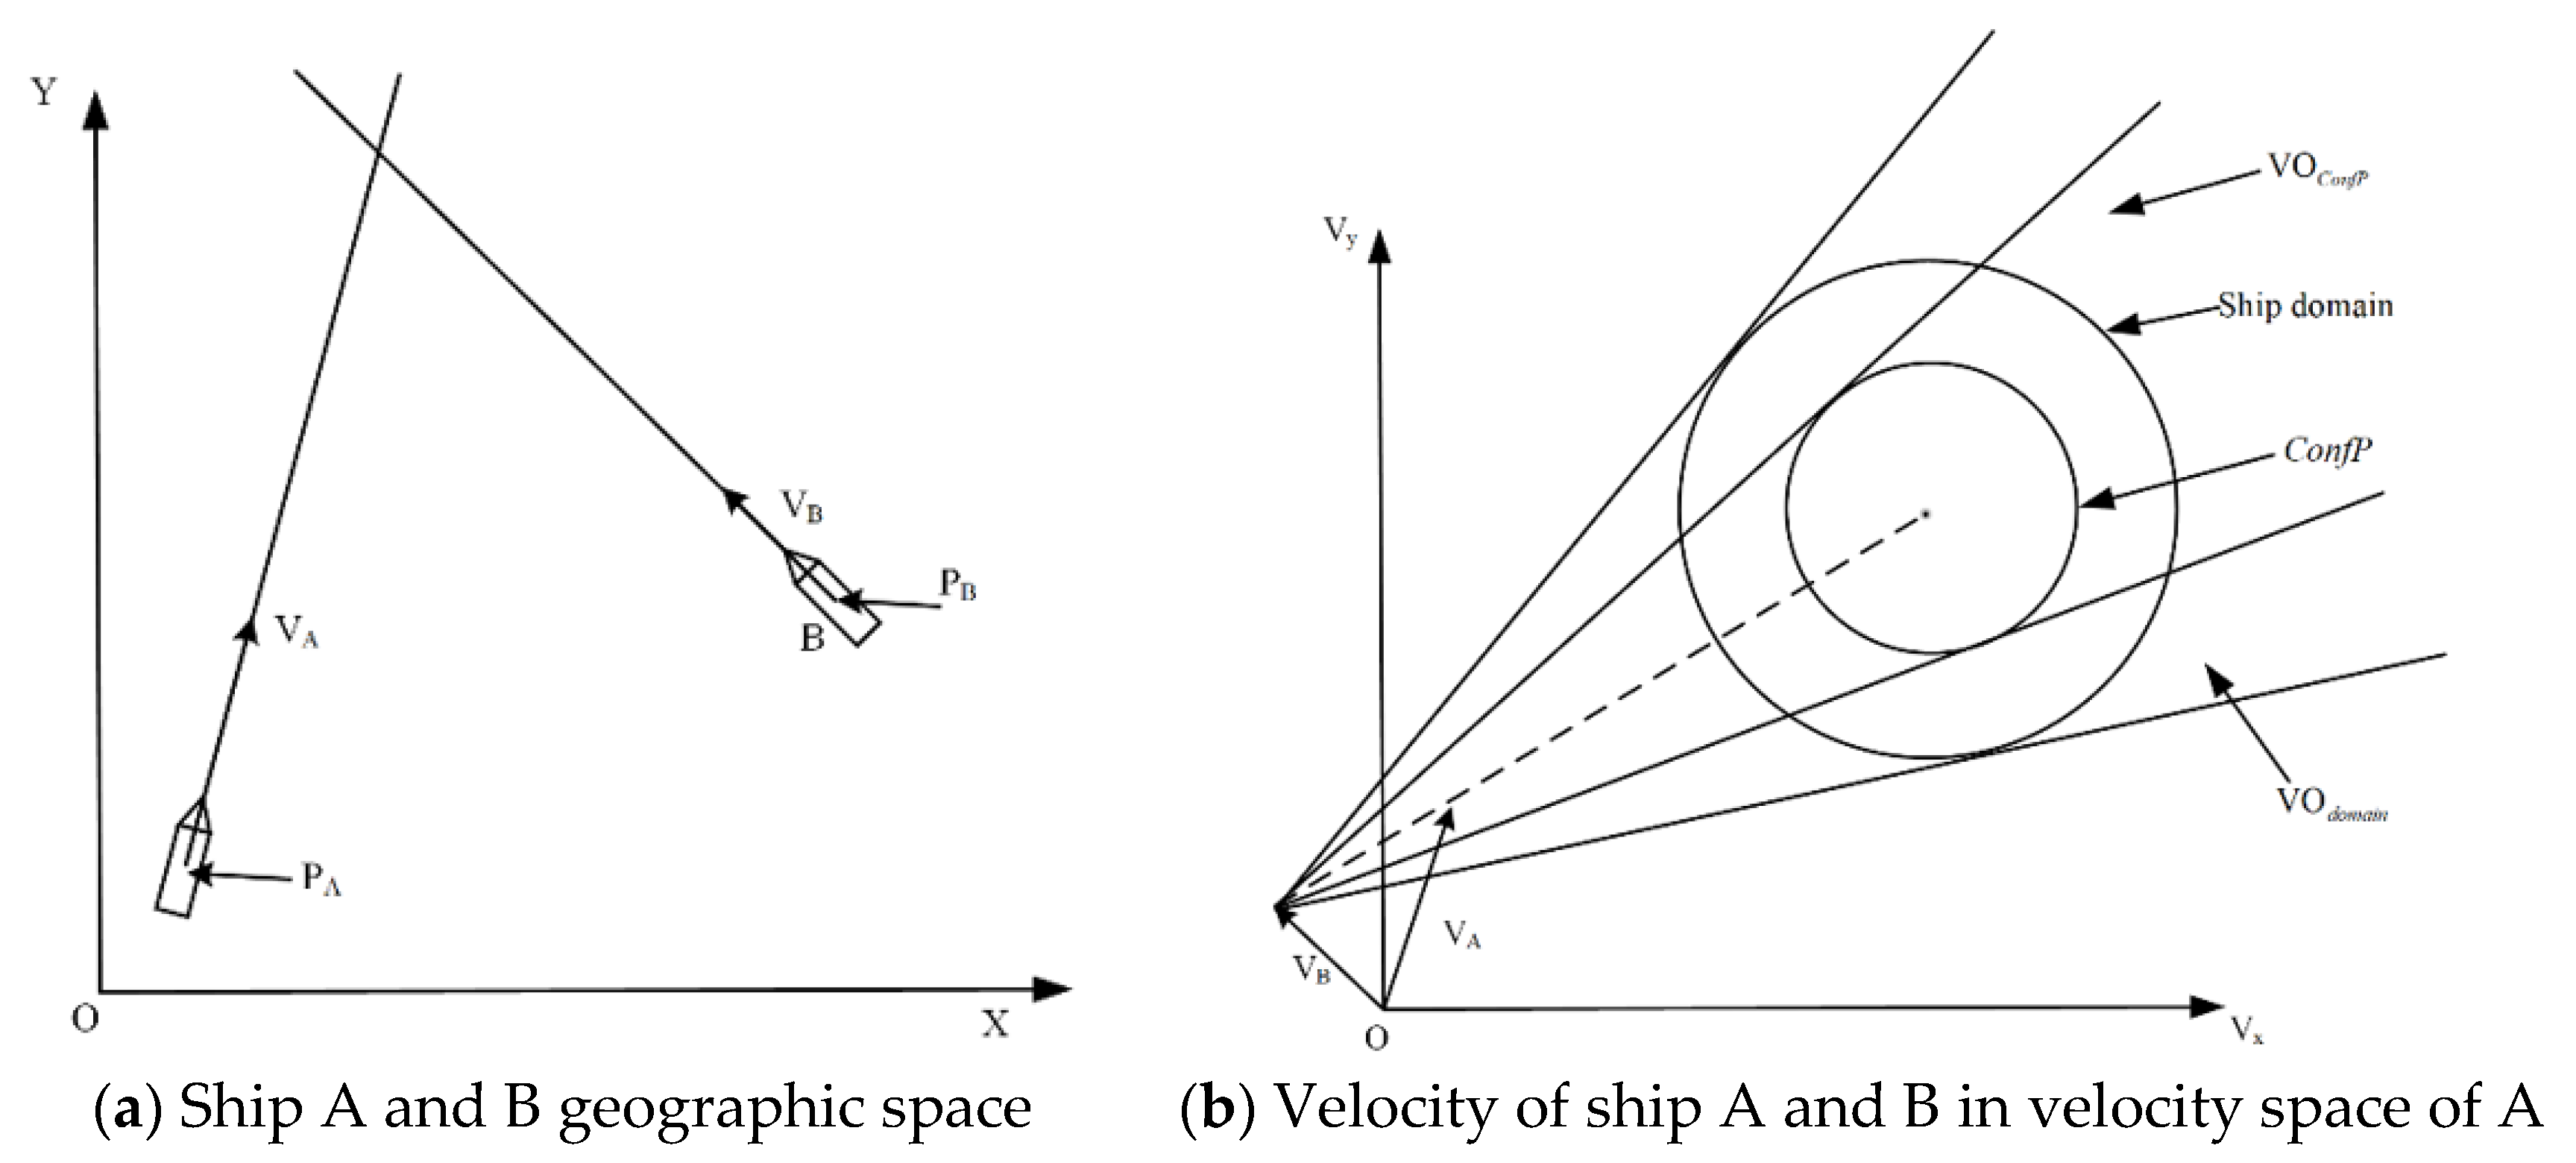
2.2. TCR-Based Collision Risk Modelling

Among the various methods for collision risk analysis in the literature, the spatial-temporal relationships are the key factors to understand the encounter and its risk, e.g., CPA-based approaches and ship domain-based approaches, etc. For these methods, the spatial-temporal proximity is normally considered separately or integrated numerically, which cannot provide a physical meaning of the situation. This research applied the concept of TCR [20] to model the risk of collision and identify collision candidate with velocity obstacle (VO) methods [19].
The concept of TCR for collision risk measurement is to project the spatial-temporal relationship between ships into the velocity space of the ship being studied and measure the difficulty of collision avoidance by analysing the share of collision-leading velocities in the velocity space. The concept is demonstrated in Figure 2. The linear velocity obstacle method is applied to construct the velocity obstacles induced by the target ships. With a powerful and accurate ship behaviour predictor such a method could be changed to a non-linear version to consider the change of movement of target ships, which is not in the scope of this research. The red cone area indicates the velocities that could lead to collision a between ships and the blue region denotes the velocities that the ship of interest can achieve. With this design, the perspective on how the define the risk has changed from analysing the current encounter situation to consider the possible collision avoidance in the future, i.e., if the TCR is large, which means the red cone-shape area is large, it indicates the range of collision-free velocities for the ship under study is limited, hence the risk of collision is high.
The velocity obstacle method [22] is applied as the foundation of the concept. Suppose that ship A navigates in the waterways where B is an obstacle. The status of ship A can be denoted as A{LA,PA(t),VA(t)}, and obstacle B is denoted as B{LB,PB}, where L is the dimensions of them; P is the position of A and B at time t, and V is the their velocity in the time step t.
Since B is a static obstacle in the environment, its position is set to be stationary, and its velocity is set to be 0. Figure 3 shows their spatiotemporal relationship and the corresponding projection into the velocity space of A.
As shown in Figure 3b, the spatiotemporal relationship between ship A and obstacle can be projected into the velocity space of ship A. ConfP are all the possible positions of A around the obstacle when the collision happens in the future time [23]. The criterion of collision considering the ship’s movement can be denoted as Equation (1):
P A t C P B t C ConfP P = P t 0 + V · t t 0
where P(tc) denotes the position of A and B at collision time tc and is the Minkowski addition. P denotes the position of A and B at the given time t after the observation timestep t0.

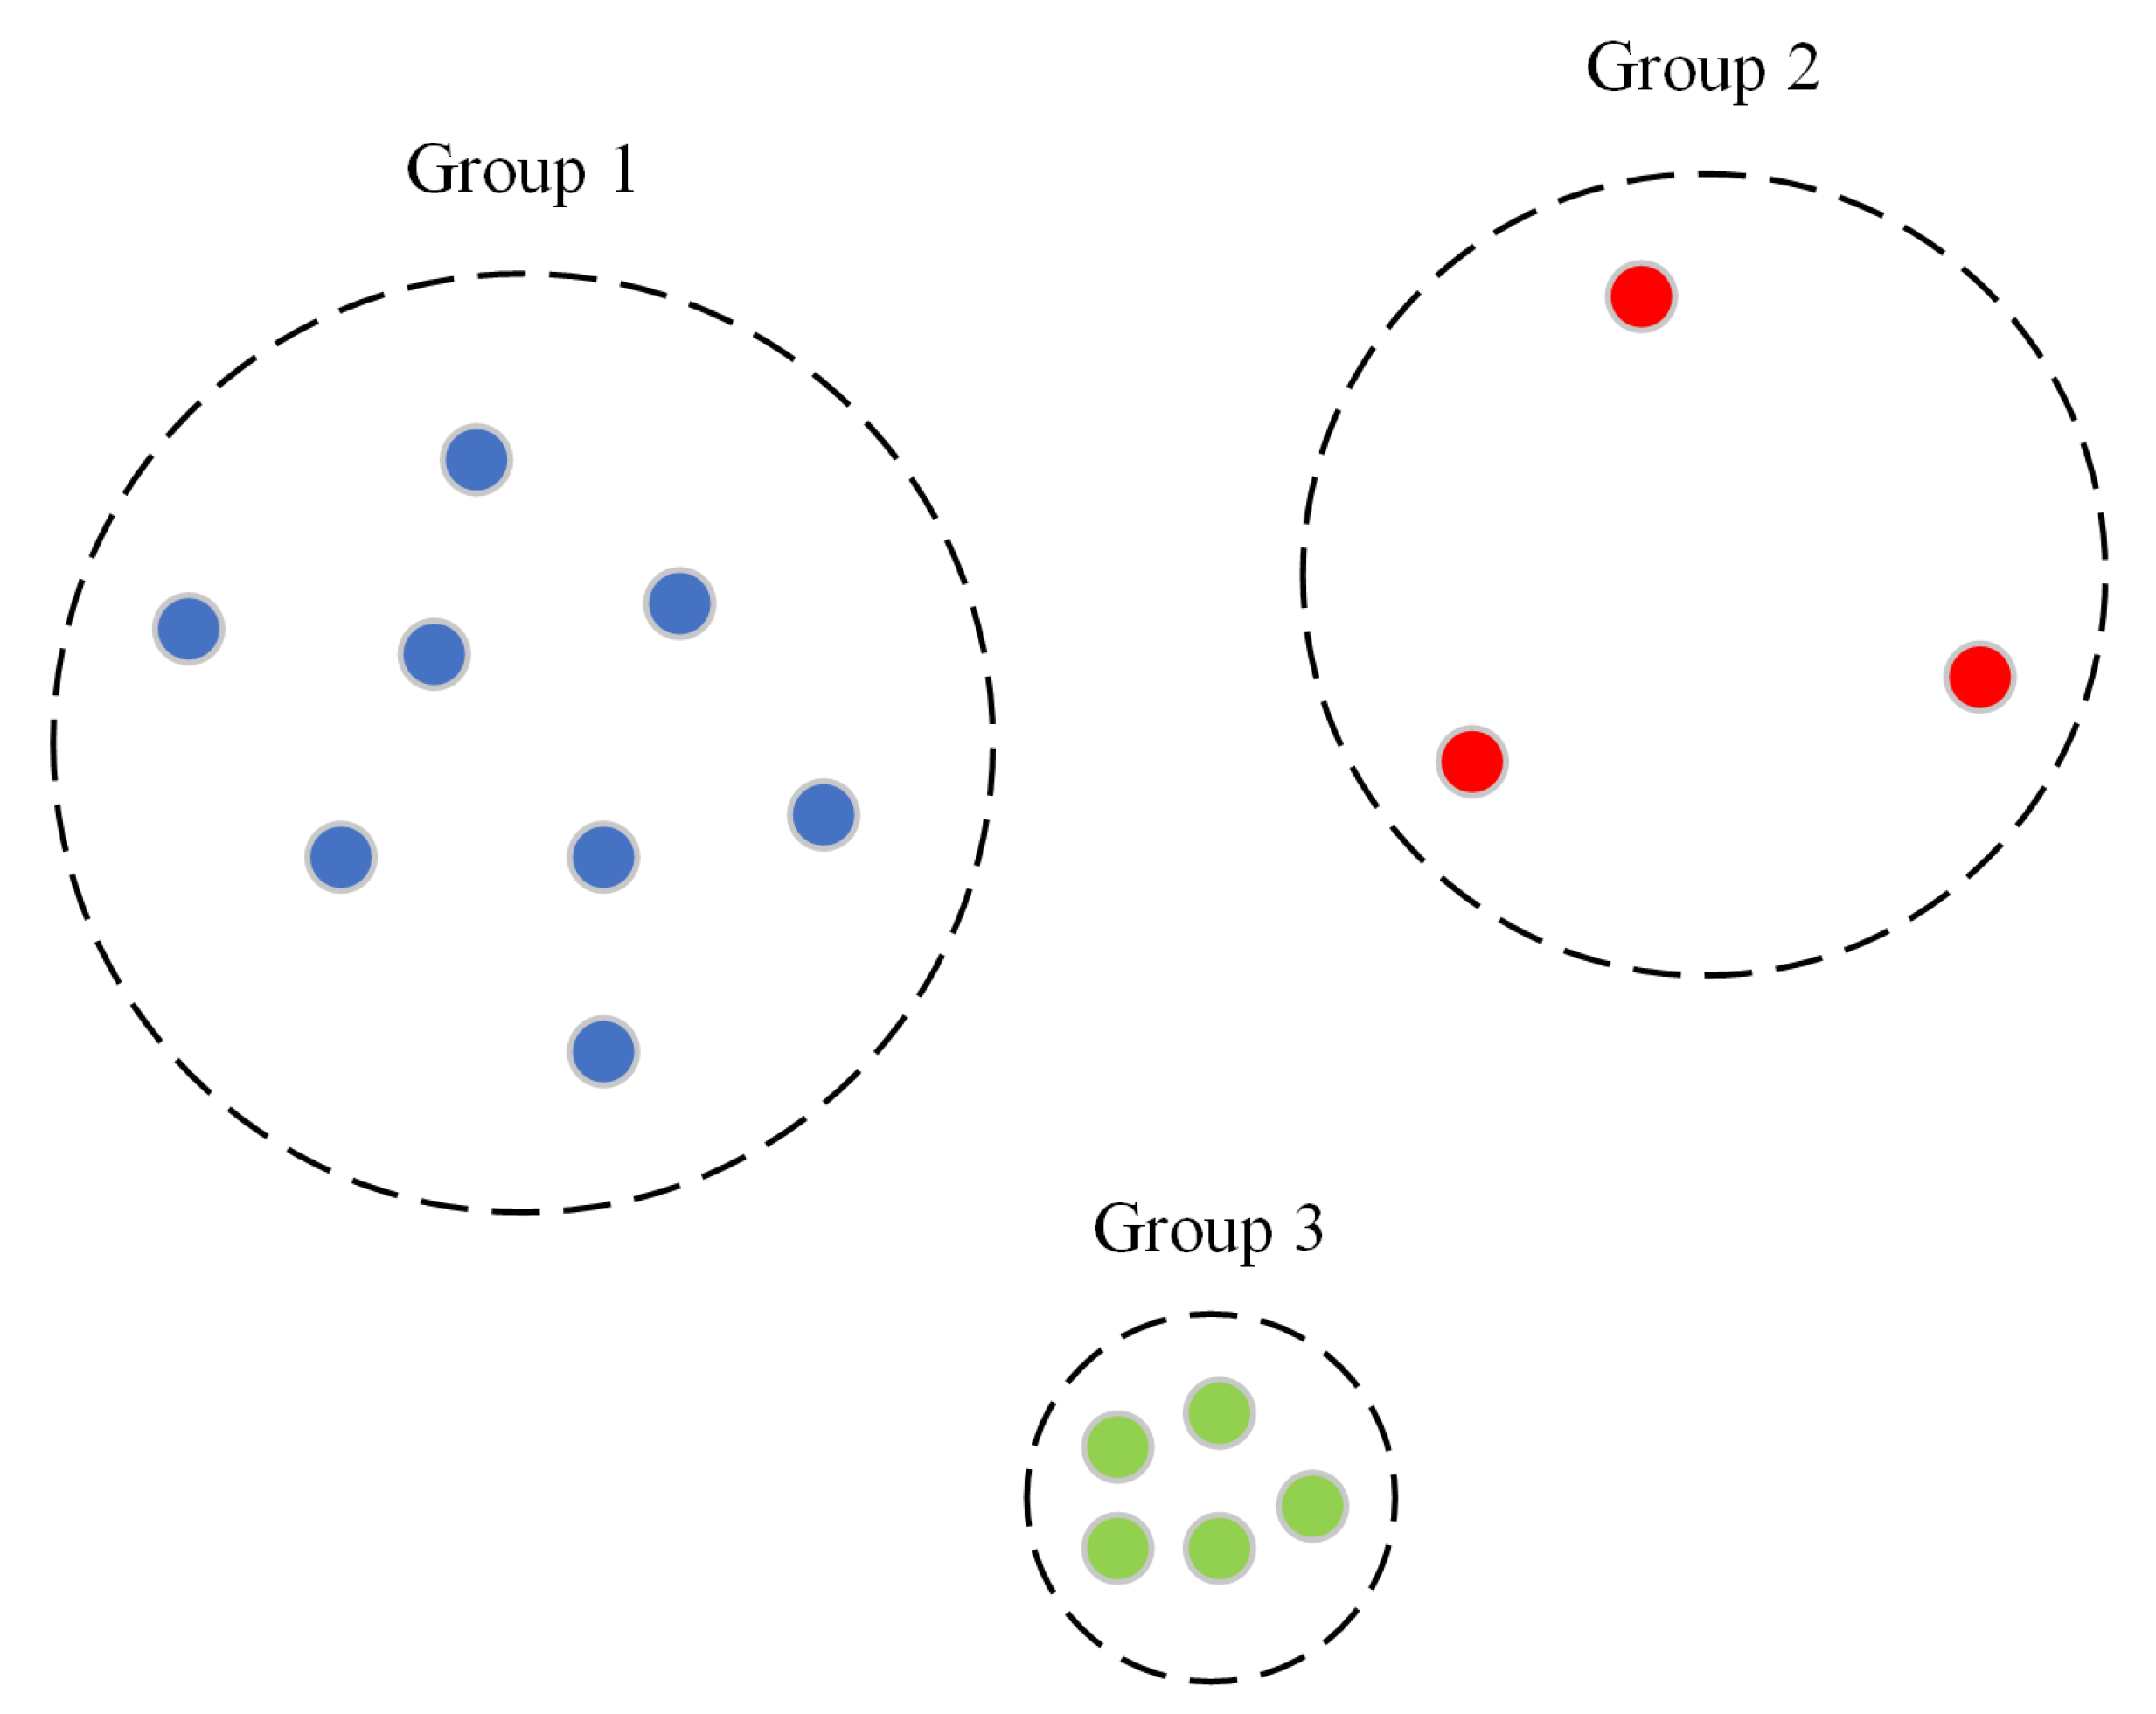
2.3. Spatial Clustering of Maritime Traffic

Performing the TCR-based collision risk analysis can help the maritime safety administration (MSA) to obtain a real-time risk profile for waterways and identify individual ships with high risk to avoid a potential accident. In the meantime, spatial analysis on the collision risk distribution in the area is another tool for maritime safety management to identify clusters that have a high traffic density that could contribute to the occurrence of an accident. Here this research applied a spatial clustering technique to analyse the maritime traffic data, e.g., AIS data, to identify risk hotspots and their spatial-temporal distribution.
As for spatial clustering, various methods can be applied, among which the density-based approaches are widely applied, such as density-based spatial clustering of applications with noise (DBSCAN) [24], hierarchical-DBSCAN (HDBSCAN) [25], ordering point to identify the cluster structure (OPTICS) [26], etc. The principle of these algorithms is to utilise the spatial density distribution of the data with a pre-set threshold to classify them into different clusters, which is shown in Figure 4:
With their intuitive nature and fast performance, density-based clusters have advantages in clustering the AIS data and have been applied in much related research, e.g., [7,27]. In our approach, the DBSCAN method was used to perform the spatial clustering for its simplicity and clear interpretation of the parameter settings.

3. Model Design

The objective of this research is to propose a real-time collision risk analysis and visualisation tool to facilitate maritime safety management in waterways utilising AIS data. Based on this objective, four major components are included in the model, as follows: (1) Data acquisition and process; (2) TCR-based risk analysis; (3) Spatial clustering for traffic characteristics analysis, and (4) result visualisations. The details on the designs of each component are elaborated in the following sections.

3.1. Data Acquisition and Process

AIS is the information exchanging system that broadcasts the static and dynamic information of the ships navigating in the waterways, to facilitate their situation awareness. Suppose ship A is navigating in a waterway, the AIS data broadcasted by it can be expressed as P T ,   V T ,   C T ,   H T ,   L ,   W ,   OD ,   T = timestamp , where P T ,   V T ,   C T ,   H T are the position, velocity over ground, course over ground and heading at timestamp T, and L, W, OD, … are the length, width, and origin-destination, etc. of ship A. Detailed data field information can be found in [28].
According to [28], AIS data are broadcast at an interval between 3 s to 6 mins, depending on the navigation status of the ship. Such a discrepancy in update frequency could lead to difficulties in processing data in real-time, e.g., for a certain moment in time, only one piece of data is received. To deal with such an issue, this study designed an interval-based data buffer for data collection and processing, i.e., at certain intervals, for example 5 s, the AIS data are received and stored for further processing. Secondly, due to the difference in times the data is received in the buffer, an interpolation-based data synchronisation function need to be integrated to ensure that data are trimmed to the same time spot for analysis. Considering the short time interval, this research has applied linear interpolation to perform this task. In practice, the interpolation method should be chosen with caution to fit the time interval of data update. After all the AIS data point received within the interval is processed, a collection of interpolated and synchronised data set can be obtained for further analysis.

3.2. TCR-Based Risk Analysis

TCR-based risk analysis is the core component of the risk analysis and visualisation tool. The function of TCR-based risk analysis lies in several aspects: (1) It should provide the capability of identifying the encounters between ships that have the potential for collision, which is also defined as “collision candidate”, in real-time; (2) It should also provide detailed and quantified collision risks for each individual ship navigating in the region. Such information will be provided to the operators to understand the current risk level and identify potential risks.
To identify the collision candidates, this research has proposed the following criterion: A ship which velocity is inside the VO region induced by target ships (1 or more) would be determined as a collision candidate. Such a definition is different from what was utilized in [19]. This can be explained by the utility of this part is to identify the individuals that have the potential for collision. For real-time traffic management, the VTS operator of the port authority would act on the individuals that could lead to a collision. To achieve such an objective, this step introduced Equation (2) as the criterion [29], which is:
VO A = j = 1 n VO A Ship j t i VO A Ship j t i = P Ship j t i - P A t 0 t i - t 0 ConfP Ship j t i - t 0
where VO A denotes the velocity sets of the own ship (ship A) induced by the target ships, which is the combination of cone-shaped areas in the velocity space of the ship of interest and P Ship j t i - P A t 0 indicates the distance between ship i and the ship of interest at observation timestep t 0 . To make the safety boundary ConfP include the influence of the ship of interest’s length and velocity, this research adopted the quaternion ship domain (QSD) as the criterion [30], which is illustrated in Equation (3):
f x , y ; Q = 2 x ( 1 + sgnx ) R fore - ( 1 - sgnx ) R aft 2 + 2 y ( 1 + sgny ) R starb - ( 1 - sgny ) R port 2 R fore = 1 + 1 . 34 k AD 2 + k DT / 2 2 L R aft = 1 + 0 . 67 k AD 2 + k DT / 2 2 L R starb = 0 . 2 + k DT L R port = 0 . 2 + 0 . 75 k DT L
where R fore , R aft , R startb , R port are the radii of the ship domain in four different directions, respectively. L and V are the length and velocity of the ship of interest, respectively. k AD , k DT are the coefficients which are related to the advance and transverse direction, explained in [30]. With the aforementioned design of the ConfP and velocity obstacle algorithm, the influence of target ships on the velocity space of the own ship can be estimated.
To quantify the collision risk, which is the percentage of the combined VO of the target ships, this research designed three different risk indicators: (1) RConfP, which is the TCR measured with circular ConfP with the radius of the length of the ship of interest; (2) Rdomain, which is the TCR measured with ConfP determined by the ship of interest’s QSD, denoted as QSD-TCR; and (3) Rcomplexity, which is the additional VO induced by the simple union of each individual VO. The objective of these indicators is to measure the complexity of the encounter situation. The calculation process of the three indicators is shown in Equation (4):
R ConfP = VO ConfP V region R QSD = VO QSD V region R complexity = i = 1 n VO individual - V region V region
where VOdimension, VOQSD, VOindividual, are the intersection regions between the VO and the velocity region of the ship of interest, and Vregion is the area of the velocity region of the ship of interest, which indicates all the possible velocities that the ship could take. A major assumption is proposed here to simplify the calculation process, which is that only the changes of course and reduction of velocity are considered as possible collision avoidance measures to construct the velocity region of the ship of interest. With this design, the function of the TCR-based risk analysis can be conducted.

3.3. Spatial Clustering for Traffic Characteristic Analysis

The TCR-based collision risk can provide the risk information of individual ships to the stakeholders to continuously monitor the risk level of ships navigating in the area of interest. In the meantime, identification of ship clusters that could contribute to the complexity of the traffic and also the occurrence of accidents is also necessary for the management of water traffic.
To perform this task, this study applied DBSCAN to perform a density-based ship clustering to identify the ship groups that satisfy certain pre-set criteria. For the application of DBSCAN, two parameters, Eps and MinPts, which represents the density threshold and the minimum number of objects in a cluster, need to be determined. For ships navigating in ports and waterways, normally the detection range of their radar would be 6 nautical miles (nm) and the risk of collision would emerge when the distance between ships is below 6 nm. Therefore, this model set the MinPts as 2 ships and Eps as 6 nm. In the meantime, the determination of these parameters should be adapted to the traffic characteristics in the area when put into practice.

3.4. Result Visualisation

Based on the risk analysis and cluster identification in the aforementioned processes, a visualisation step is applied based on “OpenSeaMap” [31] to display the data. The objective of this step is to enable the operators to visually interpret the maritime traffic situation in the area.
As aforementioned, this research has developed two functionalities in the TCR-based risk module to identify collision candidates and measure their TCR. There will be three scenarios considering these two indicators: (1) The ship is considered as a collision candidate and it satisfies certain TCR; (2) The ship is not considered a collision candidate but it also shows certain TCR; and (3) The ship is not considered as collision candidate and it does not have TCR. These three different scenarios indicate different levels of collision risk. In the visualisation step, the difference between these different scenarios will be elaborated.

4. Case Study

To verify the effectiveness of the proposed model, in this section, a case study on analysing collision risk and collision candidate is conducted. The description of the research data, results of the experiments and visualisation are illustrated in the following sections.

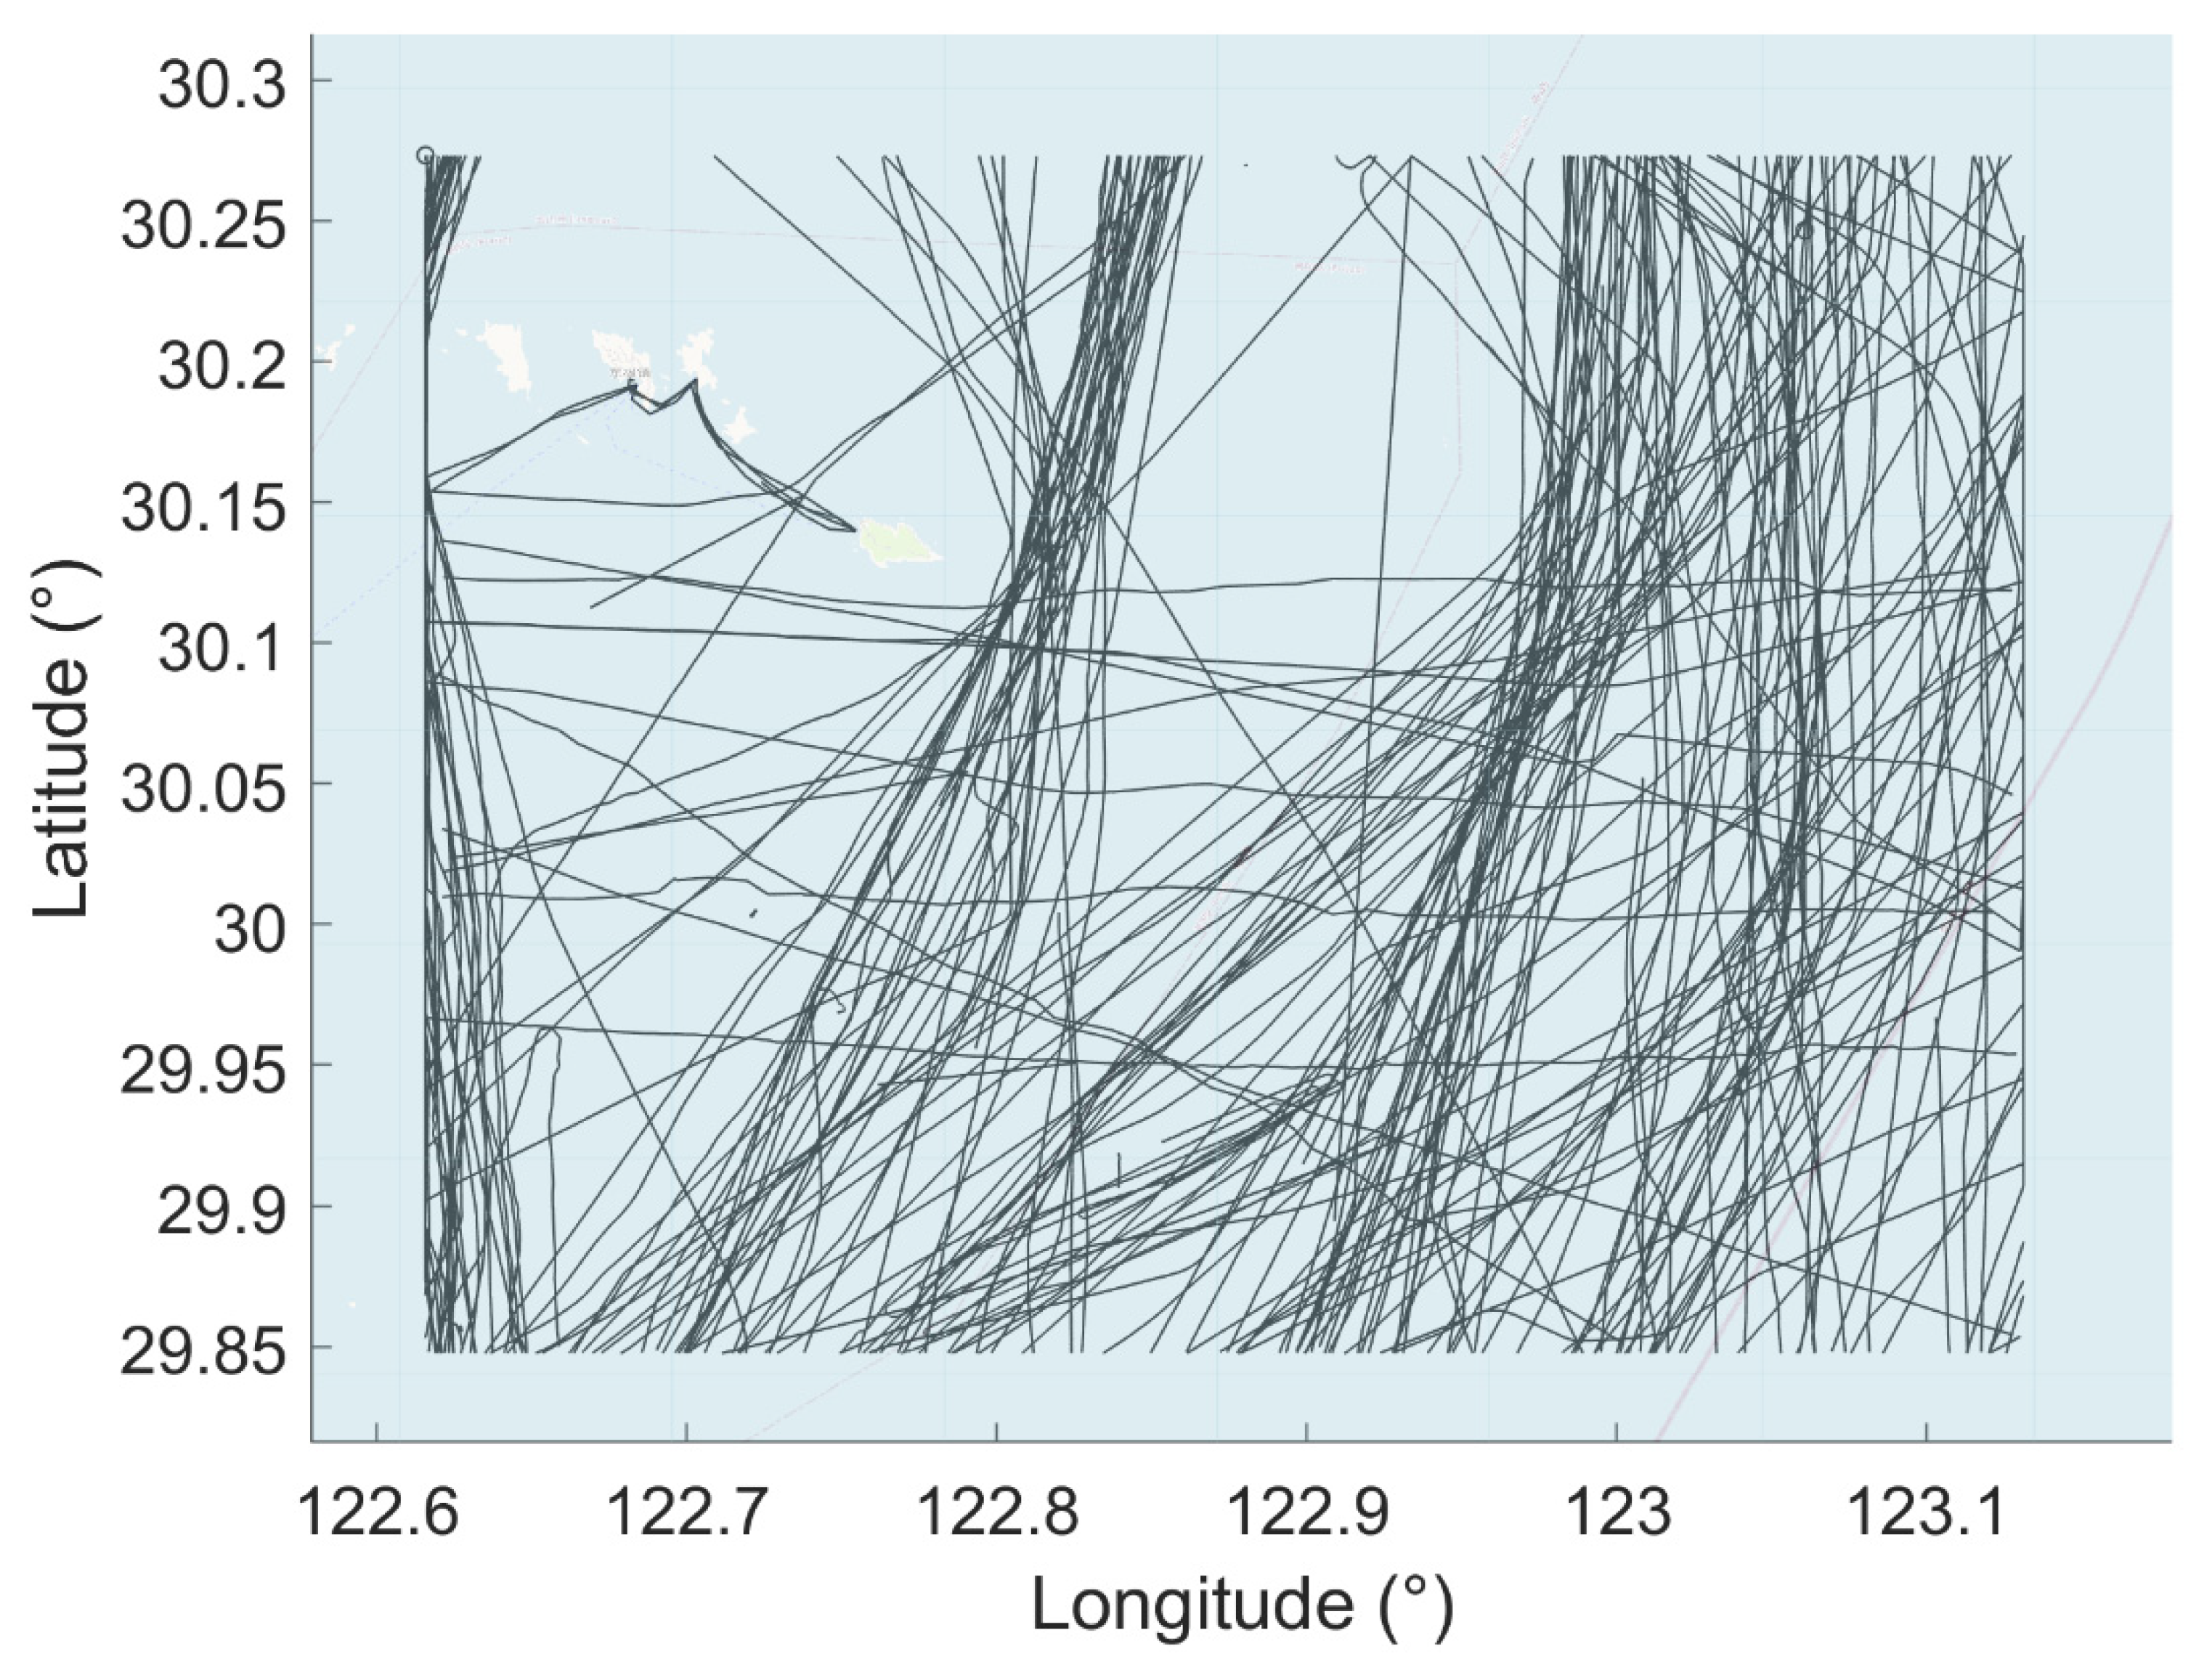
4.1. Data Description and Parameter Setting

An AIS dataset of 24 h duration is introduced to simulate the real-time application. The data was provided by the AIS database from the Wuhan University of Technology School of Navigation. The ship type considered in this research are not specifically processed, and in the meantime, to focus on the risk analysis of collisions, the data representing the mooring or berthing status of the ships are filtered out. The detailed parameter settings of the case study are shown in Table 1.
Due to the lack of a real-time AIS data stream, to conduct the research, historical AIS data has been introduced to simulate the real time data receiving process. To do this, the program will collect and analyse the AIS data at an update interval of 15 s. A linear interpolation process is introduced to synchronise the data to the same timespot for further risk analysis. As for the parameter setting of the ship clustering process, this research set the MinPt to be 2 and Eps as 6 nm. Such a parameter setting is to identify encounters which involve at least two ships and to simulate the normal operation range of the radar onboard individual ships. For the construction of VO and TCR, TCR time has been set to 45 mins, i.e., at the timespot of analysis, the time frame of VOs induced by all target ships will be 45 mins to the future of the timespot. This setting is ensure a balance between model accuracy and computational burden. As for the radius of ConfP in the VO algorithm, this research utilized the summation of the lengths of the ship of interest and the target ship as the parameter. In the meantime, due to the data incompleteness, there is possibility that the length information could be missing. To mitigate this, this research used the average length among the ships in the region as the replacement. The AIS data are illustrated in Figure 5.

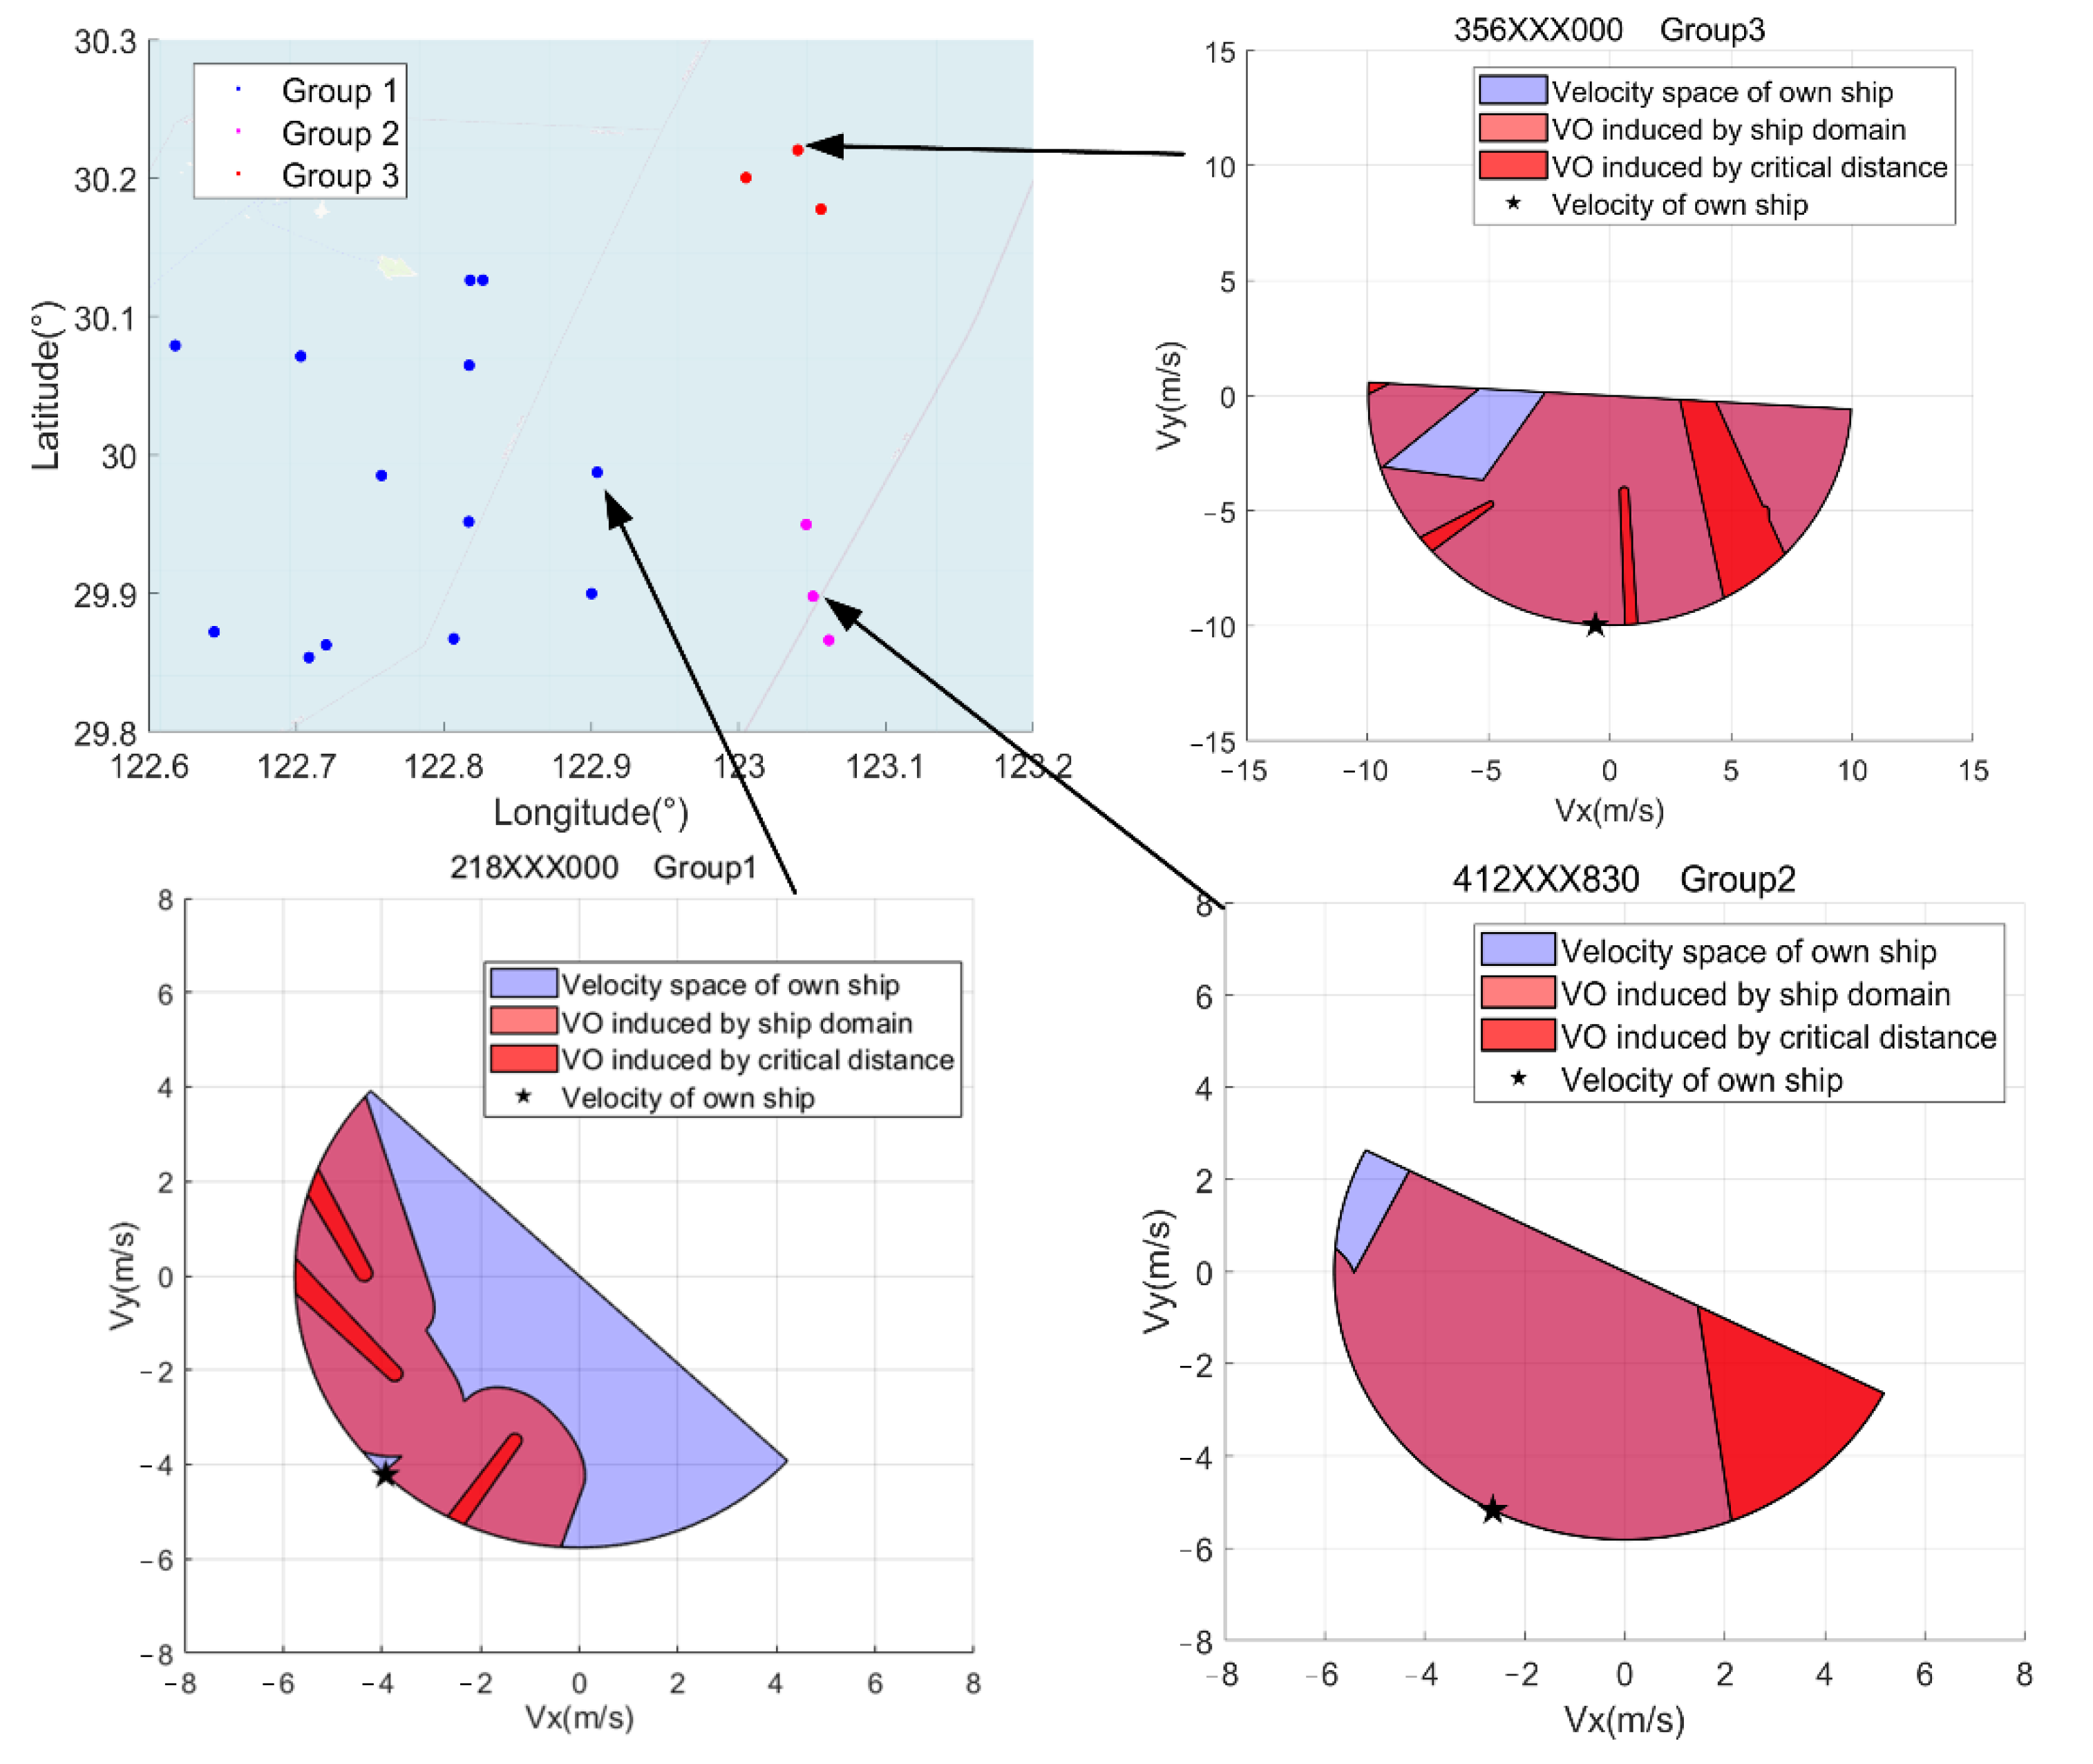
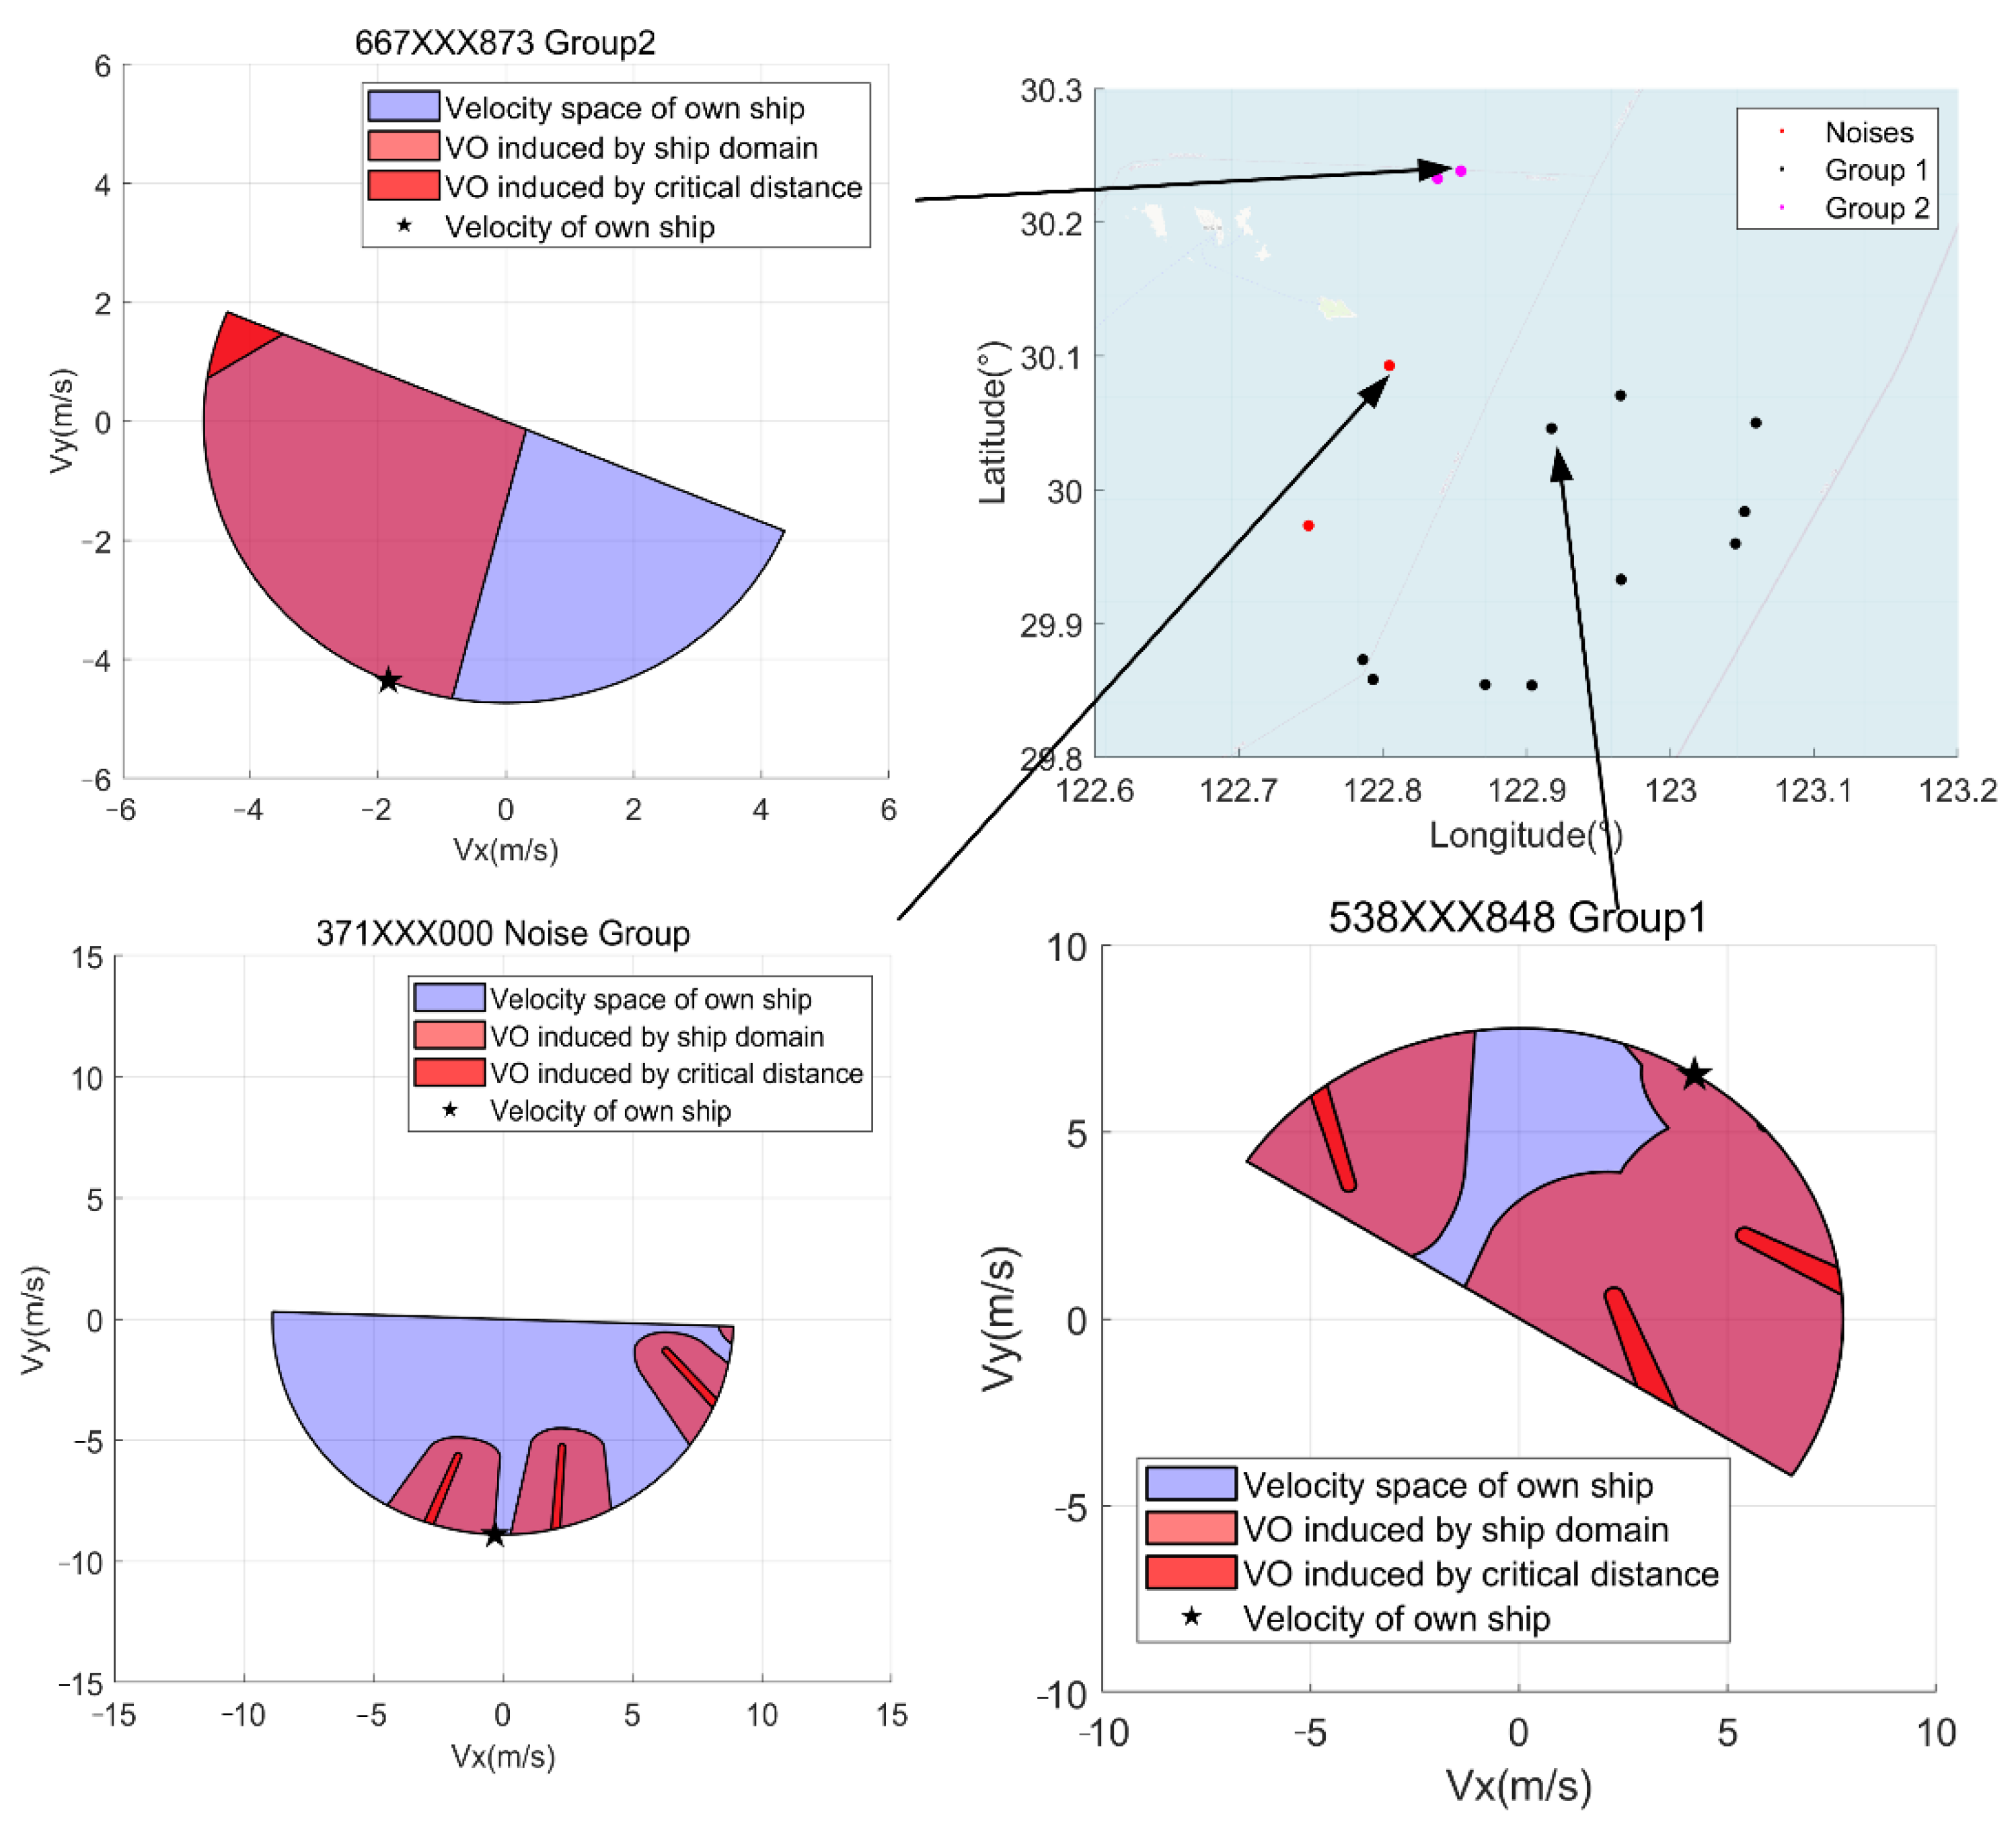
4.2. Results and Visualisation

In this section, two sets of AIS data of ships at different moments during the time period were randomly chosen to verify the capability of the proposed TCR-based collision risk analysis algorithm. After the analysis process, the domain-based TCR, critical distance-based TCR, and encounter complexity are obtained. The visualisation of the clustering of the ships and velocity obstacles of randomly chosen ships of interest are shown in Figure 6 and Figure 7, respectively. The detailed results of these ships are illustrated in Table 2.
As can be seen from Figure 6 and Figure 7, at both timespots more than 20 ships were navigating in the area, which indicates a busy and congested traffic situation. As for timespot 16:13:45, 19 ships are in the area and with the application of the DBSCAN clustering method with MinPt = 2 and Eps = 6 nm, three groups of ship cluster were successfully identified. Among them, group 1 (red) contains most of the ships, which means that ships in group1 would observe multiple targets in their radars and the encounter situation between ships would be complicated. To demonstrate the effect of TCR analysis, the VO has been visualised for three ships (218XXX000, 356XXX000, 412XXX830). For ship “218XXX000”, the critical distance TCR (0.0552) and quaternion ship domain (QSD)-TCR (0.467) shows different descriptions of the encounter.
Most of the velocity space is taken up by the VOs induced by the QSDs of the target ships, which can be seen in Figure 6. It indicates that for the ship “218XXX000”, there are limited velocities available to avoid the violation of QSDs of other target ships in the future. In the meantime, the VOs induced by the critical distance of target ships does not contribute significantly to the risk. This shows that for the own ship “218XXX000”, the collision risk is relatively high at the detection moment and it mainly comes from the QSDs of the target ships. However, the complexity, which means the overlaps between the VOs induced by target ships, that “218XXX000” is involved in is relatively low. Combining the results from a critical distance -TCR, QSD TCR, and complexity, it can see that for the ship “218XXX000”, the collision risk of this encounter is relatively high from the perspective of QSD and its complexity is low.
As for the encounters at timespot 18:56:30 PM, similar results can be obtained for the ships involved (Figure 7 and Table 2). A significant insight in this scenario is the risk analysis on ships that are clustered as “noises” by the DBSCAN algorithm. Ship “371XXX000” is classified as “noise”, which is not belong to any clusters in the data points. However, this does not indicate such ships can be omitted from the risk analysis. As it can see from Figure 7 and Table 2, the QSD-TCR and the complexity of the encounter where it involves are both relatively high, compared with the other two ships shown in the figure. This indicates that although the clustering technique can help the operator identify multiple ships clusters, for risk analysis, the influence of ships outside the cluster should also be considered.
As for the detection of collision candidates, this function is conducted via determining if the velocity of the ship of interest falls into the combined VO induced by the QSDs of the target ships. It can see from Table 2 that all the ships are collision candidates except ship “371XXX000”, however, its QSD-TCR is 0.2836, which means 28.4% of the velocity space is taken up by the VO of target ships. These findings indicate that although such ships are not collision candidates, their collision risk is not negligible.

5. Discussion

In the previous sections, the encounter situations between multiple ships in a region are analysed and the collision risks are measured and visualised. To obtain a deeper understanding of the proposed method and the relationships between the three risk measurements, in this section, three comparisons will be conducted: (1) A comparison between the risk measurement and the complexity measurement; (2) A comparison between the proposed algorithm and the work by [7,8] will be conducted to analyse the difference between risk measured by CPA-based approach and VO-based approach.

5.1. Comparison between Risk Measurement and Complexity

In the previous sections, we have provided three different measurements of the encounter situation with the utilisation of AIS data: (1) Critical-distance TCR; (2) QSD-TCR and (3) encounter complexity. These three indicators provide insights on the encounters that a ship can be involved in from different perspectives. For critical-distance TCR, it focuses on the capability of the ship of interest to avoid the critical distance between ships if no collision avoidance manoeuvre is conducted. If the velocity of the ship of interest falls into this region, it would be defined as a collision candidate with a high potential for an accident. If the critical-distance TCR of the ship of interest is high, it indicates that this ship has large difficulty in avoiding such a situation and needs attention to inform the navigators to avoid it in time. In the meantime, for such a collision risk measurement method, since the threshold for risk is manually determined, the user, e.g., MSA could modify the parameter to better elaborate their interests in risk monitoring and management. For QSD-TCR, it focuses on analysing the capability of the ship of interest navigating free of ship domain violations by other ships. If the velocity of the ship of interest remains outside of this VO region, it means the ship can navigate safely if the kinematic status of the target ships remains constant. If the QSD-TCR is high, it indicates that the velocities for the ship of interest to avoid violating QSDs of other ships is limited, which can be interpreted as a high risk of collision but less critical than the critical-distance TCR indicates. For such a collision risk measurement situation, since the threshold is based on the QSD that reflects the dynamic characteristics of the ship, it could help a MSA to establish a similar situational awareness in the encounter situation. As for the complexity measurement in this research, it provides a totally different perspective on how they understand the encounter. Since multiple ships can be influenced by the encounter situation, the complexity measures the overlaps between the VOs induced by individual ships. If this value is high, it means that ships have a mutual influence on their navigation and collision avoidance processes, and the MSA operator would be suggested to pay attention to these ships.
In practice, since these measurements focus on different perspectives of the encounter, the results could have an inconsistency to some extent. It would be suggested that operator can choose certain indicators based on their focus to obtain a comprehensive picture of the navigation situations in the region.

5.2. Comparison between TCR-Based Approach and CPA-Based Approach

To further investigate the performance of the proposed methods, the regional collision risk analysis methods proposed by [8]. The results are shown in Table 3:
According to Table 2 and Table 3, one can see that although the numerical results from the different methods on the same cases vary from each other, the ordinal results, which are the ships with high risk, are consistent among them. The results of clustering are the same as those obtained with the proposed method because the same DBSCAN algorithm has been integrated. With this inter-method cross-validation, what was obtained is that from these two methods the capability of identifying ship with high collision risk is validated.

5.3. Implications and Limitations of the Method

Collisions between ships are a type of maritime accident which could lead to serious consequences for both individuals and societies. Much attention from both academia and industries has been drawn to reduce its occurrence and maintain safety. Although in literature there are various works on the collision risk analysis and candidate detection with historical AIS data, the real-time analysis still needs much attention. Since the objective of this research is to propose a real-time collision risk analysis and visualisation method, the implication of the proposed algorithm would be focused on facilitating the monitor and surveillance of maritime traffic in certain waterways. The provided information, such as identification of collision candidates, TCRs and the complexity of the encounters, can help the maritime safety operator better understand the navigation situation in the waterways and identify ships that need urgent attention to avoid an accident. However, currently, there are some limitations that need to be improved to achieve better performance. One limitation is that each time the VO method is performed, it omitted the kinematic information of the target and ships of interest in the future and assumes that such status would remain constant. Such an assumption has limited the capability of handling uncertainties of the risk estimation. To improve the capability of the proposed method, a ship trajectory predictor that can consider the uncertainties of ship dynamics can be integrated into the model. However, since this research focuses on the measurement of risk, such a work is out of the scope of this paper. In the meantime, the data set utilized in this research could be extended in the next step to fully extend the capability of the algorithm, instead of verifying its feasibility, and the encounter type and encounter stage should also be incorporated into the algorithm to provide the maritime traffic management stakeholders with a clearer picture of the region.

6. Conclusions

In this research, a velocity obstacle-based ship collision risk analysis and visualisation method is proposed. The collision risk is defined as the percentage of the velocity obstacles induced by target ships and three different indicators: critical distance-TCR, QSD-TCR and encounter complexity are proposed the analyse the encounter situation from different perspectives.
A case study using historical AIS data is conducted to verify the effectiveness of the proposed method and simulate a real-time analysis situation. The results have shown how the risk is measured and illustrate the physical interpretation of the projection of encounter situation into the velocity space of the own ships. Compared with conventional regional collision risk analysis methods, the proposed VO-based collision risk analysis and collision candidate identification can analyse and estimate the risk from three different perspectives: (1) critical-distance TCR; (2) QSD-TCR, and (3) complexity TCR. The contribution of the proposed method is to combine the AIS data and velocity obstacle method to apply them in the regional collision risk monitoring and management. In such a design, the MSA could analyse the ship collision risk with a clearer risk picture and analyse the risk from the capability of collision avoidance perspective. The ships with high collision risk and encounter complexity can be identified. Such information would be beneficial for the MSA operators to regulate the traffic and facilitate the development of autonomous maritime traffic management in the future.

Author Contributions

P.C.: Conceptualization, Methodology, Writing—Original Draft; M.L.: Conceptualization, Methodology, Investigation, Formal analysis, Writing & Editing; J.M.: Methodology, Resources, Supervision, Writing Review. All authors have read and agreed to the published version of the manuscript.

Funding

This research is financially sponsored by the China Scholarship Council (Grant No. 201606950005).

Institutional Review Board Statement

Not applicable.

Informed Consent Statement

Not applicable.

Data Availability Statement

Data available on request due to restrictions of privacy.

Conflicts of Interest

The authors declare no conflict of interest.

References

  1. Sirimanne, S.N.; Hoffman, J.; Juan, W.; Asariotis, R.; Assaf, M.; Ayala, G.; Benamara, H.; Chantrel, D.; Hoffmann, J.; Premti, A.; et al. Review of Maritime Transport; United Nations Conference on Trade and Development (UNCTAD): Geneva, Switzerland, 2019. [Google Scholar]
  2. Mou, J.M.; Chen, P.F.; He, Y.X.; Yip, T.L.; Li, W.H.; Tang, J.; Zhang, H.Z. Vessel traffic safety in busy waterways: A case study of accidents in western shenzhen port. Accid Anal. Prev. 2019, 123, 461–468. [Google Scholar] [CrossRef]
  3. Lisowski, J. Game control of moving objects. Ifac Proc. Vol. 2002, 35, 373–378. [Google Scholar] [CrossRef] [Green Version]
  4. Lisowski, J. The analysis of differential game models of safe ship control process. J. Shanghai Marit. Univ. 1985, 1, 25–38. [Google Scholar]
  5. Chen, P.F.; Huang, Y.M.; Mou, J.M.; van Gelder, P.H.A.J.M. Probabilistic risk analysis for ship-ship collision: State-of-the-art. Saf. Sci. 2019, 117, 108–122. [Google Scholar] [CrossRef]
  6. Lim, G.J.; Cho, J.; Bora, S.; Biobaku, T.; Parsaei, H. Models and computational algorithms for maritime risk analysis: A review. Ann. Oper. Res. 2018, 271, 765–786. [Google Scholar] [CrossRef]
  7. Zhen, R.; Riveiro, M.; Jin, Y.X. A novel analytic framework of real-time multi-vessel collision risk assessment for maritime traffic surveillance. Ocean Eng. 2017, 145, 492–501. [Google Scholar] [CrossRef]
  8. Liu, Z.H.; Wu, Z.L.; Zheng, Z.Y. A novel framework for regional collision risk identification based on AIS data. Appl. Ocean Res. 2019, 89, 261–272. [Google Scholar] [CrossRef]
  9. Zhang, W.; Feng, X.; Qi, Y.; Shu, F.; Zhang, Y.; Wang, Y. Towards a Model of Regional Vessel Near-miss Collision Risk Assessment for Open Waters based on AIS Data. J. Navig. 2019, 72, 1449–1468. [Google Scholar] [CrossRef]
  10. Zhang, W.B.; Goerlandt, F.; Kujala, P.; Wang, Y.H. An advanced method for detecting possible near miss ship collisions from AIS data. Ocean Eng. 2016, 124, 141–156. [Google Scholar] [CrossRef]
  11. Fujii, Y.; Shiobara, R. The Analysis of Traffic Accidents. J. Navig. 1971, 24, 534–543. [Google Scholar] [CrossRef]
  12. Szlapczynski, R.; Krata, P.; Szlapczynska, J. Ship domain applied to determining distances for collision avoidance manoeuvres in give-way situations. Ocean Eng. 2018, 165, 43–54. [Google Scholar] [CrossRef]
  13. Szlapczynski, R.; Szlapczynska, J. Review of ship safety domains: Models and applications. Ocean Eng. 2017, 145, 277–289. [Google Scholar] [CrossRef]
  14. Szlapczynski, R.; Szlapczynska, J. A method of determining and visualizing safe motion parameters of a ship navigating in restricted waters. Ocean Eng. 2017, 129, 363–373. [Google Scholar] [CrossRef]
  15. Montewka, J.; Hinz, T.; Kujala, P.; Matusiak, J. Probability modelling of vessel collisions. Reliab. Eng. Syst. Saf. 2010, 95, 573–589. [Google Scholar] [CrossRef]
  16. Zhang, L.; Meng, Q. Probabilistic ship domain with applications to ship collision risk assessment. Ocean Eng. 2019, 186, 106130. [Google Scholar] [CrossRef]
  17. Gil, M.; Montewka, J.; Krata, P.; Hinz, T.; Hirdaris, S. Determination of the dynamic critical maneuvering area in an encounter between two vessels: Operation with negligible environmental disruption. Ocean Eng. 2020, 213, 107709. [Google Scholar] [CrossRef]
  18. Montewka, J.; Gil, M.; Wróbel, K. Discussion on the article by Zhang & Meng entitled Probabilistic ship domain with applications to ship collision risk assessment. Ocean Eng. 2019, 186, 106130, Erratum in 2020, 209, 107527. [Google Scholar]
  19. Chen, P.F.; Huang, Y.M.; Mou, J.M.; van Gelder, P.H.A.J.M. Ship collision candidate detection method: A velocity obstacle approach. Ocean Eng. 2018, 170, 186–198. [Google Scholar] [CrossRef]
  20. Huang, Y.; van Gelder, P. Time-Varying Risk Measurement for Ship Collision Prevention. Risk Anal. 2020, 40, 24–42. [Google Scholar] [CrossRef]
  21. He, Y.X.; Jin, Y.; Huang, L.W.; Xiong, Y.; Chen, P.F.; Mou, J.M. Quantitative analysis of COLREG rules and seamanship for autonomous collision avoidance at open sea. Ocean Eng. 2017, 140, 281–291. [Google Scholar] [CrossRef]
  22. Fiorini, P.; Shiller, Z. Motion planning in dynamic environments using velocity obstacles. Int. J. Robot. Res. 1998, 17, 760–772. [Google Scholar] [CrossRef]
  23. Huang, Y.M.; van Gelder, P.H.A.J.M.; Wen, Y.Q. Velocity obstacle algorithms for collision prevention at sea. Ocean Eng. 2018, 151, 308–321. [Google Scholar] [CrossRef]
  24. Ester, M.; Kriegel, H.-P.; Sander, J.; Xu, X. A density-based algorithm for discovering clusters in large spatial databases with noise. In Proceedings of the Second International Conference on Knowledge Discovery and Data Mining, Portland, OR, USA, 2–4 August 1996; pp. 226–231. [Google Scholar]
  25. Campello, R.J.G.B.; Moulavi, D.; Sander, J. Density-Based Clustering Based on Hierarchical Density Estimates; Springer: Berlin/Heidelberg, Germany, 2013; pp. 160–172. [Google Scholar]
  26. Ankerst, M.; Breunig, M.M.; Kriegel, H.-P.; Sander, J. OPTICS: Ordering points to identify the clustering structure. Acm Sigmod Rec. 1999, 28, 49–60. [Google Scholar] [CrossRef]
  27. Zhao, L.; Shi, G. A trajectory clustering method based on Douglas-Peucker compression and density for marine traffic pattern recognition. Ocean Eng. 2019, 172, 456–467. [Google Scholar] [CrossRef]
  28. International Telecommunications Union. Technical Classifications of Recommendations ITU-M. 1371-4. Technical Characteristics for an Automatic Identification System Using Time-Division Multiple Access in the VHF Maritime Mobile Band; International Telecommunications Union: Geneva, Switzerland, 2010. [Google Scholar]
  29. Chen, P.; Huang, Y.; Papadimitriou, E.; Mou, J.; van Gelder, P.H.A.J.M. An improved time discretized non-linear velocity obstacle method for multi-ship encounter detection. Ocean Eng. 2020, 196. [Google Scholar] [CrossRef]
  30. Wang, N. An Intelligent Spatial Collision Risk Based on the Quaternion Ship Domain. J. Navig. 2010, 63, 733–749. [Google Scholar] [CrossRef]
  31. Openstreetmap. Available online: https://www.openstreetmap.org/ (accessed on 17 August 2020).
Figure 1. Framework of the proposed collision risk analysis method.
Jmse 09 00428 g001
Figure 2. Illustration of TCR.
Jmse 09 00428 g002
Figure 3. Spatial-temporal relationship between encountered ships.
Jmse 09 00428 g003
Figure 4. Example of density-based clustering.
Jmse 09 00428 g004
Figure 5. Ship trajectories in the research area at 8 AM 7th to 8 AM 8th March 2018.
Jmse 09 00428 g005
Figure 6. Visualization of ship clustering and TCR of random ship in the groups at 16:13:45.
Jmse 09 00428 g006
Figure 7. Visualization of Ship clustering and TCR of random ship in the groups at 18:56:30.
Jmse 09 00428 g007
Table 1. Parameter settings for case study.
VariableSetting
Data period08:00 7th to 08:00 8th March 2018 (UTC + 8)
Data boundaryLatitude: 29.8475-30.2733° N, Longitude: 122.6157-123.1313° E
Update frequency15 s
Eps6 nm
MinPt2
TCR time45 min
ConfPLength (own ship + target ship)
Ship Length (if no data available)200 m
Table 2. Results of collision risk analysis for certain ships in the cases.
Original TimeInterpolation TimespotMMSICritical TCRDomain TCRComplexityGroupCollision Candidate
16:13:5958439218XXX0000.05520.46701.13501Yes
16:13:5658439356XXX0000.14200.91291.62813Yes
16:13:4858439412XXX8300.17110.96401.00142Yes
18:56:4168204371XXX0000.02380.28361NoiseNo
18:56:3768204538XXX8480.04460.79381.29221Yes
18:56:3768204667XXX8730.01630.592612Yes
Table 3. Results of collision risk analysis using the method proposed by [8].
Original TimeInterpolation TimespotMMSI (Maritime Mobile Service Identify)M2 [8]ComplexityGroup (DBSCAN)
16:13:5958440218XXX0000.101891.1271
16:13:5658440356XXX0000.603422.2893
16:13:4858440412XXX8300.3257812
18:56:4168204371XXX0000.0727461.244Noise
18:56:3768204414XXX0000.195051.1581
18:56:3768204667XXX8730.772141.0032
Publisher’s Note: MDPI stays neutral with regard to jurisdictional claims in published maps and institutional affiliations.

