Article

A Local Semi-Fixed Ghost Particles Boundary Method for WCSPH

1
College of Shipbuilding Engineering, Harbin Engineering University, Harbin 150001, China
2
International Joint Laboratory of Naval Architecture and Offshore Technology between Harbin Engineering University and Lisbon University, Harbin 150001, China
*
Author to whom correspondence should be addressed.
J. Mar. Sci. Eng. 2021, 9(4), 416; https://doi.org/10.3390/jmse9040416
Submission received: 5 February 2021 / Revised: 9 April 2021 / Accepted: 9 April 2021 / Published: 13 April 2021
(This article belongs to the Section Ocean Engineering)

Abstract

:
Due to the convenience and flexibility in modeling complex geometries and deformable objects, local ghost particles methods are becoming more and more popular. In the present study, a novel local semi-fixed ghost particles method is proposed for weakly compressible smoothed particle hydrodynamics (WCSPH). In comparison with the previous local ghost particles methods, the new boundary method can effectively reduce spurious pressure oscillations and smooth the flow field. Besides, the new generation mechanism of fictitious particles is simple and robust, which is suitable for all kinds of kernel functions with different sizes of the support domain. The numerical accuracy and stability of the new smoothed particle hydrodynamics (SPH) scheme are validated for several typical benchmark cases. A detailed investigation into the pressure on solid walls and the surface elevation in dynamic simulations is also conducted. A comparison of numerical results shows that the new boundary method helps reduce the oscillations in the numerical solutions and improves the numerical accuracy of the pressure field.

1. Introduction

Smoothed Particle Hydrodynamics (SPH) is a fully Lagrangian numerical method, that has been successfully applied in many areas, including astronomy, biomedicine and computational fluid dynamics. Due to its Lagrangian nature, SPH has the advantage over grid-based approaches in simulating strongly nonlinear and discontinuous phenomena. For this reason, SPH methods are adopted by many researchers to simulate strongly nonlinear free-surface flows, and a good agreement with experiments has been obtained [1,2]. Despite these encouraging achievements by the SPH community, problems such as boundary treatments and pressure oscillations still exist in hydrodynamic simulations, and prevail in weakly compressible SPH (WCSPH) [3]. Further research is needed to improve the numerical stability and accuracy.
The foundation of SPH is the kernel-based interpolation theory. The physical system of concern is discretized into a set of particles. These particles possess material properties and interact with each other within the support domain governed by a weight function or smoothing function [4,5]. The physical quantities of particles, such as density, velocity and acceleration, are obtained by solving the governing equations discretized according to the SPH algorithm. In order to satisfy the boundary conditions on the solid walls and on the free surface, the kernel of fluid particles near boundaries is truncated, which, however, would introduce numerical errors and deteriorate the calculation of fluid particles’ properties. In addition, fluid particles may also cross the wall if a coarse discretization is used around the boundaries. Thus, imposing boundary conditions is still one of the major challenges in the SPH community [1].
There exist many different wall boundary models of SPH, among which the repulsive function approach and the fictitious particle approach are probably the most popular ones.
The repulsive function approach was initially devised by Monaghan [6] based on the Leonard–Jones potential force. A repulsive short-range force is exerted by the wall boundary on the fluid particles so as to impose boundary conditions. This method was improved by Monaghan and Kos [7] and soon widely used due to its simplicity and applicability to complex geometries and deformable objects [8]. However, an empirical relationship is required to evaluate the repulsive forces, and the kernel truncation near the boundary is improperly treated. For this reason, the numerical stability and accuracy are not guaranteed.
In recent years, the fictitious particle approach is widely used to impose boundary conditions in SPH. The foundation of the method is the use of additional fictitious particles that are placed outside the fluid domain and adjacent to the wall boundary to complete the support domain and ensure the consistency of the kernel of fluid particles. Based on the means of generation of fictitious particles, methods of this kind can be sub-divided into three main types: fixed ghost particles method, mirror particles method and local ghost particles method.
The Fixed Ghost Particles (FGPs) method was devised from the Dynamic Boundary Particles (DBPs) method [9] and improved by Crespo et al. [10]. In the DBPs method, the boundary particles representing the wall are pre-generated at the initial state, and their locations are fixed to the boundaries throughout the entire simulation. The physical properties of boundary particles are treated as fluid particles to satisfy the same governing equations. Fluid particles approaching the boundary will create a rise in density of the boundary particles and result in a repulsive force acting on the fluid particles to satisfy the non-penetration condition. Marrone et al. [11] and Adami et al. [12] improved the DBPs method and proposed the FGPs method. New calculation methods are applied to compute the properties of boundary particles in order to prevent spurious pressure oscillations and improve numerical stability. Marrone et al. [11] introduced an interpolation point, which is obtained by mirroring the position of a fixed ghost particle into the fluid domain along the solid boundary, to compute the physical quantities of each fixed ghost particle. Adami et al. [12] greatly simplified the computation where a local force balance between the wall and fluid particles is adopted to compute the pressure of fixed ghost particles. The FGPs method is simple, numerically stable and accurate, and can be applied to complex geometries, but it cannot deal with deformable boundaries because the varying distance between ghost particles could result in particle penetration and numerical instability.
The mirror particles method was introduced by Randles and Libersky [13]. Unlike FGPs, mirror particles are generated by mirroring or reflecting the fluid particles into the boundary domain at every time step. The physical quantities of mirror particles share the same properties with the fluid particles except for the velocity. An anti-symmetric velocity is given to the mirror particle to satisfy the non-slip boundary condition. It is obvious that the mirror particles method can handle deformable boundaries and Fluid Structure Interaction (FSI) problems. But a problem with the method is that it is difficult to mirror fluid particles on geometrically complex surfaces, especially in corners and curved surfaces, where the mirror particles are non-uniformly distributed or even piled up. In such a case, there will be too many or too few mirror particles interacting with fluid particles at the boundary, which will cause large pressure oscillations if not treated properly. Sophisticated algorithms have been proposed to improve the method [14], but the problem is still present.
The local ghost particles method has become popular in recent years. As implied by its name, the fluid particles near the boundary are treated separately and locally, which avoids the problem of fictitious particles piling up around corners. Therefore, the restrictions on the boundary geometries are largely removed. Ferrari et al. [15] proposed a local mirror image method based on a local point symmetry technique. Unlike the plane-symmetry technique used in the mirror particles method, where the mirror particles are generated by directly mirroring all the fluid particles near the boundary, the local point symmetry technique mirrors the fluid particles separately. At every time step, each fluid particle near the boundary possesses a unique set of uniformly distributed fictitious particles that are generated in the boundary domain and used to complete the support domain of the fluid particle. The physical quantities of the fictitious particles are calculated by extrapolating the fluid particle’s properties to satisfy the boundary conditions. The local mirror image method was improved by Vacondio et al. [16] and Fourtakas et al. [17], who optimized the distribution of fictitious particles in the truncated support domain by modifying the generation mechanism. Fourtakas et al. [18] used a local uniform stencil of fictitious particles around the fluid particles that move with the fluid particle and are only activated when they are located inside the boundary domain. The local ghost particles method has not only the capability of dealing with complex geometries and deformable objects, but also approximate zero and first-order consistency in the moments of the kernel. However, the numerical behavior of pressure on the wall boundaries in dynamic scenarios is still unclear, and a systematic investigation is to be carried out.
As can be seen from the above, none of these methods is superior to others in all the aspects. The fixed ghost particles method is the most robust and produces the smoothest fluid pressure field, while the local ghost particles method is probably the best for complex geometries. Combining the merits of the two methods, this paper presents a new boundary treatment technique which is applicable to 2-D complex geometries and deformable objects and produces much smoother solutions for the pressure. The stability and accuracy of the method is validated for several benchmark cases including a still water test, a dam break case and some sloshing cases in water tanks. A thorough investigation into the pressure on solid walls is also conducted for dynamic scenarios.

2. The SPH Scheme

The governing equations following the Navier–Stokes equations can be expressed in Lagrangian form as:
{ d ρ d t = ρ v d v d t = 1 ρ P + F + Θ
where ρ ,   v ,   P ,   F and Θ denote the density, the velocity, the pressure, the external body force and the diffusion terms, respectively.
Based on the assumption that the fluid is weakly compressible, the continuity and momentum equations are coupled by means of the Tait’s equation of state:
P = ρ 0 c s 2 γ [ ( ρ ρ 0 ) γ 1 ]
where ρ 0 is the nominal density of the fluid (1000 kg / m 3 ), c s is the numerical speed of sound, which is set to a value more than 10 times the maximum speed of the fluid, and γ is an empirical parameter set to 7 [19]. P is set to a non-negative value to guarantee numerical stability.
The foundation of the SPH method lies on two important approximations: the kernel approximation and the particle approximation. The kernel approximation introduces a smoothing function f that can transform differential equations into integral equations. The kernel approximations of f and its derivative in a continuum domain are:
{ f ( r ) = f ( r ) W ( r r , h ) d r f ( r ) = f ( r ) W ( r r , h ) d r
where W is the kernel function defined over the support domain, r the position vector, and h the smoothing length. The particle approximation discretizes the support domain into particles that possess physical properties. Thus, Equation (3) becomes:
{ f ( r ) j m j f ( r j ) ρ j W ( r r j , h ) f ( r ) j m j f ( r j ) ρ j W ( r r j , h )
where the subscript j denotes the neighboring particles in the support domain, and m j and ρ j represent the mass and the density of particle j , respectively. In the present study, the Wendland kernel is adopted due to its simplicity and low computational requirements [20]:
W ( r , h ) = { a d ( 1 q 2 ) 4 ( 2 q + 1 ) 0 q 2 0 q > 2
where a d = 7 4 π h for 2D formulations, and q = | r r | h .
According to the SPH methodology, the continuity and momentum equations (Equation (1)) can be expressed in a discrete form:
{ d ρ i d t = j m j ( v i v j ) W i j d v i d t = j m j ( P i ρ i 2 + P j ρ j 2 + Π i j ) W i j + F
where the subscript i and j denote the particle of concern and a neighboring particle of particle i in the support domain, respectively, and Π i j is the viscosity term. The spurious pressure oscillations can be damped effectively by introducing the viscosity terms, especially in dynamic problems. In the present study, the artificial viscosity proposed by Monaghan [4] is applied to the momentum equation:
Π i j = { α c ¯ i j μ i j ρ ¯ i j v i j r i j < 0 0 v i j r i j > 0
μ i j = h v i j r i j | r i j | 2 + η 2
where r i j = r i r j , v i j = v i v j , η 2 = 0.01 h 2 , c ¯ i j and ρ ¯ i j are the average values of the numerical sound velocities and densities of particles i and j , and α is the artificial viscosity coefficient, which is a tuning parameter determined according to the characteristics of the specific problem of concern.
The fluid particles can move freely due to their Lagrangian nature, which makes it convenient to simulate strongly discontinuous phenomena. However, during the free movement of the particles, the number of neighboring particles in the support domain can become either too low or too high, which causes severe oscillations in density and pressure [3]. In order to obtain a smooth and stable pressure field, a density re-initialization technique [21] was introduced in the WCSPH to solve the problem. In this study, the first-order Moving Least Squares (MLS) method is also applied to re-initialize the density field of fluid particles at every time step, and the predictor-corrector scheme is adopted for the time integration [19]. The time step in this paper is dependent on the Courant condition [22] and the forcing term condition [23].

3. Wall Boundary Conditions Methodology

The new method proposed is hereafter referred to as the local semi-fixed ghost particles method to distinguish from the local mirror image method [15] and the local uniform stencil method [18]. Although all these methods are based on the same idea of generating fictitious particles, separately and locally, in the boundary domain, to complete the truncated support domain of fluid particles, there are some differences between them in the mechanism of fictitious particles generation that will eventually lead to different numerical results.
The local mirror image method [15] was improved by Fourtakas et al. [17], who introduced a new mechanism of generating fictitious particles. As shown in Figure 1, the strategy for generating the fictitious particles depends on r i w , which is the distance between the fluid particle i and the solid boundary r i w = r i w n w , where n w is the normal to the surface pointing into the fluid. If r i w < Δ x , where Δ x is the initial uniform particle spacing, then the fictitious particles are generated by mirroring the fluid particles about the solid boundary. If Δ x < r i w < 2 h , the fictitious particles are generated from the natural uniform extension based on the fluid particle’s position in the boundary domain. The positions r f N of fictitious particles in the boundary domain are given by Equation (9):
{ r f N = r i + N Δ x Δ x < r i w < 2 h ,   N = 2 ,   3 , n s m t r f N = r i + 2 N r i w r i w Δ x ,   N = 1 ,   2 , n s m t
where the subscripts i , f denote the fluid particle and the fictitious particles, respectively, the subscript w represents the wall boundary, and n s m t = int [ 2 h / Δ x ] (the Wendland kernel is adopted herein with h = 1.33 Δ x and n s m t = 2 ). As shown in Figure 1b, the spacing between fictitious particles of different layers varies with the distance r i w , which will cause clumps of fictitious particles for a small r i w . Given the fact that the repulsive force of the wall boundary acting on the fluid particles is mainly produced by these fictitious particles, that are generated when r i w Δ x , it is clear that the wall boundary mainly influences the fluid particles within the distance of Δ x from the solid wall. Because when r i w > Δ x , the fictitious particles mainly contribute to complete the truncated kernel of the fluid particles, and the repulsive force produced from the boundary domain is small, the range of influence from the wall boundary is relatively small in comparison with the radius of the support domain. In Fourtakas et al. [17], only the smooth velocity and pressure fields were obtained, while the detailed comparison and analysis of the pressure values on the solid boundaries were not presented.
For the local uniform stencil method [18], a local uniform stencil of fictitious particles is generated around the fluid particle at the initial state, which moves with the fluid particle during the simulation. The distance between the neighboring particles is always equal to the uniform particles spacing Δ x . When the support domain of the fluid particle is truncated by the solid wall, the fictitious particles within the fluid domain are discarded, and only those located outside the solid wall actually contribute to the calculation of the fluid particle’s properties. Thus, a uniform distribution of fictitious particles near the boundary is maintained, as shown in Figure 2. The pressure of fictitious particles is given by:
P f = P i + ρ 0 g r i f | r w f r i w |
where r w f = r w f n w is the distance between the fictitious particle i and the wall boundary. Equation (10) ensures that P / n when r i w 0 . The non-penetration boundary condition is satisfied by the repulsive pressure. However, due to the extremely unstable pressure value P f , numerical errors may be introduced in the meantime.
For the local semi-fixed ghost particles method, fictitious particles associated with the fluid particle near the boundary are generated along the solid boundary. As shown in Figure 3, a central fictitious particle f p is firstly generated by projecting the fluid particle onto the solid boundary if the fluid particle’s support domain is truncated by the wall boundary. And then, around the central fictitious particle f p , a set of uniformly distributed fictitious particles f associated with the fluid particle is generated in the normal and tangent directions of the solid boundary, with the uniform particle spacing Δ x being the distance between neighboring fictitious particles, which is the same as the local uniform stencil method. At the next instant, a new set of fictitious particles are generated for the fluid particle under the same mechanism. Such a process looks as if the set of fictitious particles are moving in the tangential direction of the boundary profile. Since fictitious particles are fixed to the solid boundary in the normal boundary, “semi-fixed” is used to refer to the present method and also to distinguish from the existing methods. In this method, special treatments are needed for generating fictitious particles in the corners and curved surfaces. For fluid particles located around the corner, the central fictitious particle f p is set at the corner point if r < 2 Δ x . Other fictitious particles are generated based on the central fictitious particle f p and the solid boundary, as shown in Figure 4b. In this case, the method for generating fictitious particles approximately degenerates to the fixed ghost particles method, and a detailed description can be found in Marrone et al. [11]. If r > 2 Δ x , two central fictitious particles f p are generated, respectively, at the different boundaries, as shown in Figure 4a. In the case of a curved surface, the treatment depends on the curvature. It can be treated approximately as a plane surface if the radius of the curvature is large enough. Otherwise, it will be treated as a corner, and the position of the central fictitious particle f p is regarded as the corner point.
The new generation mechanism of fictitious particles is simple and robust, which suits all kinds of kernel functions with different sizes of support domains. It is obvious that the repulsive force of the wall boundary can act on any fluid particle whose support domain is truncated by the solid boundary. Thus, the influence range of the repulsive force from the wall boundary is equal to the radius of the support domain, which is different from the local mirror image method mentioned above. The size of the support domain plays an important role in the numerical stability of the pressure field, which will be discussed in the next section.
In order to impose boundary conditions for the fluid at the boundary, physical quantities of the fictitious particles should be properly assigned. The mass of the fictitious particles is set equal to the mass of the fluid particle to ensure mass conservation,
m f = m i
the pressure of the fictitious particles is given by a hydrostatic pressure correction:
P f = P i + ρ 0 g r i f
and the density of the fictitious particles is calculated according to the equation of state (Equation (2))
ρ f = ρ 0 γ P f ρ 0 c s 2 + 1 γ
To impose the non-slip boundary condition, the assigned velocity of the fictitious particles u f located at the boundary is equal to the wall boundary velocity u w
u f = u w
and the velocity of other fictitious particles is assigned according to the Takeda method [24]
u f = ( u i u w ) | r w f r i w | u w
where u i is the fluid particle’s velocity.
To approximate a free-slip condition, the viscosity term in the momentum equation is ignored in the interaction of the fluid particle with the fictitious particles, and it is not necessary to calculate the fictitious particles velocities [25]. The velocity in the continuity equation is set to the wall velocity regardless of the slip condition, and the non-penetration boundary condition is satisfied naturally by the repulsive force of the fictitious particles, especially by the central fictitious particle that is generated by projecting the fluid particle onto the solid boundary in the normal direction of the solid boundary.
As for the pressure measurement on solid walls, the physical pressure of the pressure sensor point is computed by the pressure of the closest fluid particle and a hydrostatic pressure correction (Equation (12)).

4. Numerical Results

To verify the new SPH scheme proposed in this study, several representative test cases are simulated by SPH with two different smoothing lengths: h = 1.33 Δ x and h = 2.00 Δ x . The radius of the support domain has a great influence on the computation efficiency and the stability of the pressure field. The numerical accuracy and stability of the new SPH scheme is validated by comparing the SPH results with experimental ones as well as with numerical results available in the literature.

4.1. Still Water Case

The investigation of hydrostatic pressure and particles distribution in a tank partially filled with still water is a classical benchmark problem in SPH. In this section, a 2D hydrostatic simulation of the water tank with a wedge is conducted. As shown in Figure 5, the breadth of the tank is B s w = 4.0   m , and the initial water depth is d = 2.0   m . The height and breadth of the wedge are W B = 1.0   m and W H = 1.0   m , respectively. A pressure sensor is placed on the left wall and 1.0 m above the bottom. As in Fourtakas et al. [17], the density of the water is ρ = 1000   kg / m 3 , the numerical speed of sound is c s = 80   m / s , and the artificial viscosity coefficient is α = 0.1 . The particle spacing is set to Δ x = 0.05   m , and the total numbers of fluid particles is 2962. The time step is 0.00005 s. The free-slip boundary condition is applied near the boundary.
Figure 6 shows the pressure field and particle distribution snapshots 15 s after the initial disturbance, and the value of the pressure sensor has become stable, as shown in Figure 7. It can be seen in Figure 6 that both pressure fields are smooth. No unphysical gaps exist between the particles adjacent to the boundary. The fluid particle distribution in Figure 6a, with smaller smoothing length, is more uniform than that in Figure 6b. The fluid particles in Figure 6a have reached their balance position, while the fluid particles in Figure 6b are still moving slightly. This is because more fictitious particles will be generated for the fluid particle near the boundary if a larger smoothing length is used, and the pressure of fictitious particles is computed by a hydrostatic pressure correction based on the pressure and position of the fluid particle. This means that the fluid particle with larger smoothing length is more sensitive to the boundary and takes more time to reach a stable position in the hydrostatic simulation. This can also be seen in Figure 7.
Figure 7 shows the pressure histories of the pressure sensor in SPH simulations and gives relatively stable numerical results for this still water tank with hydrostatic pressure. In the simulation with the smaller smoothing length, the relative error from the analytical value is below 2.7%, and the pressure history of the pressure sensor keeps descending slowly with time because of the small numerical diffusion. The pressure curve is close to the analytical solution. For the other simulation with a larger smoothing length, although the relative error is about 4.0% and the pressure curve has small fluctuations, the error is still in a reasonable and acceptable range. The pressure fluctuations mainly come from the subtle movement of fluid particles near the pressure sensor.
Figure 8 shows the hydrostatic pressure of all fluid particles in the fluid field at 15 s. It can be observed that the pressure profiles nearly coincide with the analytical values. This is an important improvement in numerical accuracy over the results obtained by Fourtakas et al. [17] with the local mirror image method, as shown in Figure 8.

4.2. Dam Break Case

To investigate the numerical accuracy of the new boundary method, the dam break case, which is a typical benchmark case for the simulation of free surface flows with many complex nonlinear phenomena, is simulated using the new SPH scheme and also the commercial code STAR-CCM+, which is based on the Finite Volume Method (FVM). For the dam break case [17,26], a water column is at the left boundary of the water tank, which is 4.0 m wide and 10.0 m high. The height and the breadth of the water column at the initial state are H 0 = 2.0   m and B 0 = 1.0   m , respectively, as shown with the black shadow in Figure 9. The distance from the leading edge to the right wall is X . A pressure sensor is placed 0.2 m above the bottom on the right wall. Two SPH simulations with two different particle spacings, namely, Δ x = 0.025   m and Δ x = 0.0125   m , are conducted. The time steps d t are 0.000025 s and 0.00001 s, respectively. Other parameters used in the SPH simulation are: ρ = 1000   kg / m 3 , c s = 80   m / s and α = 0.1 , which are the same as in the SPH simulations in Fourtakas et al. [17]. The free-slip boundary condition is applied on the fluid particles near the boundary. In the FVM simulations, the Euler two-phase flow model is used [27]. The grid sizes of the two FVM simulations are the same as the particle spacing used in the SPH simulations, and the time step d t is 0.001 s.
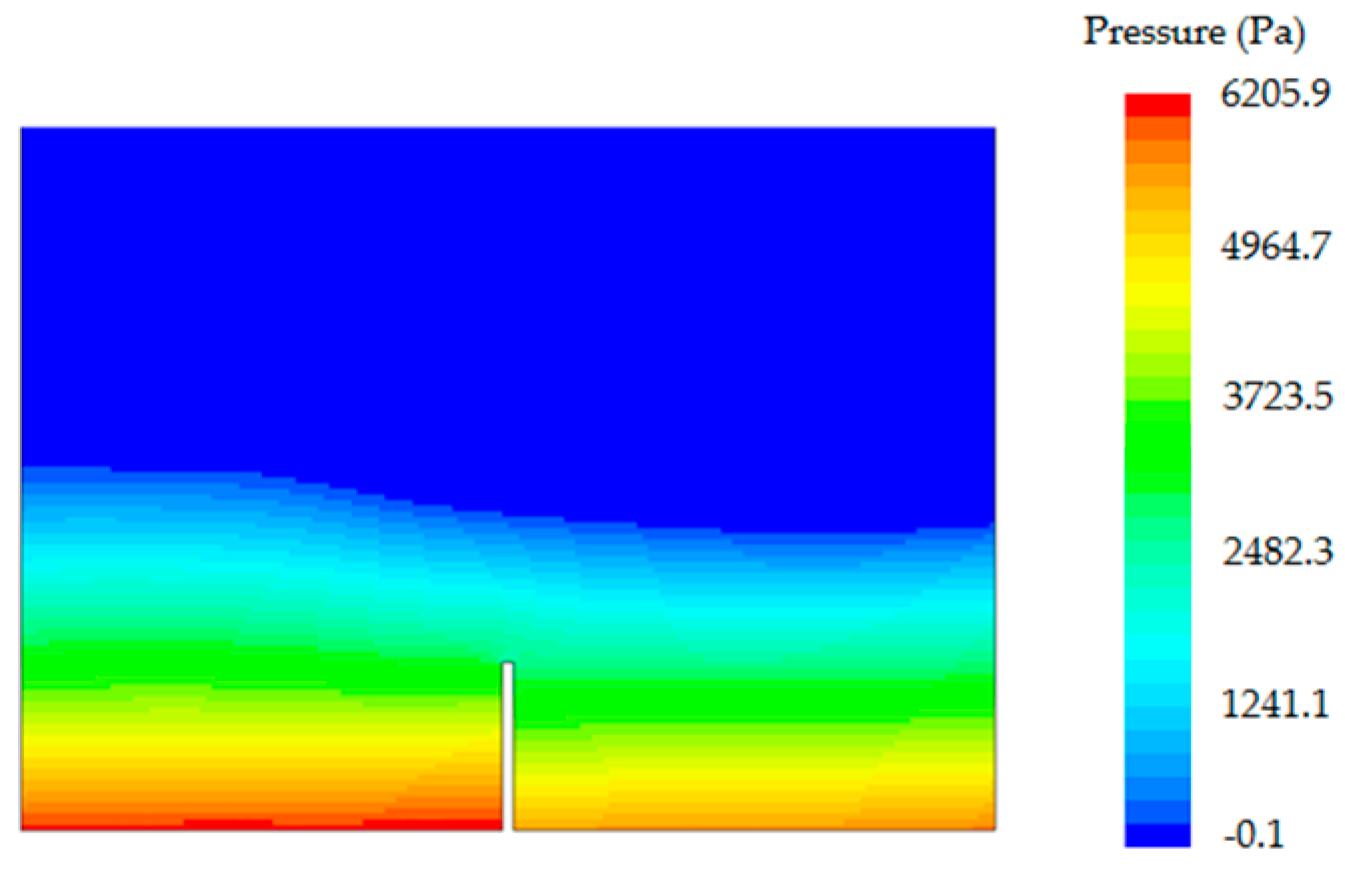
Figure 10, Figure 11, Figure 12 and Figure 13 show the comparisons of the pressure and velocity field snapshots at 0.9 s in the STAR-CCM+ and SPH simulations. Since the kernel size does not have an obvious influence on the numerical results of the pressure and velocity fields, only the results of the SPH simulation with h = 1.33 Δ x are presented. It is clear that both the pressure and velocity fields in the SPH simulation are very smooth and in good agreement with the STAR-CCM+ results. No particle penetration has occurred. Besides, the fluid particles distribution near the boundary is relatively uniform, and no unphysical gaps are present, which is a distinct advantage of the local semi-fixed ghost particles method over the local uniform stencil method. In the SPH simulation of the dam break case using the local uniform stencil method [18], obvious unphysical gaps are caused by the extremely unstable pressure value P f of fictitious particles, which will inevitably introduce numerical errors.
In the same SPH simulation, with the local mirror image method by Fourtakas et al. [17], although the profiles of the flow fields are in good agreement with the STAR-CCM+ results in Figure 10 and Figure 11, there are distinct differences in the maximum values of the pressure and velocity magnitude; the maxima in Fourtakas et al. [17] are approximately 10,000 Pa in the pressure field and 6.74 m/s in the velocity field, respectively. In comparison, the maximum values in the SPH simulations with the local semi-fixed ghost particles method are approximately 19,000 Pa in the pressure field and 11 m/s in the velocity field. This is closer to those of the FVM simulation, as shown in Figure 10, Figure 11, Figure 12 and Figure 13.
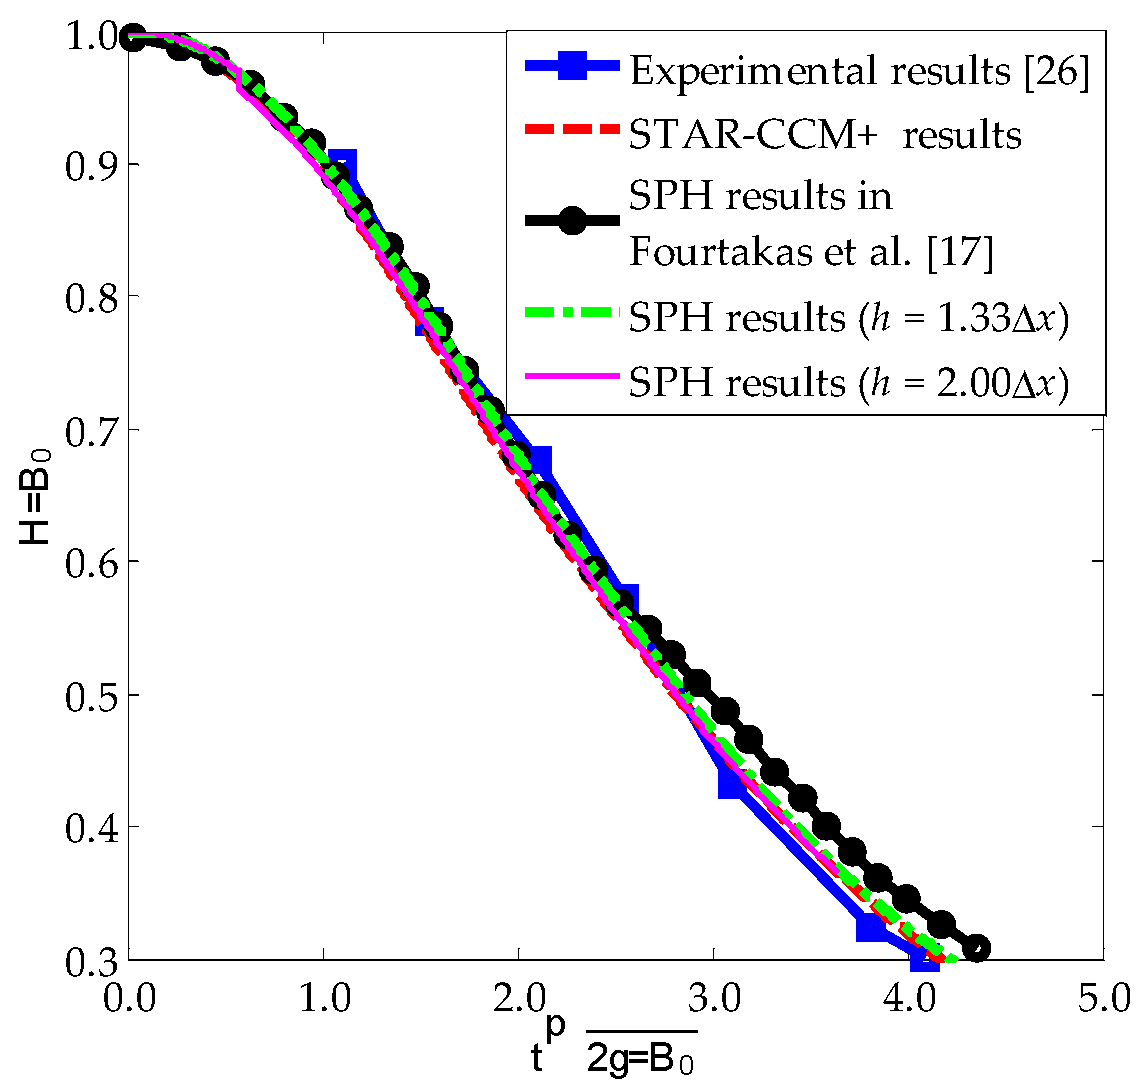
A qualitative analysis of the height of the water column and the position of the water toe during the simulations is presented in Figure 14 and Figure 15. As shown in Figure 15, the motion of the wave front in the simulations with the local semi-fixed ghost particles method is in good agreement with that of the FVM simulation and of the SPH simulation with the local mirror image method, although there are still some discrepancies with the experimental results [26]. For the height of the water column, as shown in Figure 14, the results of the SPH simulations using the new boundary method agree better with the experimental results and the STAR-CCM+ results, compared with the numerical results using the local mirror image method [17]. The detailed investigation of the pressure value on solid boundaries is not conducted in the simulation with the local mirror image method by Fourtakas et al. [17]. In this study, the impact pressure around the corner is investigated. As shown in Figure 16, the pressure values in the SPH simulations using the new boundary method are in good agreement with the STAR-CCM+ results. In the hydrostatic simulation, on the other hand, the pressure histories of the simulation with the smoothing length h = 1.33 Δ x have more spurious oscillations in the dynamic simulation, while the pressure histories of the simulation with larger smoothing length h = 2.00 Δ x are more stable and accurate.

4.3. Sloshing Case

To verify the new method, SPH simulations of sloshing cases are compared with experiments and grid-based CFD simulations that are conducted with the commercial code STAR-CCM+. The flow pattern, wave height and pressure value on the solid boundaries are compared. Sloshing in tanks with a baffle, as in a case used to investigate the ability of the SPH method to deal with thin plate problems, is also simulated.

4.3.1. Sloshing Case 1

In order to validate the accuracy of the SPH method, the sloshing case in Chen et al. [3] is simulated and compared with their experimental data and numerical computations. The SPH simulations using the local semi-fixed ghost particles method are performed in a fixed frame of reference. The dimensions of the 2D water tank are: breadth B S 1 = 1.0   m , height H S 1 = 1.0   m and depth d = 0.3   m . A pressure probe is placed 0.1 m below the initial free surface on the left wall. The tank rolls around the axis at the center of its bottom following a sinusoidal movement. The roll angle is θ ( t ) = A sin ( ω t ) . In the SPH simulations, the roll amplitude A is 5 0 , and two external excitation frequencies of ω 1 = 0.95   rad / s and ω 2 = 3.09   rad / s are explored. The sloshing system of a rectangular tank partially filled with water has a natural frequency of ω n 2 = g ( n π / B S 1 ) tanh ( n π ( d / B S 1 ) ) , and the first order natural frequency is ω 0 = 4.76   rad / s . As in the SPH simulations in Chen et al. [3], the SPH simulation parameters of the fluid particles are ρ = 1000   kg / m 3 and c s = 20   m / s . The artificial viscosity is α = 0.02 . The particle spacing is set to Δ x = 0.01   m , resulting in approximately 2970 fluid particles. The time step is 0.00005 s. The no-slip boundary condition is imposed on the fluid particles near the boundary.
The flow patterns in the experiments [3] and in the SPH simulations are compared. Figure 17, Figure 18, Figure 19 and Figure 20 show two particular instants of the cases with two different excitation frequencies. Since the influence of the kernel size on the flow patterns is not obvious, only the flow patterns of the SPH simulation with h = 1.33 Δ x are presented. They are in good agreement with the experimental ones, and both pressure fields of fluid particles are smooth. The distribution of the fluid particles near the wall boundary is uniform in these SPH simulations.
To qualitatively analyze the pressure field in the SPH simulations, the pressure value at a specific point is investigated. The pressure histories on the solid boundary are compared with the experimental and numerical results of Chen et al. [3] in Figure 21 and Figure 22. It can be seen that the pressure histories have small oscillations, and the numerical accuracy and stability is difficult to obtain with other boundary methods, except for the local semi-fixed and the fixed ghost particles methods. The amplitude and the phase of the pressure obtained with the local semi-fixed ghost particles method are in good agreement with the experimental and numerical results by Chen et al. [3].
As shown in Figure 21, the curve of the SPH results with h = 2.00 Δ x has some differences with other curves. The reason is that, under small external excitation, the influence of the boundary condition on the sloshing system is more obvious—especially for the simulation with h = 2.00 Δ x , where more fictitious particles are generated around the fluid particle near the wall. Because the pressure of the fictitious particles is computed by the pressure of the closest fluid particles and a hydrostatic pressure correction, the numerical diffusion in the SPH simulation with h = 2.00 Δ x appears in this case. Compared to 0.95 rad/s, the excitation frequency 3.09 rad/s is closer to the first-order natural frequency 4.76 rad/s, and the motion of the fluid particles is more violent, as shown in Figure 22, where small spurious pressure oscillations are present in the blue curve ( h = 1.33 Δ x ) .
Another important influence factor of the stability of the pressure value is the size of the smoothing length. It is obvious that the pressure histories obtained with the larger smoothing length h = 2.00 Δ x are more stable and free of oscillations. However, the larger smoothing length will result in more fictitious particles generated in the boundary domain. As a result, more computation time and higher requirements of the boundary geometry will be needed. Generally, for this case, the computation time of the 2D SPH simulations with the larger smoothing length is about eight times the one with the smaller smoothing length. Apparently, the new method has a much higher computational cost than the fixed ghost particles method, and theoretically does not have obvious advantages over previous local ghost boundary methods in the computational cost.

4.3.2. Sloshing Case 2

To investigate the numerical stability of the local semi-fixed ghost particles method in simulating violent sloshing and the ability to deal with complicated flow problems, simulations of sloshing in tanks with and without baffles are conducted. The sloshing water tank with a baffle is shown in Figure 23. The tank’s height, breadth and initial water depth are H S 2 = 1.15   m , B S 2 = 1.73   m and d = 0.6   m , respectively. The baffle breadth and height are B B = 0.3   m and B H = 0.02   m . The rigid baffle is fixed at the center of the tank bottom. If the baffle breadth is less than the diameter of the support domain, it becomes a thin plate problem, which is quite a challenge for traditional SPH methods including the fixed ghost particles method and the mirror particles method. A sloshing simulation in the tank without baffle is also conducted for the purpose of comparison. A pressure probe point is placed 0.2 m below the initial free surface on the right wall. In addition, in order to visualize the sloshing wave profile numerically, a wave gauge is placed 0.05 m from the left wall in the numerical simulations. The tank is subject to a sinusoidal excitation in the x-axis direction that is imposed in a moving frame of reference through a forcing term in the continuum equation,
F = ( a ( t ) , g )
where a ( t ) is the lateral acceleration, a ( t ) = A ω 2 sin ( ω t ) and A = 0.032   m is the amplitude of displacement. The excitation frequency ω is 4.19 rad/s.
In the SPH simulation, the density of the water is ρ = 1000   kg / m 3 , the numerical speed of sound is c s = 28   m / s , and the artificial viscosity coefficient is α = 0.02 . To examine the convergence behavior using the boundary model, two different particle spacings are used in the sloshing simulations in tanks without the baffle, Δ x = 0.01   m and Δ x = 0.02   m , corresponding to 10,381 and 2552 fluid particles in the computation domain. The time step is set to 0.00005 s for all SPH simulations. The FVM simulations are based on a Euler two-phase flow model and conducted using the commercial code STAR-CCM+, in which the computation domain is discretized into a uniform grid with Δ x = 0.01   m . The interface is captured by a volume of fluid (VOF) technique [27]. STAR-CCM+ is a reliable numerical tool, which has been widely used by many researchers for sloshing simulations [28].
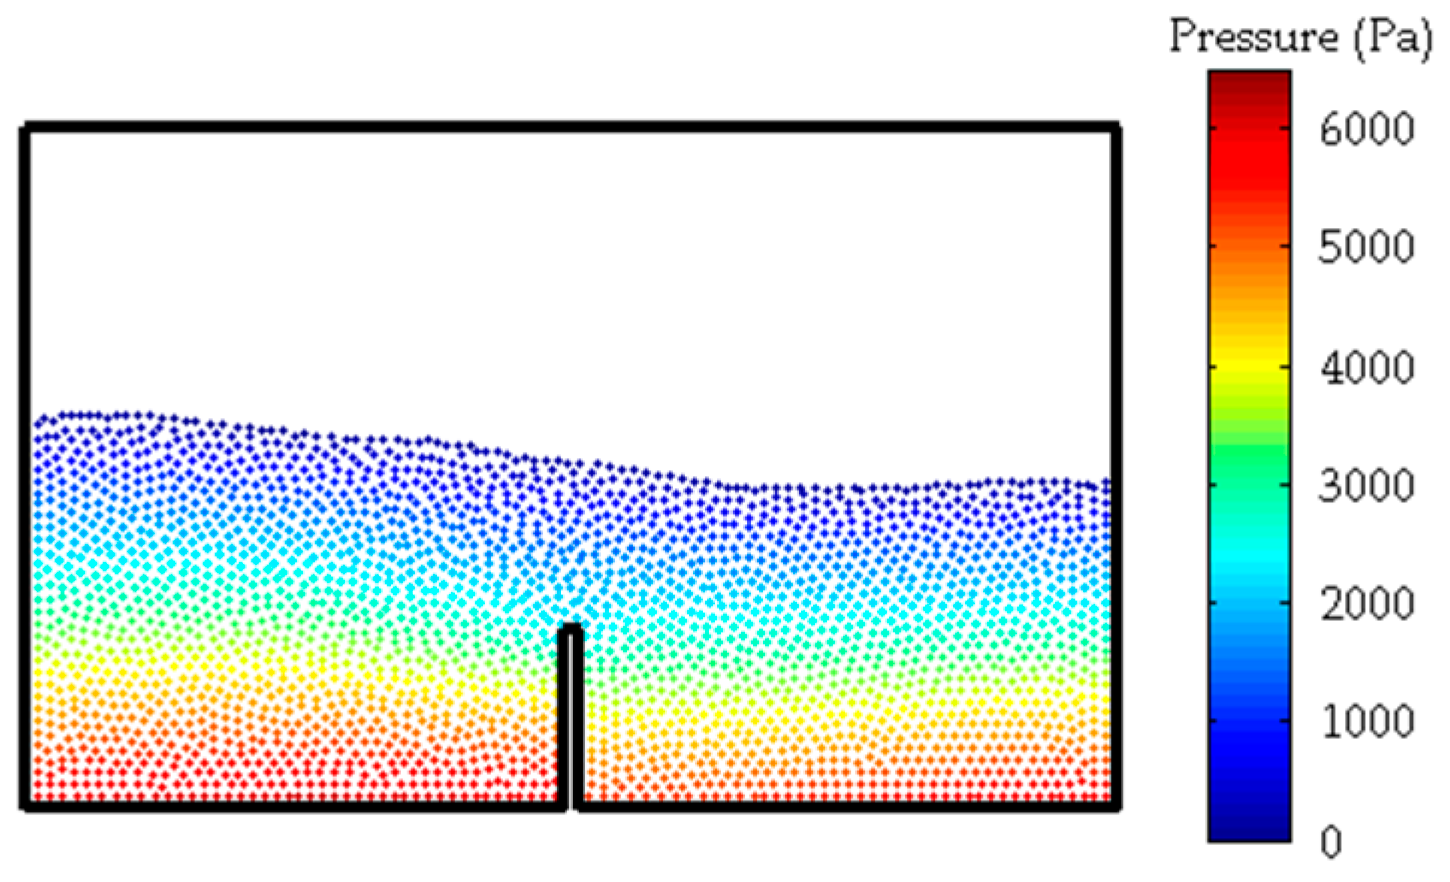
Figure 24, Figure 25, Figure 26 and Figure 27 show the comparisons of the flow pattern and pressure distribution at 6 s in the STAR-CCM+ simulation and the SPH simulations with different particle spacings. Only the results of the SPH simulation with h = 1.33 Δ x are presented. The motion of the sloshing wave in the tank without the baffle is violent. It is clear that the pressure fields in Figure 26, where more particles are used, are smoother than the pressure fields in Figure 27.
The curves of the sloshing wave’s height and pressure values at the probes in these numerical simulations are shown in Figure 28, Figure 29, Figure 30 and Figure 31. The pattern of the SPH results are in good agreement with the STAR-CCM+ results. Both the wave height and the amplitude of pressure of the simulations obtained with the small particle spacing are closer to the STAR-CCM+ results. The convergence of SPH results is well verified. Spurious pressure oscillations are present in Figure 30; in contrast, the pressure histories in Figure 31 are very stable and smooth. A comparison of Figure 30 and Figure 31 shows the effect of the smoothing length on the numerical results for the pressure field. For the larger smoothing length, more fictitious particles are generated for the fluid particle near the boundary and involved in the calculation of the physical quantities of the fluid particle, which can make the pressure field near the boundary smoother and more stable.
Figure 32, Figure 33 and Figure 34 show the flow pattern and pressure distribution in the sloshing model with a baffle at the same instant as in Figure 24, Figure 25, Figure 26 and Figure 27. The liquid sloshing is not so violent as in the sloshing model without the baffle. As shown in Figure 35 and Figure 36, due to the existence of the baffle, the maximum wave height is less than 20% of that in the case without the baffle, and the amplitude of pressure histories is only about 30%. Small spurious pressure oscillations appear in the pressure histories obtained with a smoothing length of 2.00 Δ x . The reason is that the fluid field in the sloshing model with the baffle is more complicated than that in the sloshing model without a baffle, as shown in Figure 31, where no spurious pressure oscillation is present.
It is clear that the smoothing length plays a major role in the numerical stability and accuracy of these SPH simulations. In the sloshing SPH simulations of violent sloshing or complicated flows, pressure histories on the solid boundary with larger smoothing lengths are more stable and smoother. It is also demonstrated that the present SPH method is able to deal with thin plate problems.

5. Conclusions

In this study, a novel local semi-fixed ghost particles method is proposed for Weakly Compressible Smoothed Particle Hydrodynamics (WCSPH). Compared to the previous local ghost particles methods, the new boundary method improves the generation mechanism of fictitious particles and extends the influence range of the wall boundary. The stability and accuracy of the new boundary method is validated for a still water case, a dam break case and some liquid sloshing cases, and the ability of the local semi-fixed ghost particles method to deal with complex geometries and violent flows is demonstrated. A detailed investigation into the pressure on solid walls and wave elevation in dynamic simulations is conducted. The good agreement between the SPH results and the benchmark results shows that the local semi-fixed ghost particles method can effectively reduce spurious pressure oscillations and significantly improve the numerical accuracy and stability, especially for the kernel with a large radius of the support domain.
In general, besides the unique merits of the local ghost particles methods, namely, the ability to avoid particle penetration and to deal with complex geometries and deformable objects, the local semi-fixed ghost particles method has a high numerical accuracy and stability and possesses promising and wide application prospects.

Author Contributions

Conceptualization, X.Z. and H.R.; methodology, X.Z. and H.R.; software, K.T.; validation, K.T.; investigation, K.T. and X.Z.; writing—original draft preparation, K.T. and X.Z.; writing—review and editing, X.Z. and H.R.; visualization, X.Z.; supervision, H.R.; funding acquisition, X.Z. All authors have read and agreed to the published version of the manuscript.

Funding

The study was supported by the National Natural Science Foundation of China (51779055).

Institutional Review Board Statement

Not applicable.

Informed Consent Statement

Not applicable.

Data Availability Statement

Not applicable.

Conflicts of Interest

The authors declare no conflict of interest.

References

  1. Green, M.D. Sloshing Simulations with the Smoothed Particle Hydrodynamics (SPH) Method. Ph.D. Thesis, Imperial College London, London, UK, 2016. [Google Scholar]
  2. Chen, Z.; Zong, Z.; Liu, M.B.; Li, H.T. A comparative study of truly incompressible and weakly compressible SPH methods for free surface incompressible flows. Int. J. Numer. Methods Fluids 2013, 73, 813–829. [Google Scholar] [CrossRef] [Green Version]
  3. Chen, Z.; Zong, Z.; Li, H.; Li, J. An investigation into the pressure on solid walls in 2D sloshing using SPH method. Ocean Eng. 2013, 59, 129–141. [Google Scholar] [CrossRef]
  4. Monaghan, J.J. Smoothed particle hydrodynamics. Annu. Rev. Astron. Astrophys. 1992, 30, 543–574. [Google Scholar] [CrossRef]
  5. Liu, M.B.; Liu, G.R. Smoothed Particle Hydrodynamics (SPH): An Overview and Recent Developments. Arch. Comput. Methods Eng. 2010, 17, 25–76. [Google Scholar] [CrossRef] [Green Version]
  6. Monaghan, J. Simulating Free Surface Flows with SPH. J. Comput. Phys. 1994, 110, 399–406. [Google Scholar] [CrossRef]
  7. Monaghan, J.J.; Kos, A. Solitary Waves on a Cretan Beach. J. Waterw. Port Coast. Ocean Eng. 1999, 125, 145–155. [Google Scholar] [CrossRef]
  8. Yang, Q.; Jones, V.; McCue, L. Free-surface flow interactions with deformable structures using an SPH–FEM model. Ocean Eng. 2012, 55, 136–147. [Google Scholar] [CrossRef]
  9. Dalrymple, R.A.; Knio, O. SPH modelling of water waves. In Proceedings of the Coastal Dynamics’ 01, Lund, Sweden, 11–15 June 2001; pp. 779–787. [Google Scholar]
  10. Crespo, A.J.; Gómez-Gesteira, M.; Dalrymple, R.A. Boundary conditions generated by dynamic particles in SPH methods. Comput. Mater. Contin. 2007, 5, 173–184. [Google Scholar]
  11. Marrone, S.; Antuono, M.; Colagrossi, A.; Colicchio, G.; Le Touzé, D.; Graziani, G. δ-SPH model for simulating violent impact flows. Comput. Methods Appl. Mech. Eng. 2011, 200, 1526–1542. [Google Scholar] [CrossRef]
  12. Adami, S.; Hu, X.; Adams, N. A generalized wall boundary condition for smoothed particle hydrodynamics. J. Comput. Phys. 2012, 231, 7057–7075. [Google Scholar] [CrossRef]
  13. Randles, P.; Libersky, L. Smoothed Particle Hydrodynamics: Some recent improvements and applications. Comput. Methods Appl. Mech. Eng. 1996, 139, 375–408. [Google Scholar] [CrossRef]
  14. Yıldız, M.; Rook, R.A.; Suleman, A. SPH with the multiple boundary tangent method. Int. J. Numer. Methods Eng. 2008, 77, 1416–1438. [Google Scholar] [CrossRef] [Green Version]
  15. Ferrari, A.; Dumbser, M.; Toro, E.F.; Armanini, A. A new 3D parallel SPH scheme for free surface flows. Comput. Fluids 2009, 38, 1203–1217. [Google Scholar] [CrossRef]
  16. Vacondio, R.; Rogers, B.; Stansby, P. Smoothed particle hydrodynamics: Approximate zero-consistent 2-D boundary conditions and still shallow-water tests. Int. J. Numer. Methods Fluids 2012, 69, 226–253. [Google Scholar] [CrossRef]
  17. Fourtakas, G.; Vacondio, R.; Rogers, B.D. On the approximate zeroth and first-order consistency in the presence of 2-D irregular boundaries in SPH obtained by the virtual boundary particle methods. Int. J. Numer. Methods Fluids 2015, 78, 475–501. [Google Scholar] [CrossRef]
  18. Fourtakas, G.; Dominguez, J.M.; Vacondio, R.; Rogers, B.D. Local uniform stencil (LUST) boundary condition for arbitrary 3-D boundaries in parallel smoothed particle hydrodynamics (SPH) models. Comput. Fluids 2019, 190, 346–361. [Google Scholar] [CrossRef]
  19. Crespo, A.; Dominguez, J.; Gómez-Gesteira, M.; Barreiro, A.; Rogers, B. User Guide for DualSPHysics Code; University of Vigo: Vigo, Spain; The University of Manchester: Manchester, UK; Johns Hopkins University: Baltimore, MD, USA, 2011. [Google Scholar]
  20. Dehnen, W.; Aly, H. Improving convergence in smoothed particle hydrodynamics simulations without pairing instability. Mon. Not. R. Astron. Soc. 2012, 425, 1068–1082. [Google Scholar] [CrossRef] [Green Version]
  21. Colagrossi, A.; Landrini, M. Numerical simulation of interfacial flows by smoothed particle hydrodynamics. J. Comput. Phys. 2003, 191, 448–475. [Google Scholar] [CrossRef]
  22. Gomez-Gesteira, M.; Rogers, B.D.; Dalrymple, R.A.; Crespo, A.J. State-of-the-art of classical SPH for free-surface flows. J. Hydraul. Res. 2010, 48, 6–27. [Google Scholar] [CrossRef]
  23. Morris, J.P.; Fox, P.J.; Zhu, Y. Modeling Low Reynolds Number Incompressible Flows Using SPH. J. Comput. Phys. 1997, 136, 214–226. [Google Scholar] [CrossRef]
  24. Takeda, H.; Miyama, S.M.; Sekiya, M. Numerical simulation of viscous flow by smoothed particle hydrodynamics. Prog. Theor. Phys. 1994, 92, 939–960. [Google Scholar] [CrossRef]
  25. Green, M.D.; Peiró, J. Long duration SPH simulations of sloshing in tanks with a low fill ratio and high stretching. Comput. Fluids 2018, 174, 179–199. [Google Scholar] [CrossRef]
  26. Koshizuka, S.; Oka, Y. Moving-Particle Semi-Implicit Method for Fragmentation of Incompressible Fluid. Nucl. Sci. Eng. 1996, 123, 421–434. [Google Scholar] [CrossRef]
  27. User Guide; STAR-CCM+ Version (10.02); CD-Adapco: New York, NY, USA, 2015.
  28. Dong, C. Modeling and Simulation of Sloshing Motion in Partly Filled Tank. Master’ Thesis, Aalesund University College, Ålesund, Norway, 2015. [Google Scholar]
Figure 1. Fictitious particles generation mechanism of the local mirror image method for a fluid particle near the wall boundary.
Jmse 09 00416 g001
Figure 2. Fictitious particles generation mechanism of the local uniform stencil method for a fluid particle near the wall boundary.
Jmse 09 00416 g002
Figure 3. Fictitious particles generation mechanism of the local semi-fixed ghost particles method for a fluid particle near the wall boundary.
Jmse 09 00416 g003
Figure 4. Fictitious particles generation mechanism of the local semi-fixed ghost particles method for a fluid particle around corners. (a) r > 2 Δ x , (b) r 2 Δ x .
Jmse 09 00416 g004
Figure 5. Configuration of the water tank.
Jmse 09 00416 g005
Figure 6. Pressure field and particle distribution snapshots at 15 s for different smoothing lengths (a) h = 1.33 Δ x and (b) h = 2.00 Δ x .
Jmse 09 00416 g006
Figure 7. Pressure histories at the pressure sensor.
Jmse 09 00416 g007
Figure 8. Comparison of the hydrostatic pressure of all fluid particles with the analytical results.
Jmse 09 00416 g008
Figure 9. The profile of the water in the dam break case.
Jmse 09 00416 g009
Figure 10. Pressure field in the STAR-CCM+ simulation ( Δ x = 0.0125   m ,   t = 0.9   s ) .
Jmse 09 00416 g010
Figure 11. Velocity field in the STAR-CCM+ simulation ( Δ x = 0.0125   m ,   t = 0.9   s ) .
Jmse 09 00416 g011
Figure 12. Pressure field in the smoothed particle hydrodynamics (SPH simulation) ( h = 1.33 Δ x ,   Δ x = 0.0125   m ,   t = 0.9   s ) .
Jmse 09 00416 g012
Figure 13. Velocity field in the SPH simulation ( h = 1.33 Δ x ,   Δ x = 0.0125   m ,   t = 0.9   s ) .
Jmse 09 00416 g013
Figure 14. Comparison of the dimensionless height of the water column near the left wall ( Δ x = 0.025   m ) .
Jmse 09 00416 g014
Figure 15. Comparison of the dimensionless distance from the leading edge to the right wall ( Δ x = 0.025   m ) .
Jmse 09 00416 g015
Figure 16. Comparison of the dimensionless impact pressure value at the pressure sensor ( Δ x = 0.025   m ) .
Jmse 09 00416 g016
Figure 17. Flow pattern reproduced form the experiment of Chen et al. [3] ( ω = 0.95   rad / s ,   t = 11.57   s ) .
Jmse 09 00416 g017
Figure 18. Flow pattern reproduced form the experiment of Chen et al. [3] ( ω = 3.09   rad / s ,   t = 3.55   s ) .
Jmse 09 00416 g018
Figure 19. Flow pattern and pressure distribution in the SPH simulation ( h = 1.33 Δ x ,   ω = 0.95   rad / s ,   t = 11.57   s ) .
Jmse 09 00416 g019
Figure 20. Flow pattern and pressure distribution in the SPH simulation ( h = 1.33 Δ x ,   ω = 3.09   rad / s ,   t = 3.55   s ) .
Jmse 09 00416 g020
Figure 21. Pressure value on the solid boundary obtained by the SPH simulations and the experiment ( ω = 0.95   rad / s ) .
Jmse 09 00416 g021
Figure 22. Pressure value on the solid boundary obtained by the SPH simulations and the experiment ( ω = 3.09   rad / s ) .
Jmse 09 00416 g022
Figure 23. Configuration of the sloshing water tank.
Jmse 09 00416 g023
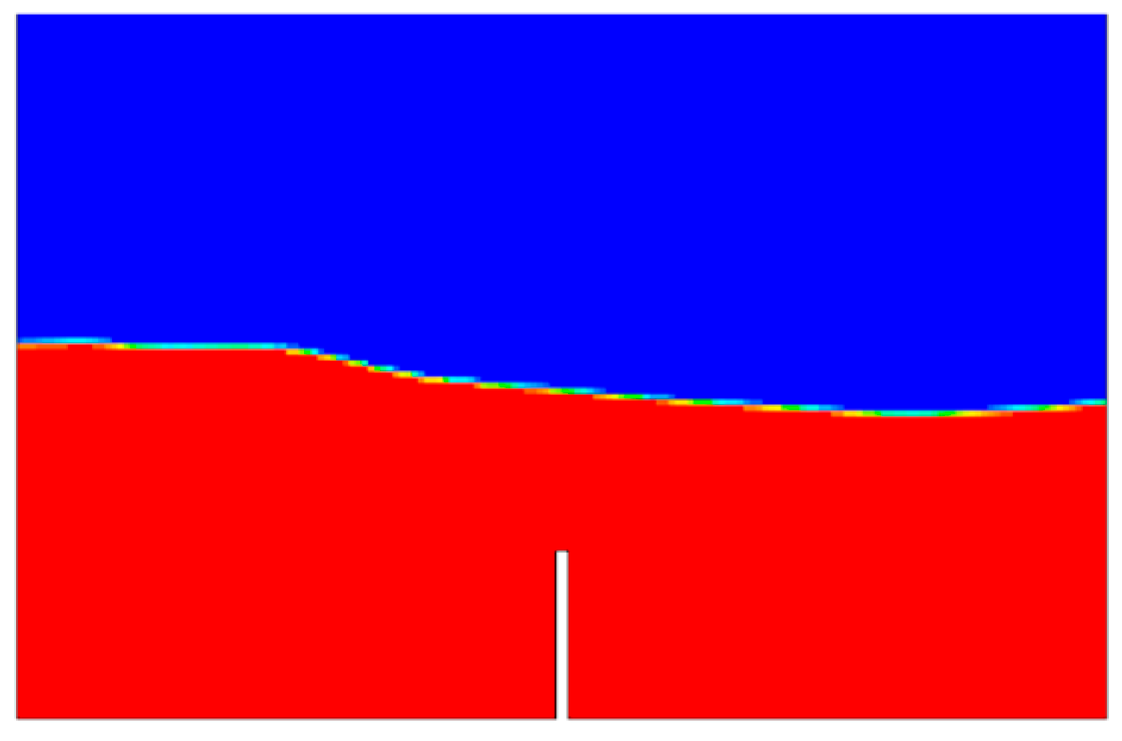
Figure 24. Pressure distribution in the STAR-CCM+ simulation without the baffle.
Jmse 09 00416 g024
Figure 25. Flow pattern in the STAR-CCM+ simulation without the baffle.
Jmse 09 00416 g025
Figure 26. Flow pattern and pressure distribution in the SPH simulation without the baffle ( h = 1.33 Δ x ,   Δ x = 0.01   m ) .
Jmse 09 00416 g026
Figure 27. Flow pattern and pressure distribution in the SPH simulation without the baffle ( h = 1.33 Δ x ,   Δ x = 0.02   m ) .
Jmse 09 00416 g027
Figure 28. Comparison of the SPH results obtained with h = 1.33 Δ x for the wave elevation at the wave gauge with those of STAR-CCM+.
Jmse 09 00416 g028
Figure 29. Comparison of the SPH results obtained with h = 2.00 Δ x for the wave elevation at the wave gauge with those of STAR-CCM+.
Jmse 09 00416 g029
Figure 30. Comparison of the SPH results obtained with h = 1.33 Δ x for the pressure on the solid boundary with those of STAR-CCM+.
Jmse 09 00416 g030
Figure 31. Comparison of the SPH results obtained with h = 2.00 Δ x for the pressure on the solid boundary with those of STAR-CCM+.
Jmse 09 00416 g031
Figure 32. Pressure distribution in the STAR-CCM+ simulation with the baffle.
Jmse 09 00416 g032
Figure 33. Flow pattern in the STAR-CCM+ simulation with the baffle.
Jmse 09 00416 g033
Figure 34. Flow pattern and pressure distribution in the SPH simulation with the baffle ( h = 1.33 Δ x ,   Δ x = 0.02   m ) .
Jmse 09 00416 g034
Figure 35. Comparison of the wave elevation at the wave gauge obtained by the SPH and STAR-CCM+ simulations.
Jmse 09 00416 g035
Figure 36. Comparison of the pressure on the solid boundary obtained by the SPH and STAR-CCM+ simulations.
Jmse 09 00416 g036
Publisher’s Note: MDPI stays neutral with regard to jurisdictional claims in published maps and institutional affiliations.