Article

Metrological Evaluation of Deep-Ocean Thermometers

1
NRC, National Research Council, Ottawa, ON K1A 0R6, Canada
2
Independent Researcher, 2565 JR The Hague, The Netherlands
3
VSL, Dutch Metrology Institute, 2629 JA Delft, The Netherlands
4
NIOZ, Royal Netherlands Institute for Sea Research, Department of Ocean Systems, 1790 AB Texel, The Netherlands
*
Author to whom correspondence should be addressed.
J. Mar. Sci. Eng. 2021, 9(4), 398; https://doi.org/10.3390/jmse9040398
Submission received: 24 February 2021 / Revised: 2 April 2021 / Accepted: 7 April 2021 / Published: 9 April 2021
(This article belongs to the Section Physical Oceanography)

Abstract

:
An accurate metrological investigation was performed on several units of the two de facto standards for deep-ocean temperature measurements—the SBE35 (the reference thermometer) and the SBE3 (the working thermometer) from SeaBird Scientific. Four SBE35 units were repeatedly calibrated against state-of-the-art fixed-point cells (triple point of water at 0.01 °C and melting point of gallium at 29.7646 °C), with calibration uncertainties of approximately 0.2 mK and 0.5 mK, respectively. Three SBE35 units and one SBE3 unit were calibrated in the temperature range 0 °C to 30 °C, again with sub-millikelvin calibration uncertainties, in a recently-developed water–bath calibration facility. All these calibrations evidenced (1) the deviation of each unit from its original manufacturer’s calibration (up to 1.7 mK), which were found to be inconsistent with the manufacturer’s uncertainty claims and (2) unexplained irreproducibilities, which could not be attributed to the calibration system of up to 1.5 mK. The effect of high pressures (up to 60 MPa) on the response of two SBE35 units was investigated by pressurizing the SBE35 units inside a purpose-built compact pressure enclosure. The results of the pressure investigation confirmed the existence of a small device-dependent pressure effect (approximately 0.3 mK at 60 MPa) and the need for individual temperature–pressure calibration of each SBE35 unit.

1. Introduction

Global warming is driven by the current imbalance (Earth’s energy imbalance, EEI) at the top of the atmosphere, between the incoming solar energy and the outgoing energy radiated back to space [1]. In the last decades, EEI became increasingly dominated by anthropogenic forcing (carbon dioxide and other greenhouse gases) [2]. EEI is recognized as the most fundamental metric in assessing the current status of global warming and feeding long-term climate change predictions. As the excess energy, continuously added to the Earth system by EEI, is predominantly stored in the oceans (in the last 50 years, 89%, compared to the 1% stored in the atmosphere [2]), the accuracy in the EEI estimate is related to the accuracy in the total ocean heat content (OHC), which in turn, is directly related to the accuracy of global ocean temperature observations.
Despite its crucial importance in quantifying global warming and in predicting the future climate evolution, the monitoring of deep-ocean temperature changes is hindered by the required level of accuracy in its measurement—the deep-ocean temperature measurements needed to maintain an accuracy of 1 mK over a decade [3], in the harsh deep-ocean environment.
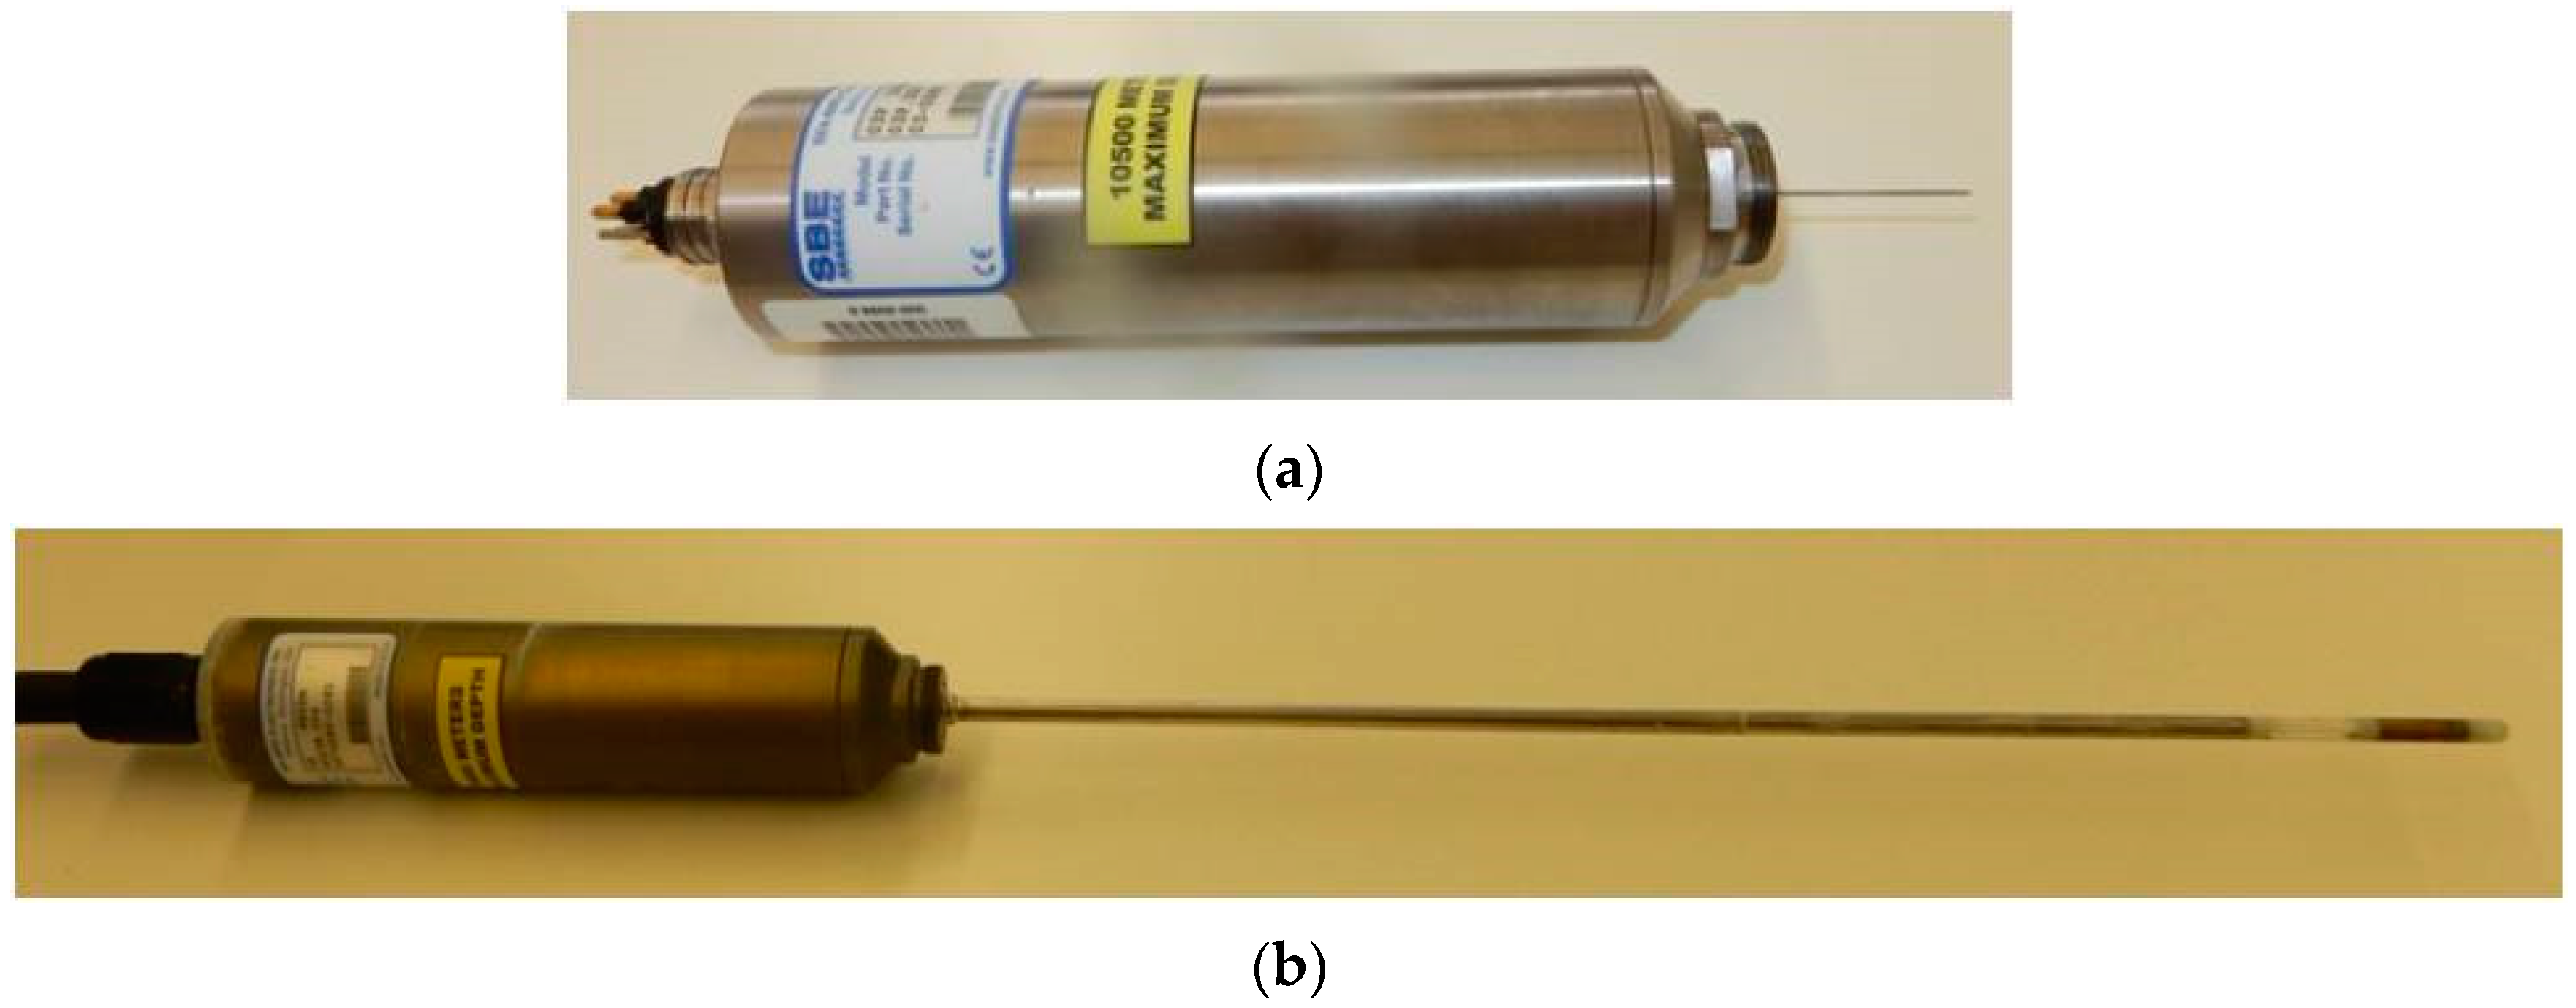
Current practice of accurate deep-ocean temperature measurements prescribes the combined use of two devices, which are regarded as de facto standards by the worldwide oceanographic community (see Figure 1).
-
SBE35 (Sea-Bird Scientific, formerly Sea-Bird Electronics) —reference thermistor thermometer with claimed 0.2 mK accuracy, 0.14 mK∙yr−1 stability and 0.5 s response time.
-
SBE3 (Sea-Bird Scientific, formerly Sea-Bird Electronics)—CTD profiling thermistor thermometer with claimed 0.7 mK accuracy, 2 mK∙yr−1 stability, and 0.07 s response time.
When used in the deep ocean, the response of the SBE3 is affected by high pressure, resulting in a pressure effect of the order of a few mK at 6000 m (corresponding to approximately 60 MPa) depth, and is explained by the manufacturer as caused by the mechanical stress exerted on the sensor when the thermometer is compressed at high pressures. Such pressure dependence of the SBE3 is currently coped with using the so-called “in situ” calibration of the SBE3 relative to the SBE35 [4], which involves the simultaneous deployment of both thermometers in the instrument frame (CTD), during a measurement campaign, and allows the determination of the pressure dependence of the SBE3 (−0.65 mK∙(60 MPa)−1 to 2.24 mK∙(60 MPa)−1, see [5]), under the assumption that the SBE35 response is pressure-independent.
Unfortunately, an eventual pressure dependence of the SBE35 was never unequivocally ruled out. Uchida et al. [6] obtained contradictory results, Peruzzi et al. [7] obtained −6 mK∙(60 MPa)−1 for only one individual SBE35 unit in an experiment in which temperature was not controlled and Joung et al. [8] obtained a repeatable pressure dependence ≤1 mK∙(60 MPa)−1 for 2 of the 3 investigated SBE35, and no pressure dependence, within the measurement uncertainty, for the other SBE35.
This paper provides an overview of a metrological evaluation conducted over the past 5 years, on several units of SBE35 and SBE3 ocean thermometers.
In Section 2, we recall how these thermometers are calibrated by the manufacturer (
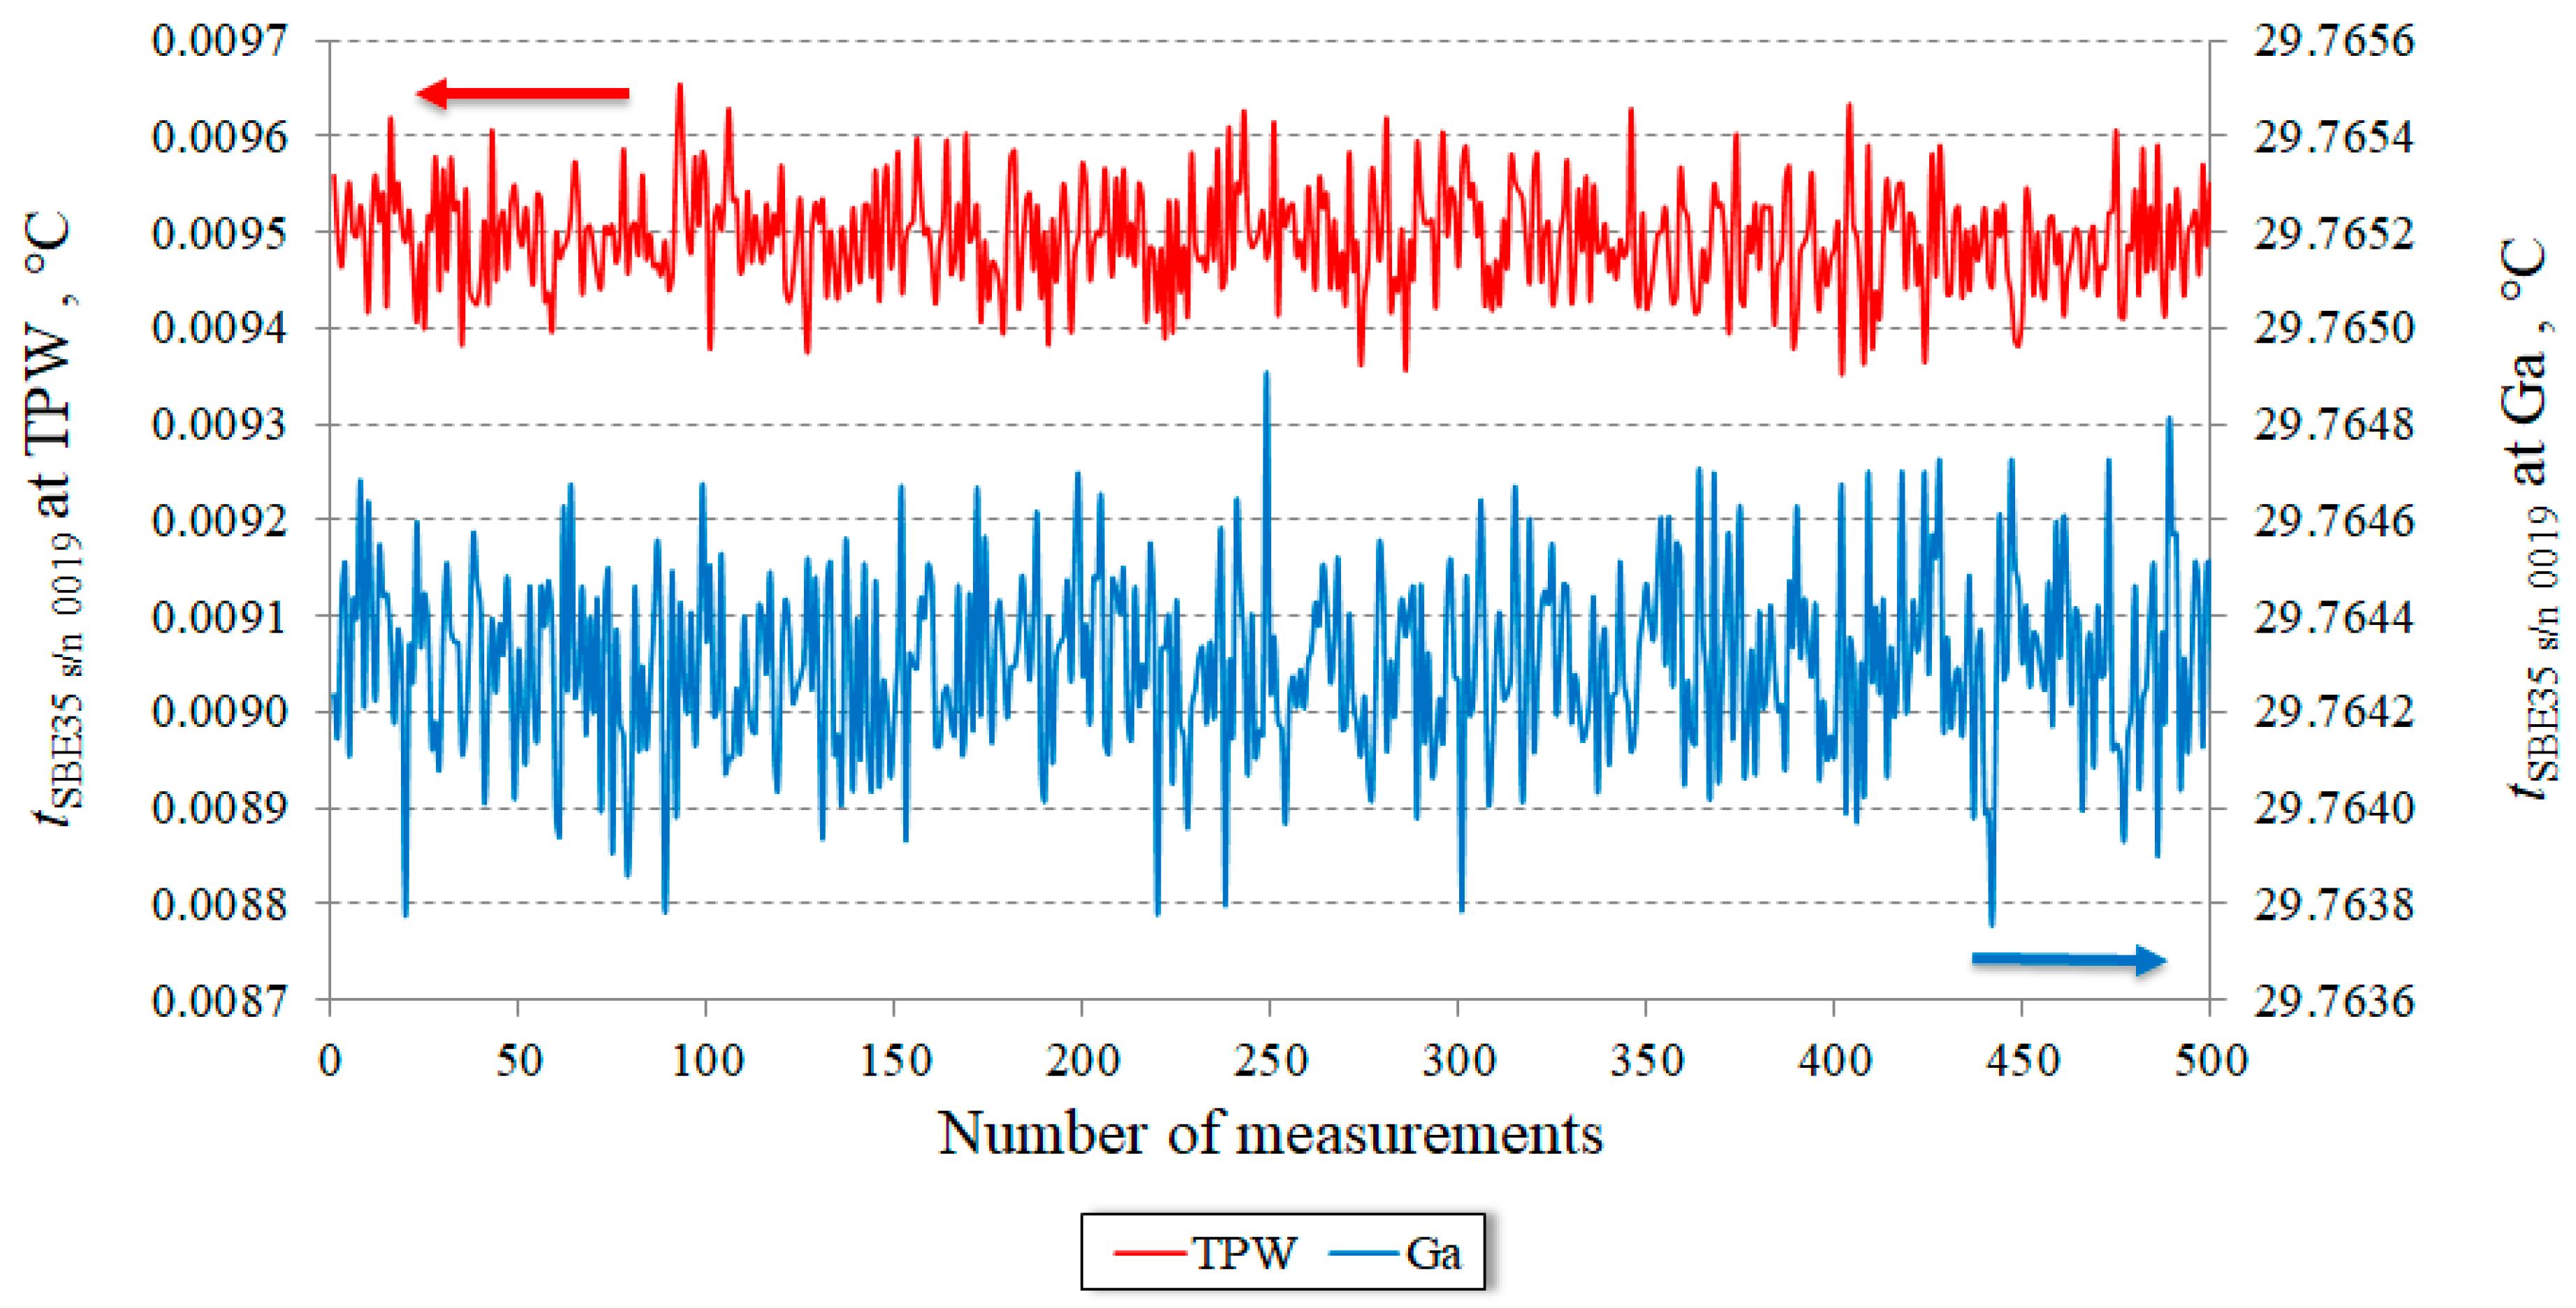
Section 2.1) and we report the results of (a) our re-calibration of 4 SBE35 units against the Dutch national reference fixed-point cells (triple point of water at 0.01 °C and melting point of gallium at 29.7646 °C), used to realize the International Temperature Scale of 1990, ITS-90 [9] (Section 2.2), and (b) our recalibration of 3 SBE35 units and 1 SBE3 unit, in comparison to the reference ITS-90 Standard Platinum Resistance Thermometers (SPRTs) in a water bath in the temperature range of 0 °C to 30 °C (Section 2.3).
In Section 3, we present the experimental set-up, the results, and the analysis of an experiment conducted to investigate the effect of high pressures (up to 60 MPa) on the response of two SBE35 units.
In Section 4, we summarize the conclusions of our experimental investigation.

2. Calibration of SBE35 and SBE3

2.1. Manufacturer Calibration of SBE35 and SBE3

Each SBE35 unit is calibrated by the manufacturer in three steps.
-
Initially, the unit is calibrated by comparison in a water bath at 11 temperatures between −1.5 °C and 32.5 °C.
-
Subsequently, an interpolation of the calibration data is performed using the Steinhart and Hart equation:
t 90 / ° C = 1 i = 0 4 a i · ( l n ( f 0 f ) ) i 273.15
where t90 is the ITS-90 temperature in °C, f is the frequency output of the unit, f0 = 1000 Hz is an arbitrary scaling factor used for computational efficiency, and ai are the 5 coefficients determined by the interpolation.
-
Finally, a linear adjustment is applied to the interpolation by calibrating the unit at the triple point of water, TPW, (t90 = 0.01 °C) and at the gallium melting point (t90 = 29.7646 °C), using standard ITS-90 fixed-point cells:
t 90 a d j = m · t 90 + q
The SBE3 is calibrated only with the first two steps above (no fixed-point calibration).

2.2. Fixed-Point Recalibration of SBE35

An easy and straightforward check that can be performed in a temperature metrology laboratory is the recalibration of the SBE35 at the triple point of water and at the Ga melting point (TPW and Ga, respectively, in the following). In fact, the SBE35 design, practically identical to that of the Standard Platinum Resistance Thermometers (SPRTs), which is used to realize the ITS-90, allows us to calibrate it directly in standard TPW and Ga fixed-point cells. In Figure 2, 500 readings (corresponding to 30 min acquisition) with SBE35 s/n 0019 at the TPW and at the Ga are reported. The noise of the readings at the Ga point was 3 times larger than that at the TPW for all investigated SBE35 units. The typical uncertainty budgets for the TPW and Ga recalibration are shown in Table 1.
Figure 3 shows the results of the repeated TPW and Ga fixed-point cell recalibrations we performed on 4 different SBE35 units (s/n 0019, s/n 0086, s/n 0015, and s/n 0081). The differences between the manufacturer calibration and the local fixed-point recalibration ranged between few tenths of mK and 1.8 mK, with recalibration uncertainties of 0.186 mK and 0.464 mK for the TPW and Ga melting point, respectively.
Severe irreproducibilities were observed for both the TPW recalibration (see, for example, the TPW measurements for unit 0081) and the Ga recalibration (units 0015 and 0081). The origin of these irreproducibilities could be ascribed neither to the local fixed-point realization nor the recalibration, and were consequently attributed to the SBE35 units, though a specific origin could not be identified.

2.3. Calibration by Comparison of SBE35 and SBE3 in a Water Bath

Three SBE35 units (s/n 0015, s/n 0019 and s/n 0081) and one SBE3 unit (s/n 4812) were recalibrated by comparison to two reference SPRTs, in a recently developed sub-millikelvin water–bath calibration facility in the range 0 °C to 30 °C [10]. The combined use of (i) an Isotech MicroK 70 resistance ratio bridge to measure the resistance of the two reference SPRTs, (ii) a homebuilt temperature control for the water temperature, and (iii) a massive brass comparator block (see Figure 4) allowed us to reduce the calibration uncertainty below 1 mK (see the uncertainty budgets in Table 2).
The results of the recalibration of the three SBE35 units and the SBE3 unit are shown in Figure 5.

3. Pressure Dependence

Our first attempt to investigate the pressure dependence of the SBE35 is reported in [8]. In this occasion, the measurements were performed in the mechanical workshop at NIOZ, Texel, the Netherlands, where an 80 MPa pressure chamber and several SBE35 and SBE3 units were made available (although, for safety considerations, we limited the pressure to a maximum of 60 MPa). The reference temperature was provided by an SPRT, traceable to the ITS-90, and an ASL F18 resistance ratio bridge, both transported to NIOZ. Unfortunately, some experimental conditions could not be optimized—the temperature of the water in the pressure chamber was not actively controlled (it was only left stabilizing overnight) and the electromagnetic environment of the resistance ratio bridge was not that typical of a primary thermometry laboratory (noisy and spiking, particularly when other machines were operated in the workshop).
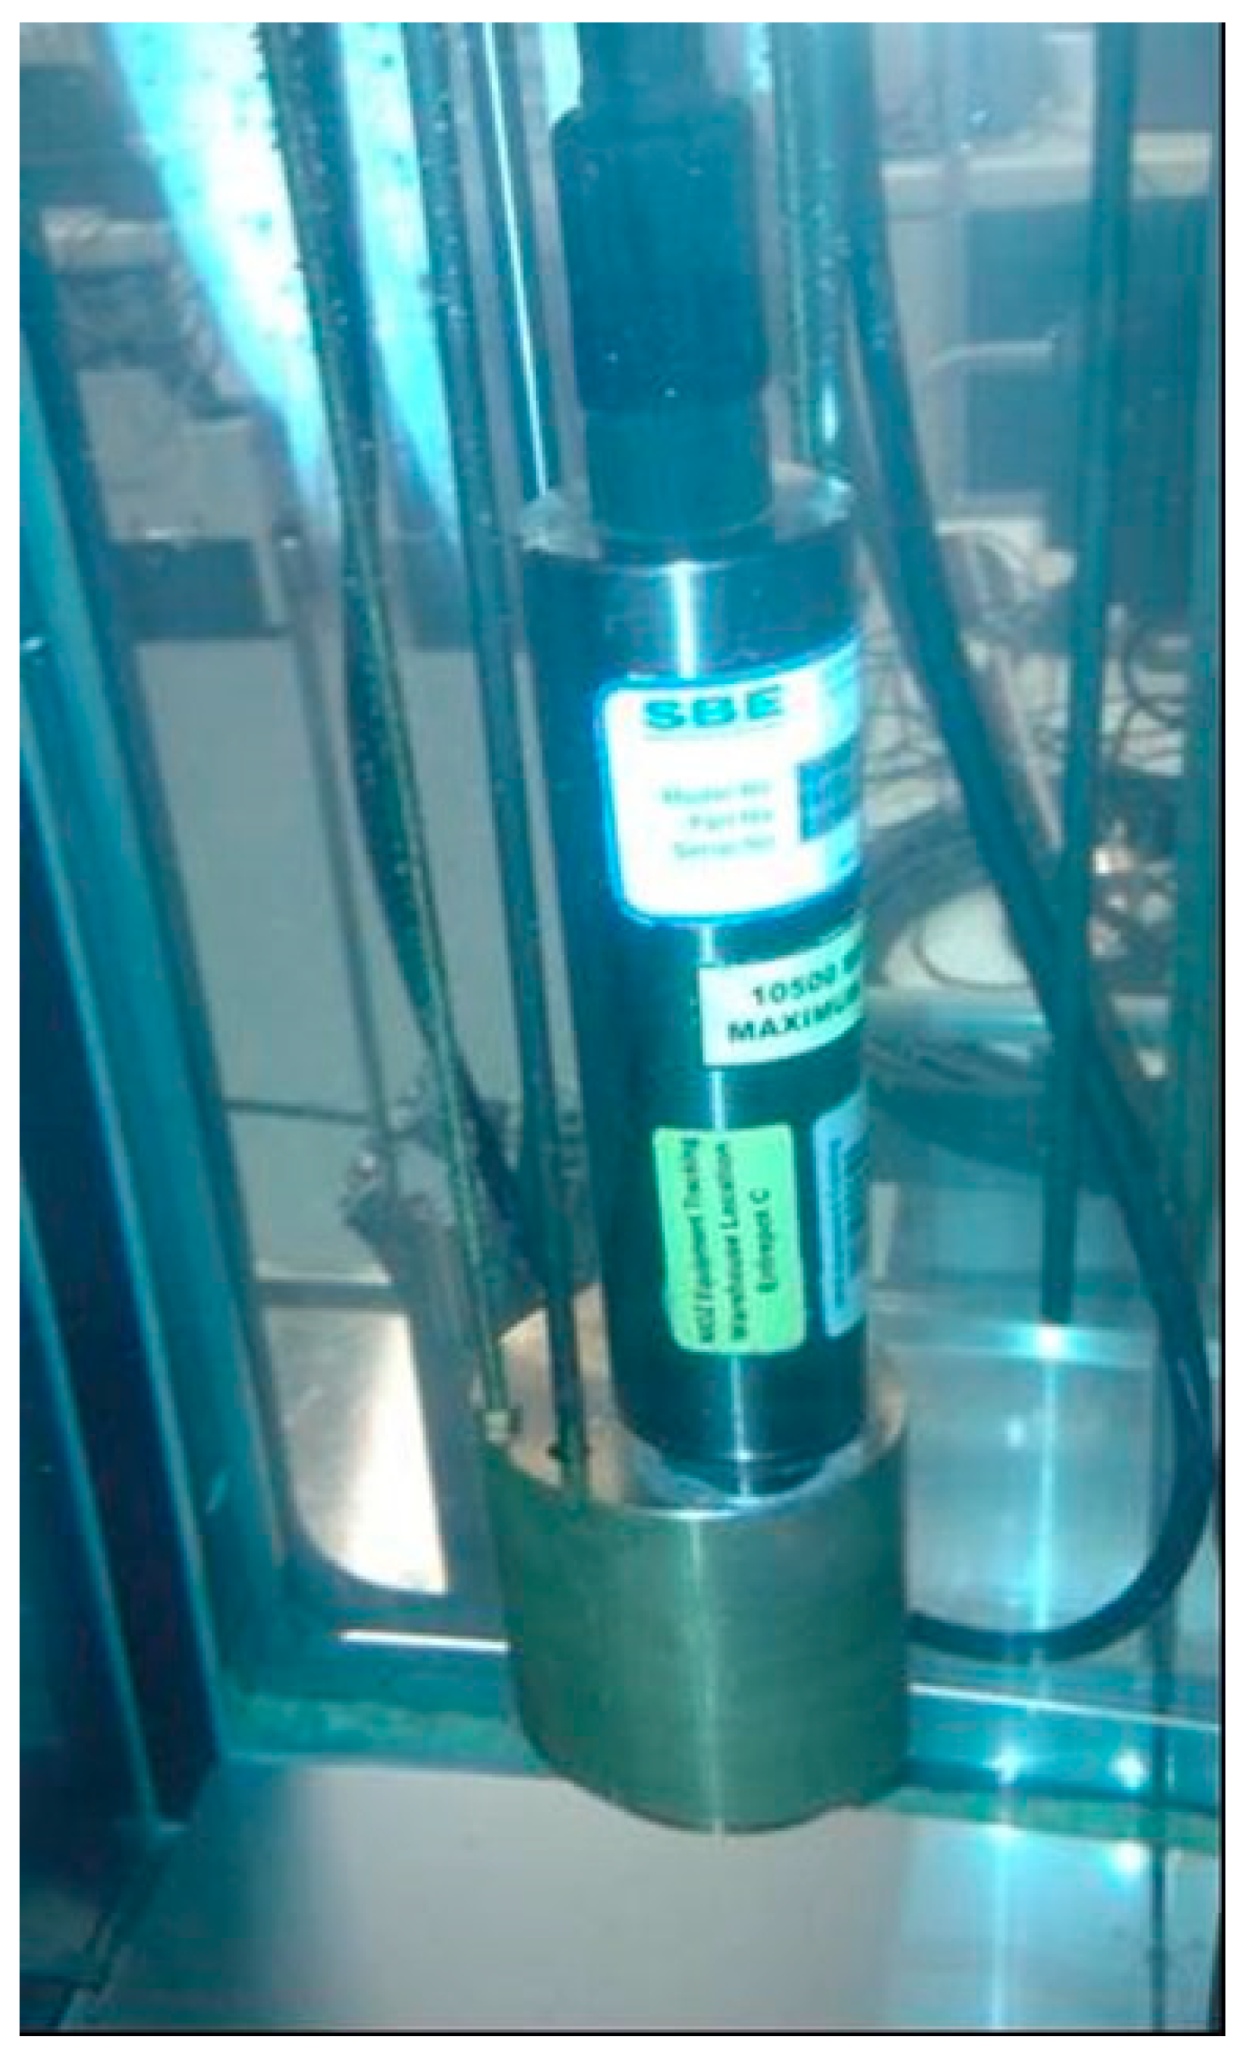
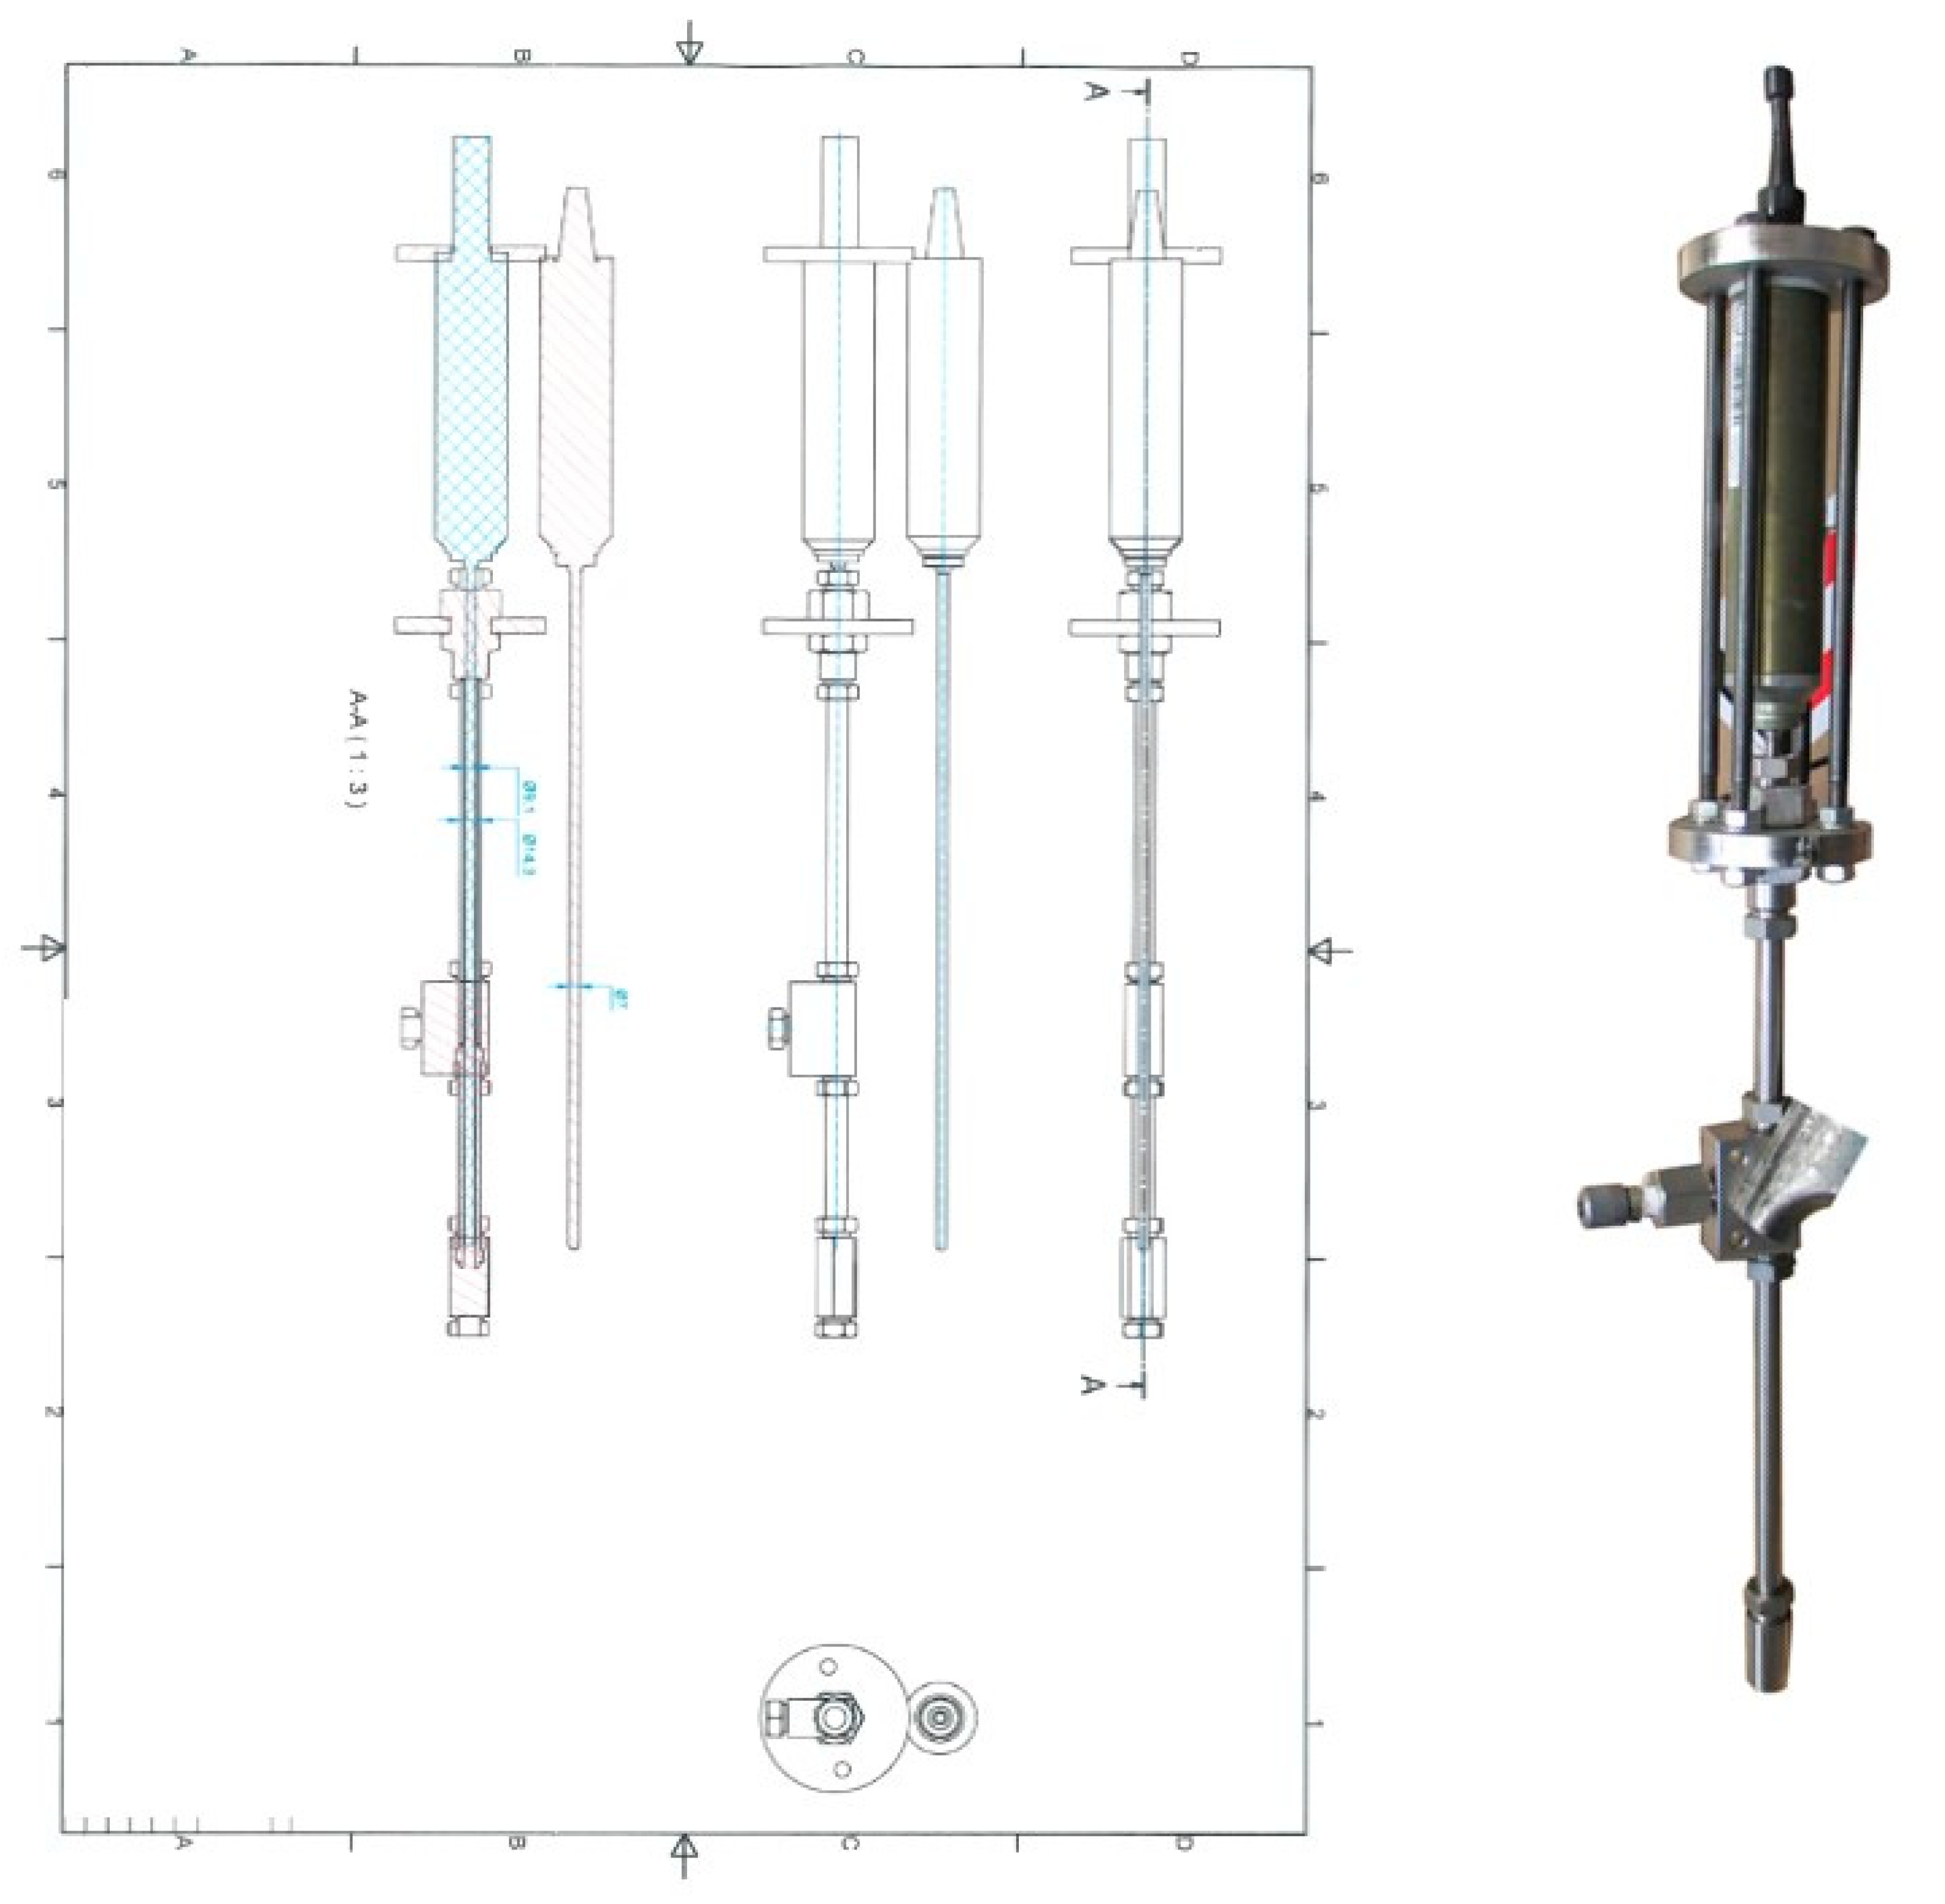
At a later time, we decided to repeat the experiment in a thermometry laboratory. As no pressure chamber was available in the thermometry laboratory, a compact pressure enclosure for the SBE35 (see Figure 6), which could be directly submersed in a commercial water bath and pressurized using an external dead-weight tester via a 1/8 inch stainless steel tube and a hydraulic liquid, was designed and realized by Minerva Metrology and Calibration, Amersfoort, the Netherlands.
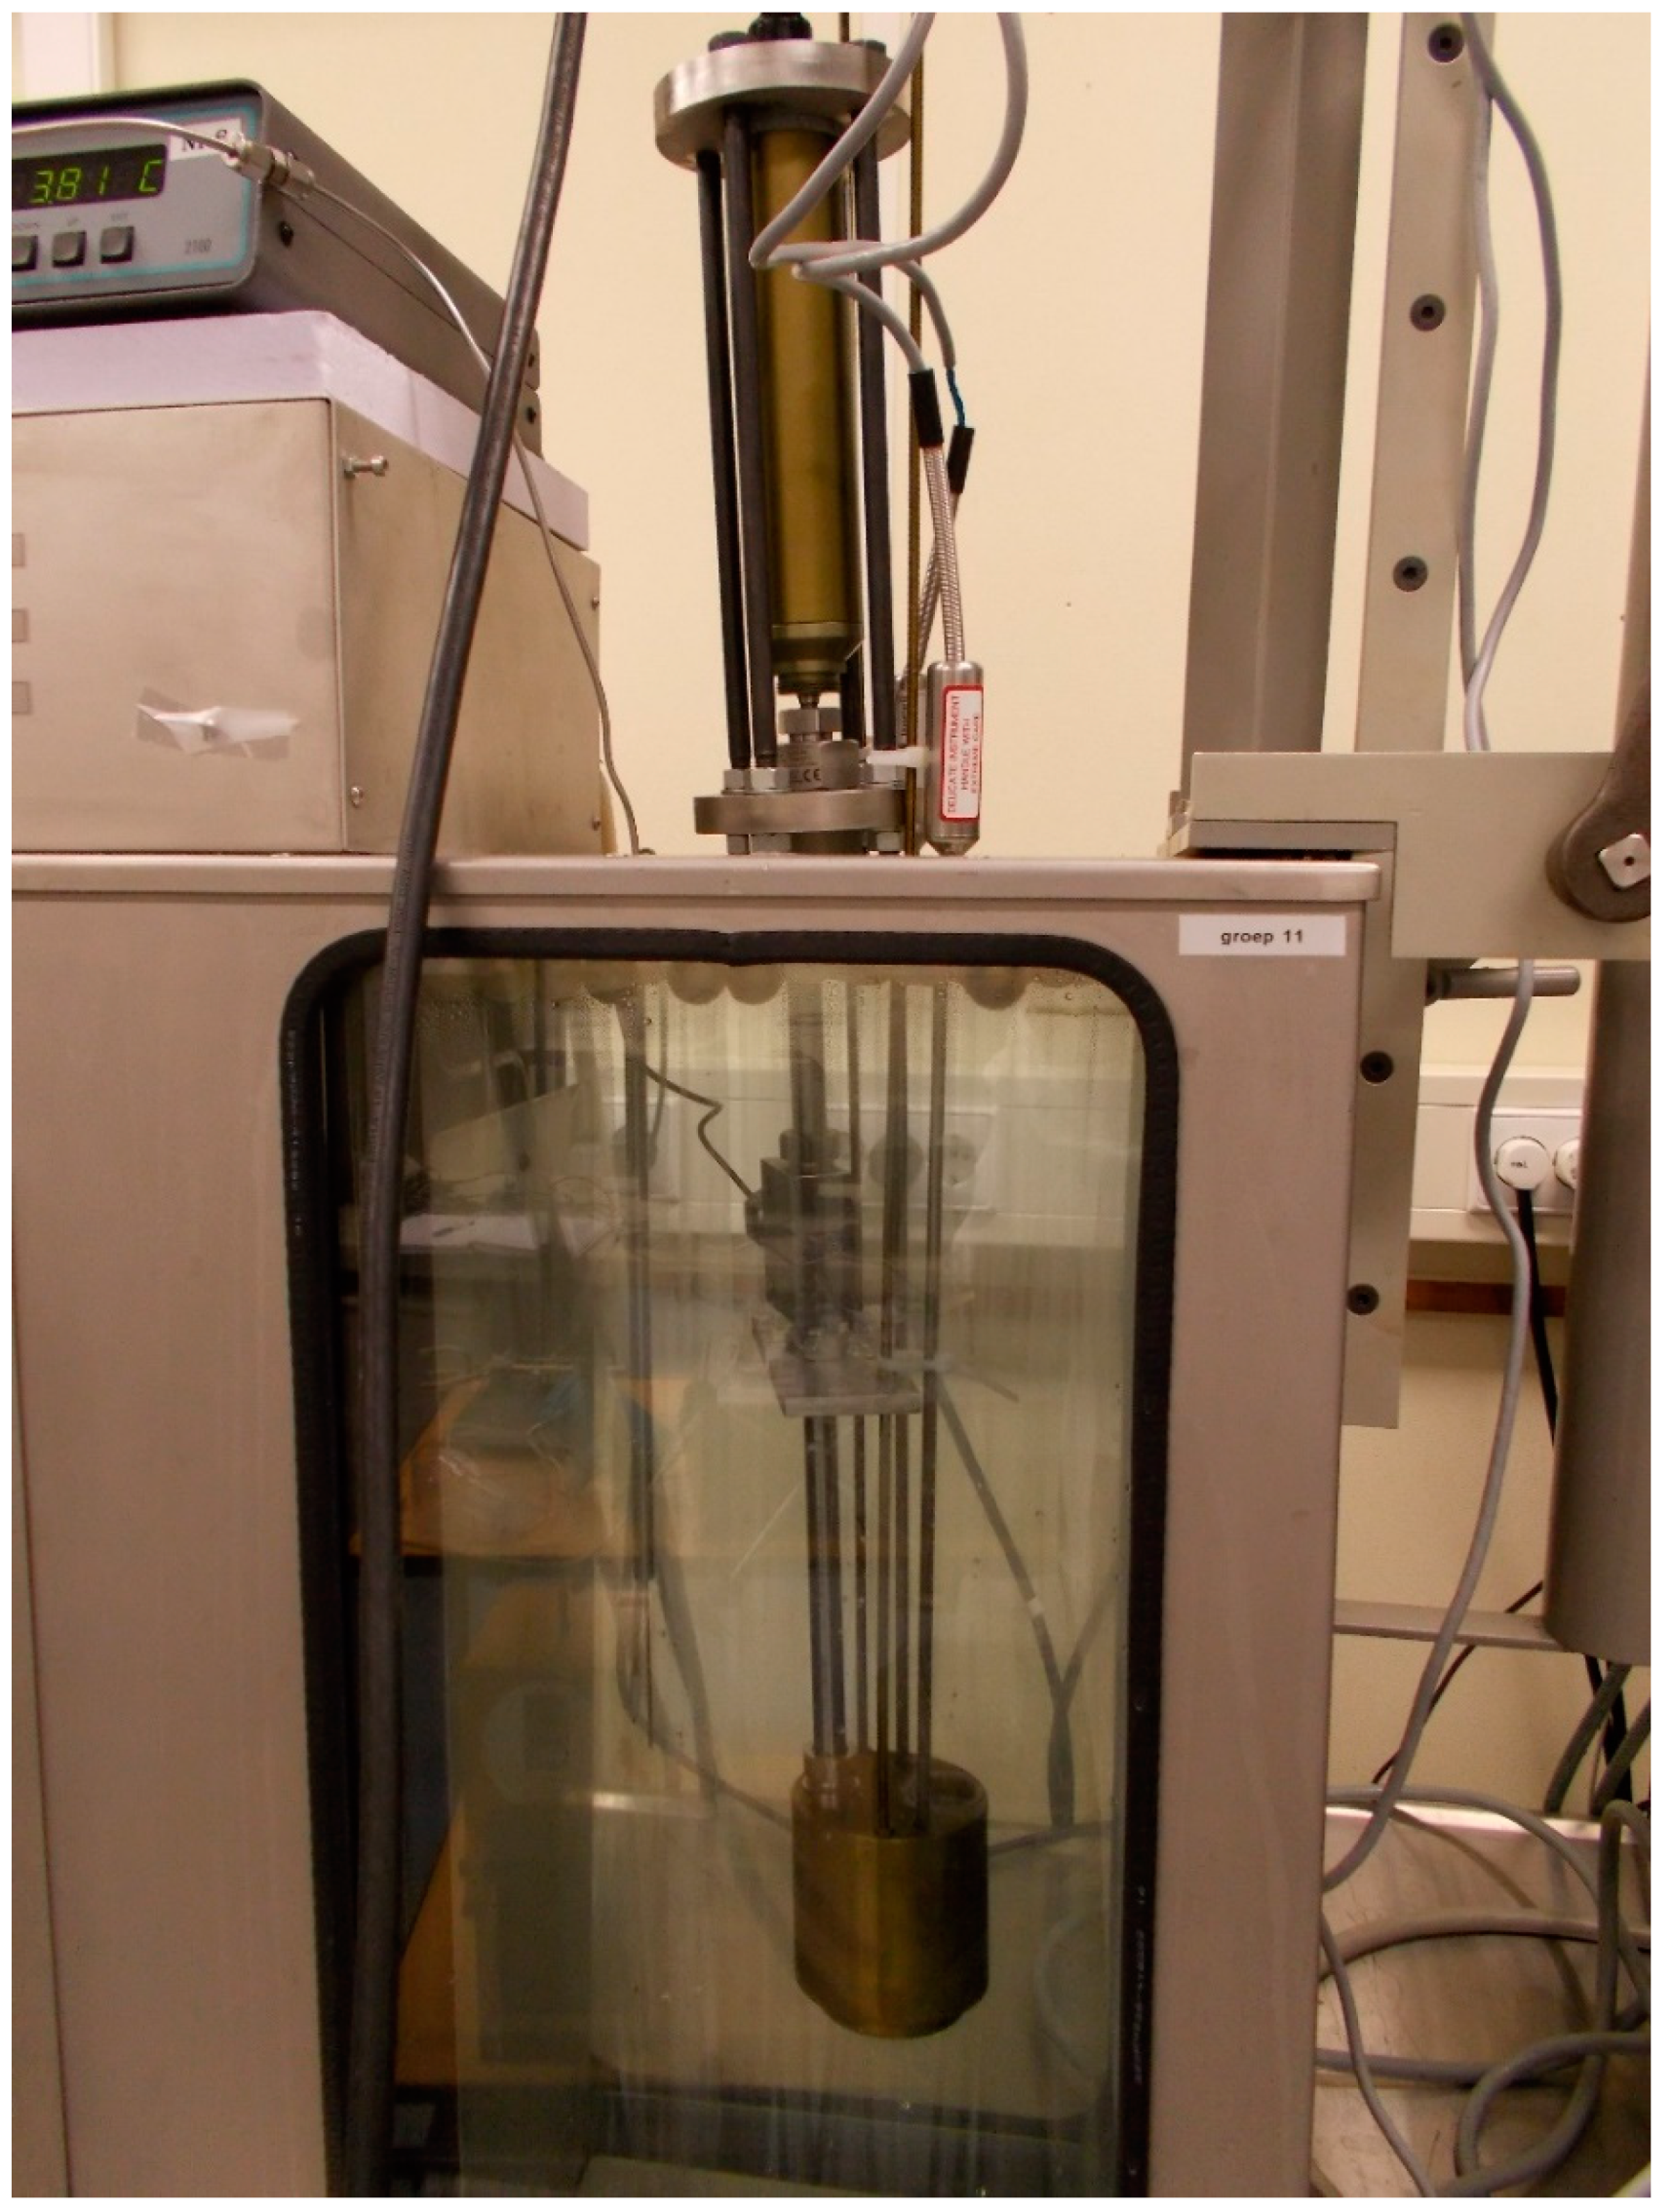
In Figure 7 a picture of the experimental set-up is shown—an SBE35, enclosed in the pressure chamber, and two reference SPRTs are accommodated in a massive brass comparator block, all submersed in a commercial water bath. The pressure in the enclosure, generated by the external dead-weight tester, was measured with a calibrated pressure transmitter Druck that had a calibration uncertainty of 0.003 MPa.
As expected from thermodynamic considerations, the pressurization and de-pressurization of the pressure enclosure affected the temperature of the SBE35, due to the temperature change of the pressure-transmitting hydraulic liquid generated by the pressure change. Figure 8 shows the time evolution of the temperature read by the SBE35 at and after pressurization (Figure 8a) from atmospheric pressure to 50 MPa and at and after de-pressurization (Figure 8b) from 50 MPa to 30 MPa. For a pressure increase of 50 MPa, the temperature increase was approximately 0.8 °C, followed by a fast recovery (a few minutes) and a slow equilibration (approximately 30 min), both promoted by the water bath controlled at approximately 4 °C. Similarly, for a pressure decrease of 20 MPa, the temperature decrease was approximately 0.4 °C, followed by a fast recovery and a slow equilibration.
Measurements were performed manually in day time on s/n 0015 unit and automatically in night time on s/n 0081. The automatic night measurements allowed a larger statistic, and consequently, a lower uncertainty. Despite our efforts to mount the SBE units leak-tight in the pressure enclosure, small pressure drifts at the highest pressures could not be avoided (see Figure 9). However, these small pressure drifts did not affect the measurement of the temperature difference tSBEt90, between the SBE35 units and the reference temperature provided by the reference SPRTs (see
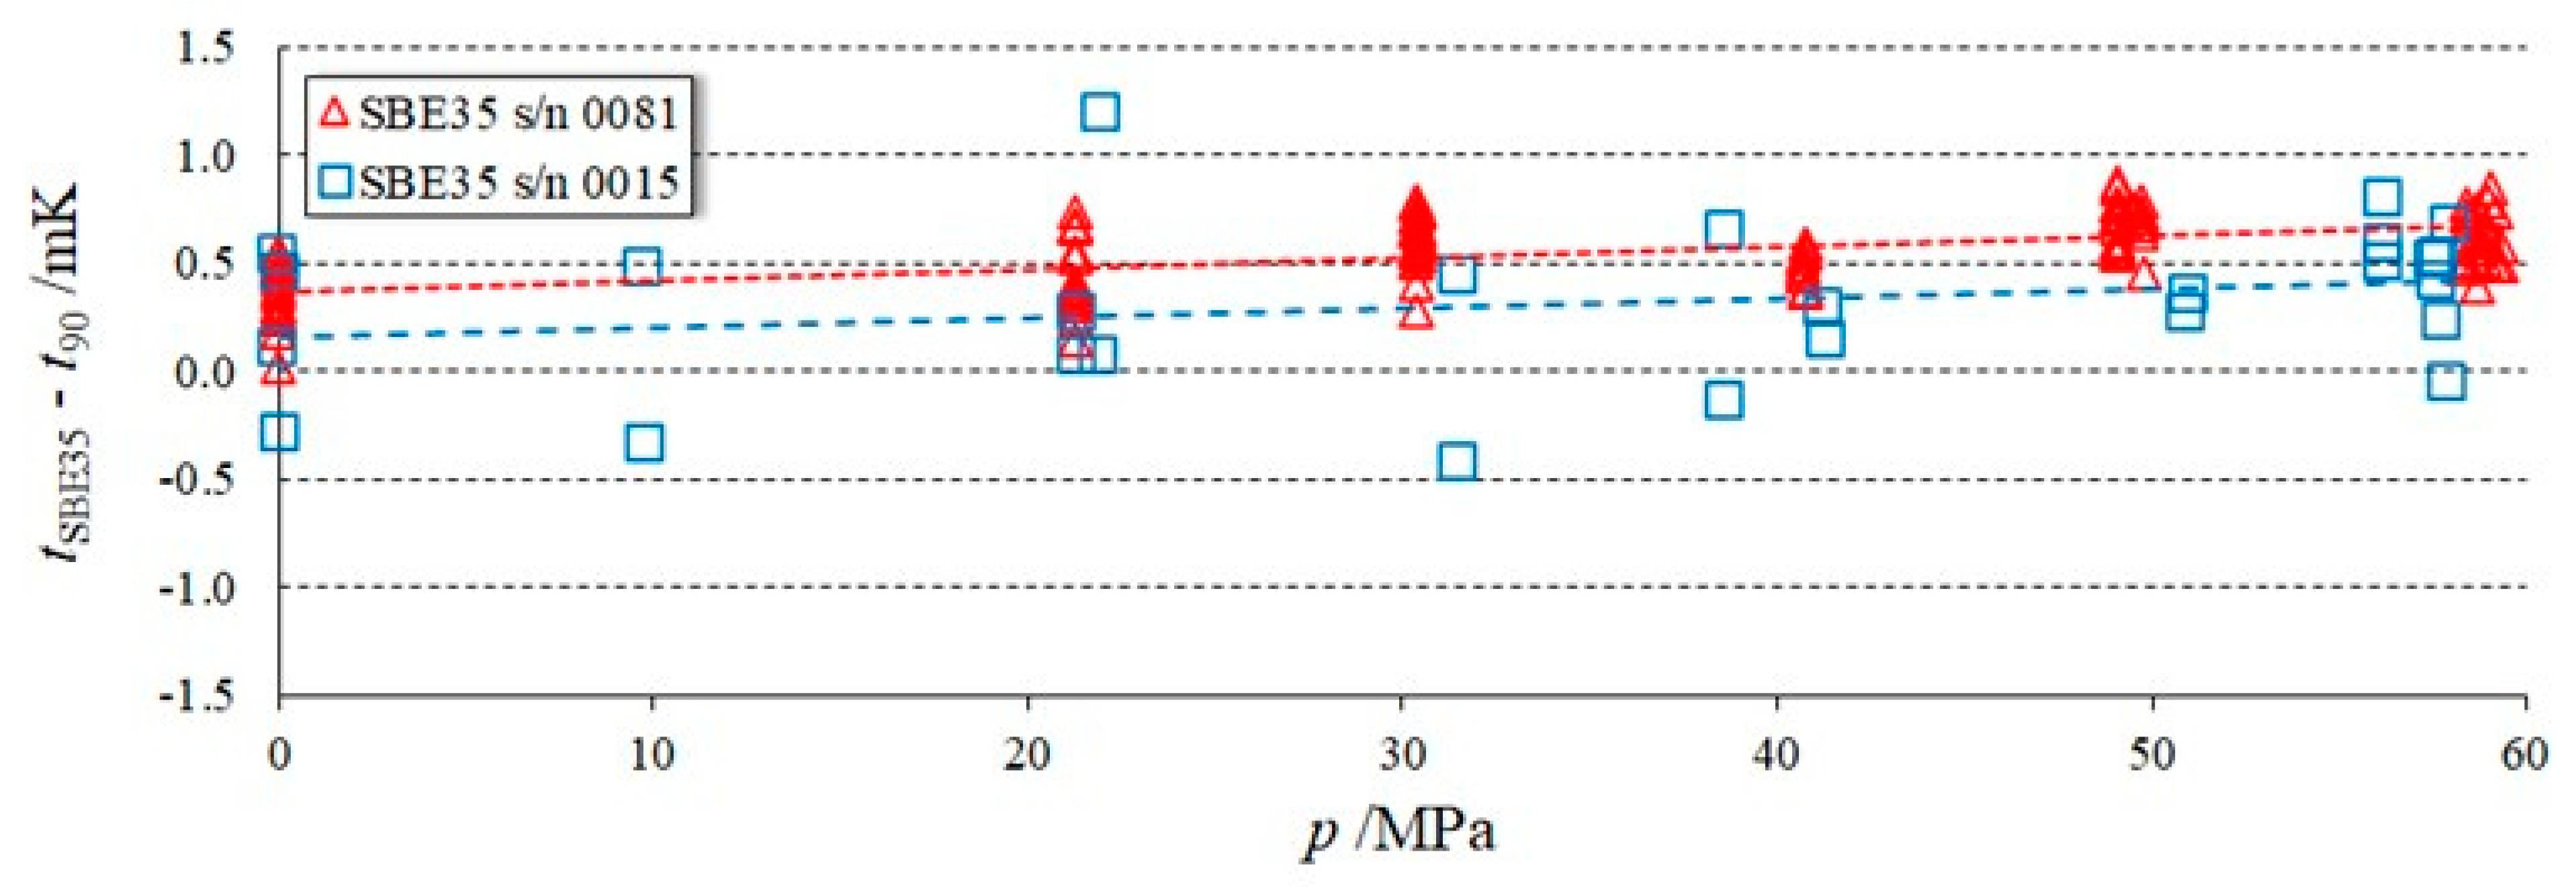
 Figure 10).
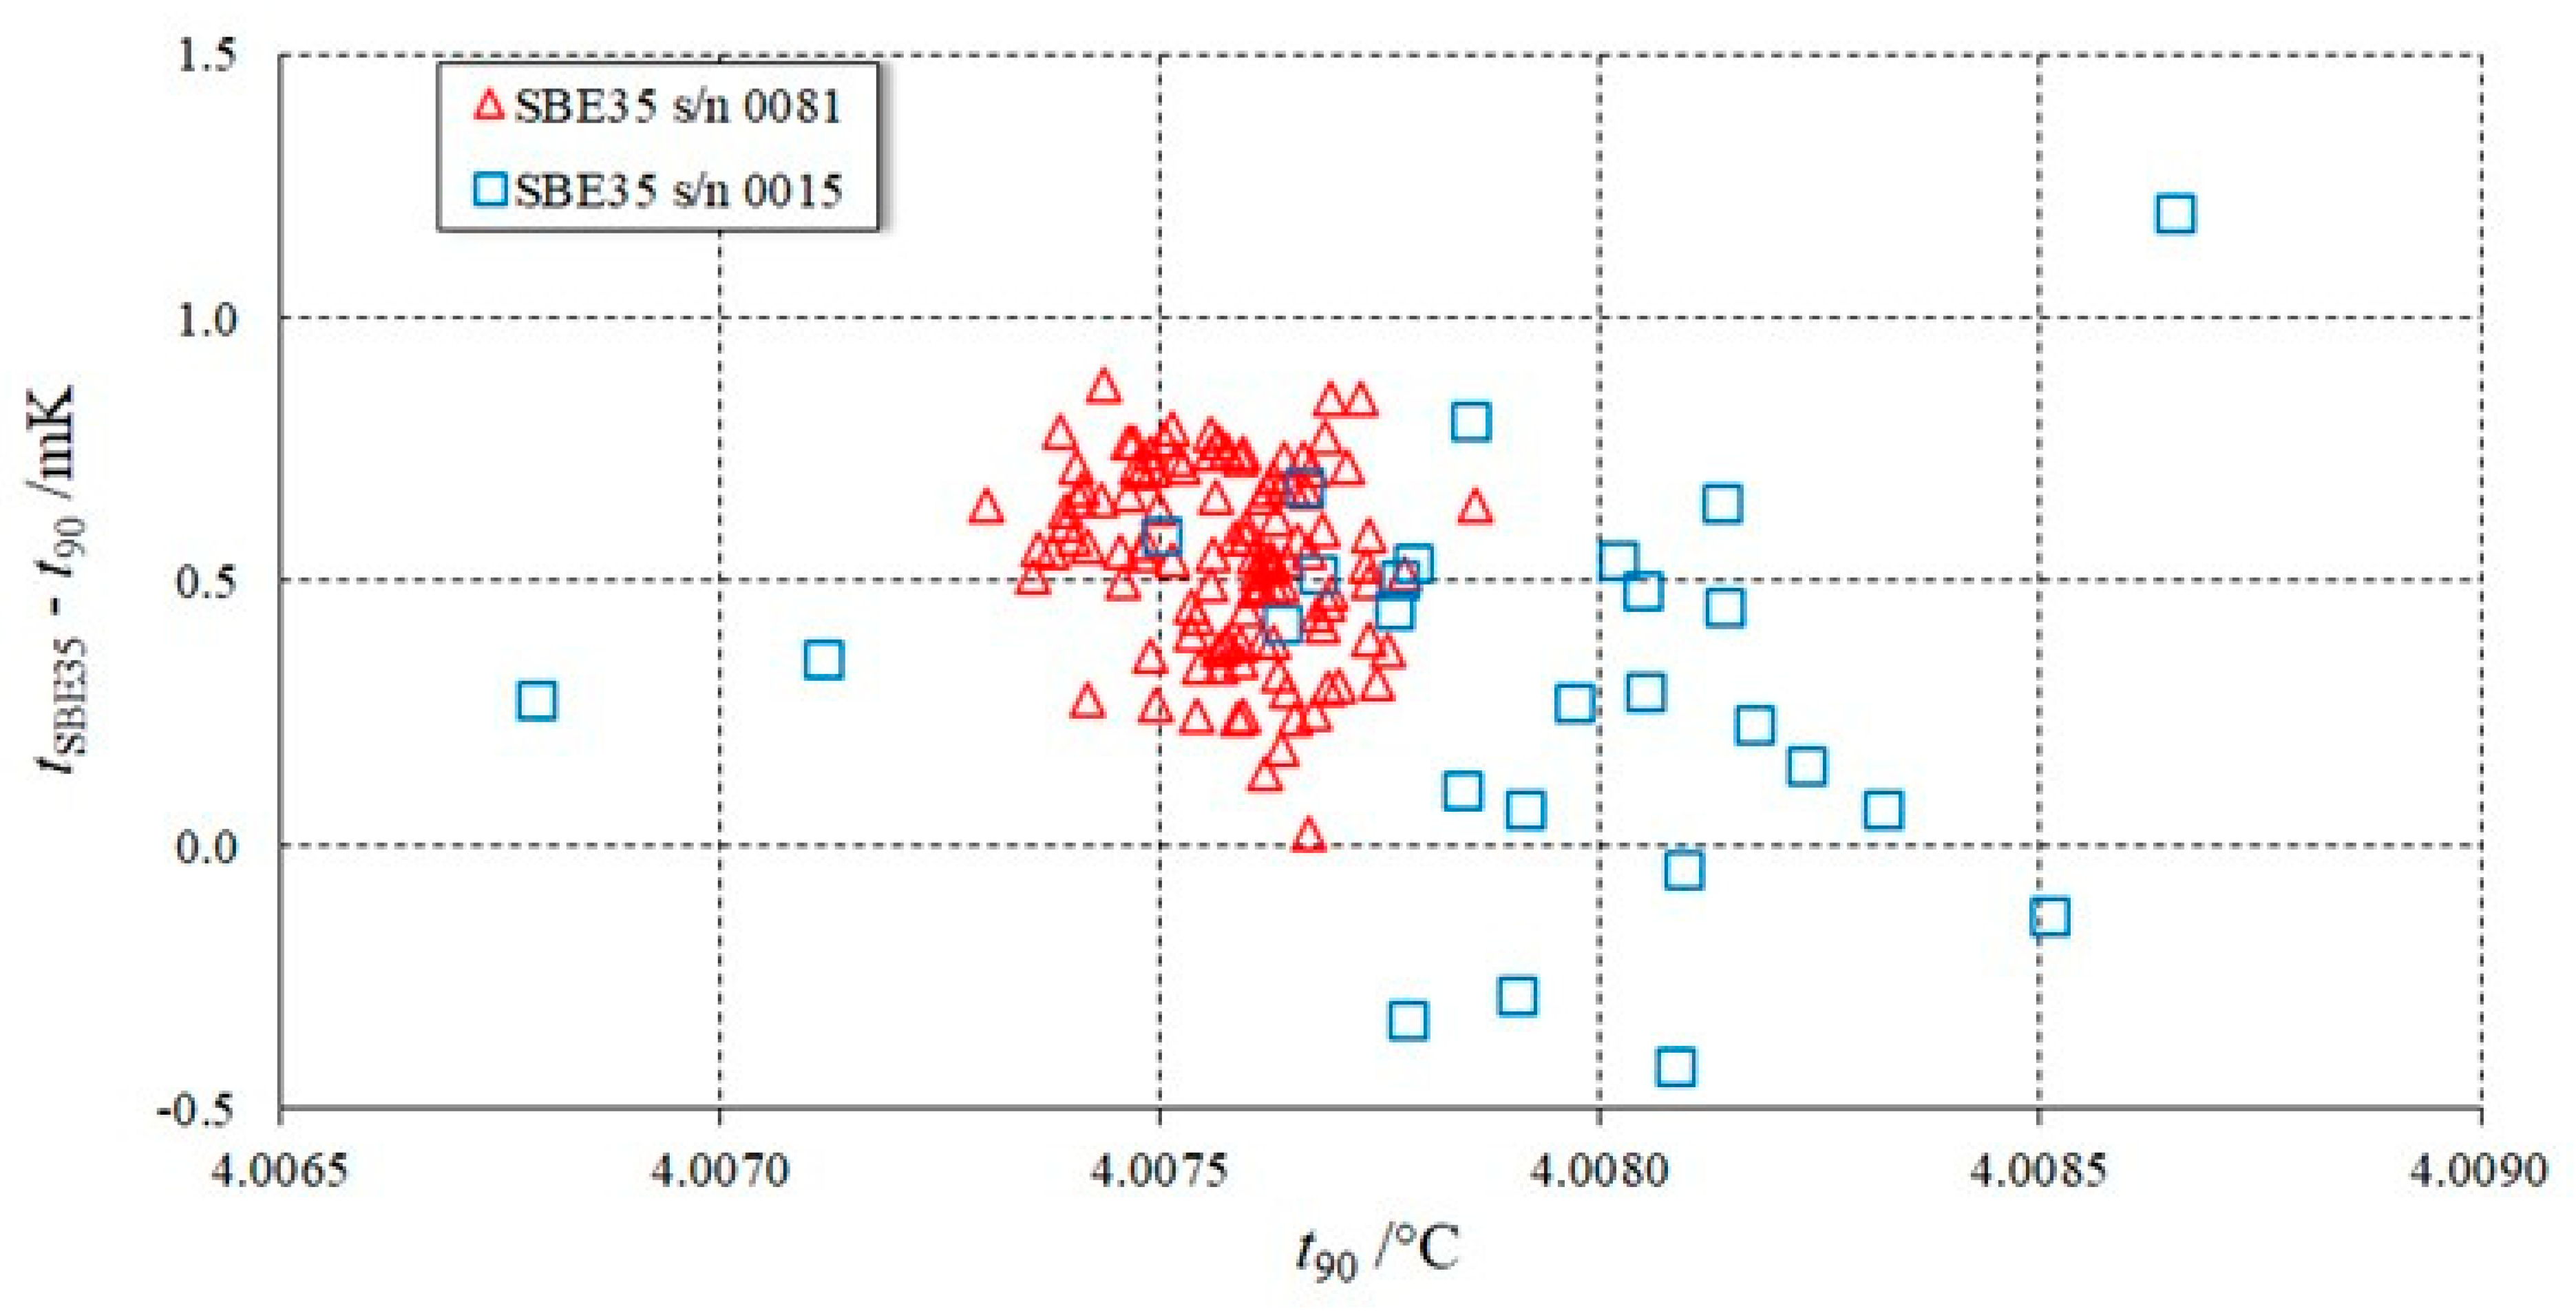
Figure 10 shows the measured temperature difference between the SBE35 reading and the reference temperature as a function of the applied pressure. The scatter in the s/n 0015 measurements was much larger than that in the s/n 0081 measurements. Figure 11, showing the temperature difference between the SBE35 reading tSBE35 and the water bath reference temperature t90 as a function of t90, suggests that a large part of the scatter was due to the temperature stability of the water bath during the measurements—while for the s/n 0081, the scatter in the reference temperature was slightly larger than 0.5 mK, for the s/n 0015 the scatter exceeded 1.5 mK.
From 
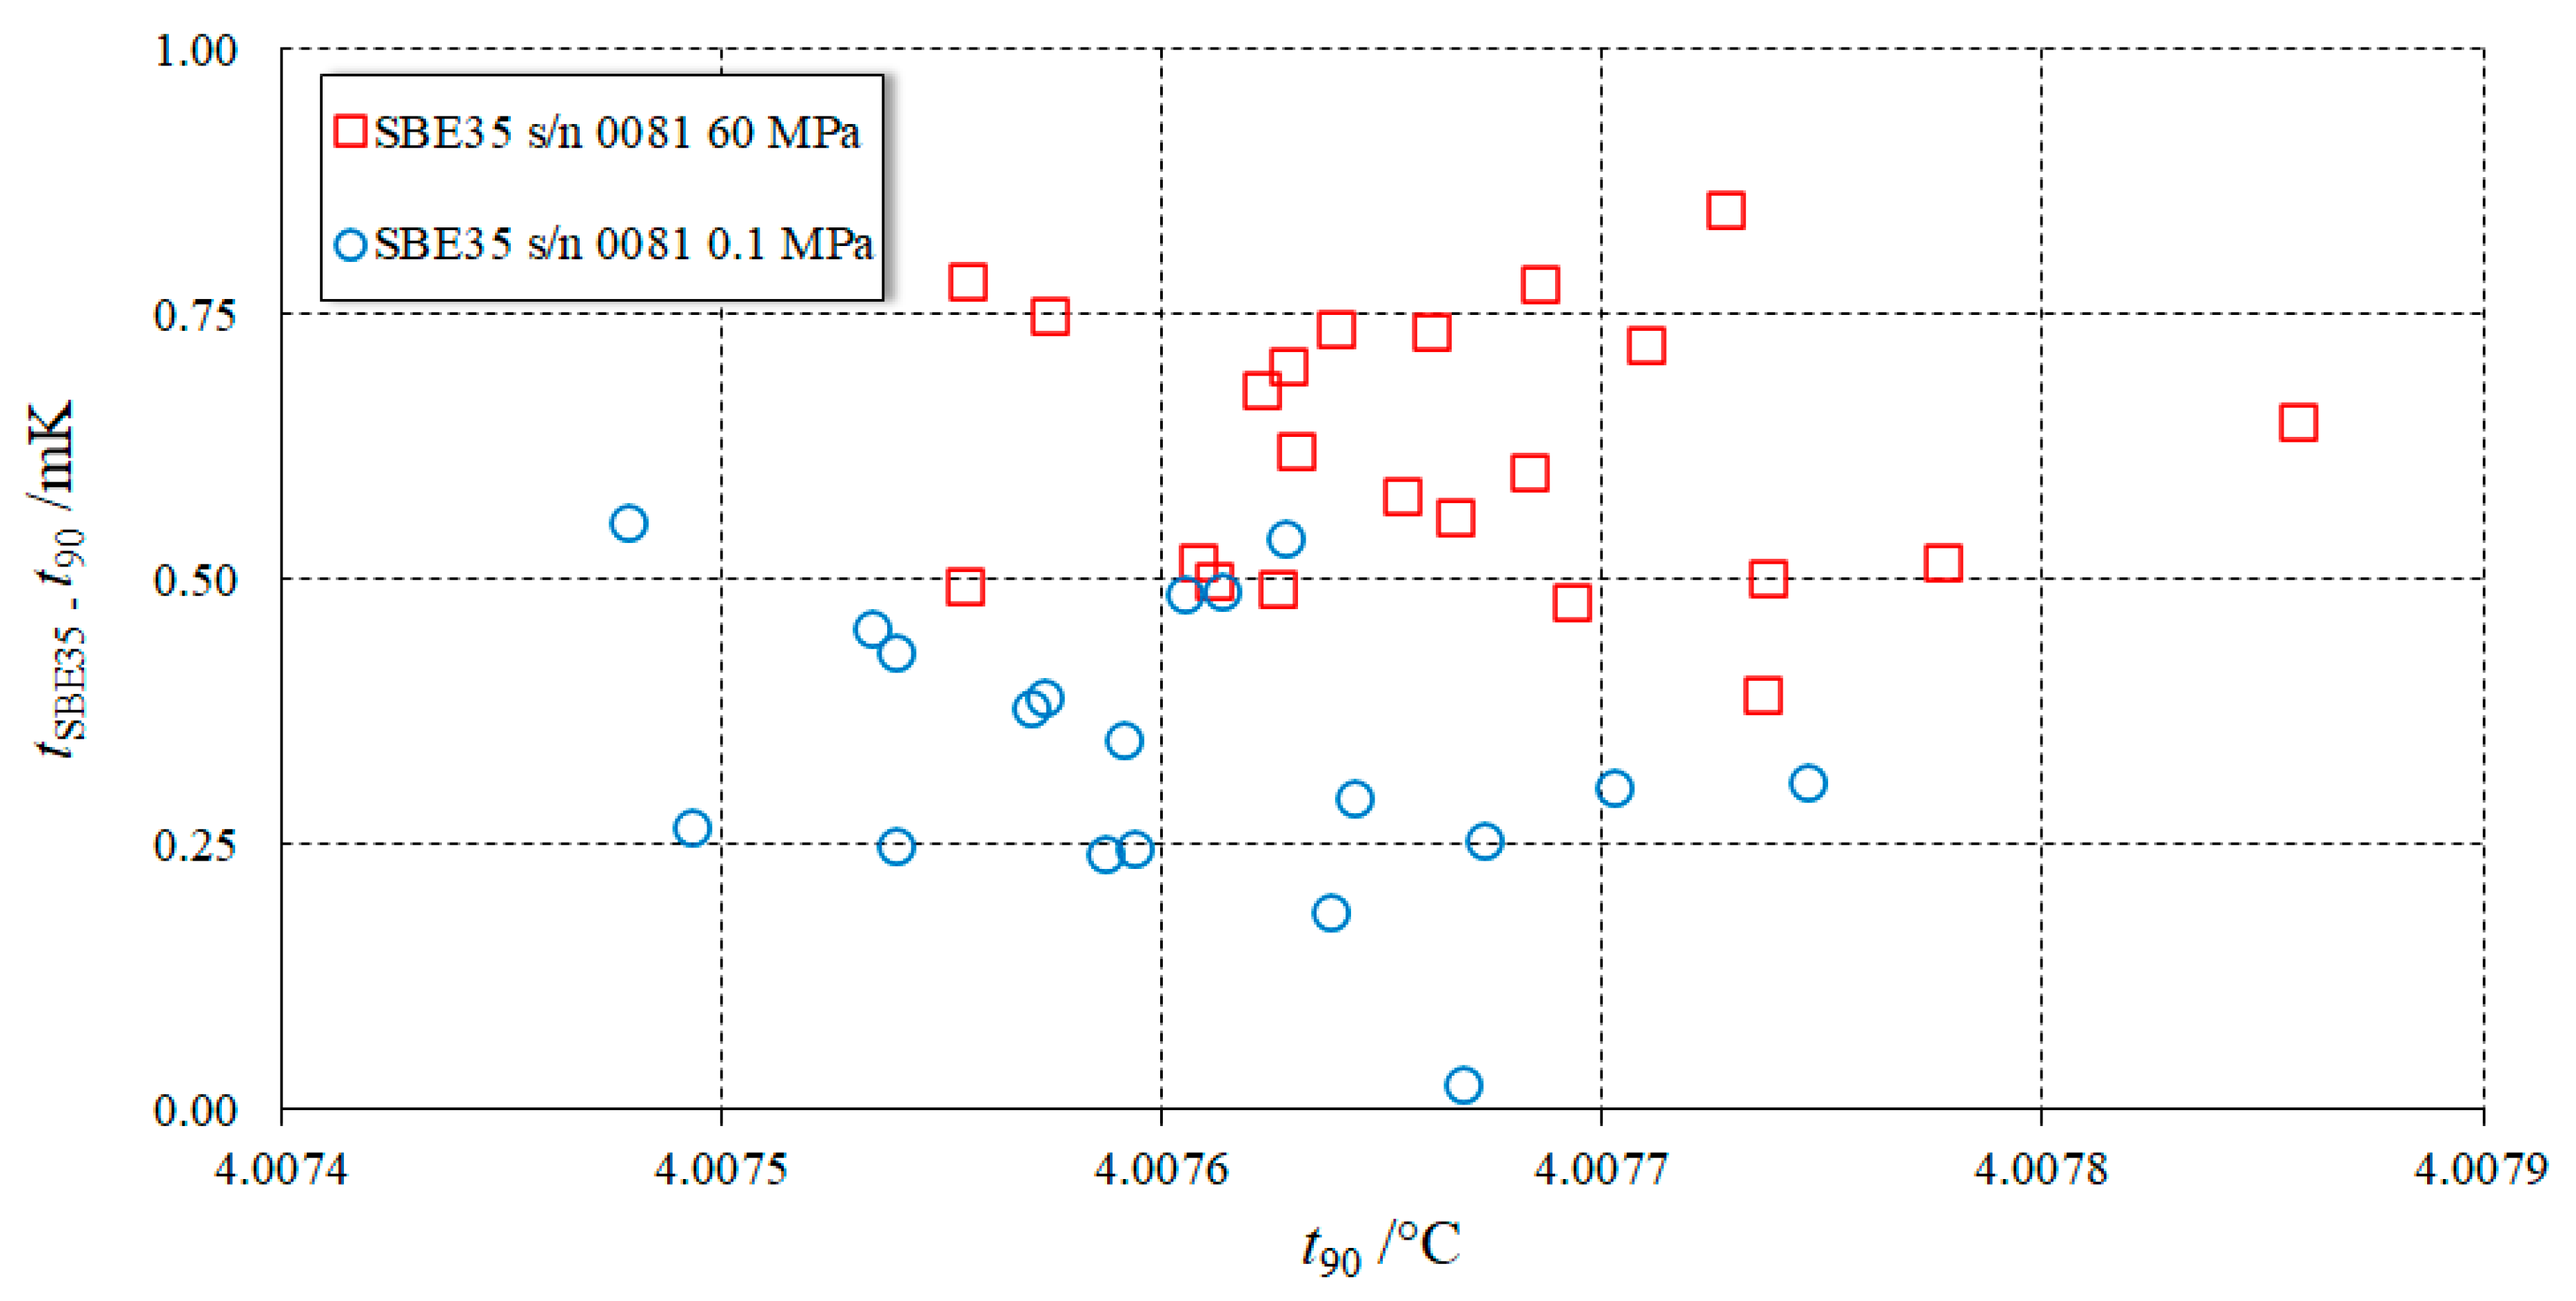
Figure 10 it is evident that the size of the observed pressure effect in the two units (less than 1 mK at the highest pressure of 60 MPa) was comparable to the uncertainty of the measurement system. Nevertheless, Figure 12 clearly shows that the measurements points at 60 MPa had shifted up, with respect to the experimental points at 0.1 MPa, suggesting the existence of a pressure effect.
A Monte Carlo method was applied to each set of experimental data as follows:
-
A pressure effect linear on the applied pressure p was assumed: tSBE35t90 = a0 + a1p
-
The set of N (N = 27 for the s/n 0015 set and N = 112 for the s/n 0081 set) experimental points (pi, (tSBE35t90)i) was randomized as:
o
pi,k = pi + Rk(−1, 1)∙u(p)
o
(tSBE35t90)i,k = (tSBE35t90)i + Rk(−1, 1)∙u(t)
where Rk(−1, 1) is a random generator comprised between −1 and +1 with rectangular distribution, u(p) = 0.003 MPa is the standard uncertainty of pressure, and u(t) = 0.153 mK is the standard uncertainty of the bath temperature.
-
For each of the 8192 randomized sets of experimental data, a linear regression of the relationship tSBE35t90 = a0 + a1p provided the pressure sensitivity a1.
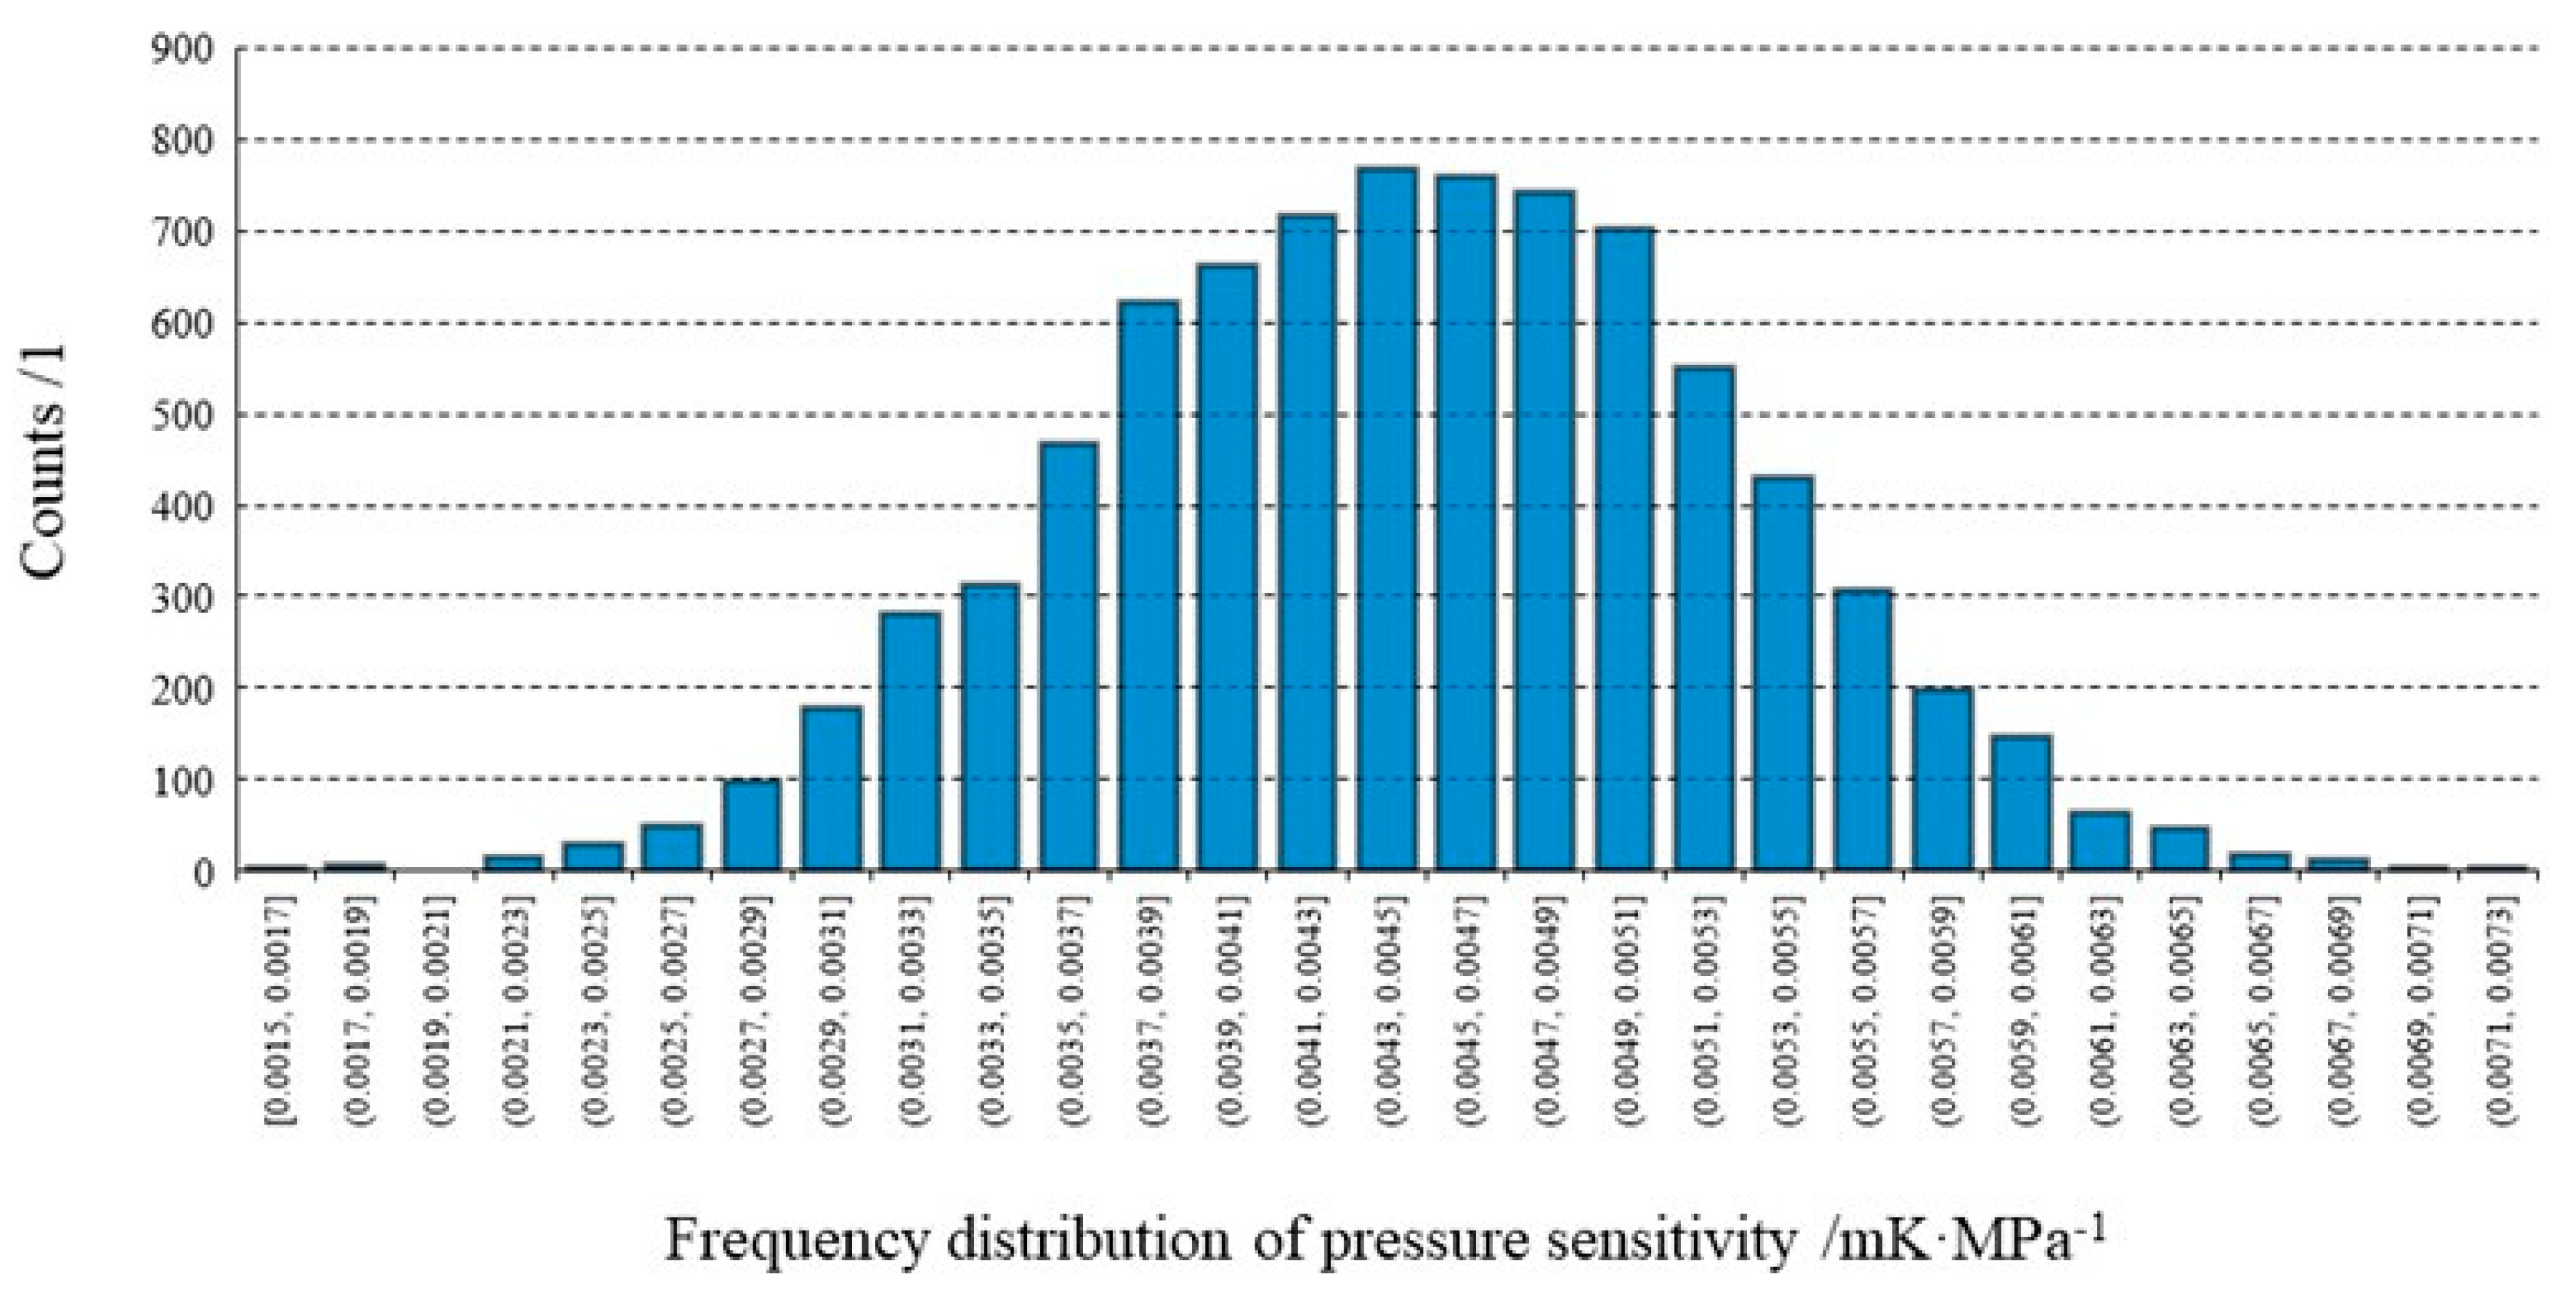
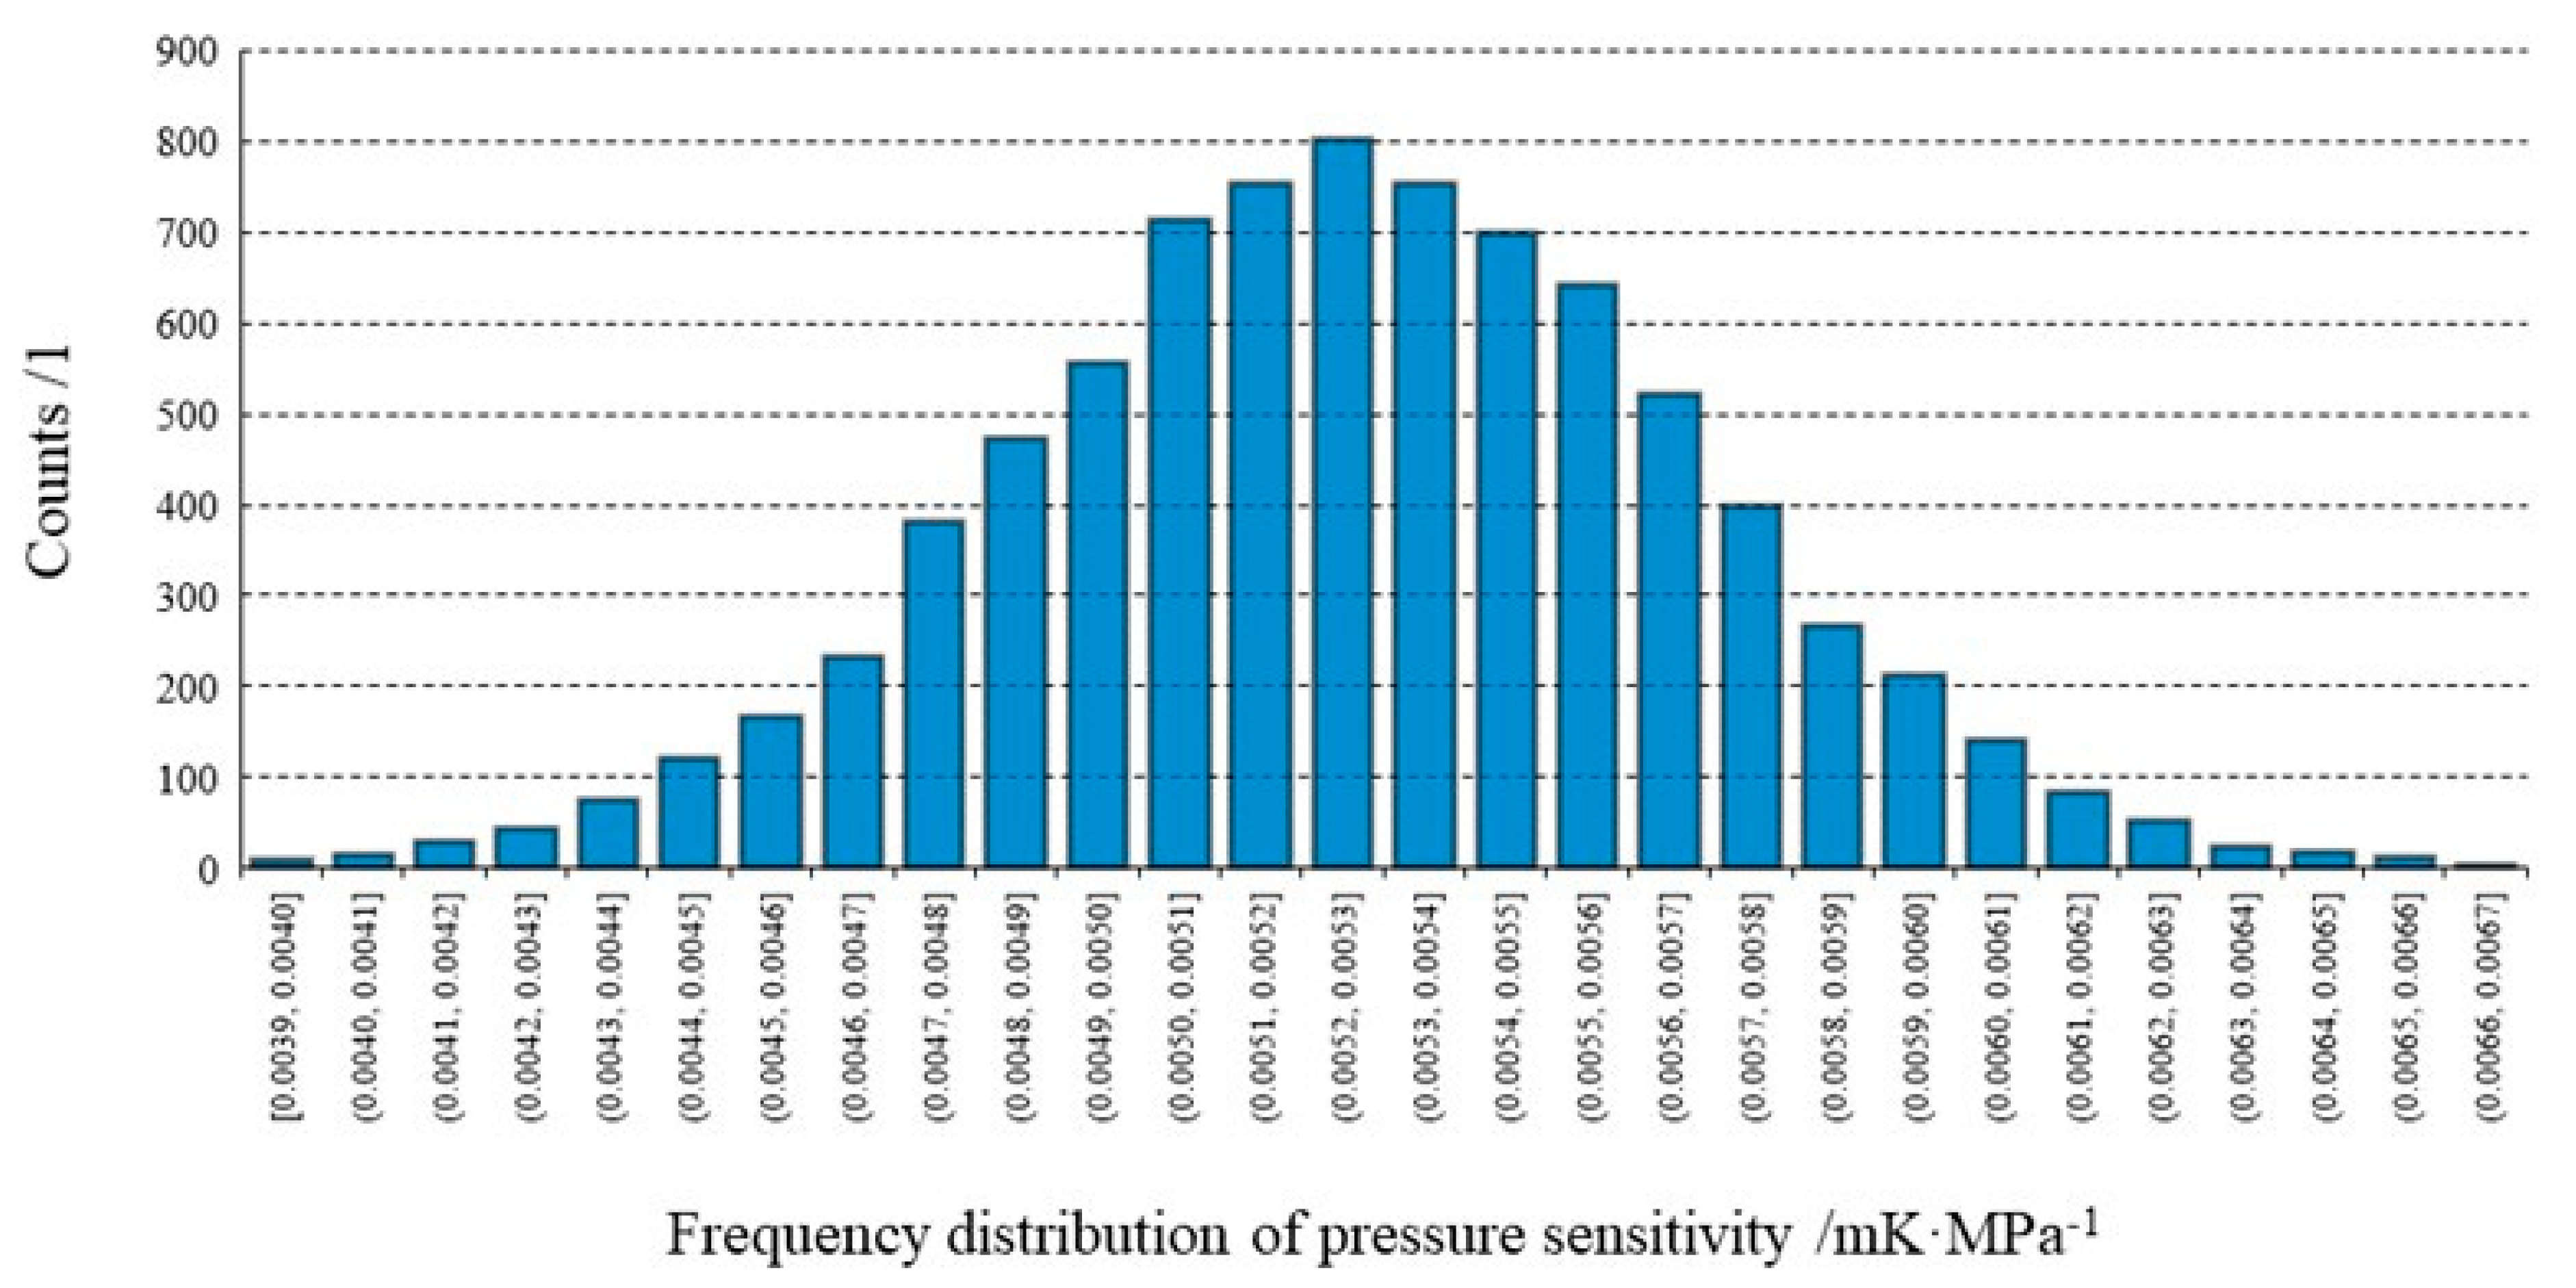
The distributions obtained for the pressure sensitivities a1 are shown in Figure 13 and Figure 14. The best estimates and the variances of the obtained pressure sensitivities were: a1 = 0.0045 mK∙MPa−1 and σ = 0.0008 mK∙MPa−1 for the SBE35 s/n 0015, and a1 = 0.0053 mK∙MPa−1 and σ = 0.0004 mK∙MPa−1 for the SBE35 s/n 0081. These pressure sensitivities translated into pressure effects of 0.27 mK and 0.32 mK, for the s/n 0015 and the s/n 0081, respectively.

4. Conclusions

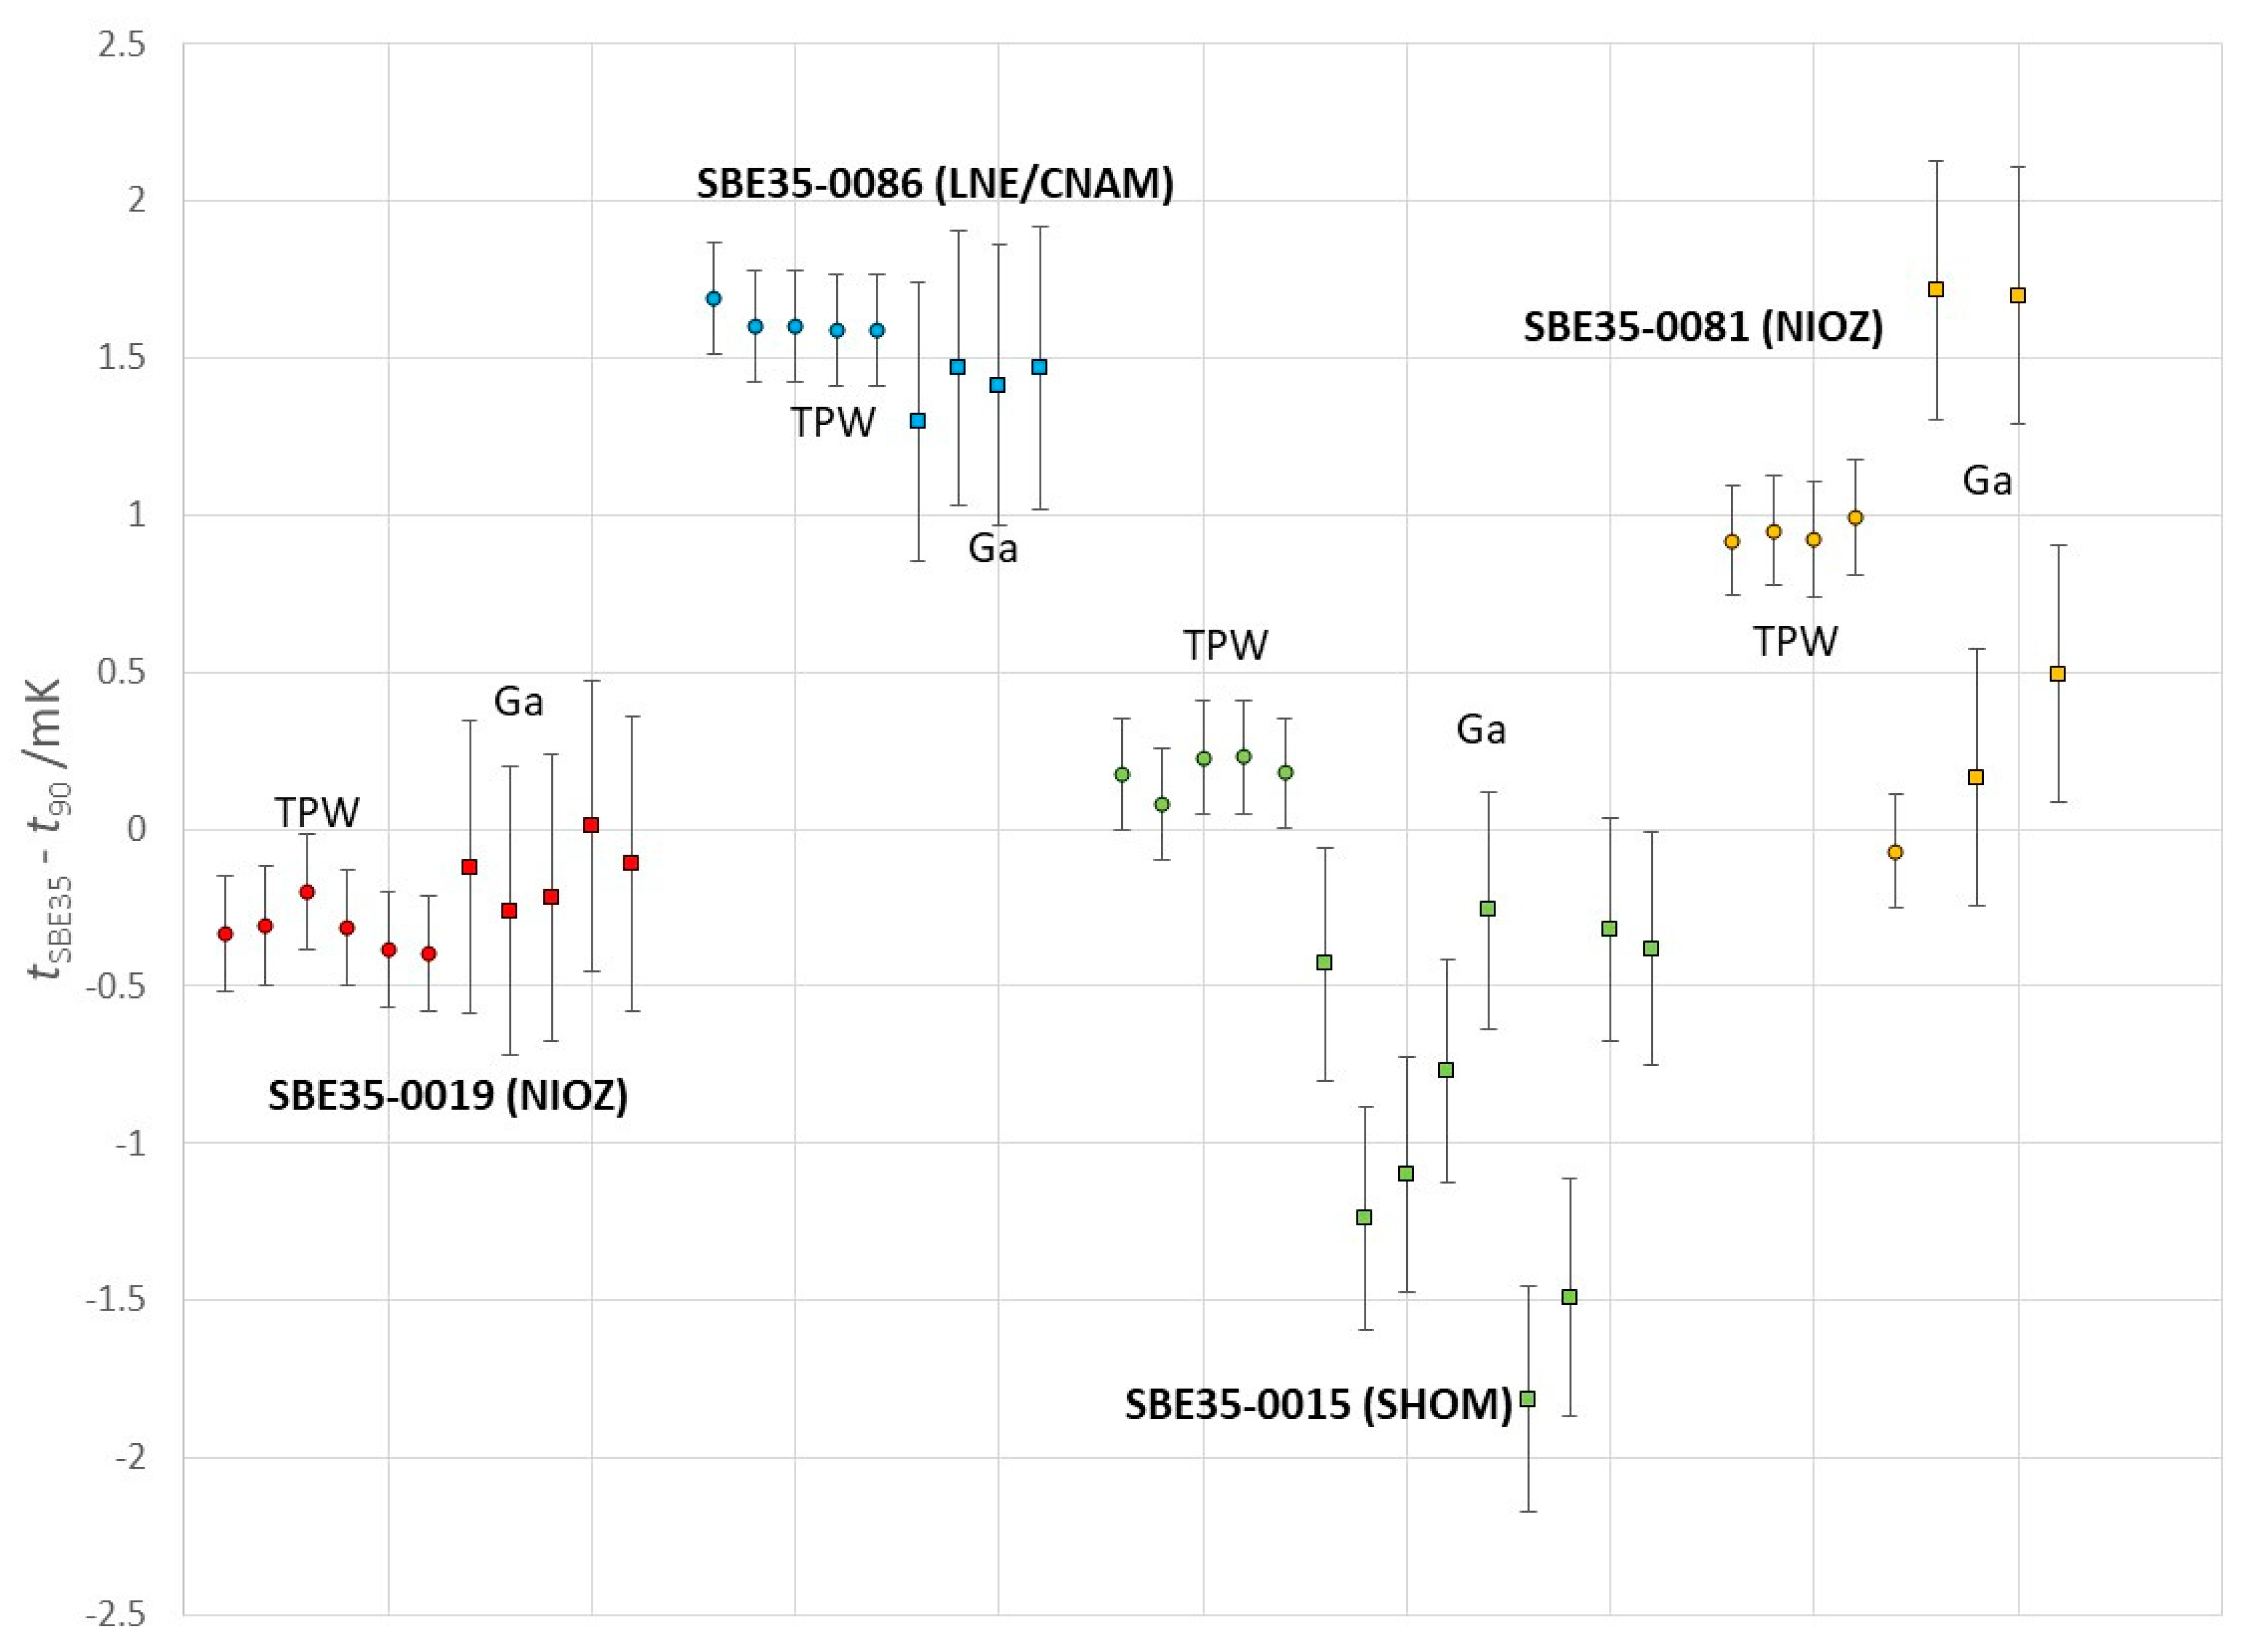
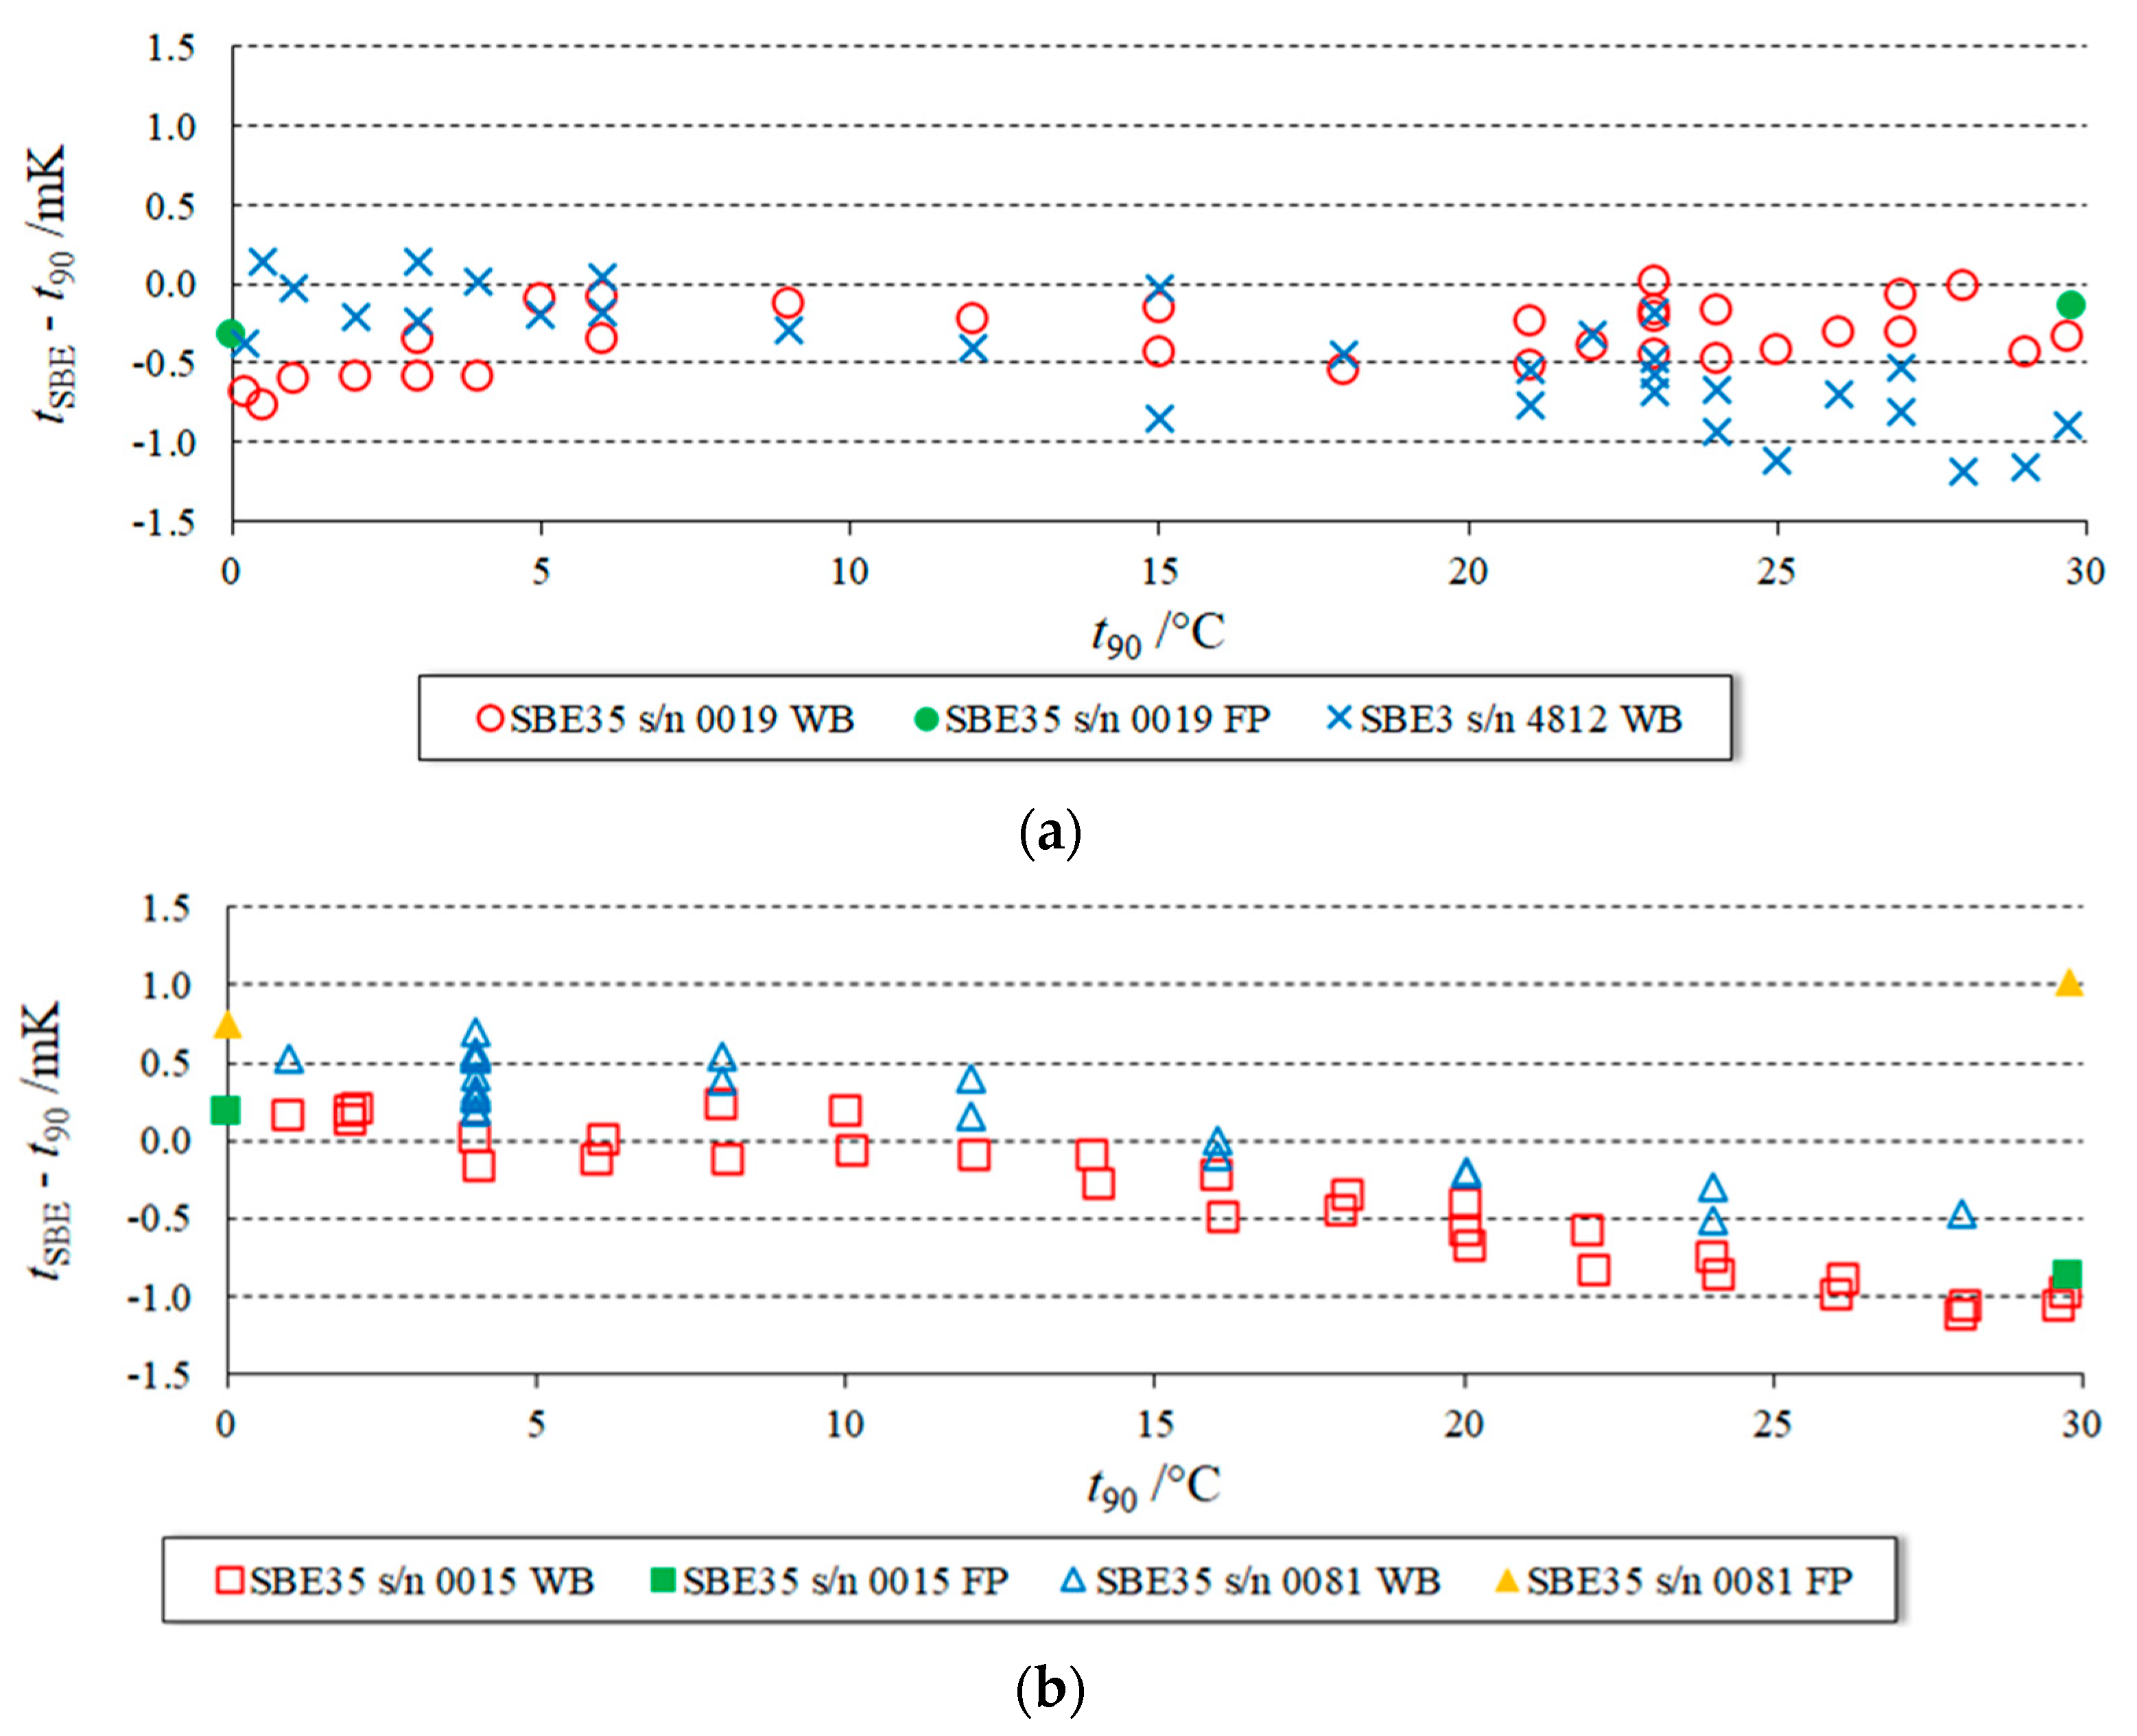
Although the uncertainties claimed by the manufacturer could not be confirmed, the repeated fixed-point calibration of four SBE35 units at the TPW (0.01 °C) and at the Ga (29.7646 °C), and the calibration by comparison in a water bath of two SBE35 units and one SBE3 unit demonstrated a high level of accuracy achievable with the SBE35. Out of the four investigated SBE35 units, one was found to be both precise and accurate (deviating less than 0.3 mK from the reference ITS-90 temperature at both the TPW and the Ga), another one was found to be reproducible but not accurate (deviating approximately 1.5 mK at both the TPW and Ga), and the other two units showed irreproducibilities of up to 1.5 mK. These irreproducibilites could be attributed neither to the local fixed-point realization nor to the recalibration measurements and were consequently attributed to instabilities of the SBE35 reading, though a specific origin could not be identified.
The calibration by comparison between 0 °C and 30 °C in a water bath of three SBE35 units and one SBE3 unit, confirmed the high level of accuracy achievable with the SBE thermometers—better than 1 mK for all SBE35 units and slightly higher than 1 mK for the SBE3 unit.
Our investigation of the effect of high pressures (up to 60 MPa) on the response of two SBE35 units confirmed the existence of a device-dependent pressure effect (0.0045 mK∙MPa−1 mK∙MPa−1 for the SBE35 s/n 0015 and 0.0053 mK∙MPa−1 for the SBE35 s/n 0081). Although the observed pressure effect was very small (approximately 0.3 mK at 60 MPa) for these two specific units, this result could not be generalized to all SBE35 units, as evidenced by the different results obtained by different authors [7,8,9] in different units.
Our conclusion was that, before employing an SBE35 at sea, it should not only be calibrated in terms of temperature at fixed points and by comparison in a water bath (as currently done), but should also calibrated in terms of pressure up to 60 MPa, in order to verify and correct for its eventual pressure effect.

Author Contributions

Investigation, R.B., J.v.G. and S.O.; Writing—original draft, A.P. All authors have read and agreed to the published version of the manuscript.

Funding

This project (MeteoMet2, project n. ENV58) received funding from the EU EMRP programme co-financed by the Participating States and the European Union.

Acknowledgments

The authors are very grateful to Carel Adolfse for designing and realizing the pressure enclosure used in the investigation of the pressure effect.

Conflicts of Interest

The authors declare no conflict of interest.

References

  1. Hansen, J.; Sato, M.; Kharecha, P.; von Schuckmann, K. Earth’s energy imbalance and implications. Atmos. Chem. Phys. 2011, 11, 13421–13449. [Google Scholar] [CrossRef] [Green Version]
  2. Van Schckmann, K.; Cheng, L.; Palmer, M.D.; Hansen, J.; Tassone, C.; Aich, V.; Adusumilli, S.; Beltrami, H.; Boyer, T.; Cuesta-Valero, F.J. Heat stored in the Earth system: Where does the energy go? Earth Syst. Sci. Data 2020, 12, 2013–2041. [Google Scholar] [CrossRef]
  3. Wunsch, C. Global Ocean Integrals and Means, with Trend Implications. Ann. Rev. Mar. Sci. 2016, 8, 1–33. [Google Scholar] [CrossRef] [PubMed] [Green Version]
  4. Budeus, G.; Schneider, W. In-situ temperature calibration: A remark on instruments and methods. In International WOCE Newsletter, No. 30; WOCE International Project Office: Southampton, UK, 1998; pp. 16–18. [Google Scholar]
  5. Uchida, H.; Ohyama, K.; Ozawa, S.; Fukasawa, M. In situ calibration of the SeaBird 9 plus CTD thermometer. J. Atmos. Ocean. Technol. 2007, 24, 1961–1967. [Google Scholar] [CrossRef]
  6. Uchida, H.; Nakano, T.; Tamba, J.; Widiatmo, J.V.; Yamazawa, K.; Ozawa, S.; Kawano, T. Deep ocean temperature measurement with an uncertainty of 0.7 mK. J. Atmos. Ocean. Technol. 2015, 32, 2199–2210. [Google Scholar] [CrossRef]
  7. Peruzzi, A.; Ober, S.; Bosma, R. Effect of Pressure on Deep-Ocean Thermometers. Int. J. Thermophys. 2017, 38, 163. [Google Scholar] [CrossRef]
  8. Joung, W.; Gam, K.; Pearce, J.V. Pressure Dependence of Reference Deep-Ocean Thermometers. Meteorol. Appl. 2020, 27, e1870. [Google Scholar] [CrossRef]
  9. Preston-Thomas, H. The International Temperature Scale of 1990(ITS-90). Metrologia 1990, 27, 3–10. [Google Scholar] [CrossRef]
  10. Bosma, R.; Peruzzi, A.; van Breugel, R.; Bruin-Barendregt, C. A Sub-Millikelvin Calibration Facility in the Range 0 °C to 30 °C. Int. J. Thermophys. 2017, 38, 37. [Google Scholar] [CrossRef]
Figure 1. Deep-ocean thermometers from Sea-Bird Scientific—(a) SBE3, needle length 56 mm and (b) SBE35, stem length 465 mm.
Jmse 09 00398 g001
Figure 2. 500 readings (one every 4 s) with SBE35 s/n 0019 at the TPW (solid line and left scale) and at the Ga (dashed line and right scale). The peak-to-peak noise is 0.3 mK and 1.1 mK and the standard deviation is 0.054 mK and 0.185 mK, at the TPW and at the Ga, respectively.
Jmse 09 00398 g002
Figure 3. Fixed-point recalibration of 4 different SBE35 units—s/n 0019 from NIOZ, s/n 0086 from LNE/CNAM, s/n 0015 from SHOM, and s/n 0081 from NIOZ. The circles corresponds to TPW calibrations and the squares corresponds to Ga calibrations. The bars represent the uncertainties in the fixed-point recalibration (0.186 mK for TPW and 0.464 mK for Ga, see Table 1).
Jmse 09 00398 g003
Figure 4. SBE3, SBE35 (not visible), and two reference SPRTs mounted in the brass comparator block of the sub-millikelvin calibration facility.
Jmse 09 00398 g004
Figure 5. Recalibration of SBE35 and SBE3 units in a water bath (WB)—(a) SBE35 s/n 0019 and SBE3 s/n 4812 and (b) SBE35 s/n 0015, SBE35 s/n 0081. For convenience, the average of the SBE-35 fixed-point (FP) calibrations (TPW and Ga) are also reported in full symbols (full circle for SBE35 s/n 0019, full square for SBE35 s/n 0015, and full triangle for SBE35 s/n 0081).
Jmse 09 00398 g005
Figure 6. Technical drawing (left) and CAD image of the realized pressure enclosure for the SBE35.
Jmse 09 00398 g006
Figure 7. Experimental set-up for the temperature–pressure calibration of SBE35 units.
Jmse 09 00398 g007
Figure 8. Time evolution of the SBE35 temperature reading (a) at and after pressurization from atmospheric pressure to 50 MPa and (b) at and after de-pressurization from 50 MPa to 30 MPa. The dotted blue line and the continuous red line corresponds to the same SBE35 temperature reading, showed on different temperature scales (left scale for the dotted blue line and right scale for the continuous red line), in order to show both the whole peak and the stabilization after the peak.
Jmse 09 00398 g008
Figure 9. Pressure drift (left scale) and consequent temperature drift (right scale) during measurements at the highest pressure (≈60 MPa).
Jmse 09 00398 g009
Figure 10. Temperature difference between the SBE35 reading and the reference thermometers as a function of the pressure.
Jmse 09 00398 g010
Figure 11. Temperature difference between the SBE35 reading, tSBE35, and the water bath reference temperature, t90, as a function of t90 for two SBE35 units (s/n 0015 and s/n 0081).
Jmse 09 00398 g011
Figure 12. SBE35 s/n 0081 at 0.1 MPa and at 60 MPa. The experimental points at 60 MPa had clearly shifted up with respect to the experimental points at 0.1 MPa.
Jmse 09 00398 g012
Figure 13. Sensitivity coefficient of the SBE35 s/n 0015 obtained with the Monte Carlo method with 8192 trials—best estimate a1 = 0.0045 mK∙MPa−1 and variance σ = 0.0008 mK∙MPa−1.
Jmse 09 00398 g013
Figure 14. Sensitivity coefficient of the SBE35 s/n 0081 obtained with the Monte Carlo method with 8192 trials—best estimate a1 = 0.0053 mK∙MPa−1 and variance σ = 0.0004 mK∙MPa−1.
Jmse 09 00398 g014
Table 1. Uncertainty budget for the recalibration of the four SBE35 units at the TPW and at the Ga.
Uncertainty ComponentUncertainty/mK
TPWGa
National Reference
Chemical impurities0.0200.079
Isotopic composition0.0020.000
Residual gas pressure in the cell0.0030.040
Stability0.0050.010
SBE35 Calibration
Stability of reading (standard deviation of 500 consecutive readings in 10 min)0.0540.185
Reproducibility for different days0.0720.085
Hydrostatic head correction0.0050.012
Thermal conditions0.0050.067
Combined standard uncertainty (k = 1)0.0930.232
Expanded uncertainty (k = 2)0.1860.464
Table 2. Uncertainty budget for the recalibration of the SBE35 and the SBE3, by comparison to reference SPRTs in the sub-millikelvin calibration facility.
Uncertainty ComponentUncertainty/mK
SBE35SBE3
Standard resistor0.1120.112
Resistance ratio bridge linearity0.0490.049
SPRT calibration0.1380.138
Time stability and spatial uniformity of temperature0.1530.183
ITS-90 non-uniqueness0.1620.162
Interpolation0.1910.236
Combined standard uncertainty (k = 1)0.3480.387
Expanded uncertainty (k = 2)0.6960.774
Publisher’s Note: MDPI stays neutral with regard to jurisdictional claims in published maps and institutional affiliations.

