Article

Environmental Effects on the Spatiotemporal Variability of Fish Larvae in the Western Guangdong Waters, China

1
South China Sea Fisheries Research Institute, Chinese Academy of Fishery Sciences, Guangzhou 510300, China
2
College of Chemistry and Environment, Guangdong Ocean University, Zhanjiang 524088, China
3
Department of Optoelectronic Engineering, Jinan University, Guangzhou 510632, China
4
Southern Marine Science and Engineering Guangdong Laboratory (Zhuhai), Zhuhai 519080, China
5
Guangdong Provincial Key Laboratory of Fishery Ecology and Environment, Guangzhou 510300, China
*
Author to whom correspondence should be addressed.
Yuting Feng and Lijun Yao contributed equally to this work.
J. Mar. Sci. Eng. 2021, 9(3), 316; https://doi.org/10.3390/jmse9030316
Submission received: 11 January 2021 / Revised: 6 March 2021 / Accepted: 9 March 2021 / Published: 13 March 2021
(This article belongs to the Special Issue Sustainable Marine Aquaculture and Fisheries)

Abstract

:
Spawning grounds occupy an important position in the survival and reproduction of aquatic life, which plays an important role in the replenishment of fishery resources, especially in the China coasts where fishery resources are depleting. This study investigated environmental effects on the spatiotemporal variability of fish larvae in the western Guangdong waters (WGWs), on the basis of generalized additive models (GAMs) and center of gravity (CoG). Satellite data including sea surface salinity (SSS), sea surface temperature (SST), and in situ observations for fish larvae from April to June in 2014–2015 were used. Results showed that 40.3% of the total variation in fish larvae density was explained. SST, SSS, and depth showed positive effects in 23–24 °C and 27–30 °C, 24–32 PSU, and 0–60 m, and showed negative effects in 24–27 °C, 32–34.2 PSU, 60–80 m. Based on the stepwise GAMs, the most important factor was month, with a contribution of 10.6%, followed by longitude, offshore distance, depth, and latitude, with contributions of 7.0%, 7.0%, 6.3%, 4.2%, 3.9%, and 1.3%, respectively. Fish larvae CoG shifted northward by 0.6° N and eastwards by 0.13° E from April to June. The distribution of fish larvae in the WGWs was affected by complex submarine topography in the Qiongzhou Strait, coastal upwelling in the WGWs, and runoff from the Pearl River.

1. Introduction

The western Guangdong waters (WGWs), extending from the west of Pearl River Estuary (PRE) to the northeast of Hainan Island, is rich in fish resources and critical to the spawning, feeding, breeding, and migration of many commercial fishes [1]. As an important place to the survival and reproduction of aquatic lives, the WGWs plays an important role in the replenishment of fish resources [2]. The early life history of fish is mainly divided into three stages: the embryonic stage, the larval stage, and the juvenile stage. The strength of this generation and the abundance of fish resources depend on the early replenishment quantity and survival rate [3,4]. The larval stage, which is the most vulnerable yet shortest period in the life history of fish, is a transitional period during which the larvae undergo prominent changes in morphology, physiology, and ecology. The survival and quantity of larvae are the basis for the replenishment of fish stocks and their sustainable utilization [5,6]. In the marine ecosystem, larvae are the major prey and important consumer of secondary productivity [7]. Research on larvae is essential and fundamental to the study of fish population dynamics and marine ecology. Studies have shown that there is a strong link between the natural and predatory mortality of larvae and the marine environment [8,9,10]. The successful recruitment of larvae require the sense acuity of temperate fish larvae and their behavioral response to the estuarine cues present in coastal areas [11], and it might control their dispersion in coastal areas according to their larval stage [12]. The relative numerical values of fish classes exhibit great fluctuations from year to year, and there are three prominent features that attract chief consideration: birth rate, age distribution, and migration [13].
The relationship between fish resources and marine environment is complex, characterized by nonlinearity and nonadditivity [14]. Moreover, the results differ greatly under different observation scales [15,16]. The generalized additive models (GAMs), which is an additive model proposed by Hastie et al. [17], can deal with the nonlinear relationship between dependent variables and multiple independent variables [18]. As it can be used to evaluate the influence and importance of spatiotemporal and environmental factors on fish resources, it is widely used in the relationship between fish resources and environmental factors [19,20]. In this study, we assumed that the spatiotemporal distribution of fish larvae in the WGWs was affected by local habitat (sea surface temperature (SST), sea surface salinity (SSS), depth, and distance). Based on satellite and in situ observations, the quantitative relationship between fish larvae and marine environments were analyzed. The specific aims of this work were to (1) characterize the spatiotemporal distribution characteristics of fish larvae in the WGWs and (2) determine the quantitative relationship between fish larvae and marine environments. These can enhance our understanding of the early replenishment mechanism and the habitat requirements of the fish population in the WGWs, and can provide a reference for the restoration and protection of the spawning grounds in the South China Sea.

2. Materials and Methods

2.1. Fish Larvae Data

The fish larvae data in the WGWs came from the survey of spawning grounds in 2014–2015 (April to June). The study area was located within 19.78°–21.73° N, 110.43°–112.73° E (Figure 1). Fish larvae were sampled by macroplankton nets with hauling speed 1.5 n mile/h and preserved in 5% formaldehyde solution. The fish larvae were identified by their morphological characteristics [21]. In this study, the number of survey data was 289. Major species of fish larvae identified were Sardinella aurita, Nemipterus virgatus, Anchoviella commersonii, Upeneus bensasi, and Carangidae (Table 1). The proportion of major larvae density to total density was 53.2%, 10.4%, 8.5%, 8.0%, and 6.0%, respectively. Fish larvae were grouped by 0.25° × 0.25° grid cells. The unit of fish larvae density was 10−3.ind m−3. The statistics covered fishing trips, survey hours, longitude, latitude, and fish larvae density. The collection and analysis of fish larvae were based on the specifications for oceanographic survey [22].

2.2. Environmental and Geographic Data

Satellite remote sensing data included sea surface temperature (SST), sea surface salinity (SSS), sea surface chlorophyll-a concentration (Chl-a), and digital elevation model (DEM) of the submarine topography. Among them, SST and Chl-a data were from MODIS Aqua satellite data products of NASA (https://ocancolor.gsfc.nasa.gov/ (accessed on 11 March 2021)), with a temporal resolution of eight days and a spatial resolution of four kilometers. SSS data came from the Global Ocean Physical Reanalysis Product data of the Copernicus Marine Environment Management Service (CMEMS; http://marine.copernicus.eu (accessed on 11 March 2021)), with a temporal resolution in months and a spatial resolution of 1/12° × 1/12°. The DEM data were from Google Earth elevation data, with the elevation in 18 levels and a spatial resolution of 8.85 m.
MATLAB software was used to extract the remote sensing data of SST, Chl-a, and SSS in the study area. The total number of SST, Chl-a, and SSS data was 289. Invalid values were discarded and the data were monthly averaged. The remote sensing data were interpolated by ordinary kriging using ArcGIS 10.3 software [23,24] to plot the remote sensing map. ArcGIS10.3 software was used to draw the bathymetry (elevation) and submarine topography slope map [25]. The total number of depth, slope, and distance data was 91.

2.3. GAMs Fitting Procedures

In this study, GAMs was used to analyze fish larvae density and selected factors. The general expression of GAMs was as follows [17]:
Y = α + j = 1 n f i ( x j ) + ε
where Y is the fish larvae density (10−3.ind m−3); x j , the explanatory variable, that is, the spatiotemporal and environmental factors of each station; α, the intercept that fits for the function; ε, the residual error; f i ( x j ) , a one-variable function of the independent variable, which is a spline smoothing function. In this study, the mgcv package in software R was used to construct and test the model [26,27]. To determine the expression form of GAM, the stepwise method was used to select variables that have significant influence on the model.

2.4. Model Test

The stepwise method of Akaike information criterion (AIC) was used to test the fitting degree of the model. The smaller the value, the better the fitting effect of the model [28]. Generalized cross-validation (GCV) was used to evaluate predictor variables of the model. The smaller the value, the better the modeling ability [29,30]. F-test and chi-square test were used to evaluate the significance of each factor and the nonlinear contribution of nonparametric effects [29]. The calculation of AIC follows [28]:
AIC = θ + 2 d f φ
where θ is the deviation; d f is the effective degree of freedom, controlling the smoothness of the curve [31]; and φ is the variance.

2.5. Center of Gravity of Fish Larvae Density

The center of gravity (CoG) method was used to analyze the spatiotemporal variability of fish larvae [32]. The formula for calculating the CoG of fish larvae density follows:
X = i = 1 K ( C i × X i ) / i = 1 K C i
Y = i = 1 K ( C i × Y i ) / i = 1 K C i
where X and Y are the longitude and latitude of the CoG; C i is the yield of the fishing area i; X i and Y i are the central longitude and latitude of the fishing area i; and K is the total number of fishing areas.

3. Results

3.1. GAMs Analysis

Variables that impose significant influence on the model were selected based on AIC value and significance (p-value) by the stepwise method [33]. F-test and chi-square test were used to evaluate the influence of predictor variables on the interpretation of the model [34]. According to variation inflation factor (VIF) analysis, impact factors (month, longitude, SSS, depth, latitude, distance, and SST) showed no strong collinearity (VIF < 10) [35] (Table 2). Therefore, the spatiotemporal and environmental variables selected by the model included month (Month), longitude (Lon), sea surface salinity (SSS), water depth (Depth), latitude (Lat), offshore distance (Distance) and sea surface temperature (SST). The expression of GAM obtained follows:
log ( Y + 1 ) = s ( Month ) + s ( Lon ) + s ( SSS ) + s ( Depth ) + s ( Lat ) + s ( Distance ) + s ( SST )
GAM was used to fit the cumulative explanatory bias of spatiotemporal and environmental factors on fish larvae density (Table 2). The cumulative explanatory bias of GAM on fish larvae density was 40.3% with an R2 of 0.343.
In GAMs, the contribution of selected factors represents the influence degree of each factor on fish larvae density (Table 3). Among them, Month was the most important factor affecting fish larvae density, with a contribution of 10.6%, followed by SSS, SST, Lon, Distance, and Depth, with contributions of 7.0%, 7.0%, 6.3%, 4.2%, and 3.9%, respectively; Lat had the least impact on fish larvae density, with a contribution of 1.3%. F-test showed that Month, Lon, SSS, Depth, SST, and Distance were significantly correlated with fish larvae density (p < 0.05), while Lat was insignificantly correlated with fish larvae density (p > 0.05). Chi-square test showed the nonparametric smoothing effect of predictive variables. According to chi-square test, Month, Lon, SSS, and SST had the best nonparametric smoothing effect, and the nonparametric smoothing effect of Distance and Lat was lower than that of other variables.
The contribution of time factor (Month) was the highest, which was 10.6% in GAMs (Table 4). From April to June, as the month increased, fish larvae density first increased and then decreased (Figure 2a). Fish larvae density increased gradually from April to May and reached a peak in May, and then decreased sharply from May to June.
The contribution of spatial factors (Lon, Lat, Depth, Distance) was 15.7%, of which the contribution of Lon is 6.3% in GAMs (Table 4). In the range of 110.5° to 112.0° E, fish larvae density remained at a high level. In the range of 112.0° to 113.75° E, fish larvae density decreased sharply with the increase of longitude (Figure 2b). The contribution of Lat was 1.3% in GAMs (Table 4). In the range of 19.8° to 21° N, fish larvae density remained at a high level, the confidence interval decreased and the confidence level increased. In the range of 21°–22° N, with the increase of latitude, fish larvae density decreased slowly, the confidence interval increased and the confidence level decreased (Figure 2e). The contribution of depth was 3.9% (Table 4). In the range of 40–70 m, fish larvae density decreased with the increase of depth. In the range of 0–40 m, fish larvae density was stable at a higher level, the confidence interval decreased and the confidence level increased (Figure 2d). The contribution of distance was 4.2% (Table 4). In the range of 0–30 km, fish larvae density increased with the increase of offshore distance, the confidence interval decreased and the confidence level increased. In the range of 30–60 km, fish larvae density decreased with the increase of offshore distance; the confidence interval increased and the confidence level decreased (Figure 2f).
Environmental factors (SST, SSS) contributed 14% of which SST contributed 7% in GAMs (Table 4). In the range of 23–24 °C and 27–30 °C, fish larvae density increased with the increase of SST. In the range of 24–26 °C and 30–32.5 °C, fish larvae density decreased with the increase of SST. As SST increased, the confidence interval increased and the confidence level decreased (Figure 2g). The contribution of SSS was 7% (Table 4). In the range of 24–32 PSU, fish larvae density increased with the increase of SSS, the confidence interval decreased and the confidence level increased; and in the range of 32–34 PSU, fish larvae density decreased with the increase of SSS, the confidence interval decreased and the confidence level increased (Figure 2c). The fish larvae were mainly distributed in the waters of 110.5–112.0° E and 19.8–21° N.

3.2. Relationship between Spatiotemporal Variability of Fish Larvae, SST, and SSS

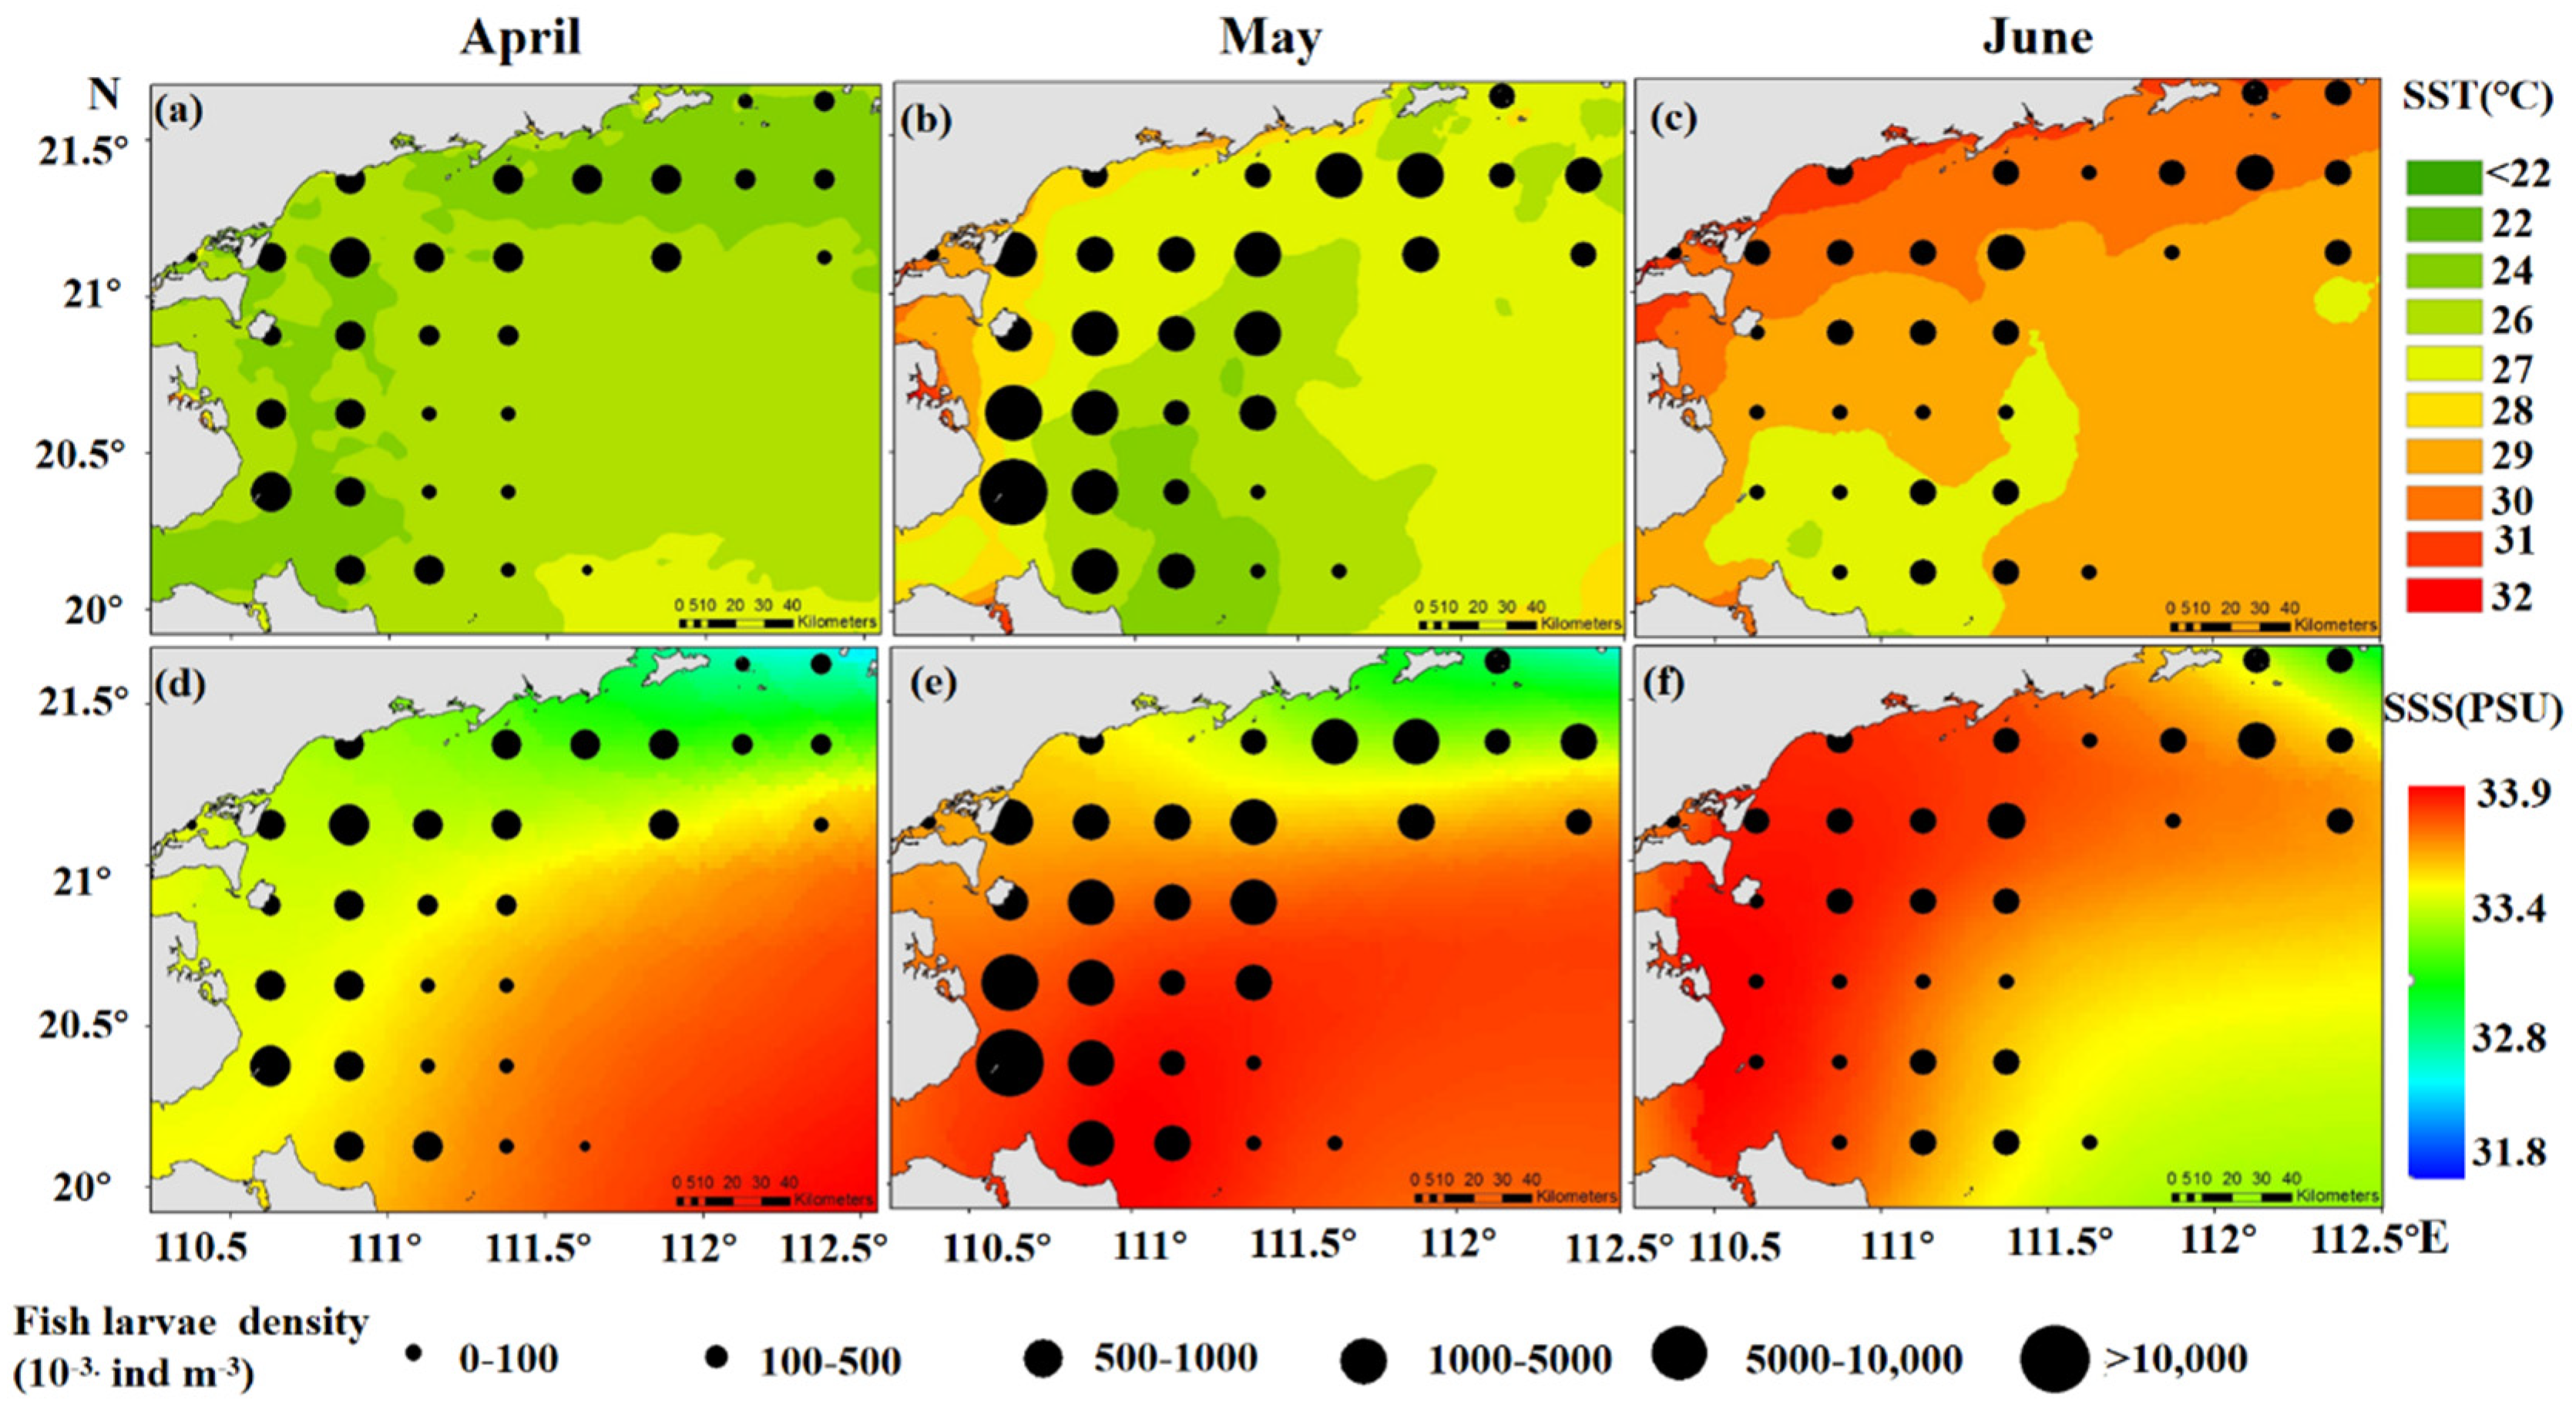
Spatiotemporal distribution of fish larvae and SST in the WGWs (Figure 3) showed that from April to June, with the increase of SST, fish larvae density first increased and then decreased, and the maximum density appeared in May. SST was 22–24 °C in April, 24–27 °C in May, and 27–30 °C in June. High fish larvae density was mainly distributed in the area with SST being 23–24 °C (Figure 3a) in April, in the sea area with SST being 26–27 °C (Figure 3b) in May, and in the area with SST being 28–30 °C (Figure 3c) in June. Fish larvae density in June was lower than that in April and May, and was mainly distributed in the sea area with SST higher than 28 °C (Figure 3c).
From April to June, SSS in the WGWs increased gradually, and waters with high SSS moved to the northwest (Figure 3d–f). High fish larvae density was concentrated in waters with SSS of 33.2–33.5 PSU (Figure 3d), in the area with SSS of 33.7–33.8 PSU (Figure 3e) in May, and in the area with SSS of 33.9–34.2 PSU (Figure 3f) in June.

3.3. Relationship between Spatiotemporal Variability of Fish Larvae, Depth and Slope

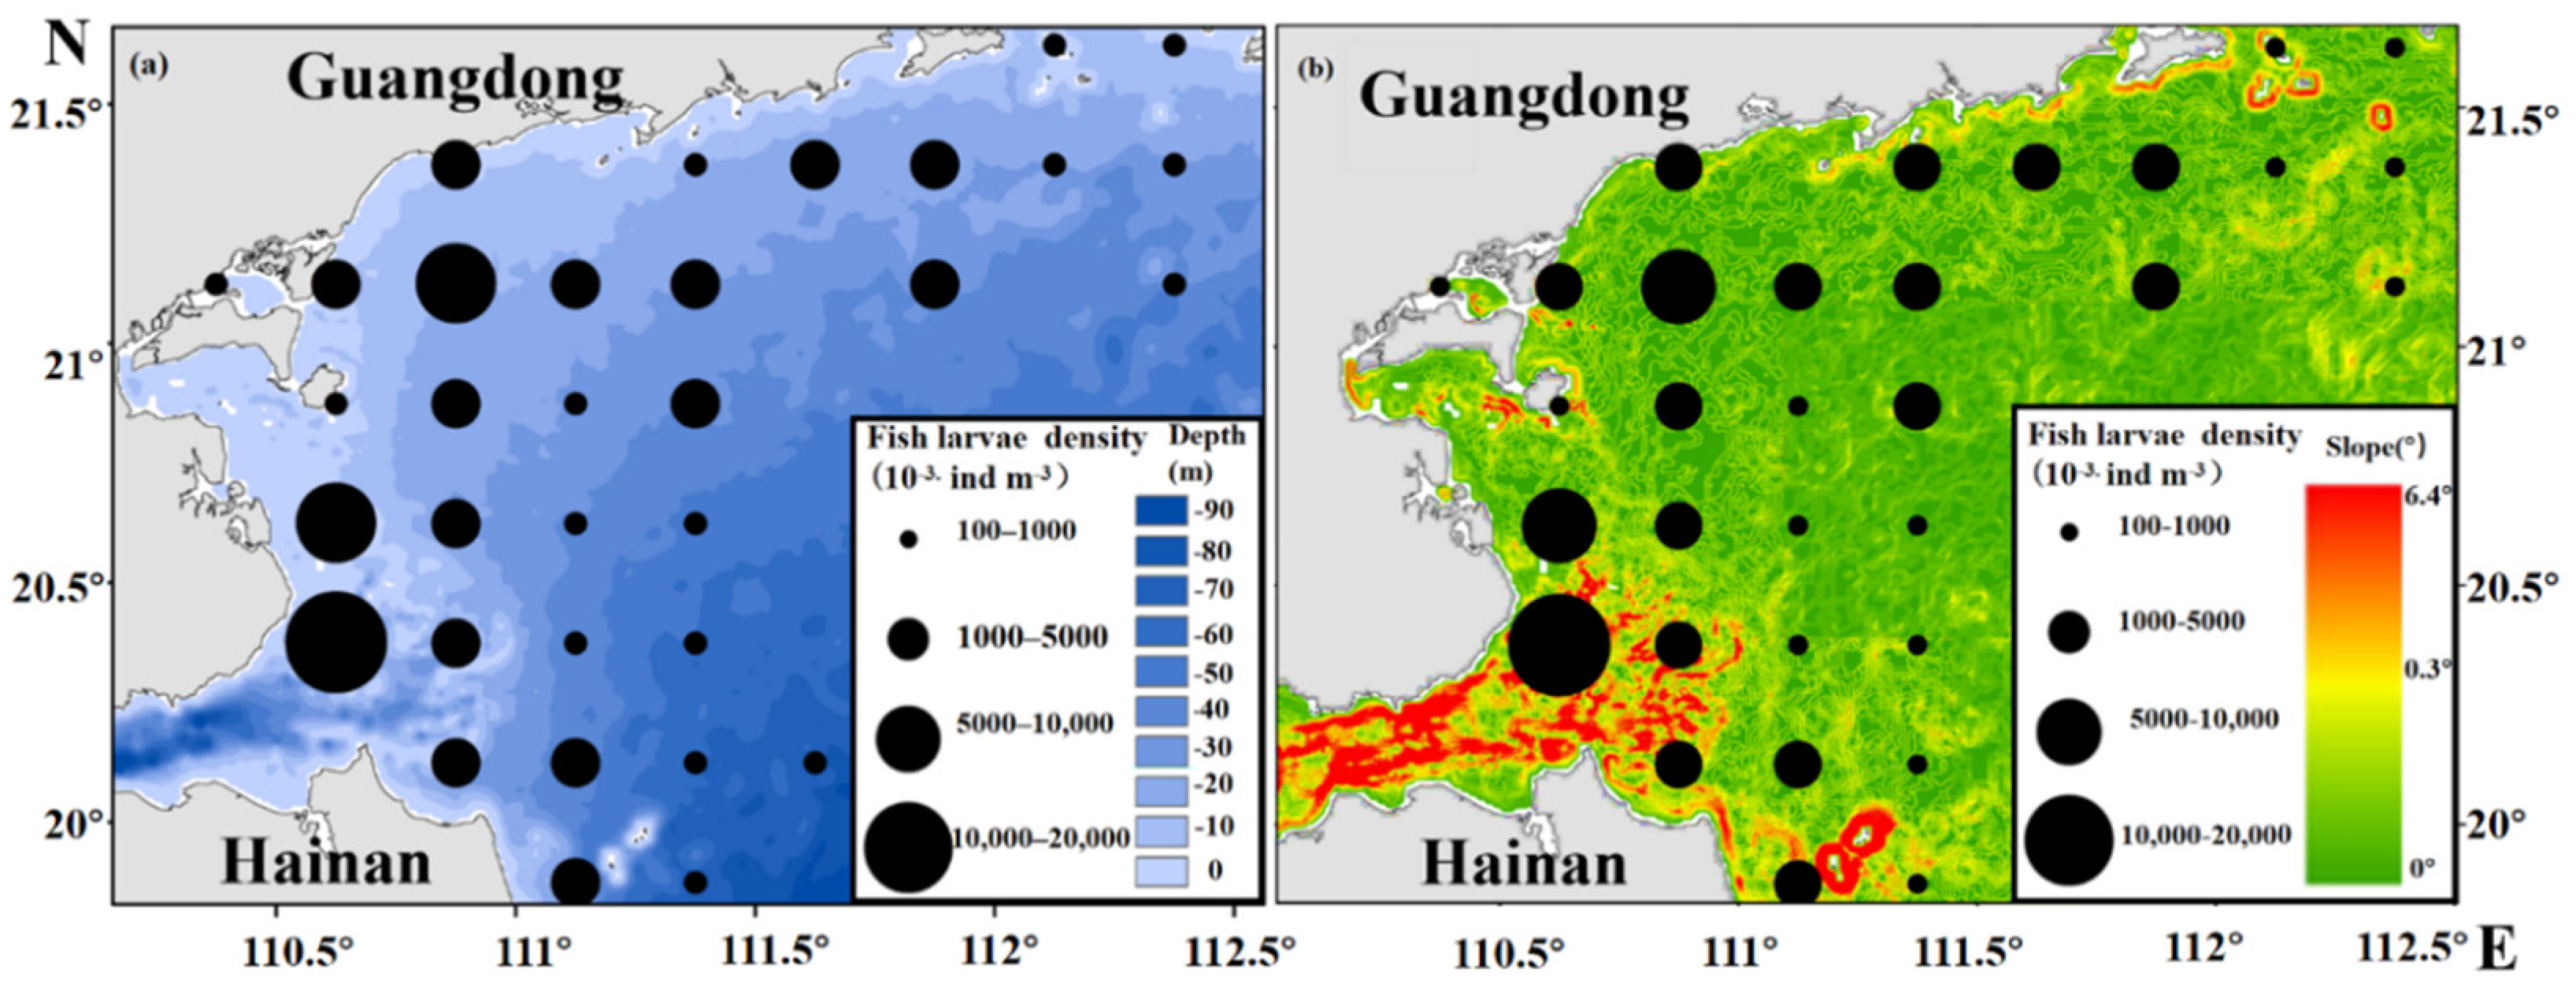
Spatiotemporal distribution of fish larvae density, water depth, and slope in the WGWs (Figure 4) showed that in general, fish larvae density in coastal waters was higher than that in offshore waters (Figure 4a). Fish larvae density was high in shallow waters (5–40 m) and low in deep waters (40–80 m, Figure 4a). It reached the peak at a depth of about 40 m (7462.73 10−3.ind m−3); (Figure 4a). Qiongzhou Strait and the area east of Hainan Island have large depth and slope (submarine topography slope > 1°), due to which fish larvae density in this area is generally higher than that in other areas (Figure 4b).

3.4. Spatiotemporal Variability of Center of Gravity (CoG) of Fish Larvae Density

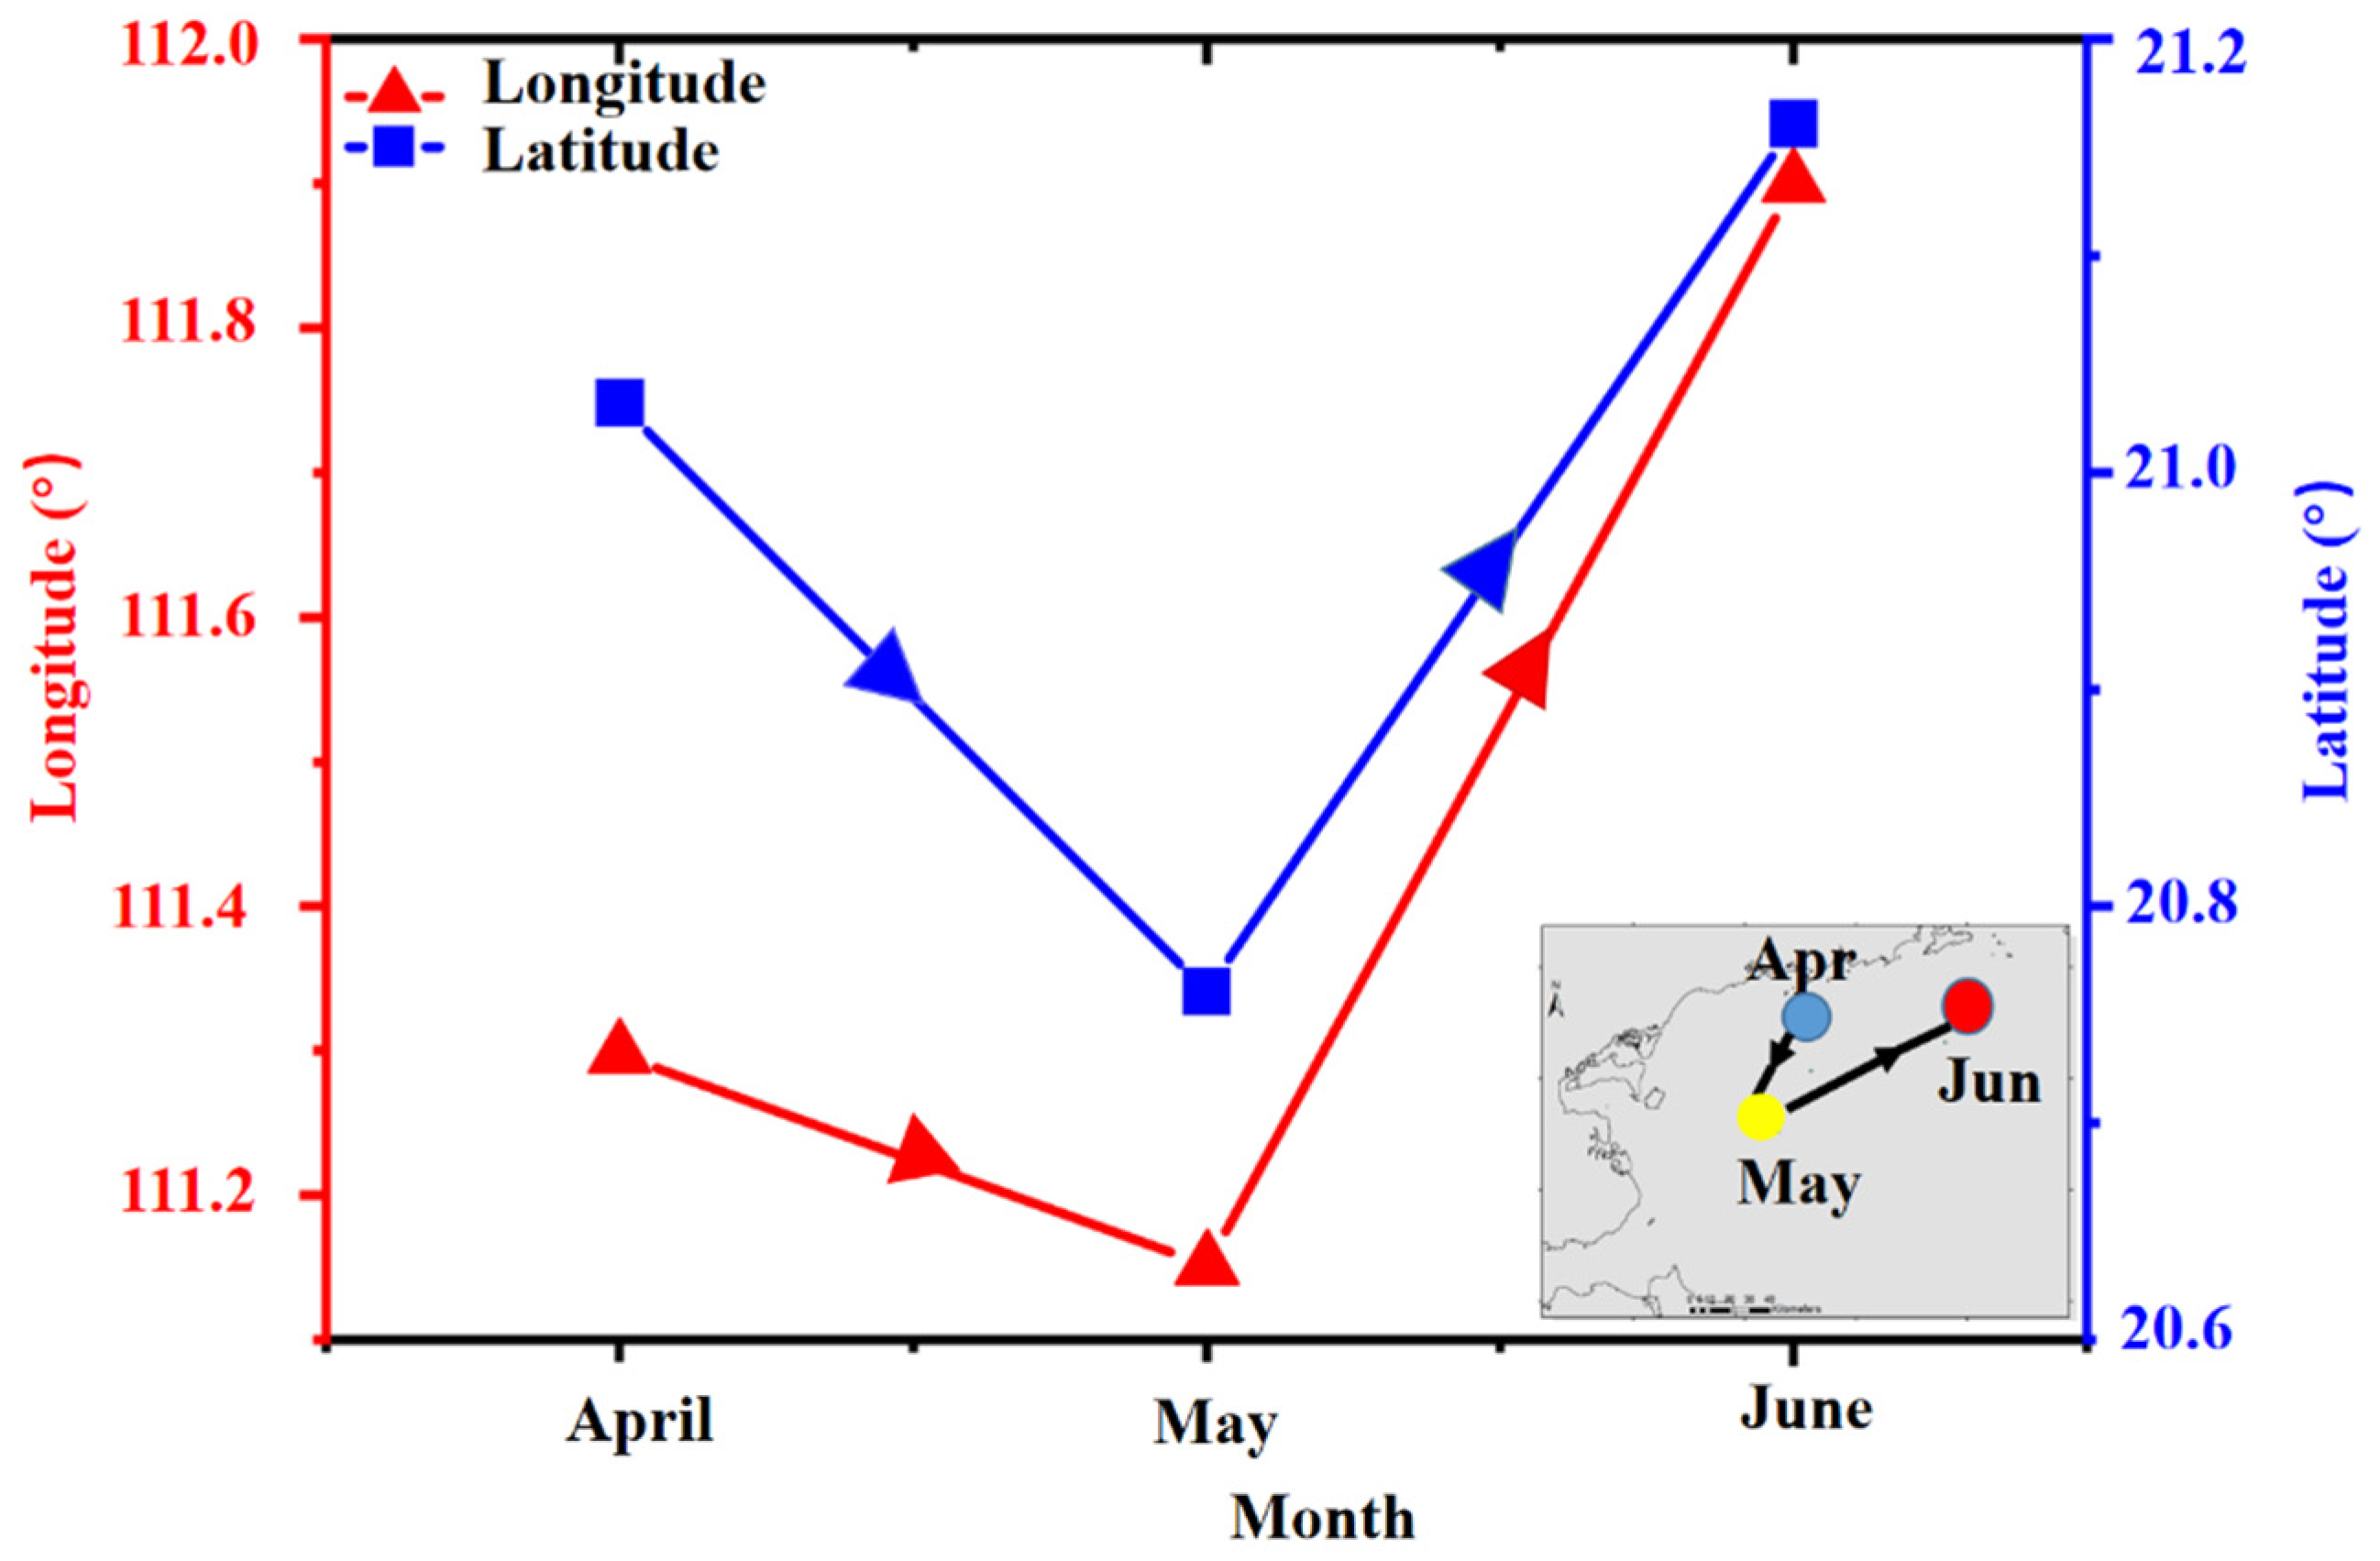
From April to June, the CoG of fish larvae density in the WGWs first moved to the southwest, then to the northeast (Figure 5). The CoG of fish larvae density was near the PRE (111.30° E, 21.03° N) in April, moved to the southwest (111.15° E, 20.76° N) in May, and to the eastern Guangdong waters (111.90° E, 21.16° N) in June. From April to May, the CoG of fish larvae density moved 0.15° N to the south and 0.27° E to the west. From May to June, the CoG of fish larvae density moved 0.75° N to the north and 0.4° E to the East.

4. Discussion

The habitat of fish larvae in the WGWs was connected with local marine ecosystem including SST, SSS, Chl-a, depth, slope, etc. In addition, macrogeographical attributes, seasonal upwelling, and runoff from the Pearl River influenced the habitat.

4.1. Effects of SST and SSS on Fish Larvae

GAM is an effective tool for analyzing the quantitative relationship between response variables and predictive factors, and can intuitively evaluate the effect and importance of habitat factors on organisms. In the WGWs, the spatiotemporal distribution of fish eggs was subject to coastal current, cyclonic circulation, and South China Sea warm current, and was related to salinity, water temperature, water depth, and other factors [36]. In the East China Sea, fish larvae were determined by water temperature, as the larvae mainly live in the warm side of the temperature front [37]. The distribution of Gadus macrocephalus larvae in the Yellow Sea was closely related to bottom water temperature, bottom sediment, and bottom salinity [38]. The present study showed that SST in GAM also played a great role on fish larvae density (with a contribution of 7%, Table 4). Major commercial fishes in the WGWs are Trichiurus haumela, Carangidae, and Nemipteras virgatus [39,40]. Among them, Trichiurus haumela had a relatively concentrated spawning ground in the WGWs, and its fish larvae were mainly distributed in the waters with SST being 25–28 °C [41]. In the WGWs, fish larvae were mainly distributed in the waters with SST being 22–32 °C, and the most suitable SST for fish larvae was 24–30 °C. There were two peaks at 24 °C and 30 °C, which might be attributed to the characteristics of the multispecies fishery in the WGWs [42]. Water temperature was one of the key factors affecting embryonic development and larval growth. Studies showed that temperature affected larva metabolism [43], movement [44], gene expression [45], and embryo survival rate and deformity rate [46], and further affected the growth, feeding, quantity, and distribution of larvae [47] The larvae density decreased gradually in June in the WGWs. On the one hand, the average water temperature in June was high (>28 °C), which lead to the mortality of some eggs that could not survive higher temperature [48], resulting in the decrease of larvae quantity. On the other hand, high water temperature in June was a stress factor for the growth of some larvae [47], as high water temperature accelerated their metabolism expenditure [49], and insufficient endogenous nutrition plus the poor ability to obtain exogenous nutrition seriously affected larvae growth and development, which caused the low survival rate of larva. In the East China Sea, the number of larvae in summer (June) was lower than that in spring, which was different from the results of this study. This might be related to the higher water temperature in the East China Sea. The water temperature in the WGWs in June (28–32 °C) was higher than that in the East China Sea (20.73–27.13 °C) [37]. A previous study showed that larvae density decreased when the temperature was too low or too high [50]. The larvae had their suitable temperature range. Due to their poor adaptability to the environment and stress response, irregular change of temperature would cause the death of larvae [51].
SSS explained 7% of the variation in fish larvae density (Table 4). Salinity was one of the important environmental factors affecting the larvae. A survey on the spawning grounds in the Yangtze Estuary [52,53] showed that salinity was an important factor deciding larvae distribution. It affected not only the distribution of larvae, but also their metamorphosis process [9,44]. If the salinity exceeded the tolerance range of larvae, the deformity rate of larvae would increase and the vitality of fry would decrease [54]. The fish larvae were mainly distributed in the waters with SSS being 31.5–34.5 PSU in the WGWs, and the most suitable salinity range for fish larvae was 33.0–33.8 PSU (Figure 2c). This may be due to the strong swimming ability and salt tolerance of fish larvae during the preflexion period. In addition, with the development of individuals and the improvement of organs, the salt tolerance of individuals will be stronger [55]. In the WGWs, the suitable salinity for the spawning ground of Trichiurus haumelais was 33.0–34.5 PSU [41], and the suitable salinity was 33.94–34.92 PSU for Nemipterus virgatus [56], which was consistent with this study. Previous study showed that when the salinity was too high, larvae density decreased sharply; when the salinity was low, larvae density tended to increase [57]. On the one hand, a low salinity level was in line with the osmotic pressure of body fluids of some fish, which was conducive to the growth and development of larvae, and as a result, the survival rate of larvae was high [58,59]. On the other hand, large quantities of fish larvae in the postflexion period appeared in the waters with lower salinity [60]. In contrast, a high salinity level would accelerate the metabolism velocity of larvae, which was unfavorable for the survival of larvae [61]. Salinity could affect the metamorphosis of larvae, also. When the salinity increased, the metamorphosis of larvae was accelerated, causing the reduction in larvae quantity. In addition, the salinity gradient also affected larvae density to a certain degree. Northeast of the WGWs, the salinity gradient was high due to dilution by the Pearl River. In this study, the salinity played a great role on fish larvae density (Table 4). On the contrary, in Laizhou Bay of Bohai Sea, the salinity gradient of the water body was low, because of which the salinity had little effect on larvae density [62].

4.2. Effects of Depth, Slope, and Offshore Distance on Fish Larvae

GAM analysis showed that depth explained 3.9% of the variation in fish larvae density (Table 4). In the WGWs, fish larvae density decreased with the increase of depth. Different fish required different spawning depth [63], and the depth affected the spatial distribution of spawning grounds [64]. The spawning grounds of Trichiurus haumela are mainly distributed in the waters with a depth of 40–100 m, especially 40–70 m [41]. In spring and summer, the catch of Carangidae was high in waters with a depth ≤60 m [65], while most Nemipterus virgatus inhabited at the sediment bottom of 60–80 m [54]. The deep-water Nemipterus virgatus in the northern shelf area of the South China Sea is located in the coastal area of Guangdong with a water depth of 60–150 m [66]. The fish larvae of Anchoviella commersonii were mainly distributed in the waters less than 20 m in the Yangtze River Estuary [67]. The fish larvae of Sardinella aurita were mainly distributed around 10 m near the Yangjiang Nuclear Plant [68]. Studies showed that the spawning grounds in the coastal waters of the North Sea are mainly distributed in the middle and shallow waters (<40 m) [64,69], which is similar to the distribution of fish larvae (≤40 m) in the WGWs (Figure 2d). This may be connected with shallow water and local topography, which are favorable for the existence of warm but chlorophyll-rich water, providing a favorable environment for the development of larvae [70]. In addition, changes in the fish behavior at different stages of early development also play an important role in influencing the abundance of fish larvae in the nearshore waters [71]. In the postflexion of fish larvae and juvenile stage, the fins are formed and the swimming ability of the fish larvae is gradually strengthened, and a surprising capacity for swimming endurance [72], which would lead to higher recruitment [73] Therefore, they could choose the habitat and gradually move to the shallow waters with abundant food [74]. Slope reflects the macrogeographical attribute of the habitat environment [75,76]. Qiongzhou Strait has a deep slope and large current velocity [77], because of which the fish larvae density is high in this area. On the one hand, the complex topography of Qiongzhou Strait reduced the velocity of flow, which is favorable for larvae to gather in the area [78]. On the other hand, the complex submarine topography provides an ideal environment for spawning [79]. The results showed that fish larvae density was the highest when the depth was less than 40 m and the slope is >0.3°, indicating that the fish population tended to spawn in shallow waters with a small slope.
The offshore distance explained 4.2% of the variation in fish larvae density (Table 4). In this study, survey stations were distributed 0–60 km offshore, and the fish larvae density first increased and then decreased with the increase of the offshore distance (Figure 2f). The larvae density in offshore waters was lower than that in coastal waters, partly because some fish in the WGWs migrated to the coastal area for breeding migration, forming spawning grounds in the coastal area [37].

4.3. Effects of Seasonal Upwelling on Fish Larvae

There is a local cyclonic circulation in the eastern waters of Leizhou Peninsula (20°20′–21°10′ N, 110°50′–112°00′ E) [80,81,82]. The cyclonic circulation exists all year, and is strong in summer and weak in winter. In summer, the bottom water rises and forms an upwelling (cold eddy). There is a Qiongdong upwelling in the shallow coastal waters in the west of the WGWs (18°30′–20°00′ N, 111°30′ E) at a depth of 30 m from the shore of Qiongdong [83]. The upwelling appears during April and September each year, and is the strongest from June to July [84]. High fish larvae density appeared in these two upwelling areas (Figure 3). The upwelling brought high nutrients to the surface, replenishing nutritive salts in the seawater near the spawning grounds. As larvae could move on a small scale, their apparent vertical movement day and night and active feeding behavior enabled them to stay in the area with food organisms [85]. In addition, the larvae moving along the current tended to gather in the waters near the eddy area [86]. Hence, they tended to gather where there was an upwelling. From April to May, the CoG of fish larvae density shifted to the southwest of the WGWs and showed a tendency for gathering in the upwelling area (Figure 5), which might be related to the southwestern Qiongdong upwelling. In June, the CoG of fish larvae density shifted to the northeast and the fish larvae density in the upwelling region decreased. This might be related with fish larvae drifting northeasterly with the west coast current of Guangdong Province, leading to the decrease of fish larvae density in the upwelling region in June [81].

5. Conclusions

This study analyzed for the first time the response of fish larvae to marine environments in the WGWs, using satellite and survey data. The most important factor affecting fish larvae density was the month, followed by SST, SSS, longitude, distance, depth, and latitude. The fish larvae in WGWs were mainly distributed in areas where SST is 24–30 °C, SSS is 33.2–34.2 PSU, and depth is 5–50 m. This was caused by the submarine topography, the current field in the WGWs, and the Pearl River runoff. In this study, only SST, SSS, Chl-a, and other environmental factors for which data could be obtained by satellite remote sensing were selected. In the follow-up study, climatic anomaly, catching intensity, and other parameters will be considered to improve the accuracy of the model and provide reference for more accurate prediction of spawning grounds.

Author Contributions

J.Y., L.Y., and Y.F. designed the study. Z.L. and L.Y. collected survey data. Y.F., L.Y., and H.Z. analyzed the data. H.Z. helped with data collection and analysis. J.Y. and Y.F. wrote the article. All authors have read and agreed to the published version of the manuscript.

Funding

This study was supported by the following funds: (1) National Key R&D Program of China (2018YFD0900901); (2) Natural Science Foundation of Guangdong Province, China (2018A030313120); (3) Guangdong Key Areas R&D Program Projects (2020B1111030002); (4) Central Public-interest Scientific Institution Basal Research Fund, CAFS, China (2018HY-ZD0104, 2020TD06, 2021SD02).

Institutional Review Board Statement

Not applicable.

Informed Consent Statement

Not applicable.

Data Availability Statement

Not applicable.

Conflicts of Interest

The authors declare no conflict of interest.

References

  1. Lin, H.J.; Xu, S.N.; Liu, Y.; Gong, Y.Y.; Li, C.H. Ecological characteristics of the phytoplankton community structure in the West Guangdong coastal area. Mar. Sci. 2016, 40, 73–82. [Google Scholar]
  2. Pan, Y.J. Fisheries Dictionary (Essence); Shanghai Lexicographical Press: Shanghai, China, 2007. [Google Scholar]
  3. Ellis, T.; Nash, R.D.M. Predation by sprat and herring on pelagic fish eggs in a plaice spawning area in the Irish Sea. J. Fish. Biol. 2010, 50, 1195–1202. [Google Scholar] [CrossRef]
  4. Hovenkamp, F. Growth-dependent mortality of larval plaice Pleuronectes platessa in the North Sea. Mar. Ecol. Prog. Ser. 1992, 82, 95–101. [Google Scholar] [CrossRef]
  5. Wan, R.J.; Sun, S. The category composition and abundance of ichthyoplankton in the ecosystem of the Yellow Sea and the East China Sea. Acta Zool. Sin. 2006, 52, 28–44. [Google Scholar] [CrossRef]
  6. Wan, R.J.; Jiang, Y.W. Studies on the Ecology of Eggs and Larvae of Osteichthyes in the Yellow Sea. Mar. Fish. Res. 1998, 19, 60–73. [Google Scholar]
  7. Zhang, R.Z. Fish Eggs and Larvae in the Coastal Waters of China; Shanghai Science and Technology Press: Shanghai, China, 1985. [Google Scholar]
  8. Houde, E.D.; Hoyt, R. Fish early life dynamics and recruitment variability. Trans. Am. Fish. Soc. 1987, 2, 17–29. [Google Scholar]
  9. Chambers, R.C.; Trippel, E.A. Early Life History and Recruitment in Fish Populations, The Netherlands; Springer: Berlin/Heidelberg, Germany, 1997; Volume 17, pp. 469–493. [Google Scholar] [CrossRef]
  10. Li, L.; Zhong, J.S.; Tang, J.H.; Wu, L.; Xu, C.L. Abundance and distribution of larvae and juveniles of Stolephorus chinensis in the coast of Jiangsu Province and its relationship with environmental factors. J. Shanghai Ocean Univ. 2009, 33–38. [Google Scholar]
  11. Teodósio, M.A.; Paris, C.B.; Wolanski, E.; Morais, P. Biophysical processes leading to the ingress of temperate fish larvae into estuarine nursery areas: A review. Estuar. Coast. Shelf Sci. 2016, 183, 187–202. [Google Scholar] [CrossRef] [Green Version]
  12. Baptista, V.; Morais, P.; Cruz, J.; Castanho, S.; Ribeiro, L.; Pousão-Ferreira, P.; Leitão, F.; Wolanski, E.; Teodósio, M.A. Swimming Abilities of Temperate Pelagic Fish Larvae Prove that They May Control Their Dispersion in Coastal Areas. Diversity 2019, 11, 185. [Google Scholar] [CrossRef] [Green Version]
  13. Hjort, J. Fluctuations in the great fisheries of northern Europe viewed in the light of biological research. Rapp. P.-V. Reun. Cons. Int. Explor. Mer. 1914, 20, 1–227. [Google Scholar]
  14. Fauchald, P.; Erikstad, K.E.; Skarsfjord, H. Scale-dependent predator-prey Interactions: The Hierarchical spatial distribution of seabirds and prey. Ecology 2000, 81, 773. [Google Scholar] [CrossRef]
  15. Stenseth, N.C.; Mysterud, A.; Ottersen, G.; Hurrell, J.W.; Chan, K.S.; Lima, M. Ecological effects of climate fluctuations. Science 2002, 297, 1292–1296. [Google Scholar] [CrossRef] [Green Version]
  16. Dingsor, G.E.; Ciannelli, L.; Chan, K.; Ottersen, G.; Stenseth, N.C. Density dependence and density independence during the early life stages of four marine fish stocks. Ecology 2007, 88, 625–634. [Google Scholar] [CrossRef] [PubMed]
  17. Hastie, T.; Tibshirani, R. Generalized Additive Models; Chapman and Hall: London, UK, 1990; pp. 587–602. [Google Scholar]
  18. Guisan, A.; Edwards, T.C.; Hastie, T. Generalized linear and generalized additive models in studies of species distributions: Setting the scene. Ecol. Model. 2002, 157, 89–100. [Google Scholar] [CrossRef] [Green Version]
  19. Yu, J.; Hu, Q.; Tang, D.; Chen, P. Environmental effects on the spatiotemporal variability of purpleback flying squid in Xisha-Zhongsha waters, South China Sea. Mar. Ecol. Prog. 2019, 623, 25–37. [Google Scholar] [CrossRef]
  20. Wang, Y.F.; Yu, J.; Chen, P.M.; Yu, J.; Liu, Z.N. Relationship between spatial-temporal distribution of light falling-net fishing ground and marine environments. J. Trop. Oceanogr. 2019, 38, 68–76. [Google Scholar] [CrossRef]
  21. Wan, R.J.; Jiang, Y.W. The species and biological characteristics of the eggs and larvae of Osteichthyes in the Bohai Sea and Yellow Sea. J. Shanghai Fish. Univ. 2000, 9, 290–297. [Google Scholar]
  22. State Oceanic Administration. Marine Survey Code; Standards Press of China: Beijing, China, 1977. [Google Scholar]
  23. Yu, J.; Hu, Q.W.; Yuan, H.R.; Chen, P.M. Effect assessment of summer fishing moratorium in Daya Bay based on remote sensing data. South China Fish. Sci. 2018, 14, 1–9. [Google Scholar] [CrossRef]
  24. Wang, Y.F.; Hu, Q.W.; Yu, J.; Chen, P.M.; Shu, L. Effect assessment of fishery resources proliferation in Zhelin Bay marine ranching in eastern Guangdong. South China Fish. Sci. 2019, 15, 12–19. [Google Scholar] [CrossRef]
  25. Tang, G.A.; Liu, X.J.; Lv, G.N. Principle and Method of Digital Elevation Model and Geoscience Analysis; Science Press: Beijing, China, 2005. [Google Scholar]
  26. Wood, S.N. Fast stable restricted maximum likelihood and marginal likelihood estimation of semiparametric generalized linear models. J. R. Stat. Soc. Ser. B (Stat. Methodol.) 2011, 73, 3–36. [Google Scholar] [CrossRef] [Green Version]
  27. Wood, S.N. Stable and efficient multiple smoothing parameter estimation for generalized additive models. J. Am. Stat. Assoc. 2004, 99, 673–686. [Google Scholar] [CrossRef] [Green Version]
  28. Venables, W.N.; Dichmont, C.M. GLMs, GAMs and GLMMs: An overview of theory for applications in fisheries research. Fish. Res. 2004, 70, 319–337. [Google Scholar] [CrossRef]
  29. Stone, C.J. Additive Regression and Other Nonparametric Models. Ann. Stat. 1985, 13, 689–705. [Google Scholar] [CrossRef]
  30. Shchetinnikov, A.S. Feeding spectrum of squid Sthenoteuthis oualaniensis (Oegopsida) in the eastern Pacific. J. Mar. Biol. Assoc. UK 1992, 72, 849–860. [Google Scholar] [CrossRef]
  31. Wood, S.N. Generalized Additive Models. An Introduction with R; CRC Press: Boca Raton, FL, USA, 2006. [Google Scholar]
  32. Chen, X.J.; Qian, W.G.; Xu, L.X.; Tian, S.Q. Comparision among annual positions of fishing grounds for Ommastrephe bartrami from 150°E to 165°E in the North Pacific. J. Zhanjiang Ocean. Univ. 2003, 23, 26–32. [Google Scholar] [CrossRef]
  33. Shih, C.L.; Chen, Y.H.; Hsu, C.C. Modeling the Effect of environmental factors on the ricker stock-recruitment relationship for North Pacific Albacore using generalized additive models. Atmos. Ocean. Sci. 2014, 25, 581–590. [Google Scholar] [CrossRef] [Green Version]
  34. Mangel, M.; Quinn, T.J.; Deriso, R.B. Quantitative fish dynamics. Q. Rev. Biol. 1999, 2, 286–287. [Google Scholar]
  35. Liu, J.; Wang, Y.Y.; Guo, B.H.; Zhang, X.H. Construction and validation of flavor model of fermented milk during storage. Food Sci. 2011, 32, 296–300. [Google Scholar]
  36. Lu, Y.; Yu, J.; Lin, Z.; Chen, P. Environmental Influence on the Spatiotemporal Variability of Spawning Grounds in the Western Guangdong Waters, South China Sea. J. Mar. Sci. Eng. 2020, 8, 607. [Google Scholar] [CrossRef]
  37. Wan, R.J.; Zeng, D.Y.; Bian, X.D.; Ni, X.B. Species composition and abundance distribution pattern of ichthyoplankton and their relationship with environmental factors in the East China Sea ecosystem. J. Fish. China 2014, 38, 1375–1398. [Google Scholar] [CrossRef]
  38. Zhang, R.Y.; Bian, X.D.; Shan, X.J.; Jin, X.S.; Guan, L.S. Distribution of the age 0 group Pacific cod (Gadus macrocephalus) in the Yellow Sea and its relationship with environmental factors. J. Fish. China 2018, 42, 870–880. [Google Scholar]
  39. Chen, G.B.; Li, Y.Z.; Zhao, X.Y.; Chen, Y.Z.; Jin, X.S. Acoustic assessment of commercial fish resources in the northern waters of South China Sea. J. Fish. Sci. China 2005, 4, 445–451. [Google Scholar] [CrossRef]
  40. Zhang, P.; Chen, Z.Z.; Chen, G.B.; Zhang, K.; Xu, Y.W.; Sun, M.S. Biomass and distribution of carangoid fish resources in the offshore South China Sea. South China Fish. Sci. 2016, 12, 38–48. [Google Scholar] [CrossRef]
  41. Lin, J.Q. Study on the natural regulative adaptibilty of the Hairtail (Trichiurus Haumela) in the oceanic environment. Trans. Oceanol. Limnol. 1981, 1, 58–63. [Google Scholar]
  42. Loots, C.; Vaz, S.; Koubbi, P.; Planque, B.; Coppin, F.; Verin, Y. Inter-annual variability of North Sea plaice spawning habitat. J. Sea Res. 2010, 64, 427–435. [Google Scholar] [CrossRef] [Green Version]
  43. Shi, Z.H.; Xie, M.M.; Peng, S.M.; Zhang, C.J.; Gao, Q.X. Effects of temperature stress on activities of digestive enzymes and serum biochemical indices of Pampus argenteus juveniles. Prog. Fish. Sci. 2016, 37, 30–37. [Google Scholar] [CrossRef]
  44. Fu, C.; Cao, Z.; Fu, S. The influence of temperature and starvation on sesting metabolic rate and spontaneous activity in Juvenile Cyprinus carpio. Chin. Chin. J. Zool. 2012, 47, 85–90. [Google Scholar] [CrossRef]
  45. Anzhi, S.; Huiming, J.U.; Guiyang, L.I.; Jie, L.I.; Zhaolan, M.O. Expression patterns of hsp90 of Paralichthys olivaceus in response to temperature treatment and Vibrio anguillarum-infection. Prog. Fish. Sci. 2016, 37, 1–8. [Google Scholar] [CrossRef]
  46. Chai, X.J.; Sun, M.; Xu, Y.J. Effects of temperature and salinity on embryonic development of Nibea japonica. South China Fish. Sci. 2011, 7, 43–49. [Google Scholar] [CrossRef]
  47. Chen, X.Q.; Ruan, C.X.; Yuan, C.G. Effects of different temperature and food on growth and survival rates of the larvae of Trichogaster trichopterus. J. Fujian Fish. 2008, 2, 9–12. [Google Scholar] [CrossRef]
  48. Targońska, K.; Arski, D.; Kupren, K.; Palińska-Arska, K.; Mamcarz, A.; Kujawa, R.; Skrzypczak, A.; Furga A-Selezniow, G.Y.; Czarkowski, T.K.; Haku, B.A.; et al. Influence of temperature during four following spawning seasons on the spawning effectiveness of common bream, Abramis brama (L.) under natural and controlled conditions. J. Therm. Biol. 2014, 39, 17–23. [Google Scholar] [CrossRef]
  49. Yuan, L.Q.; Xie, X.J.; Cao, Z.D.; Luo, Y.P. Effects of temperature on embryonic development of the darkbarbel catfish Pelteobagrus vachelli. Acta Zool. Sin. 2005, 51, 753–757. [Google Scholar] [CrossRef]
  50. Li, X.Z.; Chang, Y.L.; Kang, Q.J.; Liu, X.C.; Qiao, Z.G. Effects of different temperatures on growth of Glyptosternum maculatum larvae and juveniles. Chin. J. Fish. 2011, 32, 96–99. [Google Scholar] [CrossRef]
  51. Hou, Y.B.; Xiao, G.H.; Zhang, L.K. Effects of temperature and density on the survival rate of juvenile Brachymystax lenok. Hebei Fish. 2016, 3, 6–7. [Google Scholar] [CrossRef]
  52. Jiang, M.; Shen, X.Q.; Chen, L.F. Relationship between with abundance distribution of fish eggs, larvae and environmental factors in the Changjiang Estuary and vicinity waters in spring. Mar. Environ. Sci. 2006, 25, 37–39. [Google Scholar]
  53. Song, C.; Liu, Y.Y.; Lv, Y.; Zhao, F.; Yang, G.; Zhang, T.T.; Zhuang, P. Distribution of Salanx ariakensis Larvae in the Yangtze Estuary and its relationship with environment factors. Mar. Fish. 2015, 37, 318–324. [Google Scholar]
  54. Qu, H.T.; Li, X.X.; He, Q.; Li, H.Z. Effects of temperature and salinity on hatching rates and larval survival of Epinephelus lanceol. Hebei Fish. 2009, 8, 6–9. [Google Scholar] [CrossRef]
  55. Song, C.; Wang, Y.T.; Liu, Z.L.; Zhang, H.; Lin, Y.; Jiang, Y.Z.; Li, S.F.; Lin, N. Relationship between environmental factors and distribution of Scomberomorus niphonius eggs, larvae, and juveniles in Xiangshan Bay. J. Fish. Sci. China 2016, 23, 1197–1204. [Google Scholar]
  56. Zhang, R.Z. On the eggs and larvae of the golden-thread Nemipterus Virgatus (Houttuyn). Acta Zool. Sin. 1980, 2, 39–42. [Google Scholar] [CrossRef]
  57. Holliday, T.F.G. 4 The effect of salinity on the eggs and larvae of teleosts. Fish Physiol. 1969, 1, 293–311. [Google Scholar] [CrossRef]
  58. Wang, H.S. Effects of salinity on egg development and growth, larval and juvenile survival rate of Pagrosomus major. J. Fish. Sci. China 2002, 9, 33–38. [Google Scholar] [CrossRef]
  59. Li, B.; Zhong, Y.B.; Lyu, W.Q. Salinity tolerance of Pseudosciaena crocea during early development. J. Shanghai Ocean Univ. 2012, 21, 204–211. [Google Scholar] [CrossRef]
  60. Wang, H.S. Effects of salinity on growth survival rate and albinism rate of the larvae and juveniles of Paralichthys Olivaceus. Ocean. Limnol. Sin. 1997, 28, 399–405. [Google Scholar]
  61. Wang, H.T. Effects of environmental conditions on fertilized eggs and early larva of marine fishes. Mar. Sci. 1998, 22, 50–52. [Google Scholar] [CrossRef]
  62. Yang, Y.Y.; Gao, Y.J.; Wang, J.P.; Xu, B.Q.; Sun, C.X. Community structure of ichthyoplankton and its relationship with environmental factors in Laizhou Bay. Chin. J. Zool. 2018, 37, 2976–2984. [Google Scholar] [CrossRef]
  63. Moir, H.J.; Soulsby, C.; Youngson, A.F. Hydraulic and sedimentary characteristics of habitat utilized by Atlantic salmon for spawning in the Girnock Burn, Scotland. Fish. Manag. Ecol. 2010, 5, 241–254. [Google Scholar] [CrossRef]
  64. Lelievre, S.; Vaz, S.; Martin, C.S.; Loots, C. Delineating recurrent fish spawning habitats in the North Sea. J. Sea Res. 2014, 91, 1–14. [Google Scholar] [CrossRef] [Green Version]
  65. Chen, G.B.; Li, Y.Z. Distribution of the Carangidae fishes in the continental shelf waters of northern South China Sea. J. Shanghai Fish. Univ. 2003, 2, 146–151. [Google Scholar] [CrossRef]
  66. Chen, G.B.; Li, Y.Z.; Chen, P.M. Spawning ground of Nemipterus bathybius in northern continental shelf waters of South China Sea. J. Zhanjiang Ocean Univ. 2002, 22, 20–25. [Google Scholar]
  67. Li, J.S.; Lin, N.; Ling, J.Z. Temporal variation in the composition and abundance of fish larvae and juveniles off the Yangtze River Estuary in spring and summer. J. Fish. Sci. China 2018, 25, 123–131. [Google Scholar] [CrossRef]
  68. Zhang, J.B.; Huang, Z.Y. An investigation on fish eggs and larvae in sea area around planning Yangjiang Nuclear Plant. J. Trop. Oceanogr. 2003, 22, 78–84. [Google Scholar]
  69. Gibson, R.N. Flatfishes: Biology and Exploitation. Flatfishes Bio. 2015, 9. [Google Scholar] [CrossRef]
  70. Teodósio, M.A.; Garrido, S.; Peters, J.; Leitão, F.; Ré, P.; Peliz, A.; Santos, A.M.P. Assessing the impact of environmental forcing on the condition of anchovy larvae in the Cadiz Gulf using nucleic acid and fatty acid-derived indices. Estuar. Coast. Shelf Sci. 2017, 185, 94–106. [Google Scholar] [CrossRef]
  71. Wolanski, E.; Kingsford, M.J. Oceanographic and behavioural assumptions in models of the fate of coral and coral reef fish larvae. J. R. Soc. Interface 2014, 11, 20140209. [Google Scholar] [CrossRef] [PubMed] [Green Version]
  72. Tzeng, W.N.; Wang, Y.T. Hydrography and distribution dynamics of larval and juvenile fishes in the coastal waters of the Tanshui River estuary, Taiwan, with reference to estuarine larval transport. Mar. Biol. 1993, 116, 205–217. [Google Scholar] [CrossRef]
  73. Clark, D.L.; Leis, J.M.; Hay, A.C.; Trnski, T. Swimming ontogeny of larvae of four temperate marine fishes. Mar. Ecol. Prog. Ser. 2005, 292, 287–300. [Google Scholar] [CrossRef]
  74. Kingsford, M.J.; Leis, J.M.; Shanks, A.; Lindeman, K.C.; Pineda, J. Sensory environments, larval abilities and local self-recruitment. Bull. Mar. Sci. 2002, 70, 309–340. [Google Scholar]
  75. Liu, X.J.; Gong, J.Y.; Zhou, Q.M.; Tang, G.A. A study of accuracy and algorithms for calculating slope and aspect based on grid digital elevation model(DEM). Acta Geod. Cartogr. Sin. 2004, 3, 258–263. [Google Scholar] [CrossRef]
  76. Jinming, W.; Huanchao, Y.; Jian, S. Habitat environmental characteristics of Brachymysax lenok tsinlingensis. Acta Hydrobiol. Sin. 2017, 41, 214–219. [Google Scholar] [CrossRef]
  77. Zheng, S.X. Numerical Simulation of Tide and Tidal Currents in the Qiongzhou Strait Based on FVCOM; Ocean University of China: Qingdao, China, 2016. [Google Scholar]
  78. Chen, D.S.; Chen, B.; Yan, J.H.; Xu, H.F. The Seasonal variation characteristics of residual currents in the Qiongzhou Strait. Trans. Oceanol. Limnol. 2006, 2, 12–17. [Google Scholar] [CrossRef]
  79. Li, Z.G. Distribution if Main Species of Stow Net in the South. Yellow Sea based on GAM and Preliminary Study of Characteristics of Ichthyoplankton Assemblages in Haizhou Bay; Ocean University of China: Qingdao, China, 2013. [Google Scholar]
  80. Guan, B.X.; Yuan, Y.C. Overview of studies on some eddies in the China seas and their adjacent seas. Acta Oceanol. Sin. 2006, 28, 1–16. [Google Scholar] [CrossRef]
  81. Yang, S.Y.; Bao, X.W.; Chen, C.S.; Chen, F. Analysis on characteristics and mechanism of current system in west coast of Guangdong Province in the summer. Acta Oceanol. Sin. 2003, 6, 1–8. [Google Scholar] [CrossRef]
  82. Huang, Q.Z.; Li, Y.X. General situations of the current and eddy in the South China Sea. Adv. Earth Sci. 1992, 5, 1–9. [Google Scholar]
  83. Xu, J.D.; Cai, S.Z.; Xuan, L.L.; Qiu, Y.; Zhu, D.Y. Study on coastal upwelling in eastern Hainan Island and western Guangdong in summer, 2006. Acta Oceanol. Sin. 2013, 35, 11–18. [Google Scholar] [CrossRef]
  84. Deng, S.; Zhong, H.L.; Wang, M.W.; Yun, F.J. On relation between upwelling off Qionghai and fishery. J. Oceanogr. Taiwan Strait 1995, 1, 51–56. [Google Scholar]
  85. Gronkjaer, P.; Clemmesen, C.; John, M.S. Nutritional condition and vertical distribution of Baltic cod larvae. J. Fish Biol. 1997, 51, 352–369. [Google Scholar] [CrossRef]
  86. Fang, R.S.; Zheng, Y.J. A study on the eddy off Diaoyu Island and its relationship to the fishing ground of filefish (Navodon Septentrionalis Gunther). J. Fish. China 1986, 10, 161–176. [Google Scholar]
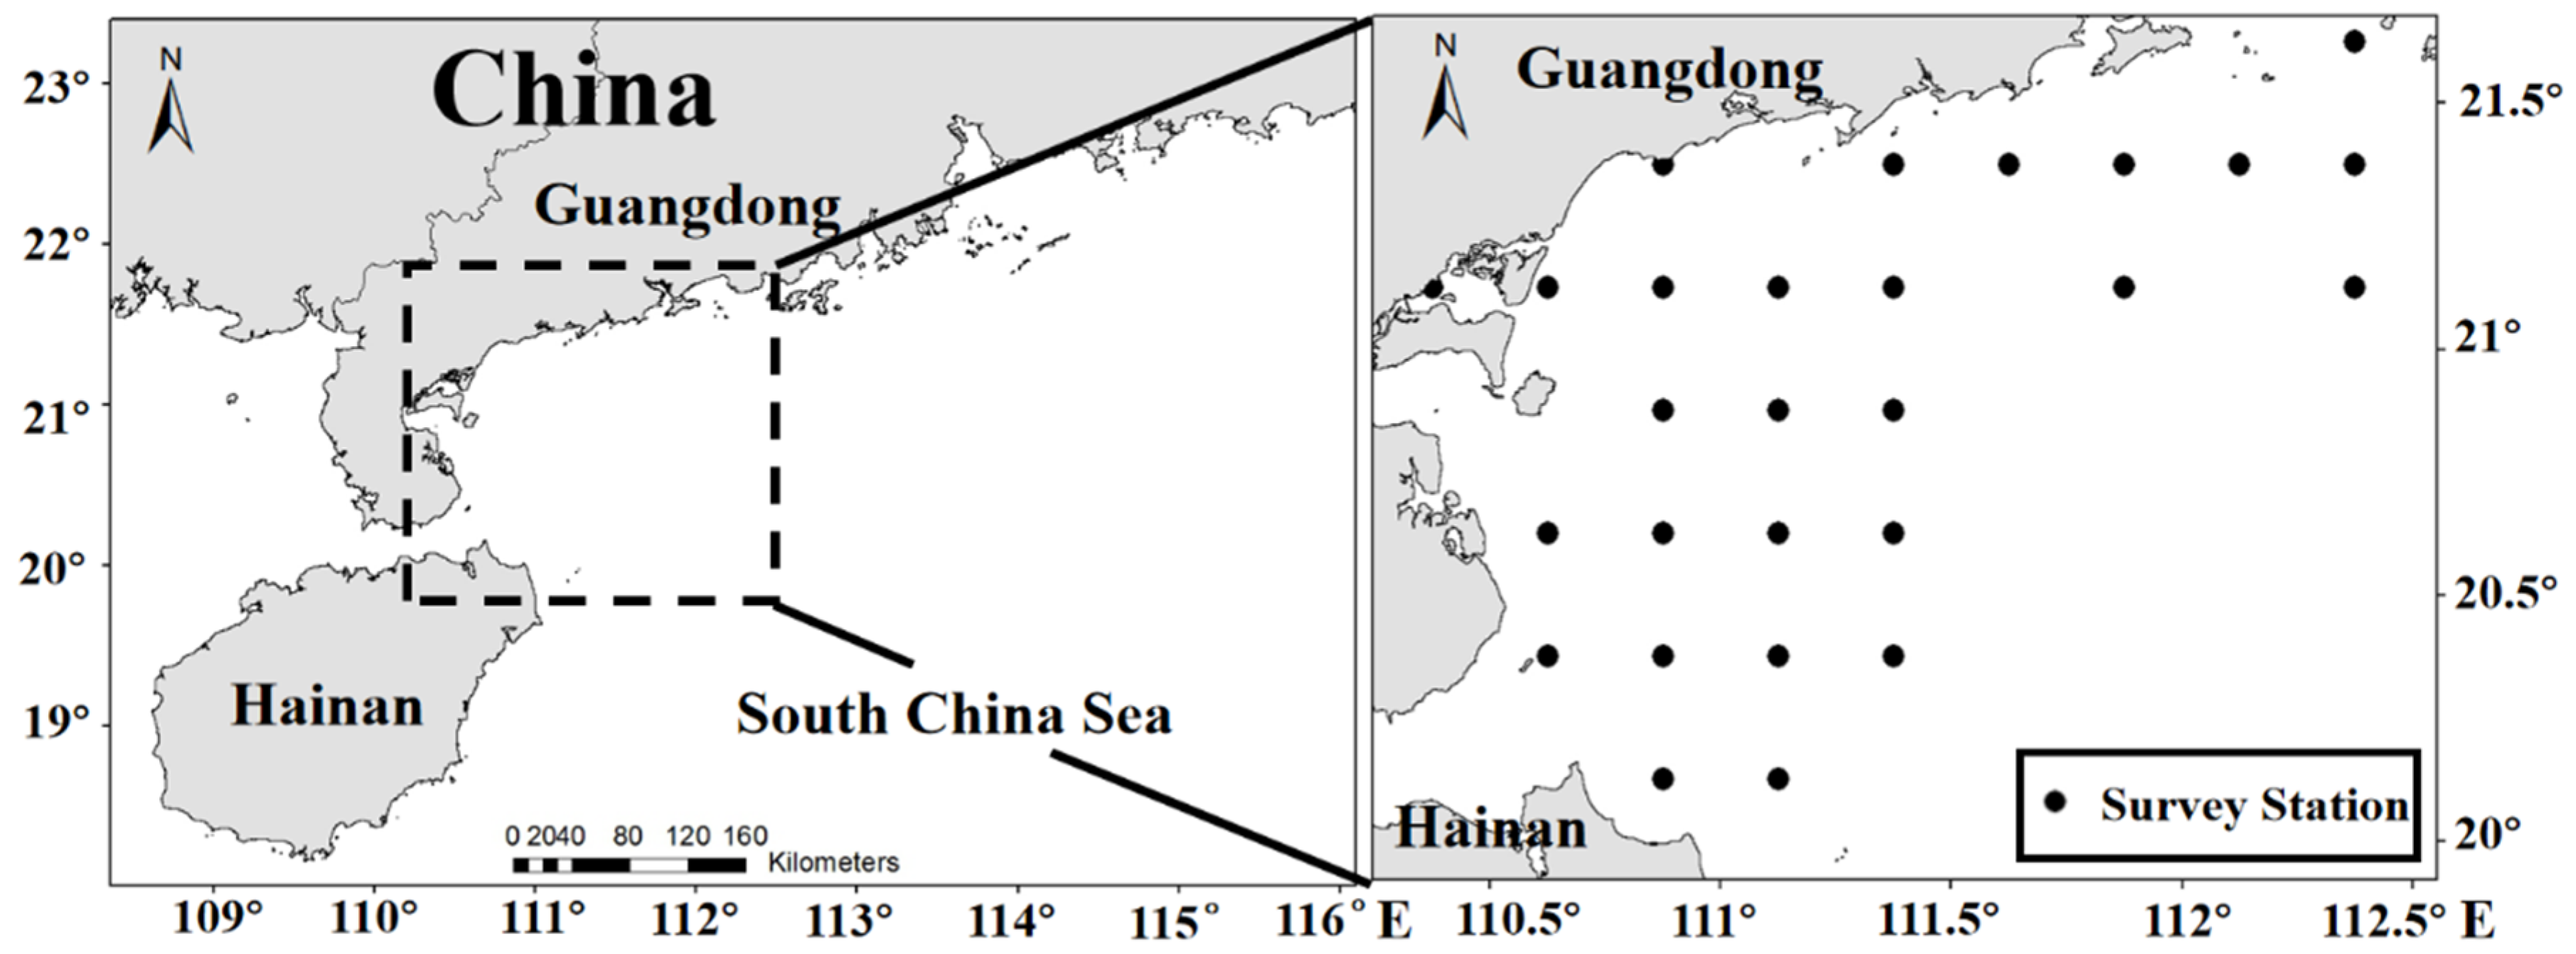
Figure 1. Research area and survey stations. Dotted box shows the extraction range of satellite data.
Jmse 09 00316 g001
Figure 2. GAMs analysis on the impact of spatiotemporal and environmental fac tors on fish larvae density: (a) month, (b) longitude, (c) sea surface salinity, (d) water depth, (e) latitude, (f) offshore distance, (g) sea surface temperature. Shaded area shows the 95% confidence interval. Dotted line on the x-axis indicates the density of data point
Jmse 09 00316 g002
Figure 3. Relationship between spatiotemporal variability of fish larvae, SST, and SSS: (a) fish larvae density and SST in April, (b) fish larvae density and SST in May, (c) fish larvae density and SST in June, (d) fish larvae density and SSS in April, (e) fish larvae density and SSS in May, (f) fish larvae density and SSS in June.
Jmse 09 00316 g003
Figure 4. Relationship between the fish larvae density and spatial factors in the western Guangdong waters (WGWs): (a) distribution of fish larvae density and depth, (b) distribution of fish larvae density and slope.
Jmse 09 00316 g004
Figure 5. Variation of center of gravity (CoG) of fish larvae density in the WGWs.
Jmse 09 00316 g005
Table 1. Major catch species and their proportion.
Species/FamiliesSurvey MonthProportion
Sardinella auritaApr/May/Jun53.2%
Nemipterus virgatusApr/May/Jun10.4%
Anchoviella commersoniiApr/May/Jun8.5%
Upeneus bensasiApr/May/Jun8.0%
CarangidaeApr/May/Jun6.0%
Table 2. Variation inflation factor (VIF) analysis.
FactorsVIF
Month7.611
SSS3.092
SST7.664
Lon2.996
Distance1.449
Depth2.579
Lat4.379
Table 3. Deviance analysis for the general additive models (GAMs) fitted to the fish larvae density.
Model FactorsResidual DevianceAdjusted R2AICGCVDeviance Explained (%)
Log(Y + 1) = NULL1701.120.001336.435.930.0
Log(Y + 1) = s(Month)1521.020.101307.995.3710.6
Log(Y + 1) = s(Month) + s(Lon)1414.340.161290.705.0616.9
Log(Y + 1) = s(Month) + s(Lon) + s(SSS)1294.960.221271.014.7323.9
Log(Y + 1) = s(Month) + s(Lon) + s(SSS) + s(Depth)1227.560.251260.754.5727.8
Log(Y + 1) = s(Month) + s(Lon) + s(SSS) + s(Depth) + s(Lat)1206.330.261260.384.5628.9
Log(Y + 1) = s(Month) + s(Lon) + s(SSS) + s(Depth) + s(Lat) + s(Distance)1135.030.291258.244.5533.3
Log(Y + 1) = s(Month) + s(Lon) + s(SSS) + s(Depth) + s(Lat) + s(Distance) + s(SST)1016.410.341239.844.2840.3
Akaike information criterion (AIC) was applied to check the fitting degree of the model. The smaller the value, the better the model fit. Generalized cross-validation (GCV) was used to assess predictor variables of the model. The smaller the value, the better the generalization ability.
Table 4. Contributions of the selected variables in GAMs.
Variablesd.f.Contribution (%)Pr(F)Pr(chisq)
Month1.5710.61.116 × 10−7 ***4.401 × 10⁻⁸ ***
SSS2.887.01.654 × 10−5 ***9.811 × 10⁻⁶ ***
SST6.147.00.0001469 ***8.203 × 10⁻⁵ ***
Lon1.956.33.16 × 10−5 ***2.148 × 10⁻⁵ ***
Distance2.954.20.0325 *0.02894 *
Depth2.643.90.001677 **0.001399 **
Lat2.641.30.20940.2122
***, p < 0.001; **, p < 0.01; *, p < 0.05. SSS, sea surface salinity; SST, sea surface temperature; Lon, Longitude; Lat, Latitude; d.f., degrees of freedom; Pr(F), p-value from an ANOVA F-ratio test; Pr(chisq), a type of score test to evaluate the nonlinear contribution of nonparametric effects.
Publisher’s Note: MDPI stays neutral with regard to jurisdictional claims in published maps and institutional affiliations.