Article

A Detailed Identification of Classificatory Variables in Ship Accidents: A Spanish Case Study

1
Department of Navigation Science and Marine Engineering, University of A Coruña, Paseo de Ronda, 51, 15011 A Coruña, Spain
2
Department of Mechanical Engineering, Catholic University of Ávila, C/Canteros, s/n, 05005 Avila, Spain
*
Author to whom correspondence should be addressed.
J. Mar. Sci. Eng. 2021, 9(2), 192; https://doi.org/10.3390/jmse9020192
Submission received: 26 January 2021 / Revised: 7 February 2021 / Accepted: 9 February 2021 / Published: 12 February 2021
(This article belongs to the Section Ocean Engineering)

Abstract

:
The present paper shows an original study of more than 163 ship accidents in Spain showing which of the usually employed variables are related to each type of vessel accident due to the lack of information in this region. To this end, research was carried out based on the Spanish Commission for Investigation of Maritime Accidents and Incidents (CIAIM) reports. Detailed combinatory ANOVA analysis and Bayesian networks results showed a good agreement with studies of other regions but with some particularities per each type of accident analyzed. In particular, ship length was defined as the more relevant variable at the time to differentiate types of accidents. At the same time, both the year of build and the fact that the ship meets the minimum crew members required were excellent variables to model ship accidents. Despite this, the particularities of the Spanish Search and Rescue (SAR) region were defined at the time to identify accidents. In this sense, although variables like visibility and sea conditions were employed in different previous studies as variables related to accidents occurrences, they were the worst variables to define accidents for this region. Finally, different models to relate variables were obtained being the base of deterministic dynamic analysis. Furthermore, to improve the accuracy of the developed work some indications were obtained; revision of CIAIM accidents scales, identification of redundant variables, and the need for an agreement at the time to define the classification limits of each identification variable.

1. Introduction

The traditional approach to studying or analyzing maritime safety is generally reactive rather than proactive. Hence, the importance of historic technical studies to try to foresee risk situations. Knowing which situations involve greater risk will in turn mean anticipating a possible accident. An accident theory is a collection of propositions to illustrate the principles that lead to accidents and an accident model is a simplified description of a system or process to help present the occurrence of accidents based on an accident theory [1]. According to Perrow [2], a normal accident is an intrinsic characteristic of any system. Given the characteristics of a system, multiple and unexpected interactions causing failures are inevitable. In this sense, the interactive complexity and the close characteristic coupling of the system inevitably produces an accident called “Normal Accident” or “System Accident”. These accidents are the ones that must be accepted as an acceptable risk.
According to a study of Allianz, shipping in the 21st century is now safer than ever [3], probably due to a combination of factors both at technical level (technological advances), regulatory environment (international and national regulations), and fundamentally, to the influence of human factor (preparation and training). In this sense, it is in standard O-134: International Association of Marine Aids to Navigation and Lighthouse Authorities (IALA) Recommendation on the Risk Management Tool for Ports and Restricted Waterways (2009) [4], where it addresses the IALA Waterway Risk Assessment Program (IWRAP) and Ports and Waterway Safety Assessment (PAWSA) tools.
The aim is to make available to the Member States aid for the measurement (quantitative and qualitative) of risk. The IWRAP MK2 tool, which IALA makes available to member states, calculate risk, based on the theory of Fujii and MacDuf (1974) [5,6] and presents results based on the possibility of an accident (although only collisions and groundings). Other researchers like Hollnagel and Goteman [7], proposed the Functional Resonance Accident Model, FRAM in its English nomenclature (for Functional Resonance Accident Model). The idea suggests that accidents occur due to functional resonance within a system.
To reach this so complex objective a revision of the evolution of accidents analysis is needed. In this sense, previous research works [8,9] indicated that around 75 to 96% of maritime accidents are caused, at least in part, by some type of human error. Specifying that this human error contributes to between 89% and 96% of collisions, 75% of explosions, 79% of landings, and 75% of collisions. What is more, 56% of the approaches are caused by non-compliance or violation of Convention on the International Regulations for Preventing Collisions at Sea, COLREGs [10,11].
Despite the previous indications, no single model has the capability of being useful to satisfy all demands of the maritime industry at any moment. To solve this problem, different research works were done in the last decades. In this sense, in 2007, Ibn Awal et al. [12], proposed a dynamic model for maritime accident focused on ship-to-ship collision, using two models of simulations, pre and post-accident, with the goal being to increase the maritime transport safety. Although it can be considered one of the accidents that has the worst consequences in the maritime world (for own ships, crewmembers, cargo, and the environment), the model does not include aspects so relevant as the waves or wind forces. This fact can give us an idea of the difficulty of proposing a model that can satisfy the huge number of variables that can be present in maritime transport.
In 2005, Liu et al. [13] analyzed more than 100 marine incidents in order to improve the navigation safety system (frequencies and causes) of a specific area through the Gray Clustering Method (Gray system Theory). In this research work, it highlights the need of models that can be useful for areas where the maritime accidents/incidents database is incomplete or poor due to the unpredictability of maritime accidents, a fundamental characteristic of this Theory. Furthermore, a reliable database is not always available everywhere due to the opacity that the maritime industry sometimes presents when an accident happens. In consequence, it is shown how the knowledge of frequency and causes of maritime accidents can be very useful for shipping lines, underwriters and, in general, stakeholders in the maritime industry.
Once the main data are collected, they must be analyzed, and the probabilistic method is one of the most used in the maritime industry, in addition to simulation modelling and statistical analysis of data [11]. In this sense, in 2009, Ulusçu, et al. [14] developed a paradigmatic case such as the navigation risks in the Strait of Istanbul. In this study, the authors implement a safety risk analysis with a model based on probabilistic data. In the mathematical model proposed, factors that define situations and affecting the probability of accident are grouped in vessel attributes (type, length, age, flag, tugboat, and pilot assistance), and environmental attributes. Attributes also influence consequences; in this case, vessel attributes (type and length) and shore attributes (populations, property, and infrastructure).
After slicing the Strait in several legs and collecting local information from different sources, the risk is calculated in two-tier accident types, related to a set of instigators that may cause an accident (human error, steering, propulsion, communication, navigation, mechanical, or electrical failure). As a weak point, in part of a study, authors resort to the opinion of two experts (for comparative purposes) due to the lack of a solid database, which can help to clarify the final result. As an example, the plotting of the normal probability of residuals and residuals vs. predicted variable of pair is shown, focused mainly on the human error and its influence in the collision.
At the same time, at the time to define the variables related to accidents in vessels, it is of interest to center this study on fishing vessels due to the high number of accidents. In particular, recent review works based on journal articles and reports from the maritime authorities in Poland, United Kingdom, Norway, Iceland, Denmark, United States and Alaska, and Canada [15] showed that these fishing vessels are still 50% higher at risk than on-shore workers, which is particularly high with respect to other types of vessels.
In addition, most of the previous works about fishing vessel accidents were centered on just one main variable, for instance, human factor [16,17,18,19]. Despite this, other variables were indicated as the main causes of fishing vessel accidents other than human error [19,20], e.g., weather conditions, operational status of the vessel, vessel location, seasons, and unsuitable fishing equipment [21,22,23]. In particular, a statistical study of accidents in fishing vessels in the northeastern United States emphasized that the probabilities of accidents in fishing vessels increase with wind speed and with placement near the shore and in the winter season [24]. In this same year, more research studies showed Marine Accident Investigation Branch (MAIB) as the better data source regarding fishing vessels accidents despite a certain tendency of under-reporting [19]. In this work, a conclusion was obtained that confirms the previous comments; the risk of accidents on fishing vessels increases as vessel length decreases. What is more, a more recent study about fishing vessel accidents in the northeastern of the United States [25] showed that the damage severity of accidents, defined in accordance with the Damage equation obtained by [26], increases with loss of stability, sinking, daytime wind speed, vessel age, and distance to shore, in agreement with previous studies. At the same time, it was obtained that the damage severity of accidents on fishing vessels increases as vessel length decreases (inversely proportional).
At the time, to identify the variables related to accidents, different research works about the analysis of the variance (ANOVA) were done. In particular, a statistical analysis centered on questionnaires and posterior ANOVA and correlations analysis was done by [16]. Its main results showed that there were clearly differentiated groups of age, vessel types, and occupation, among others. At the same time, in this work, there were assumptions of regression analysis such as linearity, normality, and multicollinearity, which were tested and found satisfactory. In consequence, it was possible to define the coefficient of the relation between related variables. From this relation it was concluded that the safety attitude is a fundamental parameter that depends on the previous experiences like people that sought medical attention (less positive attitude) and fishermen involved in accidents (positive attitude).
Once the main variables of these accidents were identified, there was a need to predict these accidents. In this sense, Mullai and Pulasson [27] developed a conceptual model based on the principles of Grounded Theory and content analysis of empirical data, in order to explain and predict maritime accidents. For that purpose, a database containing the marine accidents classified by ship and variable was used. Most of the variables were non-metric and were grouped into 11 main categories (constructs). The design of variables was based on the European Statistics guidelines, the International Maritime Organization (IMO) investigations code, and the DAMA coding system (agreed in 1990 by the Scandinavian countries for the analysis of maritime accidents). In total, 87 variables were taken into account for designing the model, reduced to 11 “sets” or “constructs”, grouped as per their common properties. Therefore, the model carried out consisted of a multilevel model of 87 variables in complex relationships and permits one to obtain the correlations among a large number of independent variables as ship’s age, length, Gross Register Tonnage (GRT), and the number of persons on board.
Another paper related to human factors is based on the human factors index system of ship accidents to develop a multidimensional association rules algorithm by incorporating the Reason model and classic correlation rules algorithm [28]. Other works are centered on human factor as the main cause of most serious maritime accidents [29]. Authors use the model Human Factor Analysis and Classification System (HFACS) based on the Swiss Cheese model of human error, which had been developed to provide a methodological tool to investigating an accident in the aviation industry. The modification of this model had been implemented by the same authors to maritime accidents some years before, and for this paper, more than 150 real cases were handled. The model consists of two interrelated causal sequences: An active failure pathway and a latent failure pathway. Once coded, the causal factors are presented and divided (organizational influences, unsafe supervision, preconditions for unsafe acts and unsafe acts). Afterwards, the first-, second-, and third-tier results are depicted.
More recent works try to address the human factor and statistical procedure together to quantify the correlation path mode of the causal factor involved in marine accidents, making use of complex structural chains supported by HFACS together with the statistical method Structural Equation Modelling (SEM), used to quantitatively analyse the relationships among human factors in accidents [30]. The paper is focused on the human factor because authors consider that in the shipping industry, despite having achieved a high level of safety from the point of view of equipment, human behavior still remains the cause of many maritime accidents. In the research, a Swiss Cheese model is also produced, and a novel method to analyze causal factors in the accidents is introduced with the help of SEM, due to the difficulty of doing the basic premises of path analysis (relationship among variables).
The measurement equation of SEM describes the relationship between the observed dependent variable and the latent independent variable. Structure equations describe the relationship between the latent variable. For the study, a database of 894 accident with the presence of human error as the cause was taken. Depending on the consequences, five levels were selected: Incidents, minor accidents, general accidents, major accidents, and serious accidents. The data were integrated into 16 major accident factors and path diagrams were carried out to check the accuracy and reliability of the model (relationships of observation or indicator variables).
Other studies are not centered on the human factor and develop their predictive procedures like a risk probabilistic model [31] in order to evaluate the probability of a ship-grounding accident taking into account the causal factors. The database contained more than 200 accident and incident reports, although using only a single accident report for modelling has its own disadvantages. As in other papers, the grounding model was developed used the Human Factor Analysis and Classification System for Grounding (HFACS-Ground). In the model construction, in order to set up a qualitative causal model, the Bayesian Belief Network (BBN) modelling was used. The model can quantify the probability of grounding given a set of input parameters.
Finally, in recent works [32], this same methodology of a chi square method and Bayesian networks were employed to be a help to estimate the occurrence of accidents when the main variables of the problem change.
In the present work, based on these previous research works and the need for in-depth study of these parameters, a real case study has been conducted analyzing more than 163 accidents in the Spanish Search and Rescue (SAR) sea regions in the time frame between 2008 and 2017. For this purpose, the official reports published by the Spanish Commission for Investigation of Maritime Accidents and Incidents (CIAIM) were taken into account [33]. In particular, a procedure similar to previous research activities was employed but employing a more detailed analysis, replacing the VCH square method by the Analysis of Variance for each type of accident. This procedure will help to identify the more appropriate variable that allows us to identify the more probable type of accident in the particular sea region of the Spanish Search and Rescue (SAR). This initial study will be the base case to predict the occurrence of accidents when the main variables of the problem change based on future Bayesian networks studies.
2. Materials and Methods

2.1. CIAIM Accidents Analysis

The Spanish Commission for the Investigation of Maritime Accidents and Incidents, CIAIM [33] performs investigations into maritime accidents and incidents in Spanish waters, including inland waters, the territorial sea, and any area outside the territorial sea upon which, in accordance with international law and on application of its domestic legislation, the Kingdom of Spain exercises jurisdiction or sovereign rights. In particular, in this study, the Spanish SAR territory has been selected. That is, the waters where the Spanish State holds responsibility in terms of search and rescue missions. At the same time, the selected period (2008–2017) was in accordance with the need to circumscribe our analysis to a stable regulatory framework, essential for the coherence of the comparative conclusions. In consequence, more than 163 accidents were analyzed in this case study.
Based on both these reports and previous research works [16,31,32,33], the different typical variables usually employed in those reports and associated with some types of accidents were classified. In this sense, the variables selected for this study, per accident were: Type of Ship, Year of construction, Wind direction, Wind force, Sea condition, Night or day accident, Visibility, Ship Breadth, Ship Length, GT, Crewmembers, and the Minimum number of crew members required. At the same time, the causes of the accidents were also identified for future modelling applications. Finally, all these variables were codified in accordance with standard scales like the Beaufort scale for wind force or the Douglas scale for sea conditions, and other variables were codified in accordance with the typical scales employed in the own reports. All the variable and its codes are shown in Table A1, Table A2, Table A3, Table A4, Table A5, Table A6, Table A7 and Table A8 (Appendix A).

2.2. Software Resources

Different software resources were employed to develop each different statistical study. In this sense, to develop such specific statistical studies like One-Way ANOVA, the software Statistical Package for the Social Sciences (SPSS) version 22 was employed [34]. Despite this, due to the need for multivariable curve fit of response surface modelling, the software Minitab version 18 was selected [35]. To classify the information, different datasheets were employed.

2.3. Statistical Analysis

In the present paper, different statistical studies were employed. First of all, the descriptive statistic and histograms were developed to identify each variable. After that, to identify the variables actually related to accidents, a One-Way ANOVA was employed. This statistical procedure determines whether the groups analyzed (defined by the levels of the independent variable (accidents)) are different in their means respect the overall mean of the dependent variable. To apply this study, some assumptions must be considered; independence of observation (data collection), normally distributed response variable (it will be showed by histograms), and homogeneity of variance. The other important curve-fitting statistical procedure employed in this research work was the response surface technique. This is a polynomial curve fitting with more than 3 variables (which is the main limitation of the general curve fitting defined in most of the software resources). It is an initial curve fitting tool that, like a neural network, models a process in accordance with a minimum square procedure but with the advantage that gives us the mathematical model obtained (IA is based in a black box).

2.4. Methodology

The original methodology employed in this research work is based on the inference statistical procedure applied to the particular case study of ship accidents understanding. In this sense, the first step was to define the correlation between each variable. It is a linear correlation defined by the determination factor and just for linear relations will show an adequate value over 0.9.
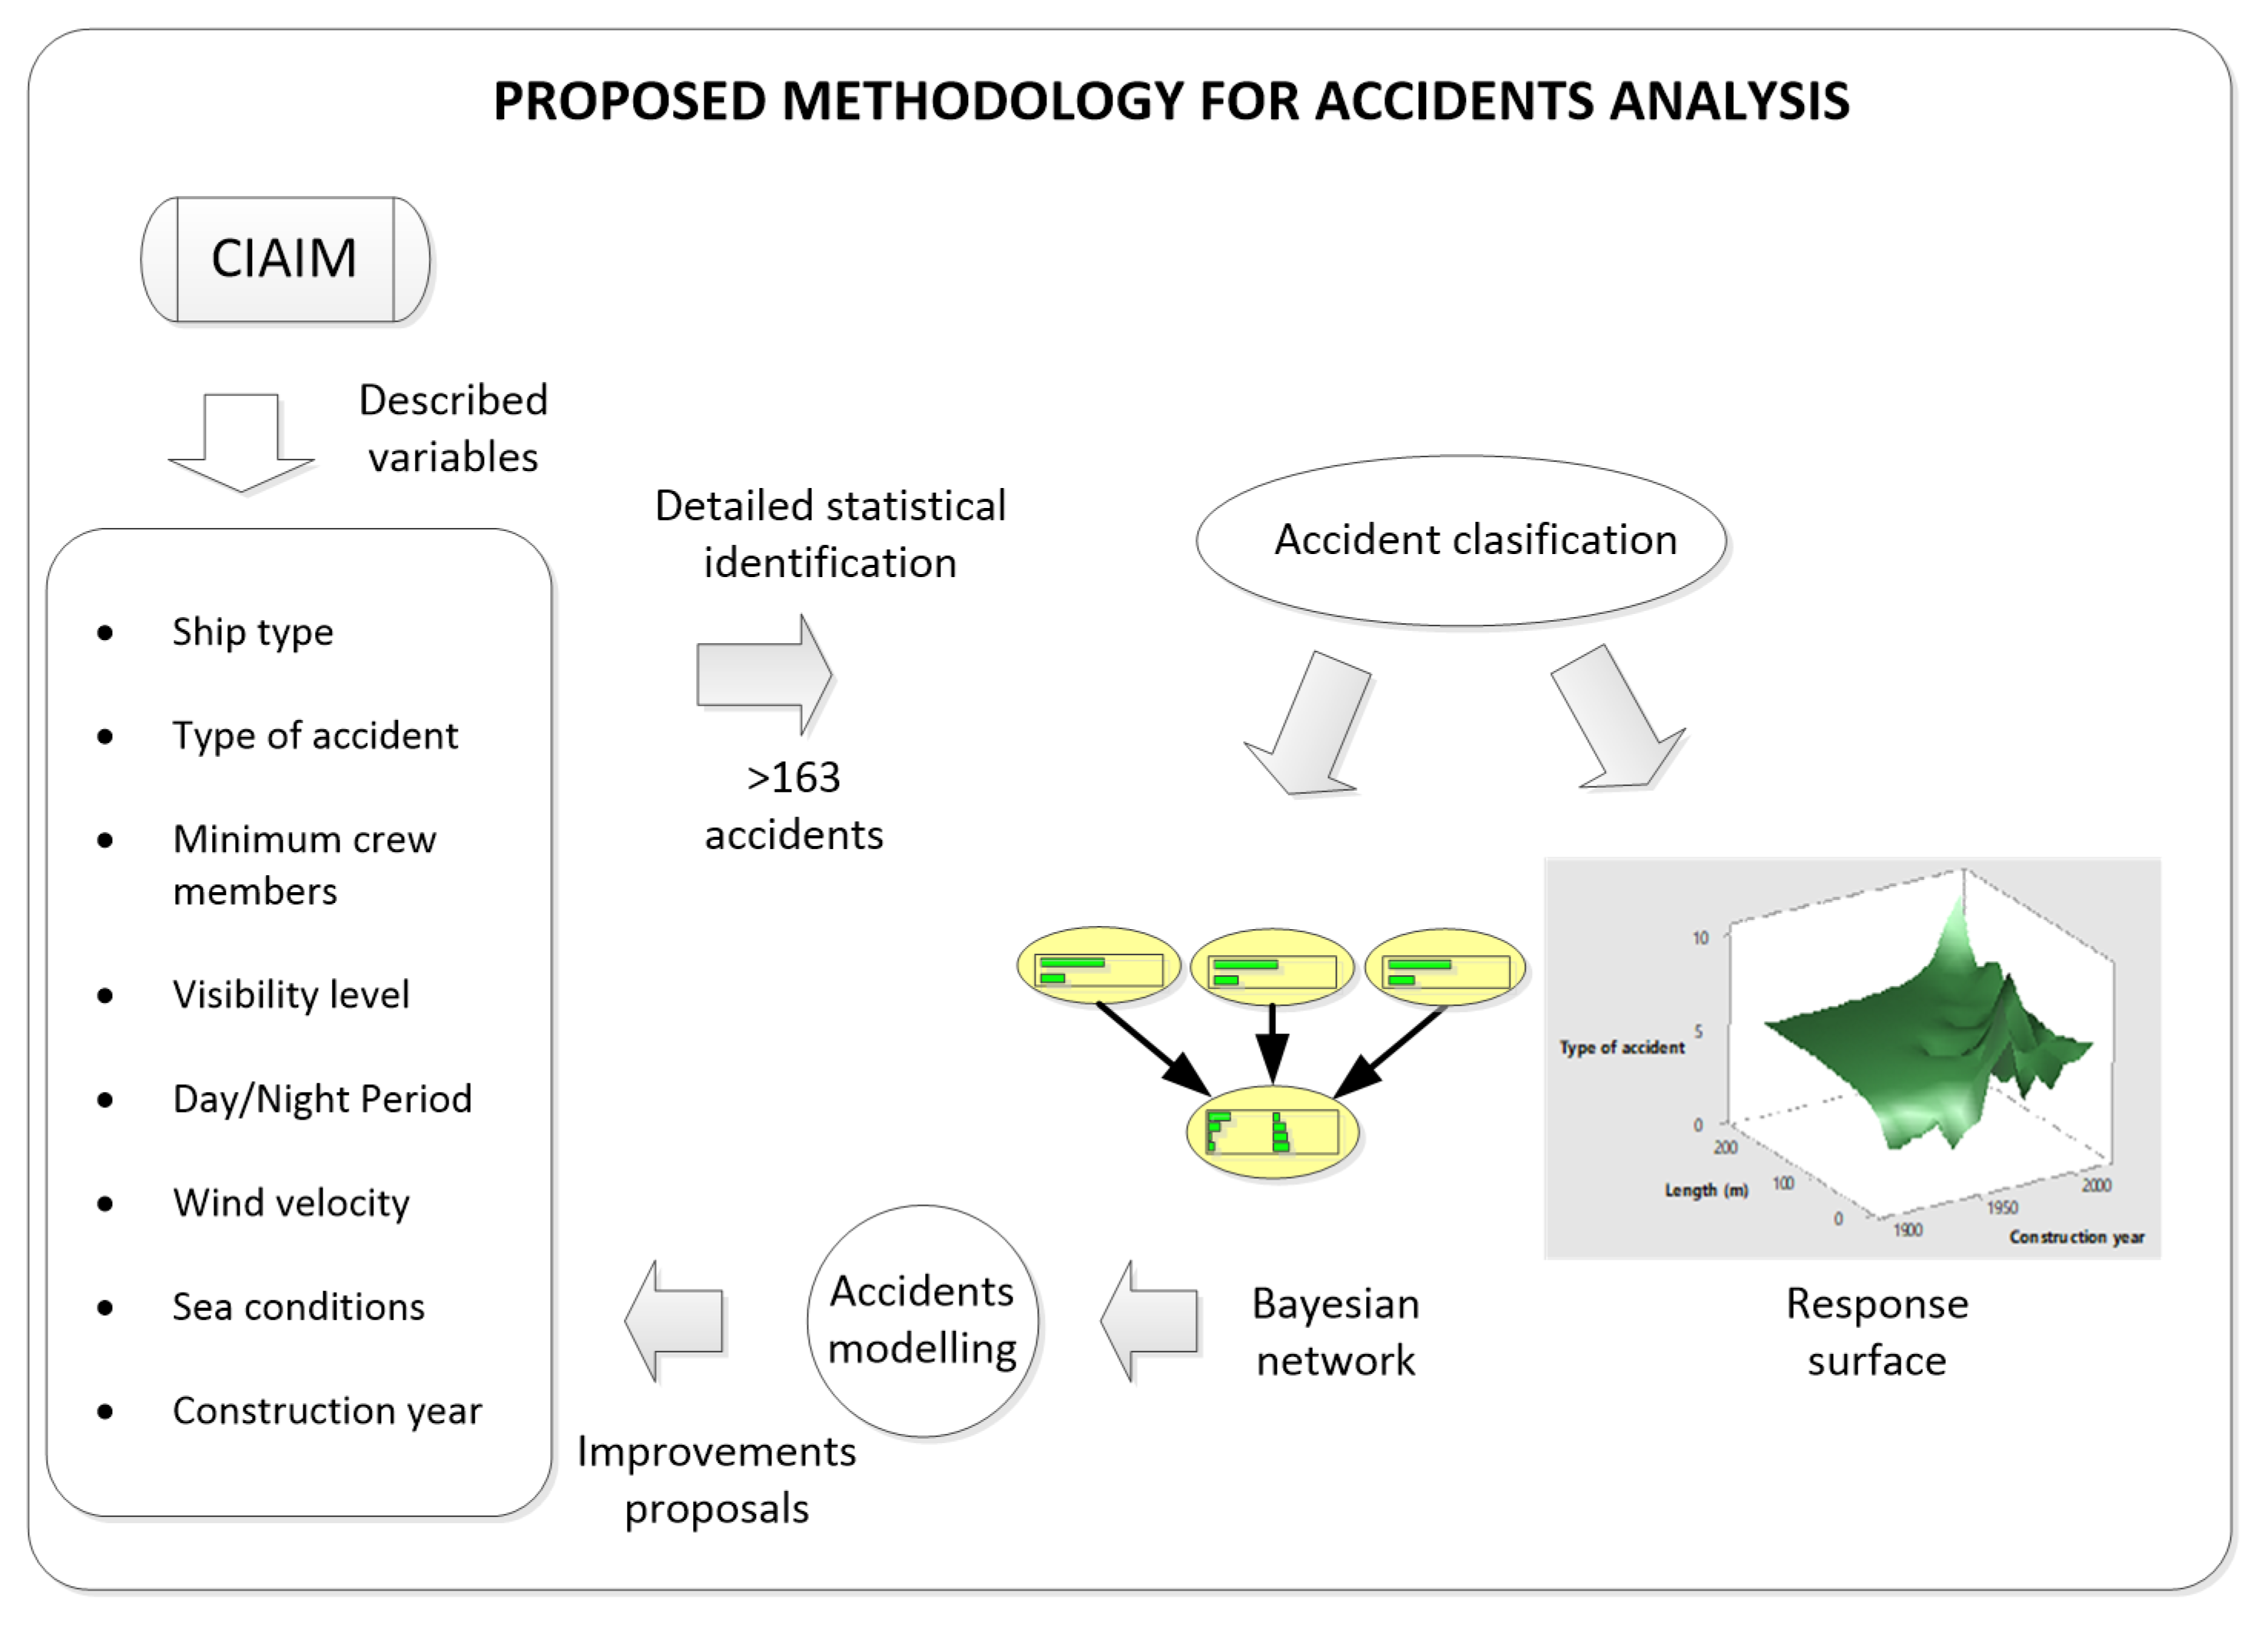
After that, an ANOVA analysis between the accidents type and each different selected variable (selected in accordance with CIAM reports) will show the variables related to the accidents and not identified by a linear correlation, taking it a step further than previous works [16]. Besides, as it is evident, not all the variables are related in the same way with all the types of accidents so a specific ANOVA analysis between each accident with respect to the other is a more in-depth analysis that what has been done in previous statistical works. In consequence, the relevance of each variable to the detection of each different type of accident will be described and, in consequence, the adequacy of the employed scale in some variables. Finally, due to about 7 dependent variables that were related to the accident type, a response surface model will be defined to relate this influence with the type of accident (TA) as an initial general identification model. In this sense, based on the previous information obtained from the initial ANOVA study, different models that related these independent variables will be shown. This process is summed up in Figure 1.

3. Results

3.1. Linear Correlation Analysis

In this section, an initial correlation study between the main selected variables was done. As we can see in Table 1, the determination factor is very high when it is obtained between two variables. For instance, the highest value was obtained between length (L) and breadth (B) (0.95), which is a common-sense value due to some design criteria of these types of merchant ships. This same length variable is directly related to gross tonnage (0.79) and the number of crew members (0.78). This is another logical result due to the fact that these two new variables are usually related to the ship dimensions. A similar relation, but with lower determination factor, was obtained between the breadth and the Gross Tonnage, GT, (0.70) and between the breadth and the number of crewmembers (0.77). To sum up this initial correlation study, it can be concluded that the length of the ship is a representative variable that can replace other variables like breadth, GT, and number of crewmembers at the time to develop a mathematical model to identify the type of accident.
Another interesting determination factor is that which relates to the type of accident and if the ship fulfills the minimum crewmembers required in the moment of the accident (0.46). In consequence, these two variables can be defined as of interest, but cannot be derived one from another due to the not-so-high determination factor like in the previous cases.
Another high determination factor was derived from the study of the wind force and sea conditions (0.76). It is another logical result that will let us replace both variables by just one at the time to define the main variables related to a ship accident.
Finally, a reduced determination factor of 0.22 shows a slight relationship between the type of accident and the year of construction. In this sense, caution must be taken at the time to understand this so low value. As it will be shown in the next sections, the year of build is a decisive variable, but it does not exert a linear effect over accidents. In consequence, posterior, not linear, correlation between variables must be done for the variables with a low linear determination factor; for instance, wind direction, type of ship, visibility, night period, the cause of the accident, and the real number of crew members were not directly related to the type of accident.

3.2. One Way ANOVA

3.2.1. Accidents Independent Variables Recognition

As explained before, due to the determination factor shown in the correlation analysis being related to a line relation between variables, a One-Way ANOVA study must be done. In this sense, a significance of 0.05 was selected as it used to be done in this kind of technical analysis. Main results are shown in Table 2 and Table 3 for an ANOVA analysis between variables and type of accidents and between variables and causes of accidents, respectively.
In these two tables, the variables with a significance below 0.05 were highlighted in grey due to the fact that they are statistically different in the categories or groups of the independent variable (the type of accident or cause of the accident, respectively). From Table 2, it can be observed that year of build, ship length, and the cause of accident have lower significant values, and, in consequence, they show great differences with respect to the type of accident; or what is more, they have more possibility to be a better variable for a curve fitting model that predicts the type of accident. As opposite variables, the number of crew members and wind direction cannot be defined as having changed for each different type of accident, so they are not good variables for a future modelling process.
Finally, it is interesting to understand that, despite the fact that the cause of each accident is a good curve fitting variable, it cannot be employed to develop a model to predict the type of accident. What is more, as it can be observed in Table 3, the cause of the accident can just be related to the GT and wind force variables.

3.2.2. In-Depth Analysis of Types of Accidents Identification Variables

As it was explained before, the initial classification of types of ships, sea conditions, etc., were developed as common sense and in accordance with the usual procedure in this type of accidents. Despite this, the selected a variable and its scale may not be statistically adequate to identify the different type of accidents. In consequence, it is necessary to develop an ANOVA study employing each independent variable to identify the real statistical difference to each different type of accident respect the others. To do so, the first goal of the study was to do the ANOVA analysis of the accident type a1 when it is compared with the others, employing the ship Type (Appendix B, Table A9), year of construction (Appendix B, Table A10), sea conditions (Appendix B, Table A11), the time period (Appendix B, Table A12), visibility level (Appendix B, Table A13), the ship length (Appendix B, Table A14), and the Minimum crew member required (Appendix B, Table A15) as independent variables.
From Table A9 (Appendix B), as a result of the ANOVA analysis, it can be concluded that accidents a2, a6, a8, and a10 can be identified as significantly statistically different to accident a1 by employing the type of ship as the comparative variable. So, this variable can be employed to predict future accidents and its type. In other words, there are different types of ships for each type of accident. Thus, from the data, it can be seen that accident 1 (a1) is associated with a vessel type 3, 2, 7, 8, and 5 accident 3 (a3) is associated with ship types 3, 7, and 10; accident 4 (a4) to ship type 3 and 2; and accident 5 (a5) to type 4, 3, and 2. In particular, accident type 2 (a2) is always with type 3 vessels. Finally, it is interesting to remember that it does not mean that the other groups of column 1 of Table A9 (Appendix B) are equal, they are just not dependent groups to this a1 variable.
If we now compare each of these tables, it can be concluded that visibility level and sea conditions are the worst variables to differentiate types of accidents. At the same time, the year of build and if the ship meets the minimum crew members required are better variables to differentiate types of accidents, in agreement with the initial general ANOVA analysis. Despite this, it must be observed that ship length shows, only for the types of accidents that it can differentiate, the lowest significance level so it is a stronger differentiation parameter. What is more, the year of construction (Table A10, Appendix B) is the more useful variable to differentiate accidents, except accident type 2 (a2), to the others a1, a3, and a4. It must be related with the fact that, when employing the year of construction as identifier variable, it may be not easy to differentiate sinking, an approach, grounding, or collision due to the fact that these variables maybe not really be related to the antiquity of the ship. This same effect happens in Table A15 (Appendix B) when differentiating a2 (sinking) from the other accidents based on the minimum number of crew members required. In addition, in this particular case, the minimum crew members seems to be slightly worse in identifying accidents than the year of construction based on the difficulty to differentiate a3 (Grounding) from other accidents. Despite this, it is the second-best parameter.
From Table A9 (Appendix B), it can be concluded that ship type can be employed to differentiate the accidents a5 (Fire), a6 (Capsizing), a8 (Stranded), and a10 (operational Accident) from the other accidents and that it is not as useful of a parameter as it is usually considered. From Table A14 (Appendix B), it is observed that the ship length is a good parameter, but it has some difficultness in differentiating a2 (sinking) and a6 (Overturning), while it is better at differentiating the other accidents due to its significance being zero in most of the cells. This important information must be considered, and it can be concluded that, in accordance with the type of accident to be identified, the ship length may be the best one variable. Finally, sea conditions (Table A11, Appendix B), that used to be considered the most important variable to identify a ship accident, was the worst variable due to not allowing researchers to differentiate the types of accidents at the time to classify it.
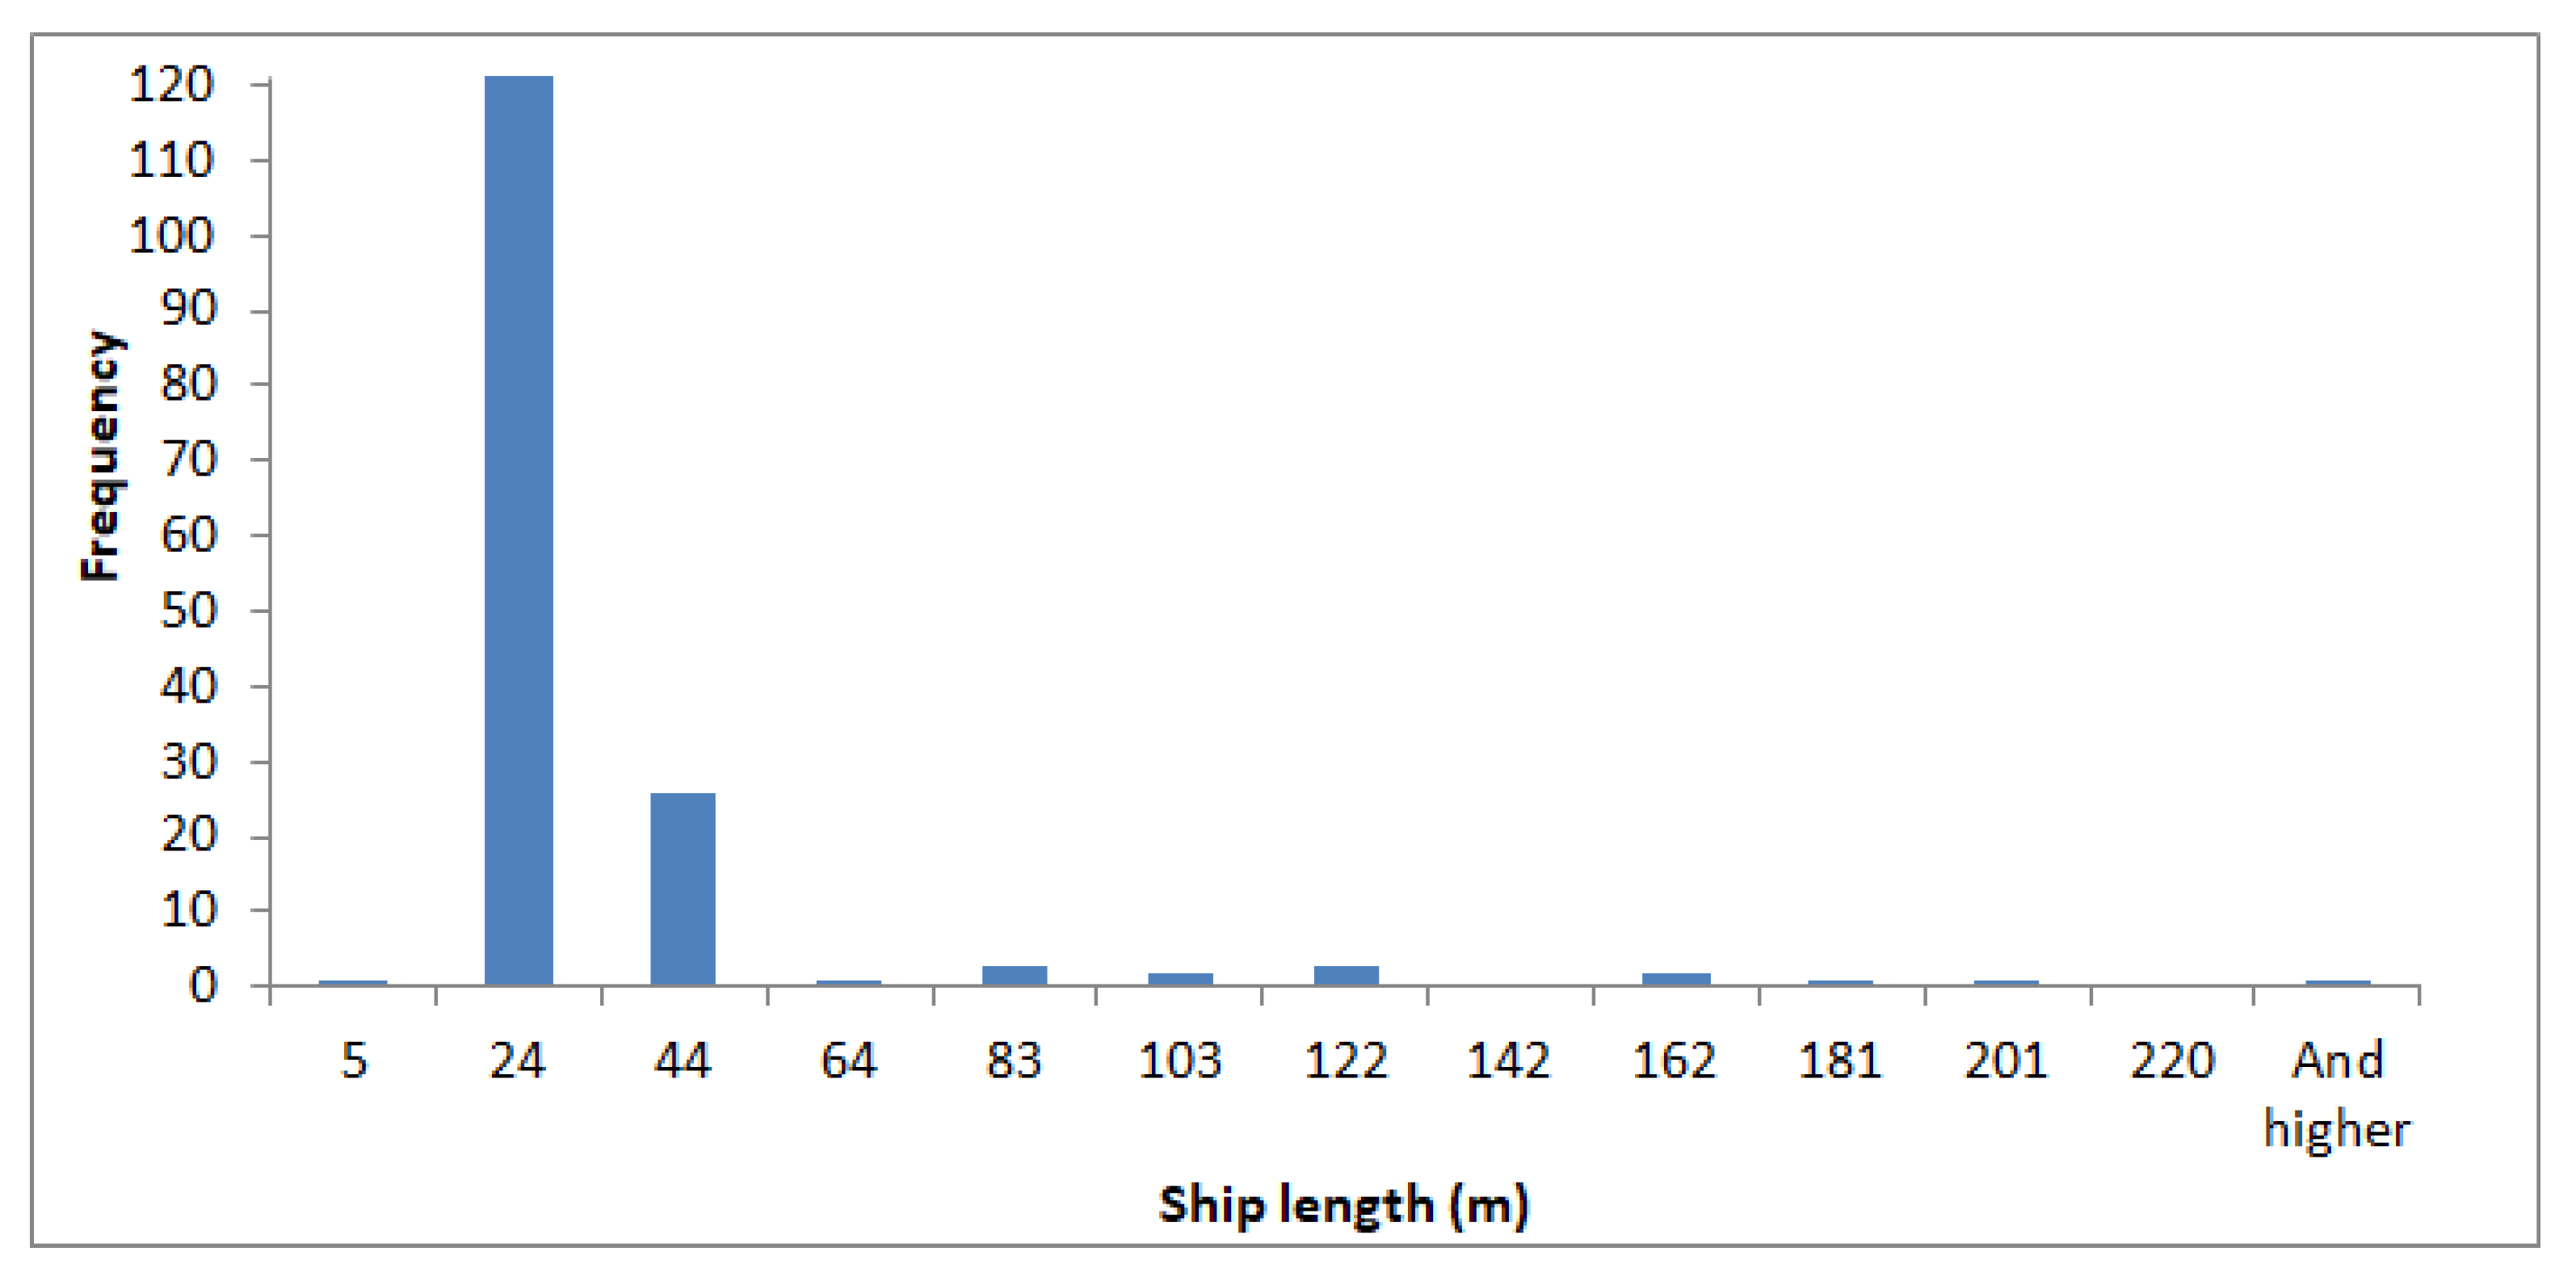
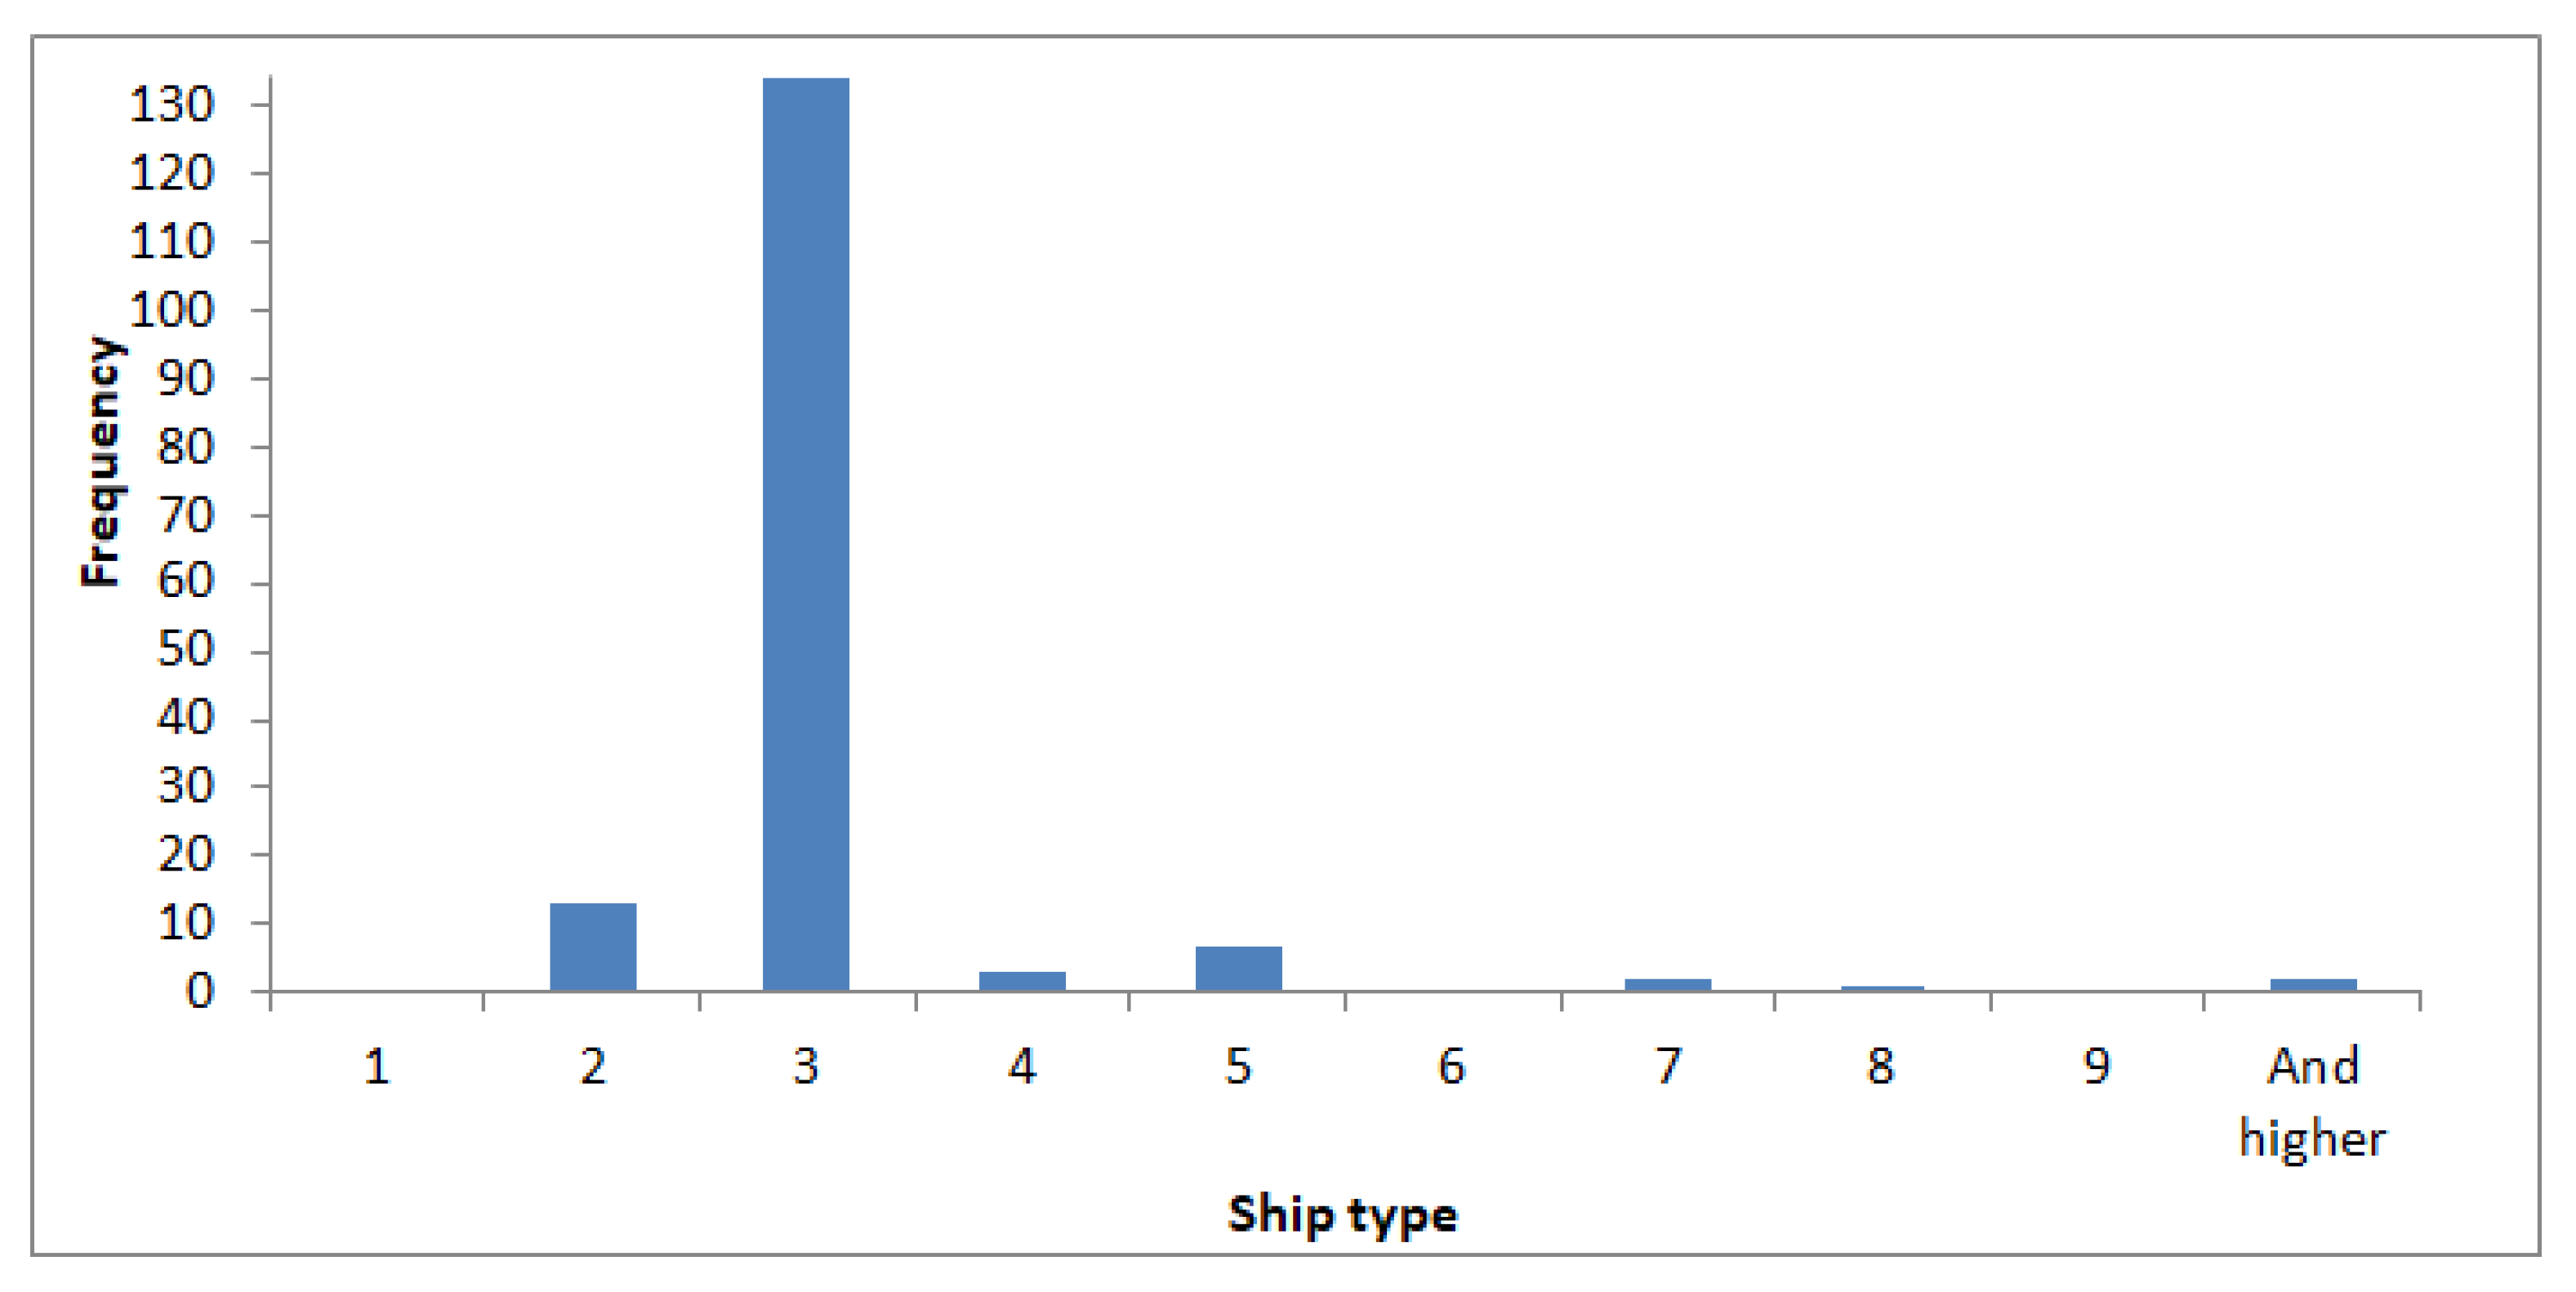
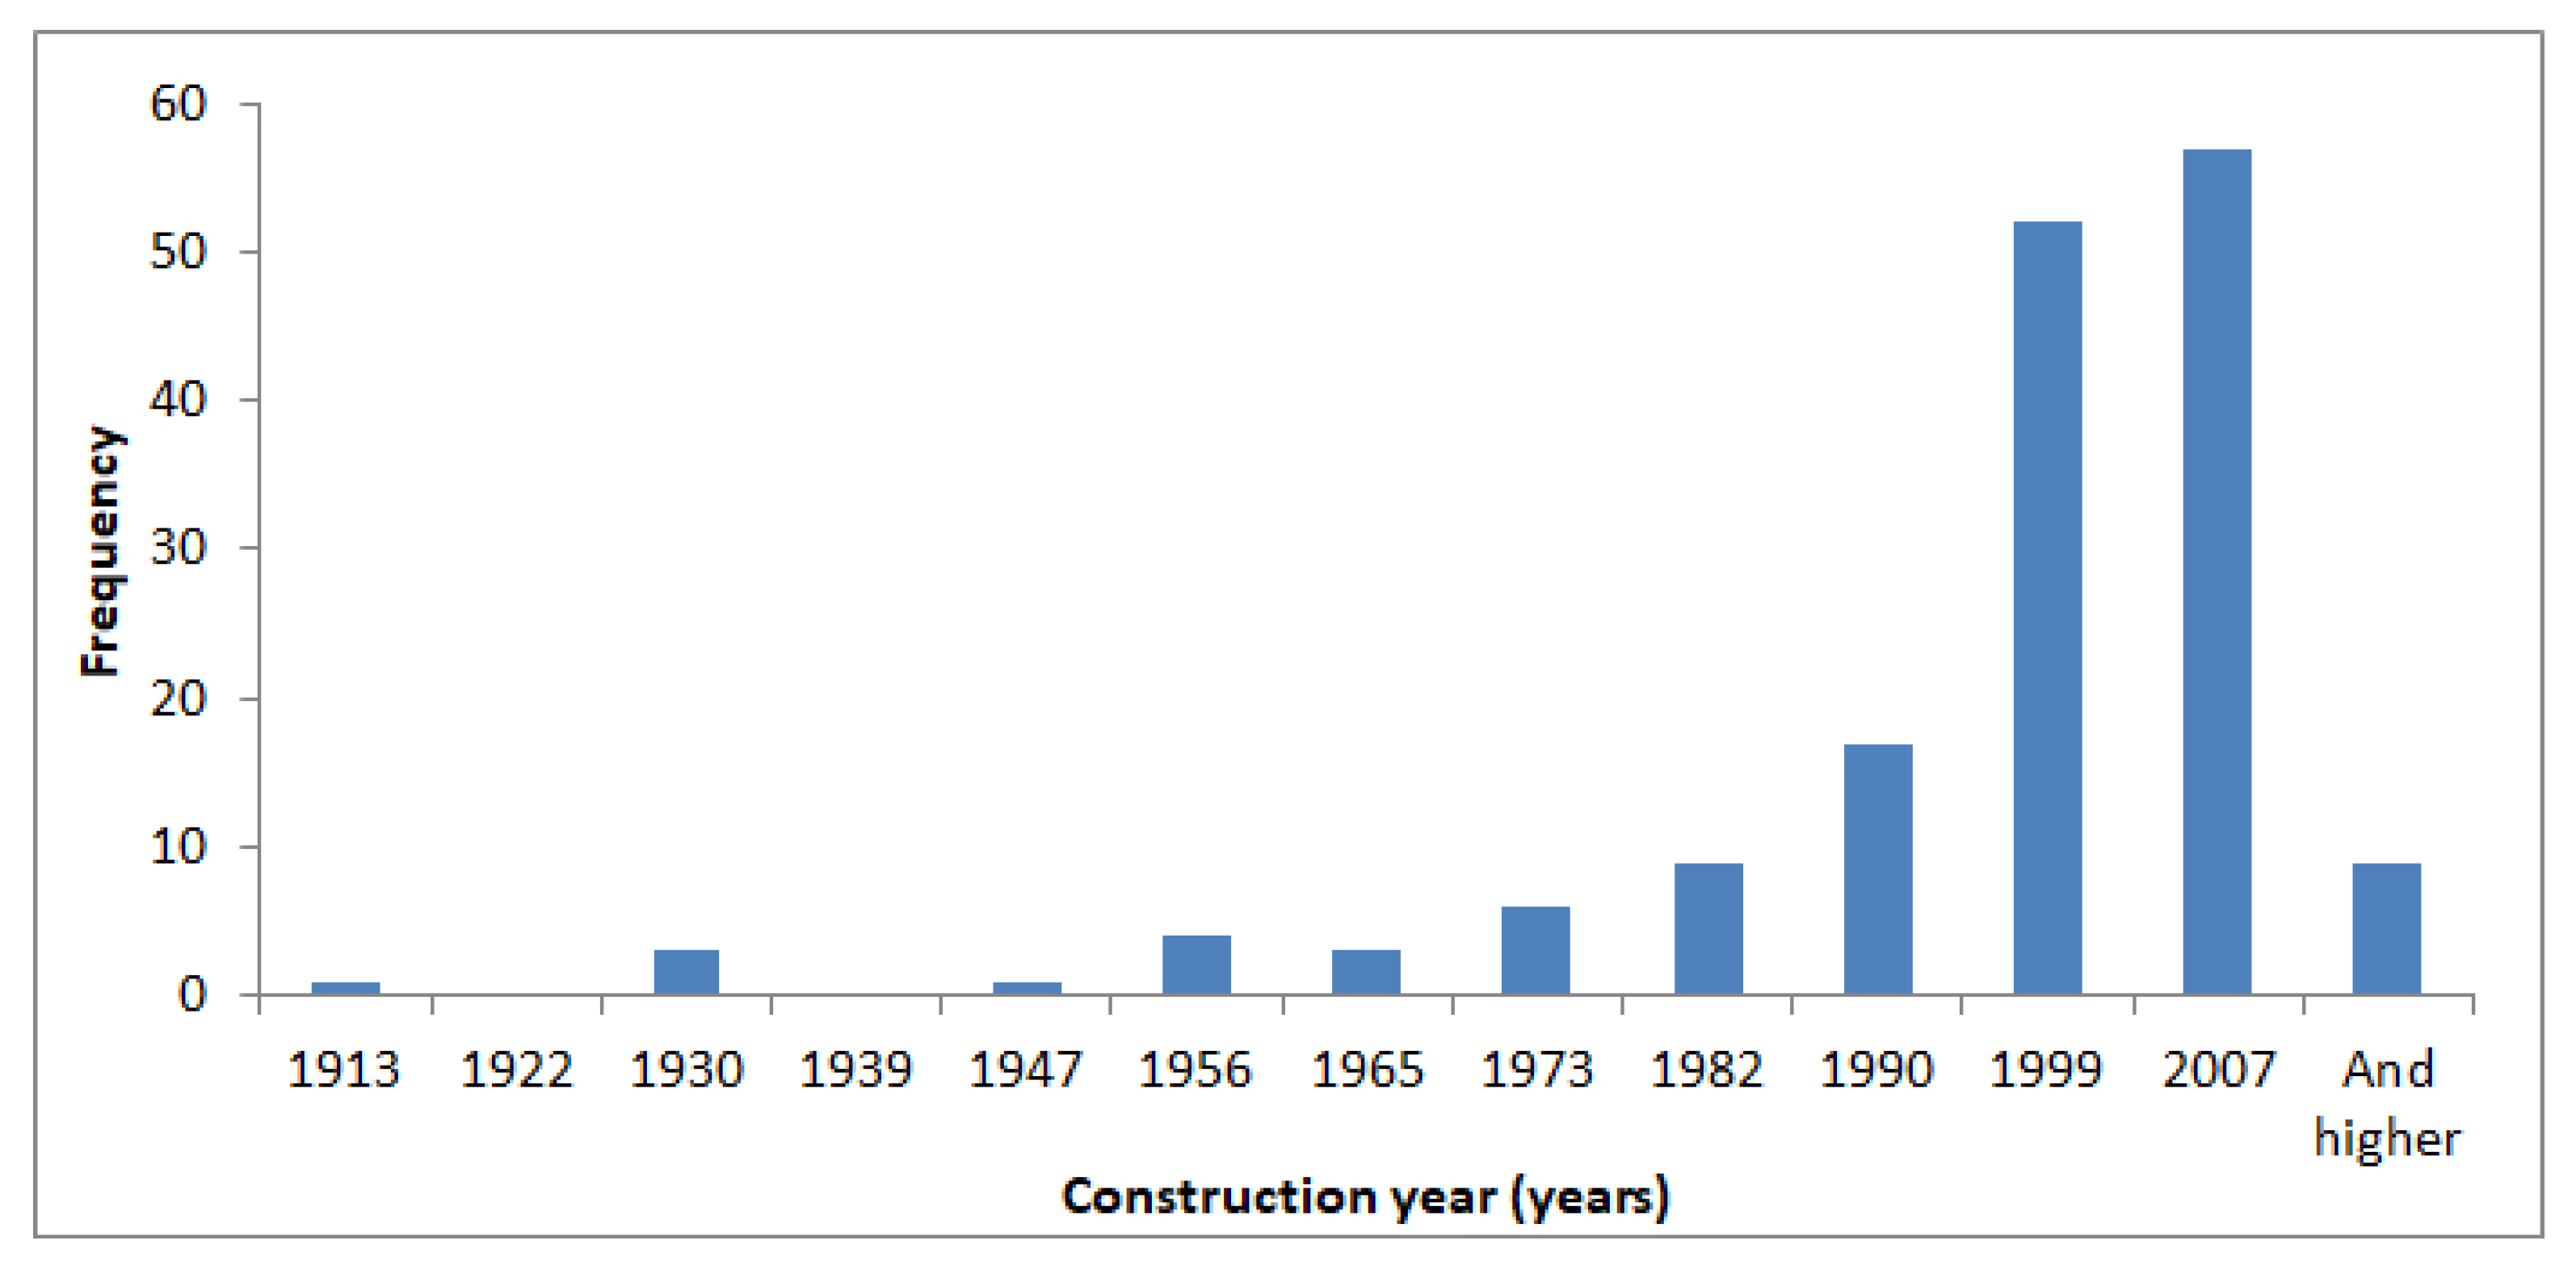
As an illustrative example of the interpretation of these tables showing the relation between accidents and each related variable, histograms of Figure 2, Figure 3 and Figure 4 were developed for construction year, ship length, and ship type. From these histograms, one of the requirements of ANOVA analysis can be observed, the normality, as it was done in previous research works [16]. It must be highlighted that this normality can be identified by a single mode: It is asymptotic to the abscissa axis and it is symmetric with respect to the mean. In this sense, Figure 2 shows a wave similar to a normal distribution if it is considered a decreasing frequency from 2007 until present day. In consequence, it seems logical to obtain a good accident identification based on this so characteristic ship variable. From these figures, it can also be concluded that most of the ships were built between 1999 and 2007, with a length between 24 m and 44 m, and belong to ship type 3 (Fishing vessels).
As a final analysis, it is interesting to see in Table A16 (Appendix B) that the human factor is an interesting variable that allows one to differentiate ship contact (a1) from the other accidents with maximum accuracy (sig. 0.000). At the same time, it allows one to differentiate grounding, collision, and fire accidents (a3, a4, and a5) from capsizing and groundings (a6 and a8).
After these initial conclusions, it is interesting to conduct a comparison with results from previous research works. In this sense, it was defined by previous studies that flooding, grounding, and collision are influenced by the human factor in a high percentage [8]. If we analyze this indication with our results, it was observed that, when the accidents were compared in accordance with some variable, for instance, ship type, sea conditions, and visibility, it cannot differentiate the accidents a2, a3, and a4, which implies that another factor must exert a strong influence, presumably the human factor. It is in agreement with previous works’ indications, and a possible solution is highlighted in this paper showing that just ship length allows one to successfully differentiate between the difficult identification of these types of accidents. Finally, all these tables are summed up in Table 4.
From Table 4 it can be concluded that year of construction, crew members, and vessel length are the more useful variables to differentiate between the types of possible accidents in vessels.

3.3. Bayesian Networks

In a similar way to the study recently conducted by Uğurlu et al. [32] (Figure 2), in the present research work, a Bayesian network was developed to define the probability of each type of accident based on the causal variables, which are identified in the previous sections.
Previous to develop the graphical model, it is necessary to define the ranges of the three more relevant variables identified in Table 4. In particular, as ship was identified as New if the ship was built after 1996, identified as Long if the ship had a length higher than 12 m, and, finally, it was identified as having a high number of crew members when it was higher than the minimum number required.
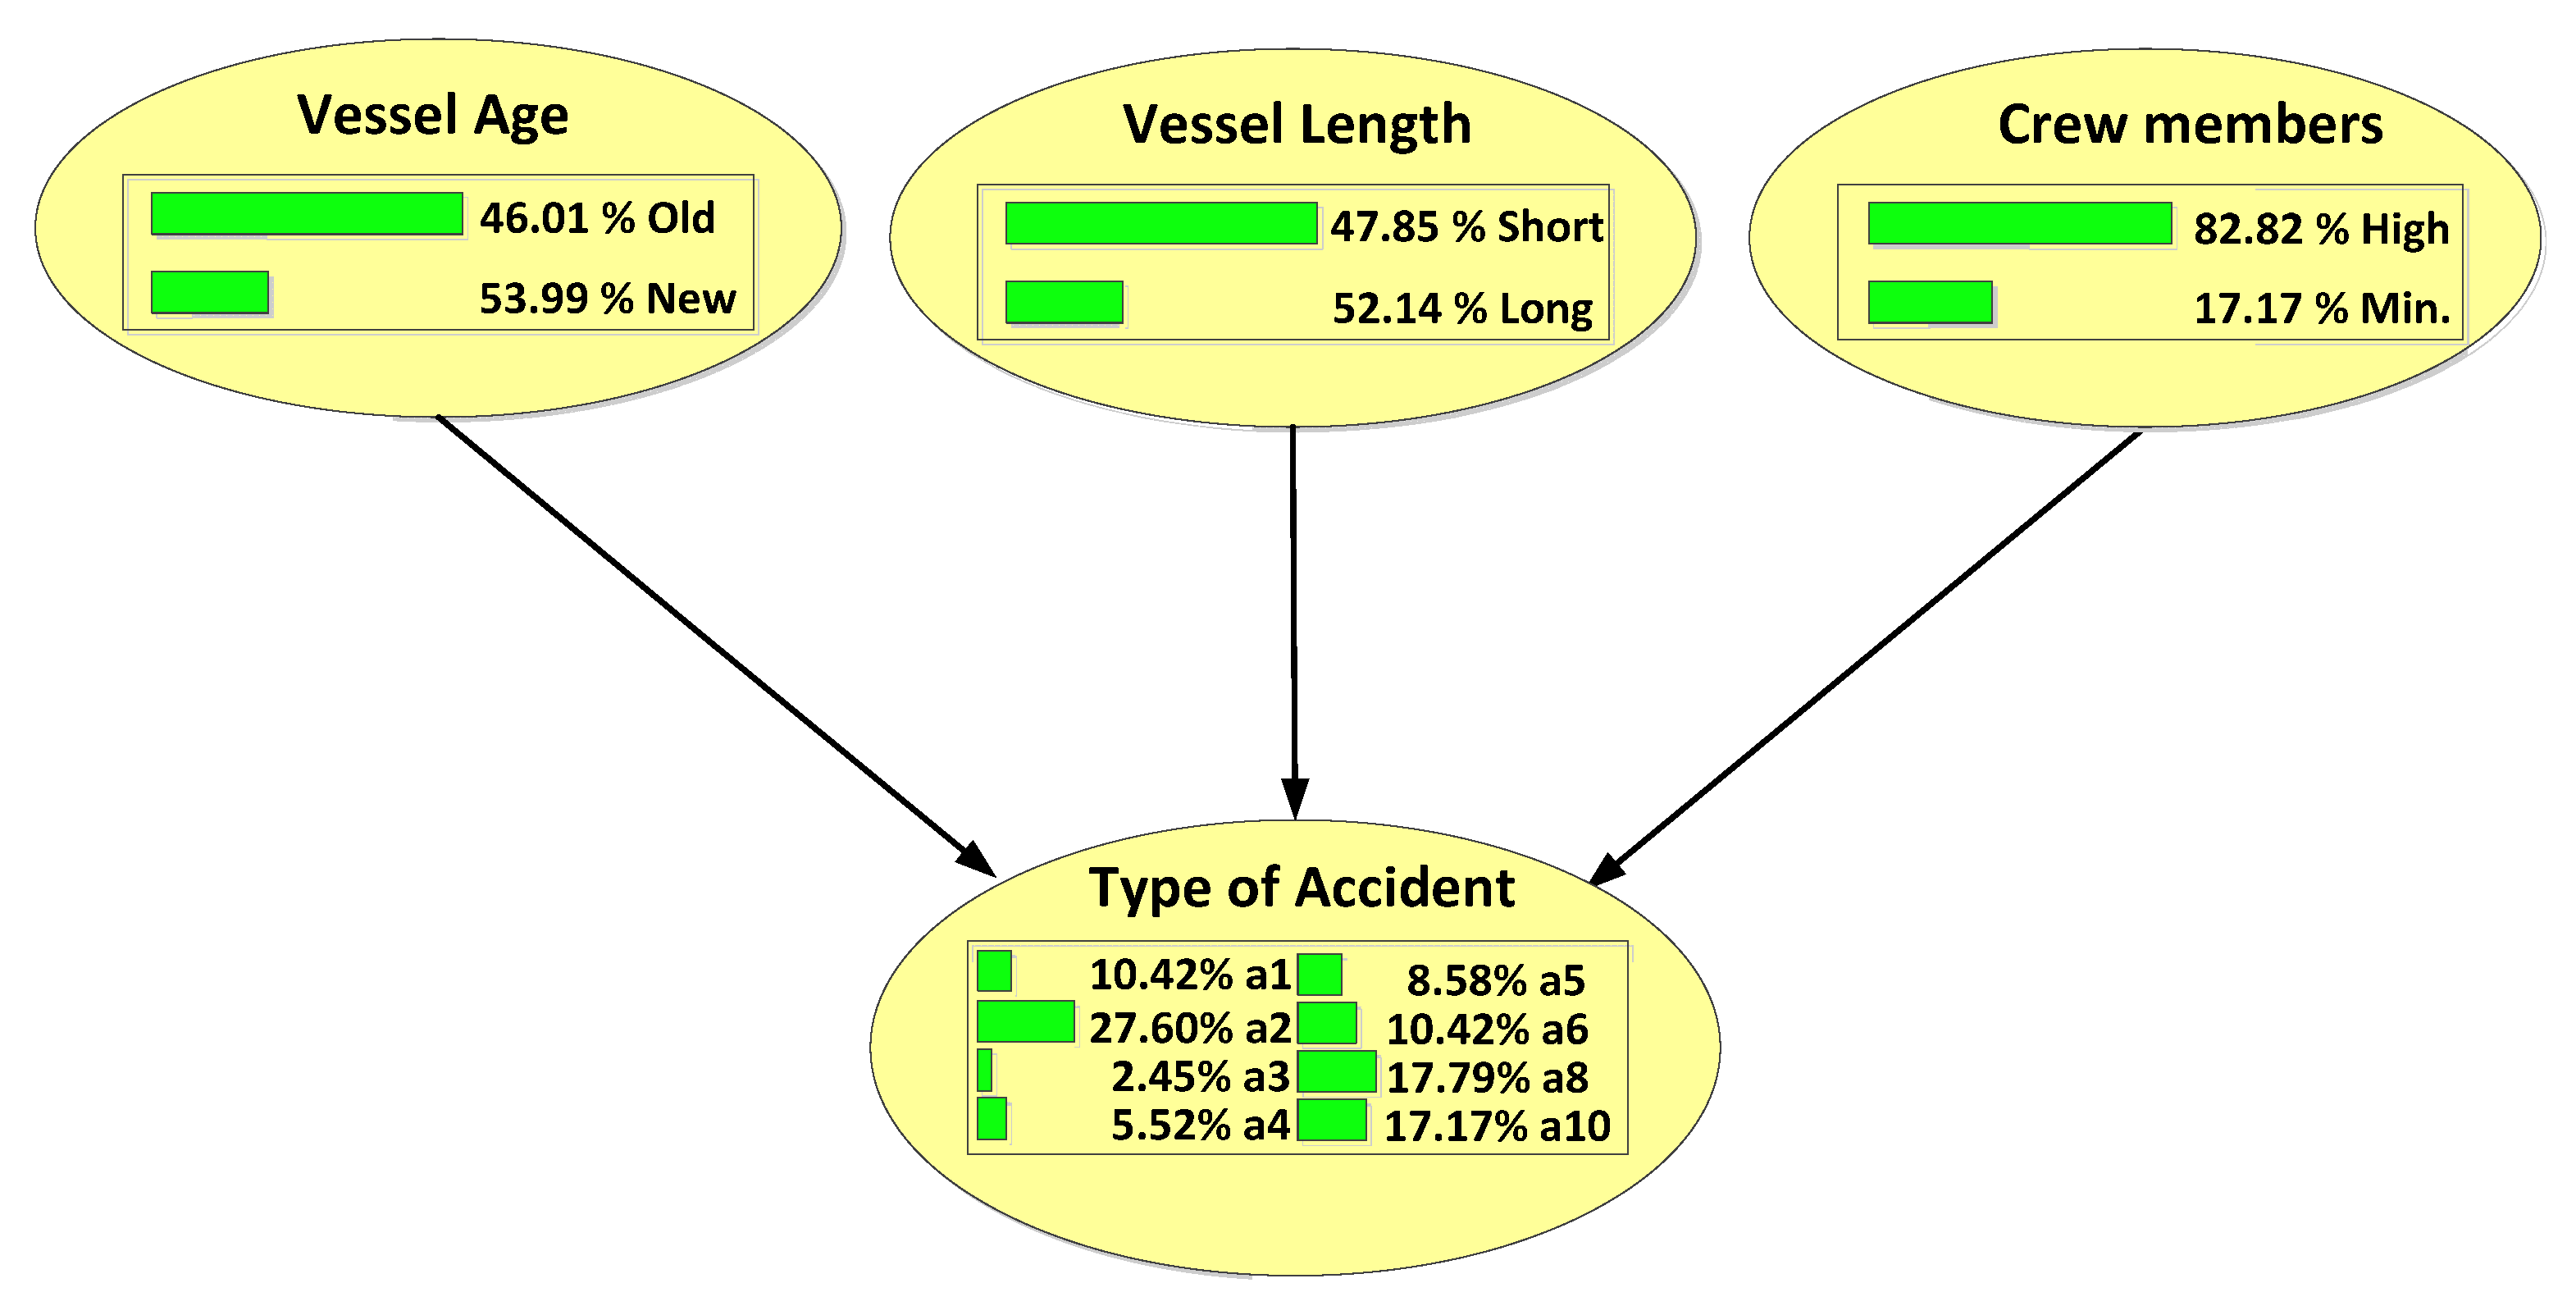
Once these ranges were defined, it is possible to define the initial probability of each one, as it is reflected in Figure 5. Despite this, it may be not a realistic value that allows us understand the importance of each variable, so further analysis must be done.
In this sense, by applying the Bayesian theorem, it is possible to define the new probability of each related variable (relevance) once it is known that one type of accident happens. In consequence, the Bayesian theorem allows us to define the new probability of vessel age, vessel length, and vessel number of crew members for the more representative accidents (a1, a4, and a10), in a similar way to how it was done in previous studies; this is reflected in Table 5.
As it was explained before, Table 5 shows the relevance of each related variable once a type of accident is identified. In this sense, from this table, an increase can be observed of the probability (from 17.17 to 58.82%) of the relationship between accident a1 (contact) and a minimum compulsory number of crew members employed. The same happens with this same accident, being more strongly related to a high ship length, and experiencing an increment of probability from 46% to 77%.
In a similar way, when an operational accident happens (a4), a reduced ship length experiences an increment of implication in the accident by increasing the conditioned probability from 47% to 77%.
Finally, once again, it was observed that, when ship length is high, it exerts an increment of its relevance and conditioned probability in collision accidents (a10). In this particular situation, there is an increment from 52.14% to 71.43%, as it is shown in Table 5.
All these results were in agreement with previous works developed in other regions like that done by [32]. In general terms, a clear agreement with [32] was obtained in the identification of the relation between vessel length, age, and accident types.
Despite this, some differences with respect to. previous works were obtained. In this sense, sea conditions do not seem to be related to most of the accidents analyzed, in disagreement with [32] that identifies sea conditions and weather as some of the more relevant variables related to accidents. It must be related to the fact that the region that is the object of this study does not experience bad weather conditions or casualties. In consequence, there is a need to develop a recompilation of real case studies of different regions to develop a general stochastic model.
Finally, old ships (in this research work, identified as that with more than 24 years) only showed a higher relevance in operation accidents, in disagreement with the general conclusion obtained by [32]. Once again, it must be related to the particularities of each region object of study. In consequence, a ship age limitation of 20 years, as it is proposed by other researchers [32], may be not of interest in this particular fishing region.
At the same time, another difference with previous studies was obtained at the time to analyze ship length effect. The research work developed by [32] concludes that in smaller ships, the accidents increase. In our case study, this conclusion was obtained for operation accidents and the inverse effect for contact and collision accidents. In this sense, it is of interest to introduce the concept of a small ship due to it dependence on the limits fished at the time to analyze the problem. In our particular case study, the classificatory limit value of 12 m was selected and in [32], it was 24 m in accordance with different national standards.
From these results, it can be concluded that there is a need to develop particular case studies for different regions and to obtain variable conclusions per each type of accident due to the differences in accidents between regions paper.

3.4. Response Surface

3.4.1. Accident Modelling

As it was explained in previous sections, most research works try to define the stochastic probability of each variable in each type of accident [36,37,38], but once the main variables are identified, it is of interest to define a deterministic model that allows us to understand the dynamic risk of each situation as it used in different engineering areas.
In this sense, a modelling procedure based on the response surface may help to obtain a mathematical model that allows us to relate the type of accident and the main independent variables. As it was shown in Table A1 (Appendix A), the ANOVA study allowed us to define the main related variables identified with a significance level below 0.05. In consequence, it could be defined as a mathematical model that interrelates the independent variable with all seven dependent ones. For this objective, the response surface procedure was selected due to the useful curve fitting of multivariable models. Based on this procedure, a model with a determination factor of 54.89% could be considered as adequate due to its proceeds from real sample data in 163 case studies. The model obtained is shown in Equation (1):
T A = 1085 62 S T 0.75 C Y + 57.8 W F 105.9 S C 67.7 V 86.7 N 14.1 L + 0.42 G T + 18.3 N C + 0.2 M N C + 0.279 S T 2 + 0.00010 9 C Y 2   0.232 W F 2 + 0.156 S C 2 + 0.353 V 2 0.00479 L 2   0.0464   N C N C + 0.078 M N C 2 + 0.0300 S T C Y + 1.36 S T W F 1.96 S T S C + 1.11 S T V 0.89 S T N + 0.0411 S T L 0.00110 S T G T 0.165 S T N C 1.020 S T M N C     0.0295 C Y W F + 0.0545 C Y S C + 0.0308 C Y V + 0.0420 C Y N + 0.00730   C Y L 0.000222 C Y G T 0.0086 C Y N C + 0.0001 C Y M N C + 0.019 W F S C 0.377 W F V   +   0.013 W F   N + 0.0416 W F L 0.00084   W F G T 0.120 W F N C   + 0.047 W F M N C + 0.213 S C V + 1.178 S C N 0.0324   S C L + 0.00133 S C G T   0.068 S C   N C     0.153 S C   M N C   +   1.110 V N 0.100 V L + 0.00430 V G T + 0.042 V N C + 0.474 V M N C 0.144 N L + 0.00232 N G T + 0.009 N N C 0.061 N M N C + 0.000093 L G T + 0.0326 L N C 0.0239 L M N C 0.000102 G T N C + 0.00170 G T M N C 0.072 N C M N C
If we try to define a model that incorporates the human factor, a better equation is obtained with a higher determination factor of 62.51, as we can see in Equation (2):
T A =   2713 + 14 S T 2.55 C Y + 59.9 W F 112.4 S C 102.7 V 8.7 N + 3.90 L 0.204 G T 7.3 C A 13.9 M N C + 0.438 S T 2 + 0.000601 C Y 2 0.150 W F 2 + 0.303 S C 2 0.202 V 2 0.000366 L 2 + 2.111 C A 2 + 0.023 C M N 2 0.0087 S T C Y + 0.88 S T W F 1.35 S T S C + 1.41 S T V 0.81 S T N + 0.0416 S T L 0.001512 S T G T 2.33 S T C A 0.869 S T M N C 0.0306 C Y W F + 0.0581 C Y S C + 0.0496 C Y V + + 0.0021 C Y N 0.00165 C Y L + 0.000090 C Y G T + 0.0012 C Y C A + + 0.0081 C Y M N C 0.236 W F S C 0.422 W F V + 0.255 W F N 0.0087 W F L + + 0.00062 W F G T + 0.862 W F C A + 0.298 W F M N C + 0.303 S C V + 0.596 S C N 0.0452 S C L + 0.00052 S C G T 1.073 S C C A 0.225 S C M N C + + 0.869 V N 0.0654 V L + 0.00335 V G T + 0.284 V C A + 0.025 V M N C 0.058 N L + 0.00141   N G T + 0.829 N C A + 0.340 N M N C + 0.000057 L G T + + 0.0456 L C A 0.1173 L M N C + 0.00040 G T C A + 0.00249 G T M N C 0.380 C A M N C
In this sense, human factor allows an increase in the accuracy of the developed model and to differentiate the approach accidents to the others. Despite this, results indicate that the accuracy and, in consequence, its human factor scale, must be improved, therefore changing the simple scale usually employed in most of the CIAIM reports to a more in-depth scale allows us to improve the accident classification.
Finally, it is interesting to highlight that these models include aspects like wind forces, among other variables, as an improvement of the limitations defined in previous works [12]. It is true that, like in other studies [14], the determination factor must be improved in future analysis and it must be done paying special attention to the influence of the human factor in some accidents, as it was concluded previously in agreement with the more recent research lines [29,30].
As an example of future study, a final model was developed. In this sense, an analysis of the more representative variable (ship length) showed that it is in fishing vessels (with a length below 40 m) where most of the values are centered. In consequence, a decrease of model definition is concluded at higher ship lengths due to a lack of a representative number of accidents of ships in this ship length range.
If we now simplify this data analysis to the most common vessel (fishing are 96 cases of 163 analyzed) just excluding two ambiguous accidents (sinking and operational accident), the model increases its precision to a determination factor of 0.83, see Equation (3).
TA = 2727 + 2.99 · CY + 33.1 · WF 192.2 · SC 102 · V + 33.4 · N + 18.2 · L 1.86 · GT + 40.8 · CA 80.2 · MNC 0.000812 · CY 2 0.296 · WF 2 0.204 · SC 2 0.226 · V 2 0.0100 · L 2 0.000273 · GT 2 + 2.59 · CA 2 + 0.047 · MCN 2 0.0169 · CY · WF + 0.0978 · CY · SC + 0.0516 · CY · V 0.0194 · CY · N 0.00922 · CY · L + 0.000950 · CY · GT 0.0275 · CY · CA + 0.0425 · CY · MNC + 0.443 · WF · SC + 0.254 · WF · V 1.003 · WF · N 0.076 · WF · L + 0.0044 · WF · GT + 1.044 · WF · CA + 1.076 · WF · MCN 1.065 · SC · V + 1.385 · SC · N + 0.241 · SC · L 0.0175 · SC · GT 2.044 · SC · CA 1.135 · SC · MCN + 0.295 · V · N + 0.152 · V · L 0.0225 · V · GT + 0.945 · V · CA 0.737 · V · MNC + 0.168 · N · L 0.0420 · N + 2.084 · N · CA 0.119 · N · MCN + 0.00651 · L · GT 0.180 · L · CA 0.296 · L · MCN + 0.0156 · GT · CA + 0.0157 · GT · MCN + 0.13 · CA · MCN
Finally, excluding operational accidents, a determination factor of 0.90 is obtained with 76 accidents analyzed, which are half of the sampled data, see Equation (4).
TA = 7088 + 7.44 · CY 122 · WF + 186 · SC 138 · V 97 · N + 9.8 · L + 2.62 · GT 138 · CA + 42.7 · MCN 0.00194 · CY 2 + 0.501 · WF 2 + 0.891 · SC 2 0.229 · V 2 + 0.0423 · L 2 + 0.000712 · GT 2 0.135 · MCN 2 + 0.0582 · CY · WF 0.092 · CY · SC + 0.070 · CY · V + 0.0474 · CY · N 0.0071 · CY · L 0.00093 · CY · GT + 0.0668 · CY · CA 0.0180 · CY · MCN 0.71 · WF · SC + 0.479 · WF · V 1.86 · WF · N + 0.187 · WF · L 0.0432 · WF · GT + 0.71 · WF · CA + 1.858 · WF · MCN 1.15 · SC · V + 1.91 · SC · N + 0.285 · SC · L 0.0005 · SC · GT 3.14 · SC · CA 1.61 · SC · MCN 1.36 · V · N + 0.467 · V · L 0.0760 · V · GT + 1.07 · V · CA 1.134 · V · MCN + 0.417 · N · L 0.1075 · N · GT + 5.80 · N · CA 0.86 · N · MCN 0.0107 · L · GT 0.038 · L · CA + 0.032 · L · MCN 0.0303 · GT · CA 0.0156 · GT · MCN 2.53 · CA · MCN
From these last models, it can be concluded that an adequate scale in accident reports and an adequate variables selection may allow researchers to define highly accurate models. What is more, the minimum number of ships that suffer an accident must be defined to prevent modelling accuracy problems. These are really interesting indications for future research works about ship accidents.

3.4.2. Relation between Variables and Scales Employed

In the present section, different models to relate implied variables are developed and shown in Table 6 with the aim to simplify the previous accidents models of Equations (1)–(4). For instance, from Table 1, it was obtained that sea conditions are related to the wind force and now a model with a determination factor of 60% was obtained. It is in accordance with the previous relation between Beaufort and Douglas scales shown in Table A8 (Appendix A) and is a good proof of an adequate variable analysis and modelling. Another interesting model is that which relates the crew member and the ship dimensions with a determination factor of 79.15, in agreement with common sense and international standards requirements.
Despite this, results indicate an inadequate model to relate the construction year and the minimum crew members to identify types of accidents. As it was commented in previous sections, the type of accident is, sometimes, a little ambiguous and the same happens with the minimum number of crew members (just meets (1) or does not meet (2)). Due to the information from CIAIM reports, a better understanding of these accidents and an improvement of these scales must be developed in the future.

4. Conclusions

In the present work, a case study about ship accidents in the Spanish SAR territory was conducted due to the lack of similar research works about this in this region. Despite the fact that a similar analysis was employed as that in previous case studies [16,32,33], in our case, it was done with more than two related variables. In consequence, the VCH square method was replaced with the Analysis of Variance, allowing for the definition of the relation between more numbers of variables for the particular Spanish Search and Rescue (SAR) sea regions. What is more, the importance of each of the three more relevant variables for each type of accident was defined by the Bayesian networks procedure. Finally, different deterministic models based on the variables identified were developed to show the feasibility of a deterministic model in a dynamic process. In consequence, a more in-depth analysis than before was done showing the sensibility of each implied variable to determine the more probable expected type of accident and the relevance of each variable to each type of accident. The main conclusions can be defined as:
  • The most relevant variables to identify the more probable type of accident and their average values were identified. In this sense, weather conditions do not have any kind of effect over analyzed accidents, in disagreement with previous works. Wind direction does not influence the type of accident or other parameters, and wind intensity is of interest and related to the sea condition. This effect is a consequence of the particularities of the region of study. The ship length and the year of construction were identified as other important parameters, which exert a clear effect over ships accidents (except some of type a2). This must be related to the standards of each country allowing the modification of the working life of ships higher than 20 years in this region.
  • It is possible to define different multinomial models that let us predict the type of accident in a deterministic way, that were developed based on the most relevant variables employed in accidents reports.
  • Improvements in accident reports and its scales are proposed, and common classificatory limits to define ship age, ship length, and crew members must be employed to compare results of different research works. What is more, a minimum number of accidents analyzed per each ship type must be defined.
Finally, it is of interest to highlight that this initial study will be the base case to predict the occurrence of accidents when the main variables of the problem change. In this sense, future works based on neural networks for clustering and accident modelling and prediction must be done to define the characteristics of the safest ship.

Author Contributions

Conceptualization, C.M., D.V., J.M.P.-C., and J.A.O.; methodology, C.M., D.V. and J.A.O.; software, D.V., J.M.P.-C.; validation, C.M., D.V., J.M.P.-C., and J.A.O.; formal analysis, C.M., J.M.P.-C., D.V., and J.A.O.; investigation, C.M., J.M.P.-C., D.V., and J.A.O.; resources, C.M., J.M.P.-C., and J.A.O.; data curation, D.V. and J.A.O.; writing—original draft preparation, C.M., D.V., J.M.P.-C., and J.A.O.; writing—review and editing, C.M., J.M.P.-C., D.V., and J.A.O.; visualization, C.M., J.M.P.-C., D.V., and J.A.O.; supervision, C.M., J.M.P.-C., D.V., and J.A.O.; project administration, C.M., D.V., J.M.P.-C., and J.A.O.; funding acquisition, C.M., D.V., J.M.P.-C., and J.A.O. All authors have read and agreed to the published version of the manuscript.

Funding

This research was funded by the Sustainability Specialization Campus of the University of A Coruña grant number 6310G49279- 541A- 64900.

Institutional Review Board Statement

Not applicable.

Informed Consent Statement

Not applicable.

Data Availability Statement

Not applicable.

Acknowledgments

The authors wish to express their gratitude to Gonzalo Guillen Espejo Savedra (The Spanish Ministry of Transport, Mobility and Urban Agenda (MITMA)) and Francisco Mata Álvarez-Santullano (CIAIM).

Conflicts of Interest

The authors declare no conflict of interest.

Nomenclature

a1Contact
a10 Operational accident
a2 Flooding
a3 Grounding
a4Collision
a5 Fire
a6 Capsizing
a7List
a8 Stranded
a9 Loss of Stability
AIArtificial Intelligence
B Breadth
BBN Bayesian Belief Network
CACause of accidents (Human factor)
CIAIM Spanish Commission for Investigation of Maritime Accidents and Incidents
CM Crewmembers
COLREGConvention on the International Regulations for Preventing Collisions at Sea
CY Year of build
DAMA A coding system agreed in 1990 by the Scandinavian countries for the registration and analysis of marine accidents.
FRAM Functional Resonance Accident Model
GRT Gross Register Tonnage
GT Gross Tonnage
HFACS Human Factor Analysis and Classification System
IA Intelligence Artificial
IALA International Association of Marine Aids to Navigation and Lighthouse Authorities
IMO International Maritime Organization
IWRAPIALA Waterway Risk Assessment Program
L Length
MNC Minimum number of crewmembers
NNocturnal
PAWSA Ports and Waterway Safety Assessment
SAR Search and Rescue
SCSea condition
SEM Structural Equation Modelling
SPSS Statistical Package for the Social Sciences
ST Type of ship
TAType of accident
V Visibility
WD Wind direction
WF Wind force

Appendix A. Variables and Its Codes

Table A1. Ship type code.
CodeShip Type
1Extraction Platforms and Auxiliary Supply vessels
2Passenger and/or cargo vessels
3Fishing vessels
4Fishing and Aquaculture Auxiliary Boats
5Tugboats and auxiliary boats of the Port Service
6Commercial Yachts
7Recreational Boats
8Vessels of Public Organizations
(National or Autonomous Communities)
9Provisional List of Vessels under Construction
Table A2. Type of accident code.
CodeType of Accident
1Contact
2Flooding
3Grounding
4Collision
5Fire
6Capsizing
7List
8Stranded
9Loss of Stability
10Operational Accident
Table A3. Code of minimum crew members’ requirement.
CodeDenomination
One ship involvedTwo ships involved
1Meets-
2Do not meet-
3-One does not meet
4-Two do not meet
5-Two meet
Table A4. Code of visibility level.
CodeVisibility Level
1Very Bad (less than 1000 m)
2Bad (between 1000 m and 2 nautical miles)
3Moderate (between 2 nautical miles and 5 nautical miles)
4Good (more than 5 nautical miles)
Table A5. Code of time period in which the accident occurs.
CodePeriod of Time
1Day
2Night
Table A6. Code of human factor influence.
CodeHuman Factor Conditions
1Human factor influences the accident
2Human factor does not influence the accident
3Doubtful
Table A7. Code of wind velocity in accordance with the Beaufort scale.
Wind Force (Code)DenominationVelocity
(km/h)Knots
0Calm0–2Till 1
1Light air2–61–3
2Light breeze7–114–6
3Gentle breeze12–197–10
4Moderate breeze20–2911–16
5Fresh breeze30–3917–21
6Strong breeze40–5022–27
7High wind51–6128–33
8Gale62–7424–40
9Strong gale75–8741–47
10Storm88–10148–55
11Violent storm102–10756–63
12Hurricane force>118>64
Table A8. Code of sea conditions in accordance with the Douglas scale.
Sea Conditions (Code)Douglas ScaleWave HeightBeaufort Scale
(m)(ft)
0Calm (Glassy)No wave0
1Calm (rippled)0–0.100.00–0.331–2
2Smooth0.10–0.500.33–1.643
3Slight0.50–1.251.6–4.14
4Moderate1.25–2.504.1–8.25
5Rough2.50–4.008.2–13.16
6Very rough4.00–6.0013.1–19.77
7High6.00–9.0019.7–29.58–9
8Very high9.00–14.0029.5–45.910–11
9Phenomenal14.00+45.9+12

Appendix B. Results

Table A9. Identification of the accidents that can be identified as different to each other (columns) employing Ship type as dependent variable.
a1a2a3a4a5a6a8a10
a1 0.1870.0240.3160.4770.2930.4130.450
a20.000 0.8710.0000.0000.2060.0880.319
a30.8260.595 0.7310.7800.8800.7310.731
a40.3190.0301.000 0.1770.0740.0920.062
a50.0550.0010.9180.016 0.0130.0000.013
a60.0180.0000.8380.0230.009 0.0000.006
a80.0000.0000.7620.0000.0000.000 0.004
a100.0000.0010.7890.0010.0000.0170.002
Table A10. Identification of the accidents that can be identified as different to each other (columns) employing year of construction as dependent variable.
a1a2a3a4a5a6a8a10
a1 0.2120.0000.0000.0000.0000.0000.000
a20.005 0.0000.0000.0000.0060.0000.000
a30.0210.485 0.0000.0560.0210.021
a40.2980.1390.000 0.0200.2980.0370.139
a50.0010.0690.0000.000 0.0010.0000.003
a60.0060.0550.0000.0000.000 0.0000.000
a80.0000.0280.0000.0000.0000.000 0.000
a100.0000.0000.0000.0000.0020.0000.000
Table A11. Identification of the accidents that can be identified as different to each other (columns) employing sea conditions as dependent variable.
a1a2a3a4a5a6a8a10
a1 0.6660.6460.6130.0320.0660.2350.58
a20.469 0.7310.9720.0660.8650.8350.85
a30.4410.299 0.7360.7360.1520.7360.590
a40.6430.3010.911 0.6450.6130.0150.887
a50.4940.4990.9110.022 0.1620.2400.452
a60.0070.5930.5860.0810.136 0.9320.454
a80.6870.2890.9110.2040.9170.283 0.097
a100.9210.8910.6460.9060.3540.5280.048
Table A12. Identification of the accidents that can be identified as different to each other (columns) employing night or day period as dependent variable.
a1a2a3a4a5a6a8a10
a1 0.8320.490.0750.4460.0860.3990.230
a20.832 0.2180.5810.6320.6060.5960.192
a30.2111 0.1600.0630.1600.0630.141
a40.7590.2830.027 0.0050.0070.0050.007
a50.4830.3500.0040.000 0.0000.0000.000
a60.0890.4430.0010.0000.000 0.0000.000
a80.4820.4630.0000.0000.0000.000 0.000
a100.1870.6380.0000.0000.0000.0000.000
Table A13. Identification of the accidents that can be identified as different to each other (columns) employing visibility as dependent variable.
a1a2a3a4a5a6a8a10
a1 0.299 0.6450.630.6770.6770.533
a20.859 0.4490.4590.8810.7790.343
a3 0.000 0.0000.0000.000
a40.6450.673 0.0000.7580.796
a50.8660.882 0.000 0.0540.8860.790
a60.6830.803 0.7520.275 0.1080.211
a80.7330.772 0.3240.8750.040 0.500
a100.1090.777 0.5150.5150.3510.738
Table A14. Identification of the accidents that can be identified as different to each other (columns) employing length as dependent variable.
a1a2a3a4a5a6a8a10
a1 0.4240.0000.0000.0000.9000.0000.000
a20.000 0.0000.0000.0000.0340.1130.348
a30.0000.000 0.0000.0000.9300.0000.000
a40.0000.0000.000 0.0000.1780.0000.000
a50.0000.1600.0000.000 0.3770.0000.000
a60.0000.2470.0000.0000.000 0.0000.000
a80.0000.1060.0000.0000.0000.345 0.352
a100.0000.1440.0000.0000.0000.6800.142
Table A15. Identification of the accidents that can be identified as different to each other (columns) employing minimum crew members as dependent variable.
a1a2a3a4a5a6a8a10
a1 0.0250.0520.180.0030.0030.0020.001
a20.031 0.3140.0090.2260.2270.4010.346
a30.1440.257 0.0410.460.0410.0090.009
a40.0010.0020.26 0.0010.0010.0010.000
a50.0000.0940.0040.000 0.0000.0000.000
a60.0000.0910.0040.0000.000 0.0000.000
a80.0000.1820.0000.0000.0000.000 0.000
a100.0000.1520.0000.0000.0000.0000.000
Table A16. Identification of the accidents that can be identified as different to each other (columns) employing human factor as dependent variable.
a1a2a3a4a5a6a8a10
a1 0.0000.0000.0000.000 0.0000.000
a2 0.1570.4970.1091.0000.3180.396
a3 0.354 0.6330.650 0.818
a4 0.5280.633 0.477 0.285
a5 0.2531.0000.939 0.2870.630
a6 0.2590.0000.0000.000 0.7420.768
a8 0.4620.0000.0000.5220.742 0.467
a10 0.4460.5060.9390.6300.5000.365

References

  1. Awal, Z.I.; Kazuhiko, H. A Study on Accident Theories and Application to Maritime Accidents. Procedia Eng. 2017, 194, 298–306. [Google Scholar] [CrossRef]
  2. Perrow, C. Normal Accidents: Living with High-Risk Technologies; Princeton University Press: New York, NY, USA, 1984; pp. 1–464. [Google Scholar]
  3. Allianz. Safety and Shipping 1912–2012 from Titanic to Costa Concordia. 2012. Available online: https://www.agcs.allianz.com/content/dam/onemarketing/agcs/agcs/reports/AGCS-Safety-Shipping-Review-2012.pdf (accessed on 23 September 2020).
  4. AISM—IALA. IALA Recommendation O-134. on the IALA Risk Management Tool for Ports and Restricted Waterways, 2nd ed.; AISM—IALA: Saint Germain in Laye, France, 2009; Available online: https://www.iala-aism.org/content/uploads/2016/07/o_134_ed2_iala_risk_management_tool_for_ports_and_restricted_waterways_may2009.pdf (accessed on 14 September 2020).
  5. Friis-Hansen, P. IWRAP MKII Working Document: Basic Modelling Principles for Prediction of Collision and Grounding Frequencies. Technical University of Denmark. 2008. Available online: https://www.iala-aism.org/wiki/iwrap/images/2/2b/IWRAP_Theory.pdf (accessed on 13 September 2020).
  6. Fujii, Y.; Yamanouchi, H.; Mizuki, N. Some Factors Affecting the Frequency of Accidents in Marine Traffic. II: The probability of Stranding, III: The Effect of Darkness on the Probability of Stranding. J. Navig. 1974, 27, 235–252. [Google Scholar]
  7. Hollnagel, E.; Goteman, Ö. The Functional Resonance Accident Model. 2004, pp. 155–161. Available online: https://pdfs.semanticscholar.org/a538/fc4f7c5ebd7c083aa8474786f6886300251f.pdf?_ga=2.92429917.1335224137.1599928060-2025622813.1598193688. (accessed on 10 September 2020).
  8. Hanzu-Pazara, R.; Barsan, E.; Arsenie, P.; Chiotoriou, L.; Raicu, G. Reducing of maritime accidents caused by human factors using simulators in training process. J. Marit. Res. 2008, 5, 3–18. [Google Scholar]
  9. Youn, I.-H.; Park, D.-J.; Yim, J.-B. Analysis of lookout activity in a simulated environment to investigate maritime accidents caused by human error. Appl. Sci. 2019, 9, 4. [Google Scholar] [CrossRef] [Green Version]
  10. Liu, Z.; Zhang, Y.; Yu, X.; Yuan, C. Unmanned surface vehicles: An Overview of Developments and Challenges. Annu. Rev. Control. 2016, 41, 71–93. [Google Scholar] [CrossRef]
  11. Statheros, T. Autonomous Ship Collision Avoidance Navigation Concepts, Technologies and Techniques. J. Navig. 2008, 61, 129–142. [Google Scholar] [CrossRef] [Green Version]
  12. Awal, Z.I.; Islam, M.R.; Baree, M.S. Development of a mathematical model for analysis on ship collision dynamics. In Proceeding of the International Conference on Mechanical Engineering, Dhaka, Bangladesh, 29–31 December 2007. [Google Scholar]
  13. Liu, C.P.; Ching-Wu, C.; Gin-Shuh, L.; Su, Y. Establishing marine accident classification: A case study in Taiwan. J. East. Asia Soc. Transp. Stud. 2005, 6, 952–967. [Google Scholar] [CrossRef]
  14. Ulusçu, O.S.; Özbaç, B.; Altiok, T.; Or, I. Risk analysis of the vessel traffic in the Strait of Istanbul. Risk Anal. 2009, 29, 1454–1472. [Google Scholar] [CrossRef]
  15. Jensen, O.C.; Petursdottir, G.; Holmen, I.M.; Abrahamsen, A.; Lincoln, J. A review of fatal accident incidence rate trends in fishing. Int. Marit. Health 2014, 65, 47–52. [Google Scholar] [CrossRef] [Green Version]
  16. Håvold, J.I. Safety culture aboard fishing vessels. Saf. Sci. 2010, 48, 1054–1061. [Google Scholar] [CrossRef]
  17. Alvite-Castro, J.; Orosa, J.A.; Vergara, D.; Costa, A.M.; Bouzón, R. A new design criterion to improve the intact stability of Galician small fishing vessels. J. Mar. Sci. Eng. 2020, 8, 499. [Google Scholar] [CrossRef]
  18. Ozguc, O. Structural damage of ship-FPSO collisions. J. Mar. Eng. Technol. 2019, 18, 1–35. [Google Scholar] [CrossRef]
  19. Wang, J.; Pillay, A.; Kwon, Y.; Wall, A.; Loughran, C. An analysis of fishing vessel accidents. Accid. Anal. Prev. 2005, 37, 1019–1024. [Google Scholar] [CrossRef] [PubMed]
  20. Laursen, L.H.; Hansen, H.L.; Jensen, O.C. Fatal occupational accidents in Danish fishing vessels 1989–2005. Int. J. Inj. Control Saf. Promot. 2008, 15, 109–117. [Google Scholar] [CrossRef] [PubMed] [Green Version]
  21. Jin, D.; Kite-Powell, H.L.; Thunberg, E.; Solow, A.R.; Talley, W.K. A model of fishing vessel accident probability. J. Saf. Res. 2002, 33, 497–510. [Google Scholar] [CrossRef]
  22. Davis, B.; Colbourne, B.; Molyneux, D. Analysis of fishing vessel capsizing causes and links to operator stability training. Saf. Sci. 2019, 118, 355–363. [Google Scholar] [CrossRef]
  23. Pitman, S.J.; Wright, M.; Hocken, R. An analysis of lifejacket wear, environmental factors, and casualty activity on marine accident fatality rates. Saf. Sci. 2019, 111, 234–242. [Google Scholar] [CrossRef] [Green Version]
  24. Jin, D.; Thunberg, E. An analysis of fishing vessel accidents in fishing areas off the northeastern United States. Saf. Sci. 2005, 43, 523–540. [Google Scholar] [CrossRef] [Green Version]
  25. Jin, D. The determinants of fishing vessel accident severity. Accid. Anal. Prev. 2014, 66, 1–7. [Google Scholar] [CrossRef]
  26. Talley, W.K.; Jin, D.; Kite-Powell, H. Determinants of the damage costand injury severity of ferry vessel accidents. WMU J. Marit. Aff. 2008, 7, 175–188. [Google Scholar] [CrossRef]
  27. Mullai, A.; Pulasson, U. A grounded theory model for analysis of marine accidents. Accid. Anal. Prev. 2011, 43, 1590–1603. [Google Scholar] [CrossRef] [PubMed] [Green Version]
  28. Chen, D.; Pei, Y.; Xia, Q. Research on human factors cause chain of ship accidents based on multidimensional association rules. Ocean Eng. 2020, 218, 107717. [Google Scholar] [CrossRef]
  29. Batalden, B.M.; Sydnes, A.K. What causes ‘very serious’ maritime accidents? Saf. Reliab. Theory Appl. 2017, 3067–3074. [Google Scholar] [CrossRef]
  30. Hu, S.; Li, Z.; Xi, Y.; Gu, X.; Zhang, X. Path Analysis of Causal Factors Influencing Marine Traffic Accident via Structural Equation Numerical Modeling. J. Mar. Sci. Eng. 2019, 7, 96. [Google Scholar] [CrossRef] [Green Version]
  31. Azaheri, A.; Montewka, J.; Kujala, P. Towards and evidence-based probabilistic risk model for ship-grounding accidents. Saf. Sci. 2016, 86, 195–210. [Google Scholar] [CrossRef]
  32. Uğurlu, F.; Yıldız, S.; Boran, M.; Uğurlu, Ö.; Wang, J. Analysis of fishing vessel accidents with Bayesian network and Chi-square methods. Ocean Eng. 2020, 198, 106956. [Google Scholar] [CrossRef]
  33. Spanish Commission for Investigation of Maritime Accidents and Incidents, CIAIM. Available online: https://www.mitma.gob.es/organos-colegiados/ciaim (accessed on 20 August 2020).
  34. SPSS v.22. Available online: https://www.ibm.com/es-es/analytics/spss-statistics-software. (accessed on 26 January 2021).
  35. Minitab v18. Available online: https://www.minitab.com/es-mx/. (accessed on 5 September 2020).
  36. Mansour Youssef, S.A.; Paik, J.K. Hazard identification and scenario selection of ship grounding accidents. Ocean Eng. 2018, 153, 242–255. [Google Scholar] [CrossRef]
  37. Chen, P.; Mou, J.; van Gelder, P.H.A.J.M. Integration of individual encounter information into causation probability modelling of ship collision accidents. Saf. Sci. 2019, 120, 636–651. [Google Scholar] [CrossRef]
  38. Chen, P.; Huang, Y.; Mou, J.; van Gelder, P.H.A.J.M. Probabilistic risk analysis for ship-ship collision: State-of-the-art. Saf. Sci. 2019, 117, 108–122. [Google Scholar] [CrossRef]
Figure 1. Proposed methodology.
Jmse 09 00192 g001
Figure 2. Construction year histogram.
Jmse 09 00192 g002
Figure 3. Ship length histogram.
Jmse 09 00192 g003
Figure 4. Ship type histogram.
Jmse 09 00192 g004
Figure 5. The initial probability of each different type of accident.
Jmse 09 00192 g005
Table 1. Linear correlation analysis.
STTACYWDWFSCVNLBGTCACMMNC
ST1.00
TA−0.021.00
CY0.000.221.00
WD0.02−0.02−0.021.00
WF0.130.020.12−0.041.00
SC0.06−0.010.12−0.050.771.00
V−0.01−0.11−0.03−0.12−0.04−0.051.00
N0.04−0.070.010.15−0.12−0.080.081.00
L0.000.090.180.020.140.21−0.04−0.121.00
B0.080.080.200.040.150.18−0.05−0.100.951.00
Gt−0.090.080.120.030.030.150.01−0.090.790.711.00
CA−0.08−0.16−0.140.020.000.080.11−0.09−0.01−0.020.011.00
CM−0.120.040.120.040.070.10−0.04−0.060.780.770.590.021.00
MNC0.10−0.460.070.00−0.14−0.210.020.09−0.020.00−0.06−0.17−0.041.00
ST: Type of ship, TA: Type of accident; CY: Year of build; WD: Wind direction; WF: Wind force; SC: Sea condition; V: Visibility; N: Nocturnal; L: Length; B: Breadth; GT: Gross Tonnage; CA: Cause of accidents (Human factor); CM: Crewmembers; MNC: Minimum number of crew members.
Table 2. Identification of related variables with accidents (significance).
Type of ShipST0.007
Year of build (years)CY0.002
Wind direction (degree)WD0.519
Wind forceWF0.107
Sea conditionSC0.014
NocturnalN0.000
VisibilityV0.007
Breadth (m)B0.979
Length (m)L0.002
Cause of accidents (Human factor)CA0.002
GT (tonnes)GT0.107
Crew membersCM0.438
Minimum number of crew membersMNC0.033
Table 3. Identification of variables related with the cause of the accident (significance).
Year of build0.290
Breadth (B)0.568
Gt (tons)0.000
Crew members0.951
Minimum crew members0.563
Type of Ship0.076
Type of accident0.341
Wind direction (degree)0.286
Wind force0.000
Sea condition0.056
Visibility0.076
Night or day0.341
Length (m)0.290
Table 4. Sum up of the utility of each defined classificatory variable per each type of accident.
Classificatory VariablesIndistinguishable AccidentsDifferentiable Accidents
Ship typea1, a2, a3, a4a5, a6, a8, a10
Year of constructiona2a1, a3, a4, a5, a6, a8, a10
Sea conditionsa1, a2, a3, a4, a5, a6, a8, a10
Night or day perioda1, a2, a3a4, a5, a6, a8, a10
Visibilitya1, a2, a4, a5, a6, a8,a10a3
Vessel lengtha2, a6a1, a3, a4, a5, a8, a10
Minimum Crew membersa2a1, a3, a4, a5, a6, a8, a10
Human factora2, a3, a4, a5, a6, a8, a10a1
Table 5. Probability of each different causes once it is known the type of accident happened (Posteriori).
AccidentModelInitial Probability(%)Final Probability(%)
a1 (Contact)P (Age = Old/Accident = a1)46.0141.17
a1 (Contact)P (Age = New/Accident = a1)53.9958.83
a1 (Contact)P (Crew = Min./Accident = a1)17.1758.82
a1 (Contact)P (Crew = High/Accident = a1)82.8241.18
a1 (Contact)P (Length = Short/Accident = a1)47.8523.52
a1 (Contact)P (Length = Long/Accident = a1)52.1476.48
a4 (Operational accident)P (Age = Old/Accident = a4)46.0177.77
a4 (Operational accident)P (Age = New/Accident = a4)53.9922.23
a4 (Operational accident)P (Crew = Min./Accident = a4)17.1711.11
a4 (Operational accident)P (Crew = High/Accident = a4)82.8288.89
a4 (Operational accident)P (Length = Short/Accident = a4)47.8577.77
a4 (Operational accident)P (Length = Long/Accident = a4)52.1422.23
a10 (Collision)P (Age = Old/Accident = a10)46.0142.85
a10 (Collision)P (Age = New/Accident = a10)53.9957.15
a10 (Collision)P (Crew = Min./Accident = a10)17.1714.28
a10 (Collision)P (Crew = High/Accident = a10)82.8285.72
a10 (Collision)P (Length = Short/Accident = a10)47.8528.57
a10 (Collision)P (Length = Long/Accident = a10)52.1471.43
Table 6. Models that relate main variables.
Related VariablesModelDetermination
FACTOR (%)
SC and WFSC = 0.390 + 0.604 WF + 0.0021 WF259.12
GT, L, B and CMCM = −0.32 + 0.180 L + 0.536 B + 0.00009 GT − 0.00353 L2 − 0.101 B2 + 0.0327 L B + 0.000007 L GT + 0.000127 B GT79.15
TA, MNCTA = 7.86 − 2.07 MNC + 0.135 MNC221.18
TA, MNC, CYTA = 254 + 11.6 MNC − 0.31 CY + 0.185 MNC2 + + 0.000092 CY2 − 0.0070 MNC CY28.00
TA, CYTA = 454 − 0.50 CY + 0.000136 CY24.99
Publisher’s Note: MDPI stays neutral with regard to jurisdictional claims in published maps and institutional affiliations.